Abstract
This paper details the design, development, and evaluation of VulcanH, a computerized maintenance management system (CMMS) specialized in preventive maintenance (PM) and predictive maintenance (PdM) management for underground mobile mining equipment. Further, it aims to expand knowledge on trust in automation (TiA) for PdM as well as contribute to the literature on explainability requirements of a PdM-capable artificial intelligence (AI). This study adopted an empirical approach through the execution of user tests with nine maintenance experts from five East-Canadian mines and implemented the User Experience Questionnaire Plus (UEQ+) and the Reliance Intentions Scale (RIS) to evaluate usability and TiA, respectively. It was found that the usability and efficiency of VulcanH were satisfactory for expert users and encouraged the gradual transition from PM to PdM practices. Quantitative and qualitative results documented participants’ willingness to rely on PdM predictions as long as suitable explanations are provided. Graphical explanations covering the full spectrum of the derived data were preferred. Due to the prototypical nature of VulcanH, certain relevant aspects of maintenance planning were not considered. Researchers are encouraged to include these notions in the evaluation of future CMMS proposals. This paper suggests a harmonious integration of both preventive and predictive maintenance practices in the mining industry. It may also guide future research in PdM to select an analytical algorithm capable of supplying adequate and causal justifications for informed decision making. This study fulfills an identified need to adopt a user-centered approach in the development of CMMSs in the mining industry. Hence, both researchers and industry stakeholders may benefit from the findings.
1. Introduction
Initially introduced in the 1960s, Computerized Maintenance Management Systems (CMMSs) offered a punch-card-based approach to digitalize routine maintenance tasks. They were, however, limited to the large and profitable enterprises that could afford them. Advancements in technology throughout the subsequent decades increased CMMSs’ affordability, functional usefulness, and, incidentally, their popularity. CMMSs proved to be an indispensable tool in industries such as manufacturing, aeronautics, power, and mining. In the 2000s, CMMSs experienced another evolution, engendered by the Internet’s increasing availability. By then, these systems supported multimedia assets and Web-based communication and offered an overall improved set of functionalities and computational capabilities [1,2,3,4,5,6]. However, CMMSs offer poor decision support for equipment maintenance because of their “black-box” nature, complexity, and general lack of user-friendliness [7]. In fact, the most cited drawback of CMMSs are their “Black Hole” nature [7], meaning that, similarly to black holes, they ingest data at high rates without returning information on their decision-support capabilities. Even to this day, their usability constitutes a major hindrance to their successful integration in the maintenance workflow [8]. As a result, CMMSs are mostly used as databases to store equipment and maintenance information, and external solutions are implemented for data analysis and decision making [7,9,10]. In the mining industry, the addition of sensors on underground equipment and the installation of wireless infrastructure into the mine has introduced the Internet-of-Things (IoT) to the industry, which drives the approach of predictive maintenance (PdM) for mobile mining equipment [10]. However, available CMMSs are not equipped to handle such practices [11], and a transition to human-oriented CMMS development and design is direly needed [10].
In an earlier study, we mapped maintenance activities for underground mining equipment to discover CMMSs’ pitfalls and identify improvement avenues [10]. As a direct follow up, this paper builds on our previous findings by detailing the user-driven development and testing of VulcanH, a CMMS proof-of-concept specialized in preventive and predictive maintenance management for underground mobile mining equipment. The main contributions of our study were to evaluate the usability of the proposed CMMS prototype and to analyze the level of explainability in a PdM-capable artificial intelligence (AI).
The rest of this article is structured as follows. Section 2 reviews background knowledge on maintenance and CMMSs, usability, and trust in automation. Section 3.1 presents the developed CMMS prototype while Section 3.2 details the methodology used to conduct user tests, and Section 4 details the main results found. Section 5 puts our findings into perspective with the current state-of-the-art and Section 6 concludes the work.
2. Background and Related Work
2.1. Maintenance
Maintenance constitutes the combination of a diverse set of actions aimed at restoring or maintaining equipment into a state in which it may perform its required function [1]. Even though many types of maintenance exist [12], preventive maintenance (PM) and predictive maintenance (PdM) are the most relevant for this study. PM relies on a maintenance plan, where intervals for maintenance scheduling and execution are detailed based on predetermined equipment-related, time-related, or cost-related factors [12,13]. During maintenance execution, components are replaced or repaired regardless of their condition. On the other hand, PdM, also known as condition-based maintenance or statistical maintenance, comprises jobs dependent on equipment status [12,14]. PdM relies on wireless sensors on the equipment and an IoT infrastructure to provide consistent streams of data. Then, algorithms are used to analyze the data to predict when the equipment may require servicing. The use of machine learning or artificial intelligence (AI) to achieve this goal is most common [15], and PdM practices have already been associated with a reduction in maintenance-related costs [16,17].
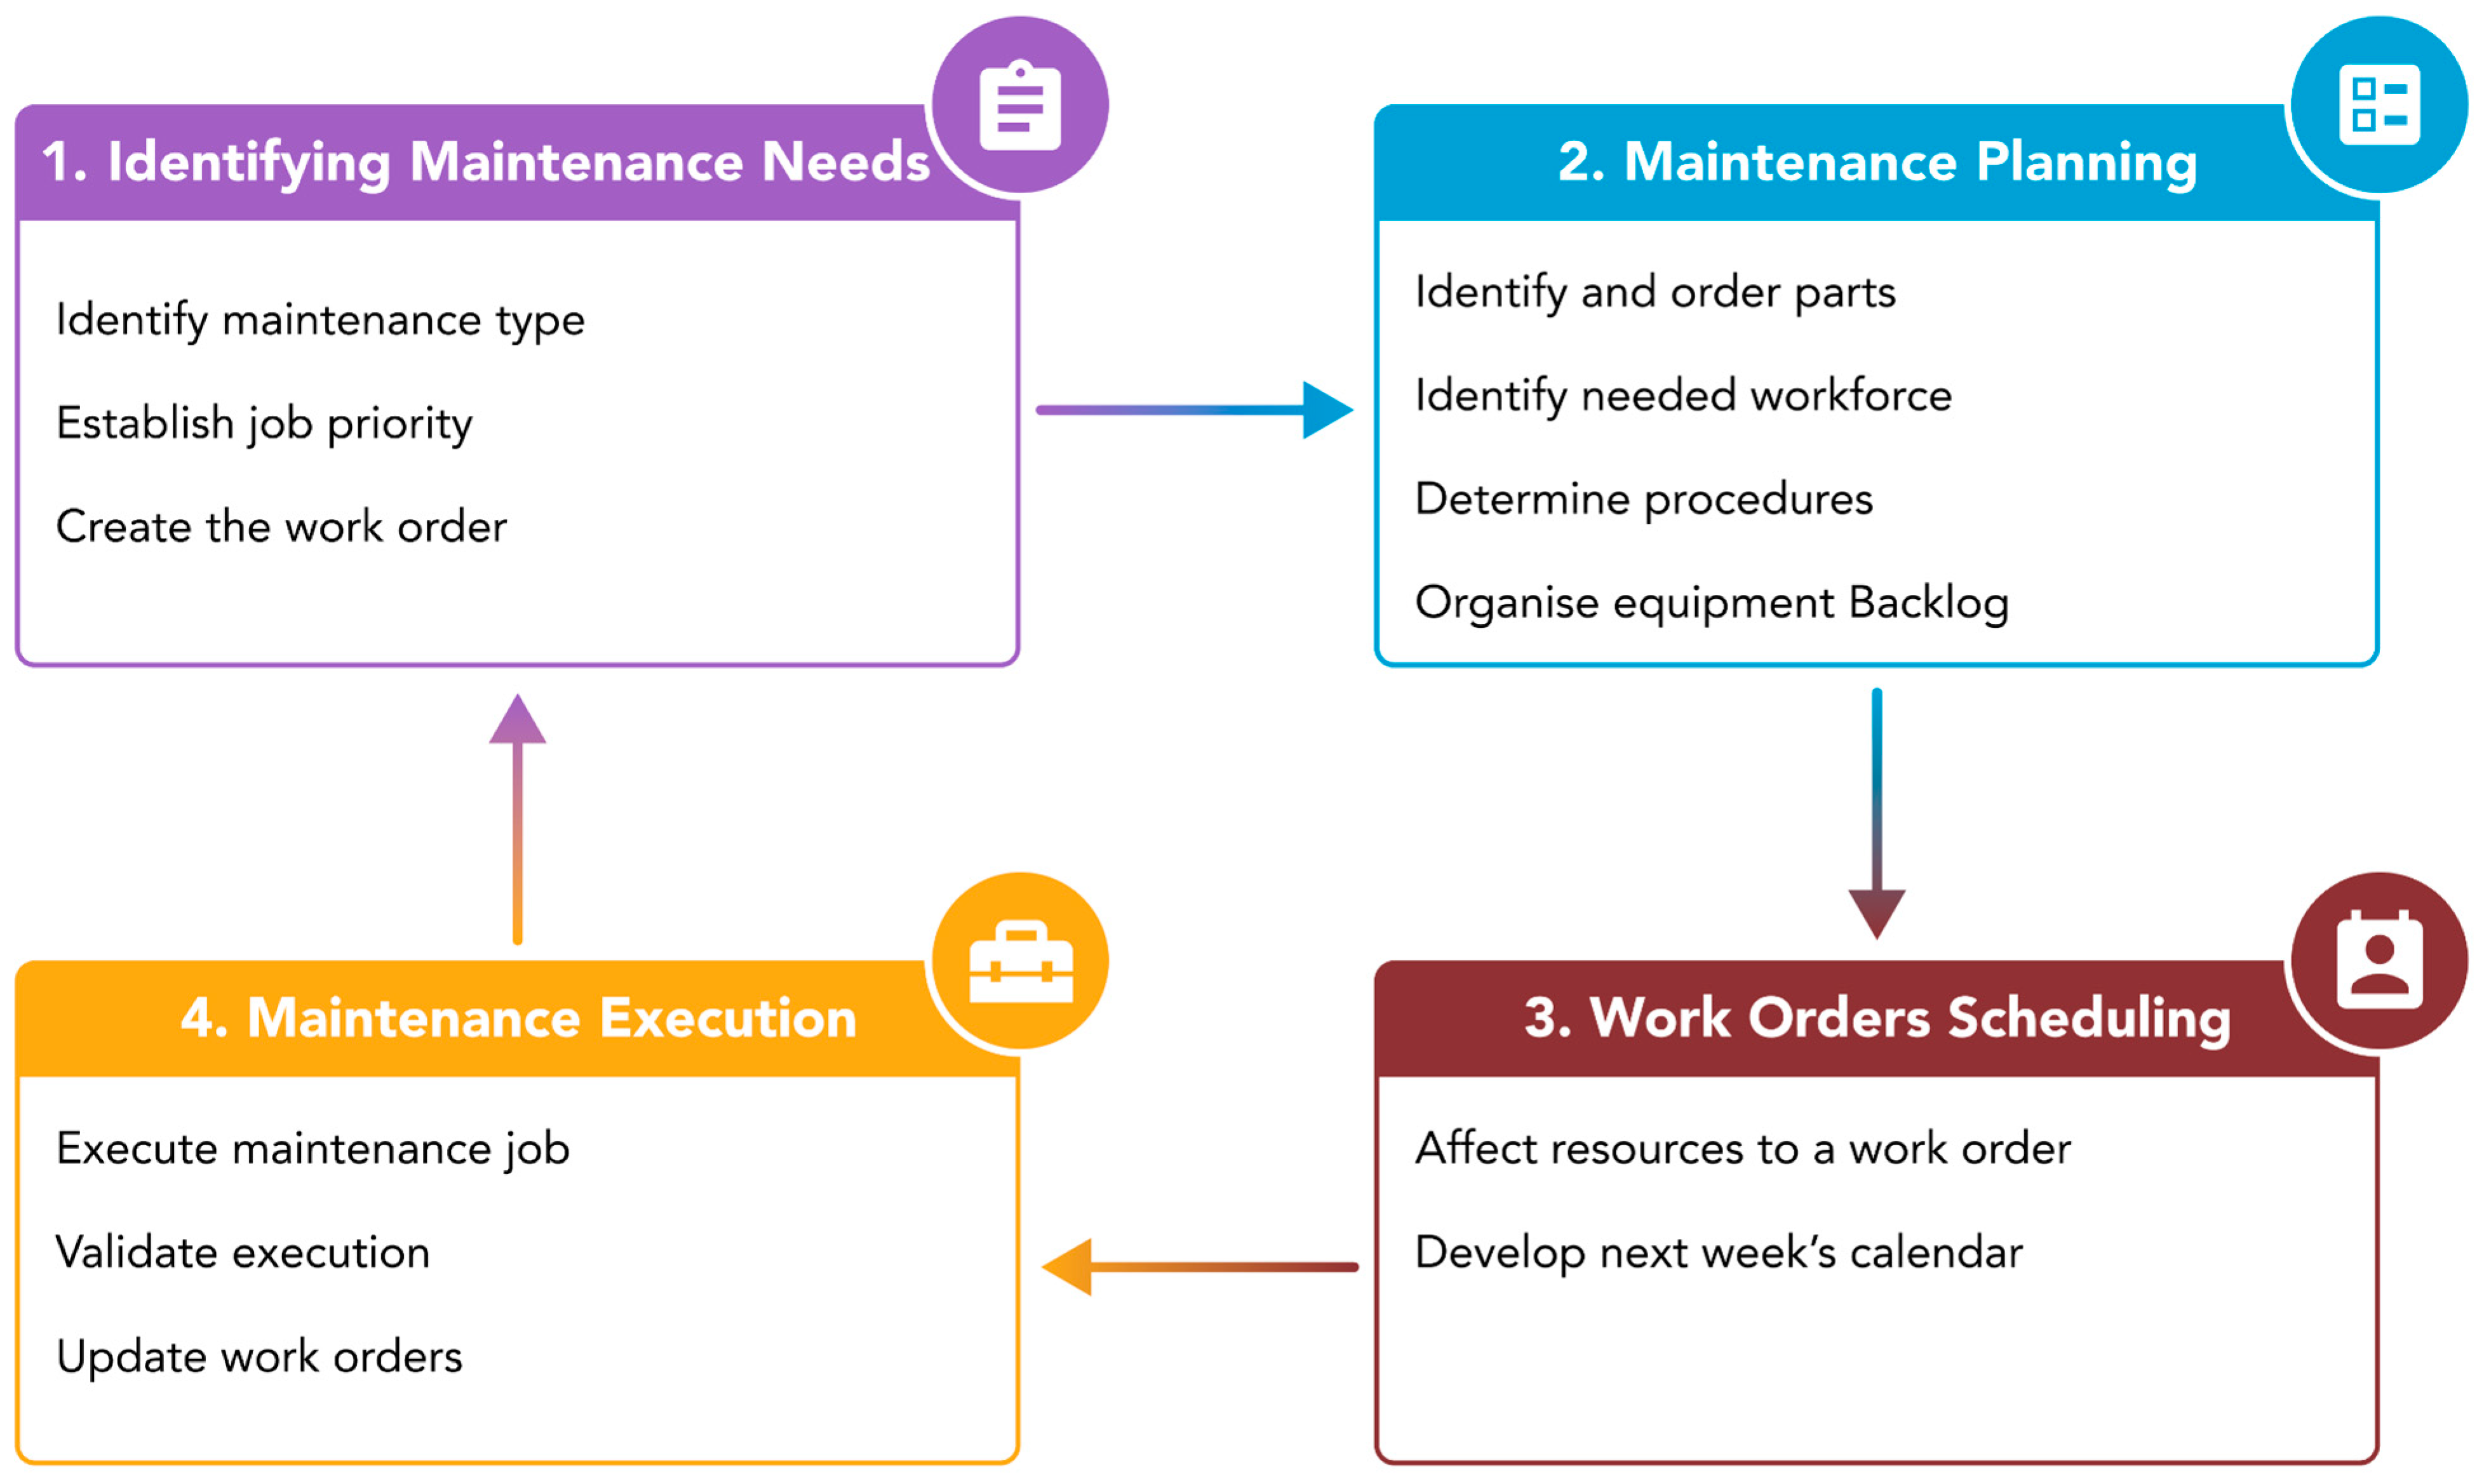
PM is the predominantly implemented type of maintenance for mechanical systems and has ensured the implementation of a constant workflow in many industries [18,19]. In the mining industry, maintenance-related costs constitute between 30% and 50% of a company’s expenditures [20,21,22]. Thus, an efficient maintenance process is crucial. The maintenance literature identifies four key steps in successful maintenance implementation (see Figure 1).
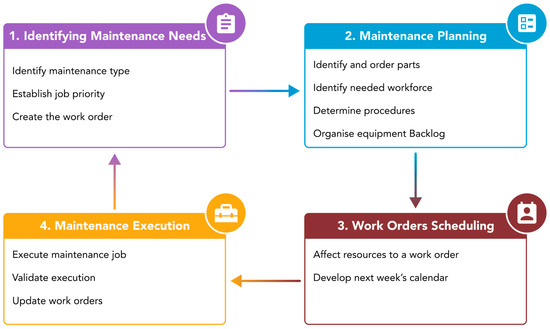
Figure 1.
Key steps of the maintenance process [10].
The first step of the process is the identification of maintenance needs. This is the process by which members of the workforce pinpoint servicing jobs needing to be executed and catalog them in a document known as a “Work order”. Work orders are the main transaction document in a maintenance process and contain useful information pertaining to the job, such as its description, its priority, the targeted equipment, and the expected date of execution. Work orders have priorities which can vary between mining companies. The second step of the maintenance process is the planning of maintenance. A maintenance planner is mainly responsible for validating the active work orders, ordering and managing required parts, and establishing the workforce needed to complete the maintenance job. In many cases, the planner is also responsible for the third step of the process: maintenance scheduling. During the scheduling phase, necessary work orders are identified by maintenance stakeholders, and the equipment in need of servicing is assigned to a garage’s bay. Assignment of individual tradesmen is generally not a concern of the planner but is, instead, performed by the general supervisor on-site. For an in-depth overview of the maintenance management process in East-Canadian mines, see [10].
Once the job is executed, the tracking of maintenance Key Performance Indicators (KPIs) is an essential step to ensure continuous improvement of the maintenance process. A 2006 study queried 12 mines and compiled a list of maintenance KPIs, most of which are still relevant to this day [23]:
- Equipment usage;
- Equipment availability;
- Mean time to repair (MTTR);
- Maintenance rate;
- Mean time between failures (MTBF);
- Etc.
With the digitalization of mining operations, work orders, calendars, maintenance information, KPIs, and more are stored in specialized software known as a CMMS.
CMMS
A CMMS is a collection of integrated programs aimed at assisting with maintenance management activities [24]. While there is no explicit standard on CMMS functional requirements, the maintenance literature commonly identifies their most-expected features [12,24]:
- Manage the company’s assets;
- Provide a level of automation for jobs and inventory management;
- Manage human resources;
- Manage maintenance transaction data such as work orders;
- Handle accounting and finance;
- Control and schedule PM routines;
- Manage data for process improvement (reliability analysis);
- Integrate with other systems.
Of the listed features, however, only those related to data management are generally implemented by most CMMS providers, leaving control for scheduling and maintenance decision support to the buyer [7]. Hence, CMMSs’ main purpose being that of a database. A concrete example can be studied from an underground mine in Québec, Canada, where three custom software solutions were developed, besides the CMMS, to satisfy their maintenance needs [10]. Different in-house tools were needed to collect equipment data for reliability analysis, to generate reports from real-time equipment data streams, and to create and update the maintenance schedule. The creation of custom scripts to fulfill specific maintenance needs serves as an indicator of the disconnect between maintenance service providers and the users of these systems [7]. In fact, a study benchmarking CMMS development noticed how CMMSs were not able to adequately support both PM and PdM [11]. Therefore, a human-oriented approach is greatly needed to optimize CMMSs’ usage for current PM practices and future PdM approaches. Usability evaluation constitutes a crucial step in the application of a human-oriented approach.
2.2. Usability Evaluation
Usability is defined in ISO 9241-210 as the “extent to which a system, product or service can be used by specified users to achieve specified goals with effectiveness, efficiency and satisfaction in a specified context of use” [25]. Multiple means to evaluate subjective usability have been proposed in the past. The most popular methods include the System Usability Scale (SUS) [26,27], Computer System Usability Questionnaire (CSUQ) [28], Usability Metric for User Experience (UMUX) and its variants [29,30], and the User Experience Questionnaire (UEQ) [31]. These standard evaluation methods evaluate usability by leveraging a predetermined list of scales and propose a standardized result which allows for a facilitated analysis and comparison with the existing literature. However, such methods are not specific to a particular research context and may not be suitable for the objectives of a particular study [32]. To solve this problem, the authors of [32] have developed a modular extension of the UEQ, known as the UEQ+. Like the UEQ, each UEQ+ scale contains four Likert items that analyze the user’s perception of the scale’s prominence in the tested product. This method allows researchers to construct a custom questionnaire that concentrates on aspects that users consider important without sacrificing clarity or concision. A key performance indicator (KPI) is calculated to obtain a score for the final usability of the product and to display users’ overall satisfaction. Unfortunately, due to the UEQ+’s novelty and modular design, no benchmarks have been established at the time of writing. Nevertheless, the UEQ+’s authors stipulate that it may be possible to develop KPI benchmarks that are independent of the selected scales [32].
When it comes to complex systems, ease-of-use and usefulness have been studied more extensively [33] but are incomplete when conducting a proper and detailed evaluation of these systems [34]. Adequacy, adaptability, and core-task orientedness were highlighted as the basis of the usability evaluation technique proposed by [35]. Studies that analyzed the usability of complex systems often used SUS [36,37,38] or implemented a custom questionnaire [39]. However, their usability evaluations are limited to the overall SUS score (or the respective custom score) and its benchmark interpretation. We believe that the use of the UEQ+ will allow for a more in-depth analysis of usability results and that it is the best fit due to the comparative nature of our study [32].
Usability Evaluation of CMMS
CMMS usability issues are well documented in research. In a 2014 study, 10 industry experts were interviewed to document CMMS usability issues and a list of seven pitfalls of CMMSs was compiled: hard-to-access documentation; incompatibility with other systems; lack of input automation; unintuitive User Interface (UI); lack of guidance; poor decision support; and high complexity [40]. Interestingly, even though the interviewed experts worked in different industries and used different CMMSs, the usability issues mentioned were similar amongst the respondents. Similarly, ref. [41] surveyed 133 maintenance personnel in the petrochemical industry and recorded a feeling of dissatisfaction about the CMMS used. Results from [8,42,43,44] further affirm the unacceptable level of usability in current CMMSs. CMMSs are regarded among operators as systems that rarely provide value to the company and, in some cases, even hinder efficiency and productivity [45,46,47].
2.3. Trust in Automation
Practices in PdM require that the expert user relies on an automated system. Whether it be in the selection of an automatically generated schedule or in the review of automatically generated and prioritized work orders, automation plays an essential role in PdM. However, most CMMSs lack transparency when it comes to exploring and understanding the system’s decisions and are most often regarded as “black boxes” [7]. In the handbook “Aviation”, the author expresses how the opaque or “black-box” nature of a complex automated system may reduce the operator’s ability to understand its decisions [48]. This lack of understanding may lead to disuse, misuse, or even abuse of the system. In a similar fashion, [49] indicated that AI recommendations should be accompanied by the logic from which they were derived. The field of eXplainable AI (XAI) has also made a point of targeting expert users. A 2021 study showed how expert chess players would rely more in a system when explanations were provided [50]. Similarly, ref. [51] documented medical doctors’ higher trust in medical applications that offered more transparent AI suggestions. The paper stipulates that XAI may facilitate implementation of AI systems in medical-related contexts. In later studies, the same author introduced and explored the concept of “causability” where it is proposed that medical-related AI should understand the current context and offer actionable and causal explanations [52,53]. Such causal explanations are more closely related to real human-to-human or, more specifically, expert-to-expert communication and may help shift the explainability paradigm from system-oriented to human-oriented [52,54]. All in all, explanations have proven to be necessary when interacting with complex systems and constitute a means of increasing trust and reliance on automation.
Trust in automation (TiA) and its evaluation are highly active subjects in Human–Machine Interaction (HMI) research. While the exact model for trust is still being debated by researchers, the TiA community has generally adopted the model proposed by Mayer et al. in 1995 [55]. This model makes a point of differentiating between factors that cause trust, trust itself, and the consequences of trust which need to be measured collectively [56]. To enlighten researchers on means to measure trust, a recent study conducted a comprehensive narrative review and found that three types of trust-related measures were used: Self-Report, Behavioral, and Physiological [57]. Self-Report measures seemed to be the most popular method with custom scales being the most frequently used means to analyze TiA. However, it was found that custom scales rarely accounted for the trust model theory and, instead, treated trust as a single global construct [57].
Building on self-report measures, ref. [58] validated the Reliance Intentions Scale (RIS), a 10-item scale targeting the user’s intention to rely on an automated system to perform its tasks. This scale has been consistently used by researchers to evaluate TiA for unmanned ground vehicles [59], security checkpoint robots [60], and other robotic systems (i.e., refs. [60,61,62,63]). In fact, results from [64] showed that RIS is an effective and reliable way to evaluate TiA in robotic systems after comparison with other popular methods like the Trust-Perception-Scale for Human-Robot Interaction (TPS-HRI) [65] and the Multidimensional Measure of Trust (MDMT) [66]. As per its usage in complex software systems, however, this scale has yet to be applied to maintenance solutions such as CMMS and to expert participants, due to most papers having tested the scale on students (i.e., refs. [59,60,61,62]).
2.4. Synthesis and Research Objectives
Both scholarly and industrial sources indicate that PdM for mobile mining equipment is just around the corner. However, few CMMSs offer support for PdM integration and are commonly associated with an unsatisfactory user experience. Our literature review highlighted the pressing need for user-centered CMMSs whose primary concern is usability.
The nearing of PdM also implies an increased reliance on automation. Notions of TiA are therefore critical to the correct integration of PdM in the mining industry, but, at the time of writing, few papers are available on the subject. A research opportunity is therefore that of evaluating TiA in CMMSs. On this topic, this literature review has shown how the RIS may be a reliable method of evaluating TiA.
Closely coupled with trust is explainability. Our review has pointed out the link between causal explanations and increase in trust but has offered no insights on the types of explanations necessary for expert CMMS users. Hence, an opportunity arises in the study of PdM algorithms’ explainability and the level of details required.
The main objective of our study was to evaluate the usability of VulcanH, a CMMS capable of assisting the user in maintenance planning and scheduling for both PM and PdM practices. Concurrently, we analyzed the impact of PdM on the maintenance process where we hypothesized that PdM integration would not lead to a significant disruption of current PM practices. We also focused on the evaluation of experts’ TiA where we tested the RIS’s applicability to expert users’ trust towards CMMSs and the analysis of the level of details expected in PdM explanations.
3. Method
The method is separated into two sections. First, we present VulcanH and its features for maintenance planning and scheduling. Second, we present the test plan for its usability evaluation.
3.1. VulcanH
We created VulcanH for the purpose of this study and named it so in tribute to Vulcan, the Roman god of fire and inventor of smithing and metal working, and his Greek equivalent Hephaestus. It is a working prototype of a CMMS that can be customized for both PM and PdM planning and offers functions for job planning and scheduling. It was important to use the same software to alternate between PM and PdM and to obtain control on the explicability levels of optimizer functions. For portability purposes, we implemented the prototype as a Web Application operating on a browser. User requirements constituting the basis of our design choices are identified in Table A1 of Appendix A.
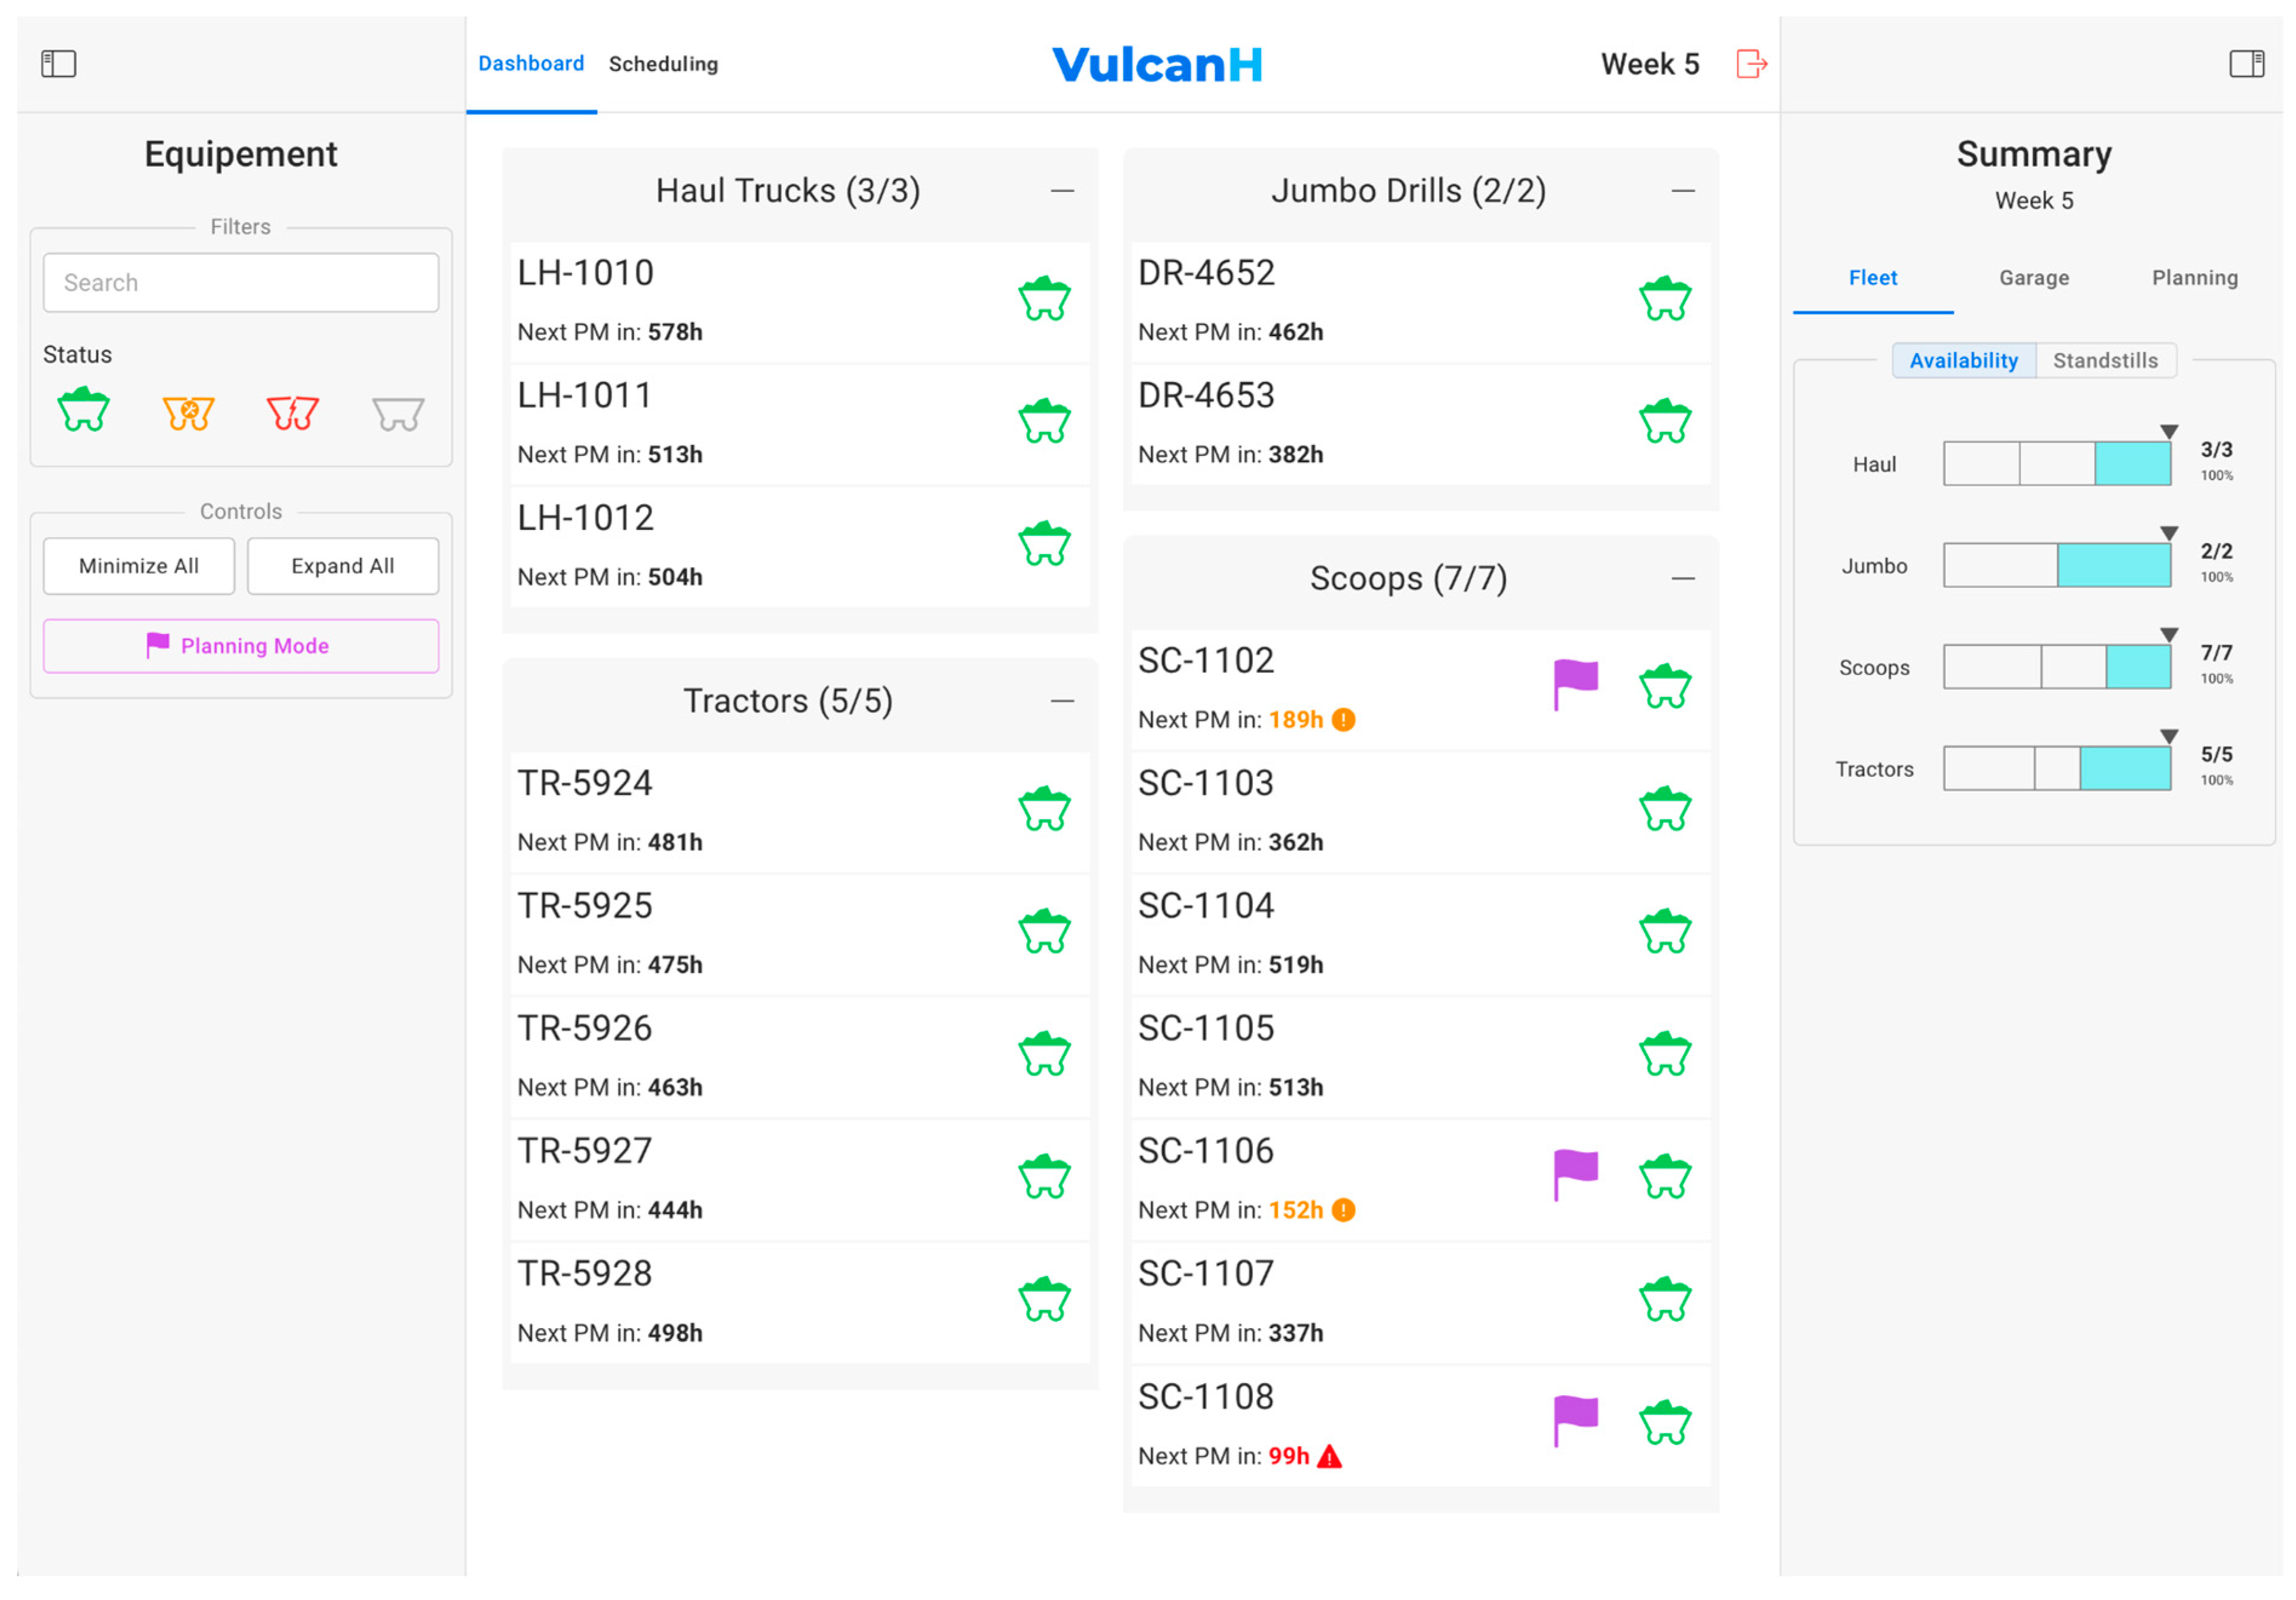
Figure 2 shows the planning dashboard whose main content offers an overview of the current state of the fleet. The right panel presents the current week’s KPIs for fleet management, garage occupation and planning evaluation, with the acceptable range for each value. The left panel offers organizational actions on the equipment list, such as searching and filtering.
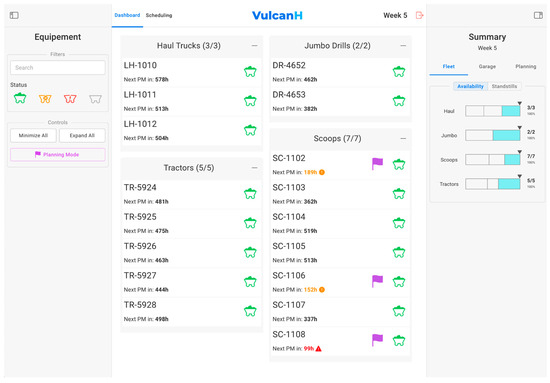
Figure 2.
Dashboard view with the list of equipment (center content) that can be filtered and flagged for maintenance (left panel). Cumulative statistic shown on the right panel.
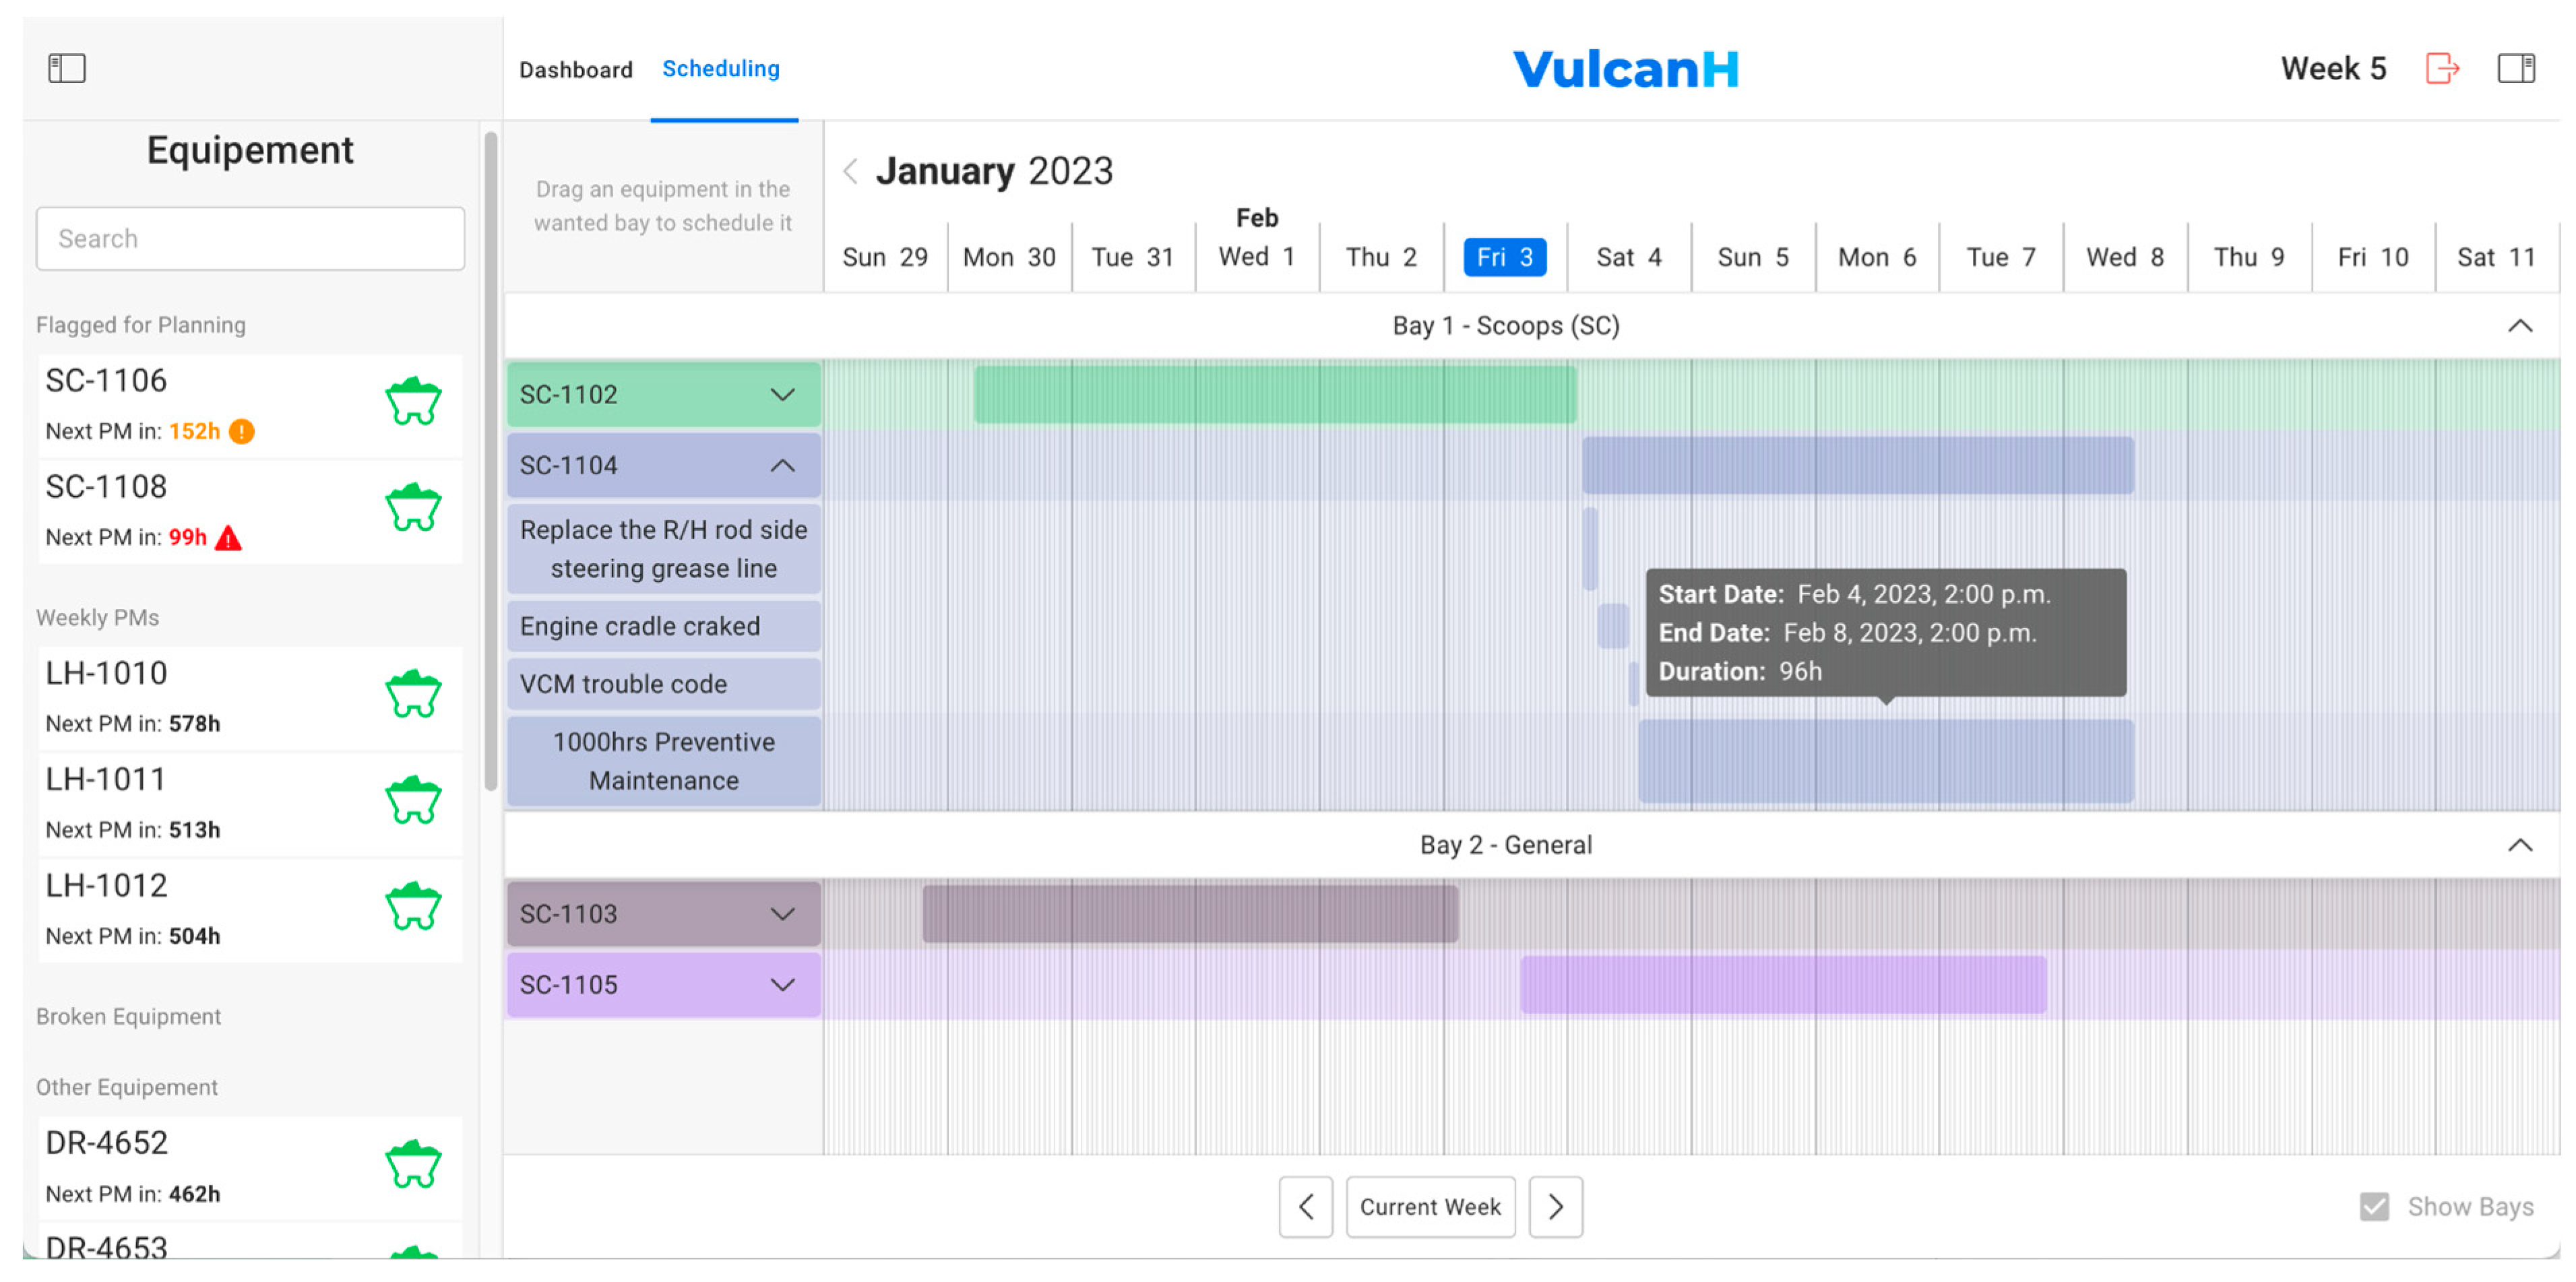
Figure 3 shows the scheduling calendar which facilitates the creation of a given week’s maintenance schedule. The most notable feature of this view is its Drag and Drop capabilities.
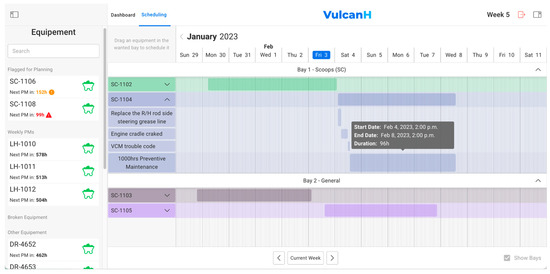
Figure 3.
Scheduling view with the interactive maintenance calendar in the center and the organized equipment list in the left panel.
All equipment is shown on the left panel which is divided into 4 sections:
- Equipment flagged for maintenance planning;
- Equipment whose preventive maintenance is expected for next week;
- Equipment with “DOWN” status;
- All other equipment.
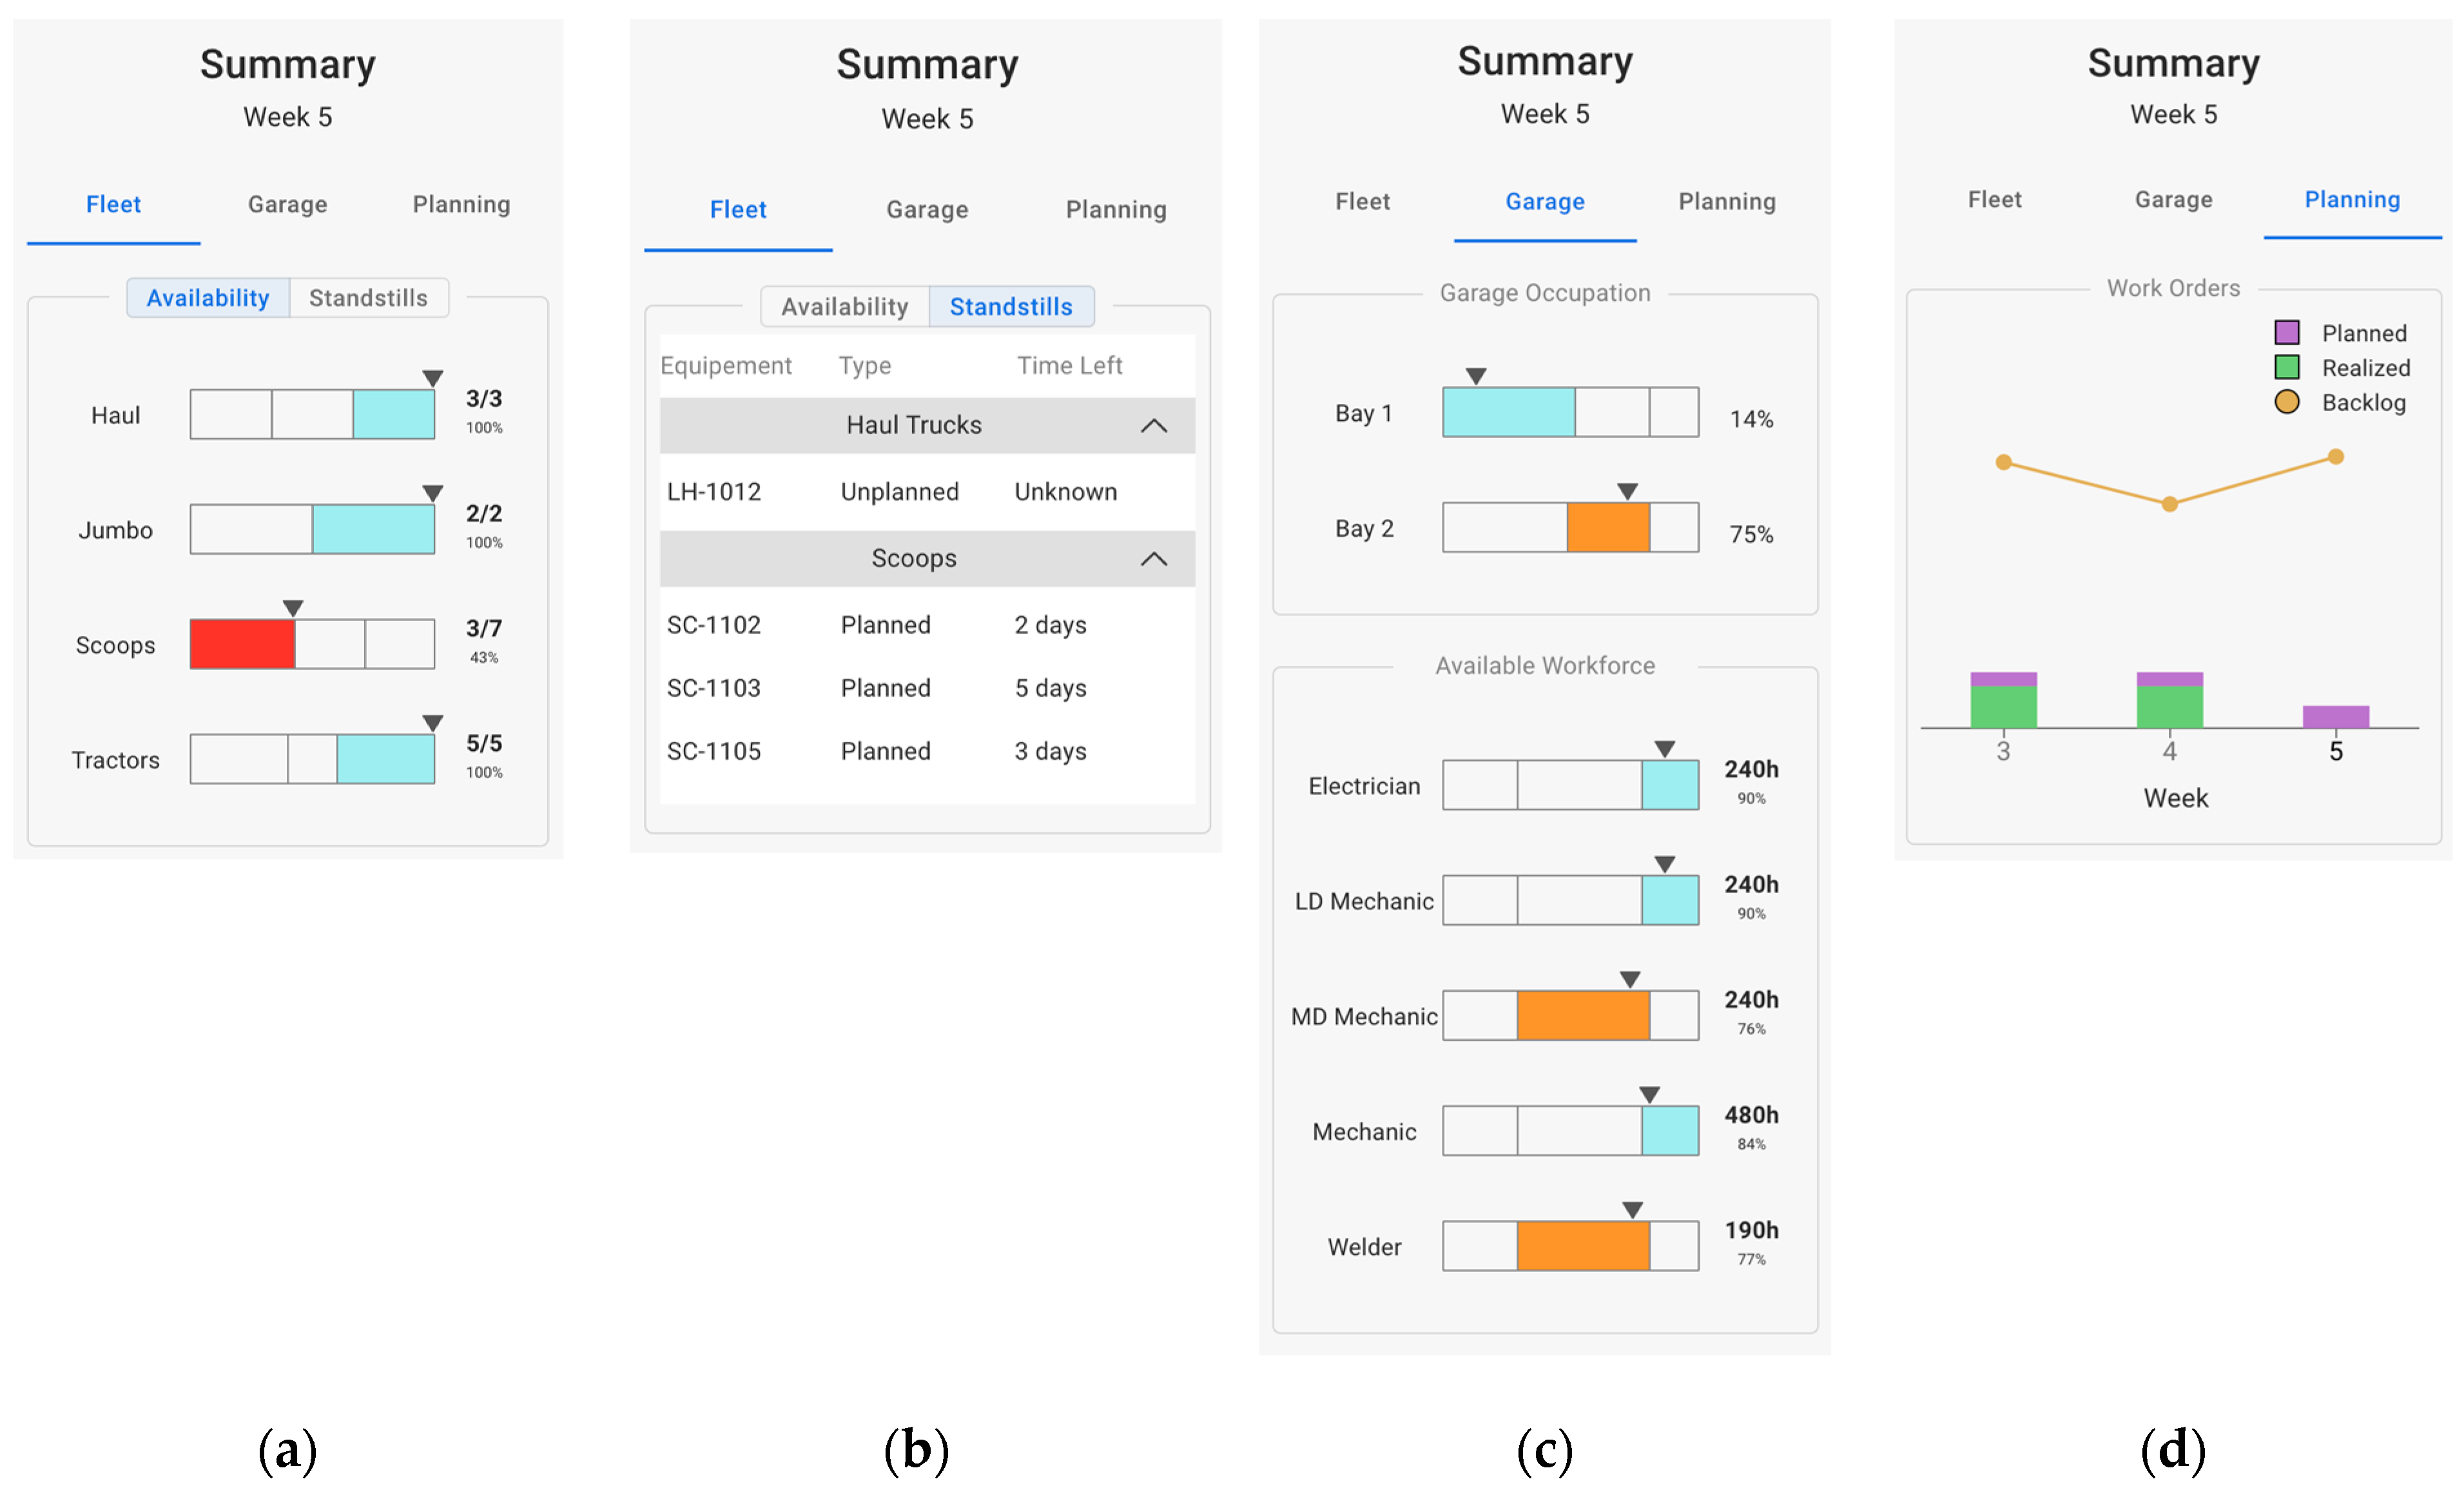
A list of maintenance KPIs is accessible from the right informational panel. The first tab (Figure 4a) presents equipment availability compared to weekly operational objectives. Also presented are types and durations of active stoppages (Figure 4b), garage information (Figure 4c), and a graphical representation of the Schedule Completion KPI (Figure 4d).
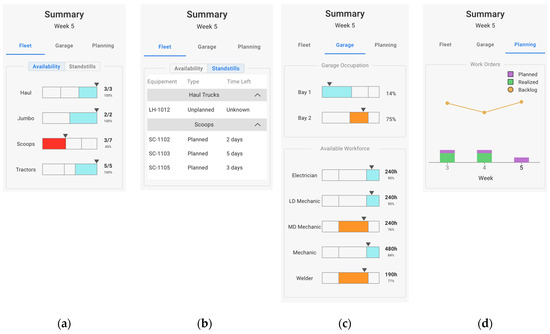
Figure 4.
Maintenance KPIs. (a) Fleet availability and objectives. (b) Equipment stoppages information. (c) Bay occupation and workforce availability. (d) Schedule Completion KPI for current and past weeks.
A variant of the prototype was created to simulate the introduction of PdM. Table 1 summarizes the changes introduced in the variant.

Table 1.
VulcanH changes due to the addition of PdM.
For more information on VulcanH and its functionalities, see Appendix B.
3.2. Usability Evaluation
3.2.1. Philosophy
Our methodology is based on ISO 9241-210:2019 [25]. The standard describes four steps in a successful implementation of human-centered design. These steps are the specification of the usage context, the designation of user requirements, the production of design solutions, and the evaluation of said solutions. The first two steps were completed in [10]. In this study, we developed VulcanH as a working prototype and evaluated its usability with expert maintenance personnel from 5 mining sites across East-Canada: LaRonde Complex (Gold, 11.9 tons, ref. [67]), Westwood (Gold, 1.1 tons, ref. [68]), and Renard (Diamond, 1.6 million carats/year, ref. [69]), one mining site in the Nunavut province: Méliadine (Gold, 12.2 tons, ref. [70]), and one open-pit site in Ontario: Côté Gold (Gold, site in construction, ref. [68]).
3.2.2. Participants
A total of 9 participants (7 male and 2 female) took part in this study. Participants’ ages were 39 years old on average, with 30 being the youngest and 50 the oldest. Most participants had more than 13 years of experience in the mining sector and their expertise was distributed as follows: 5 General Supervisors (or any supervisor role associated with maintenance), 1 Maintenance Planner, 1 Maintenance Assistant Specialist, and 2 Maintenance Data Managers. This study received the approval of Polytechnique Montréal Ethics Research Board (CER-2223-32-D), and all participants verbally agreed to an informed consent form prior to the test.
3.2.3. Materials
User tests were conducted remotely via Zoom or MS Teams, depending on participants’ preferences. The tests were recorded to facilitate notetaking throughout the test.
3.2.4. Procedure
We conducted VulcanH user tests with and without PdM. The version without PdM constituted the baseline while the version with PdM was considered as the dependent variable. The PdM analytics showcased for the dependent variable were hard-coded by leveraging a non-real-time Wizard of Oz method [71] and presented an automation system whose suggestions are reliable.
The test was divided into 4 sections. Section 1 was the demographics questionnaire asking questions related to the age of the participant, the number of years they occupied their current job, and the number of years they spent working in the mining industry.
Section 2 was the execution of two scenarios: PM or PdM planning. Participants were instructed that they needed to schedule next week’s maintenance for the loaders’ fleet from a fictitious mine composed of 17 pieces of equipment distributed as follows:
- 7 Loaders (Scoops);
- 5 Tractors;
- 3 Haul Trucks;
- 2 Jumbo Drills.
In the PM scenario, participants used VulcanH for PM planning. In this scenario, participants had to manually identify the equipment for maintenance, select its relevant work orders, and schedule the maintenance on the calendar view. It established the baseline performance for the prototype as PM is the maintenance type most implemented in mining. In the PdM scenario, participants used VulcanH for predictive maintenance planning. In this case, the predictive algorithm automatically selected the equipment for maintenance and highlighted the work orders that should be accomplished with priority. Users could review the selection and modify it, if needed. Then, the scheduler would optimize the maintenance sequence in the calendar view. Once again, users could adjust the schedule if needed.
In both scenarios, participants had a familiarization stage to introduce the different features of the CMMS. Then, they were asked to execute the same 3 tasks:
- Identify 3 Scoops for maintenance in the next week;
- Prioritize 4–5 work orders for each equipment identified for maintenance;
- Schedule the equipment into the maintenance calendar.
To prevent a learning effect, the order of presentation of the PM and PdM scenarios was inverted between participants. Work orders were shuffled between scenarios such that a user would be exposed to a different set of work orders every time.
Once the execution was completed, the participant filled out 2 questionnaires. First, was the UEQ+ for which we selected the following dimensions: Efficiency, Perspicuity (ease-of-use), Trustworthiness of Content, and Usefulness. Second, was a questionnaire adapted from the RIS [58] to evaluate trust in automation. The adapted RIS consisted of 10 questions evaluating participant’s tendency to rely on the system. The questionnaire is displayed in Appendix C.
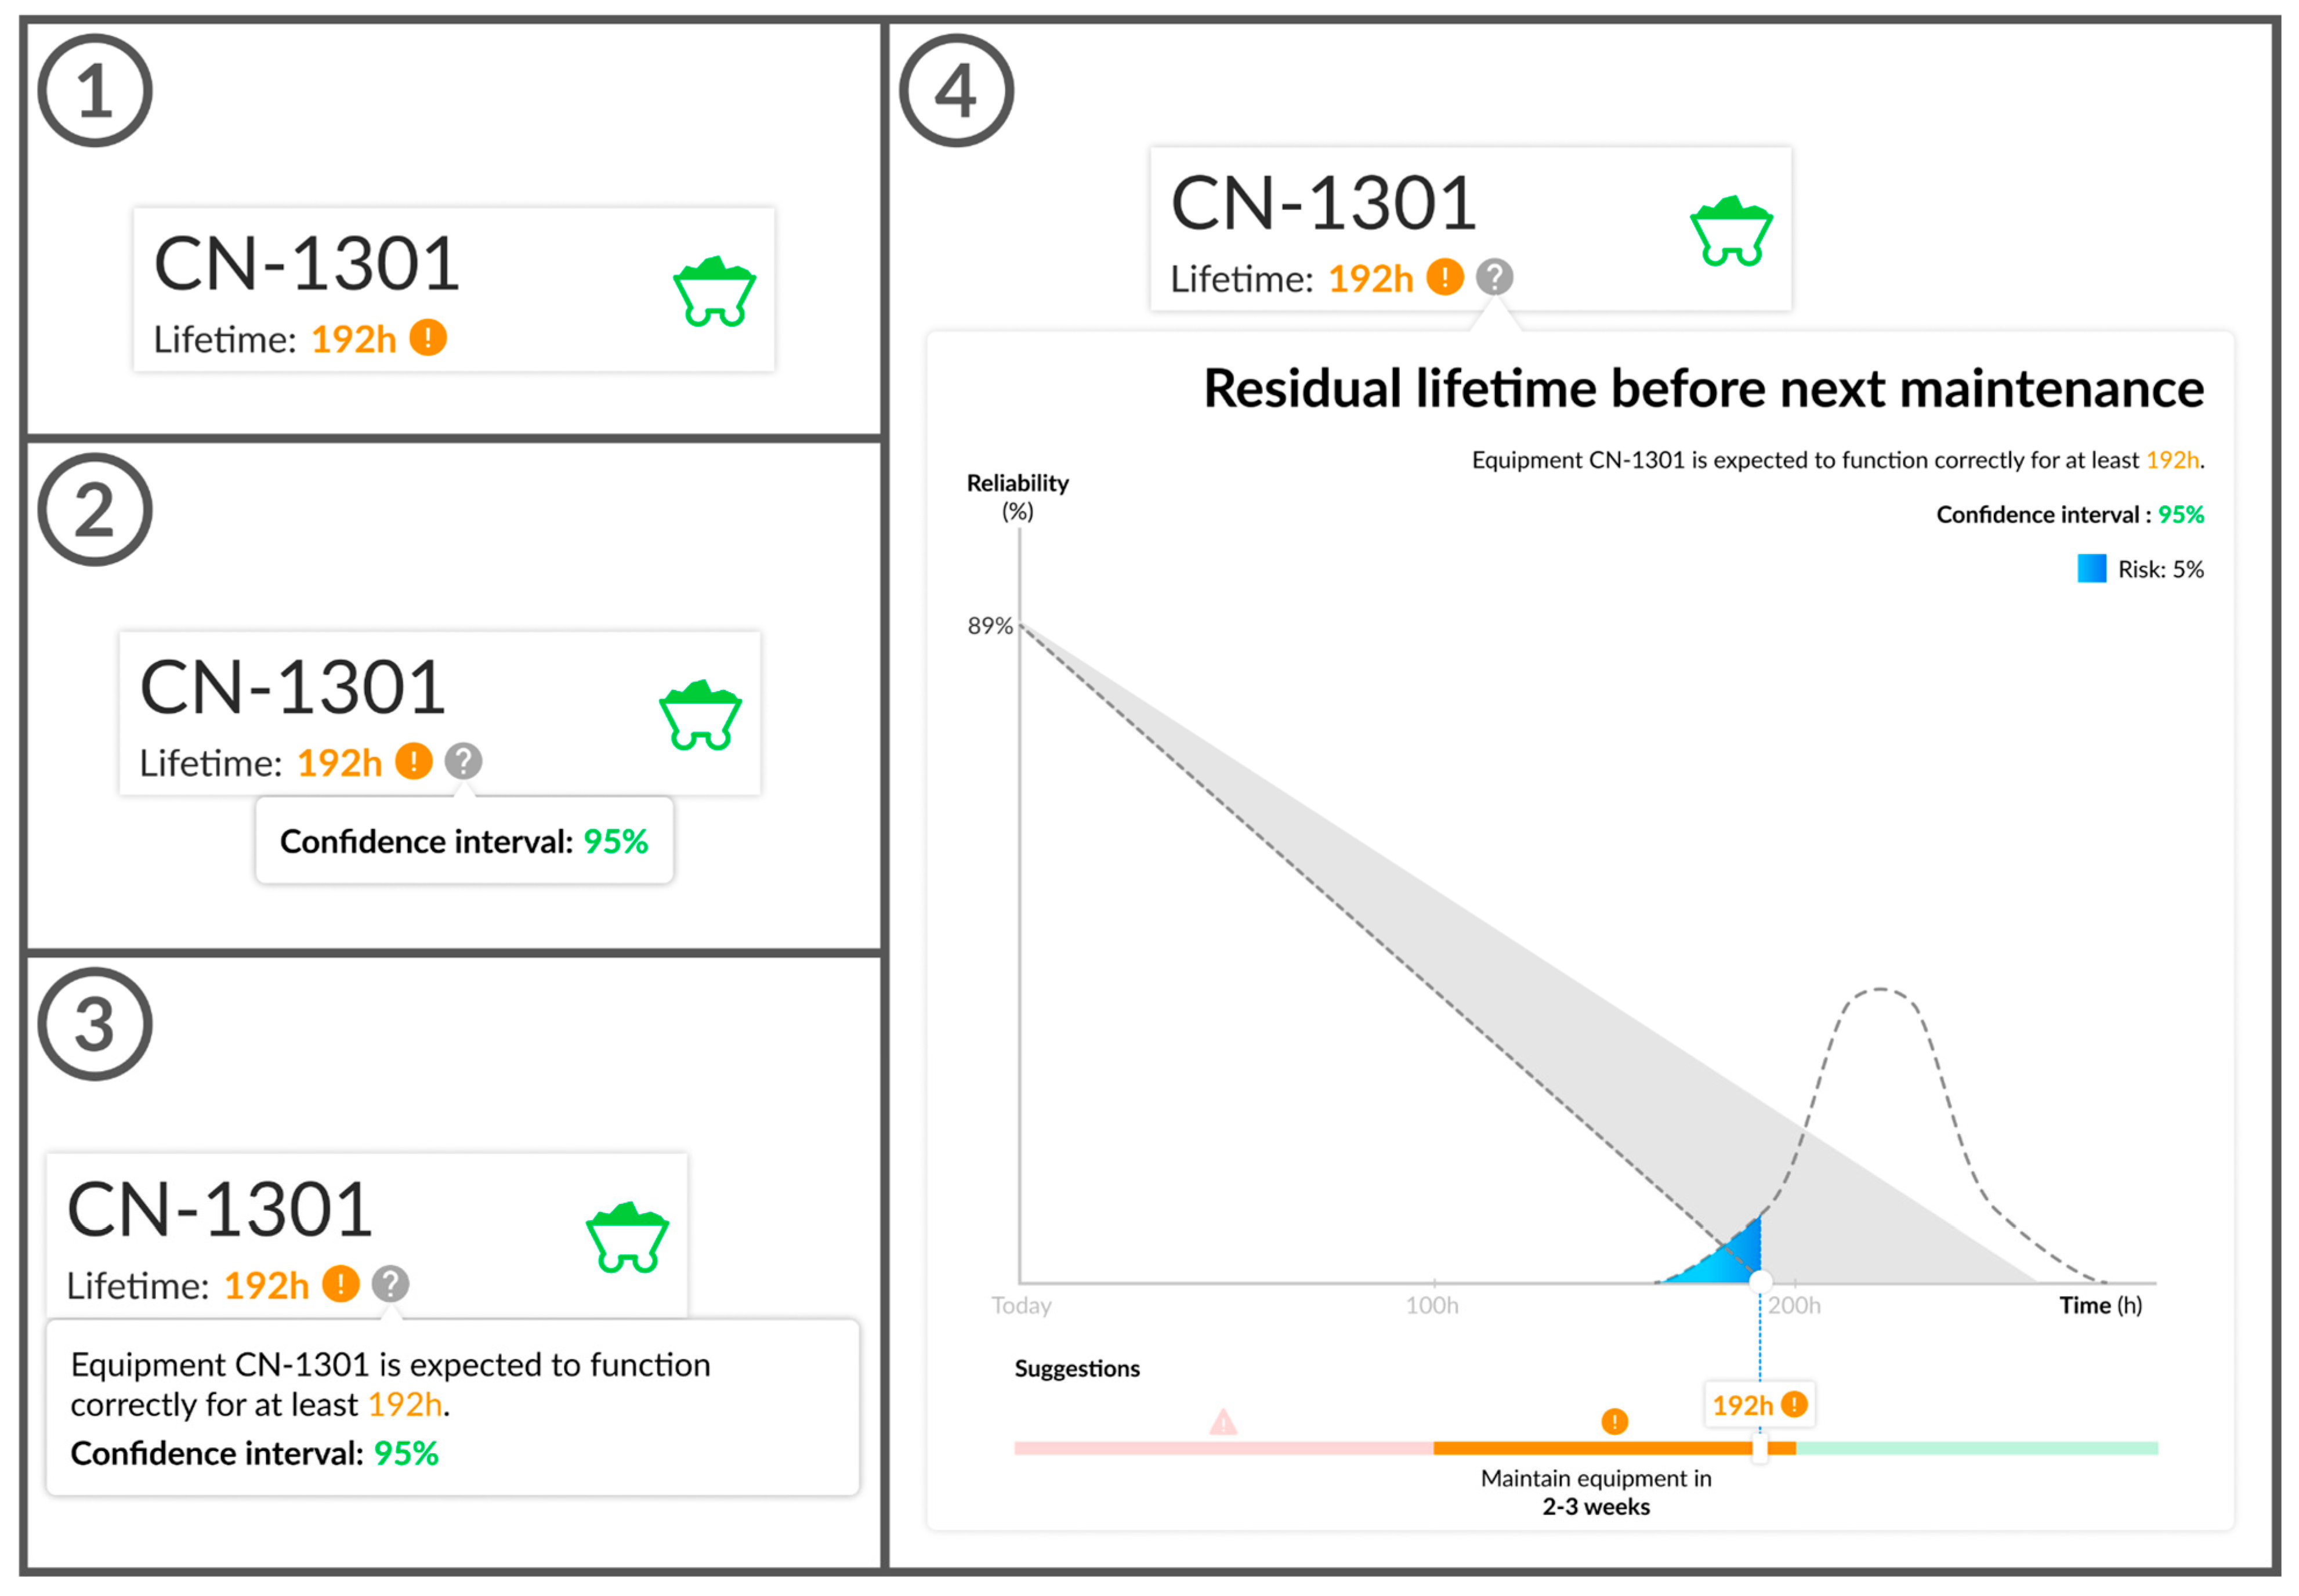
Section 3 of the test was the ranking of different levels of explanation of the PdM algorithm. Figure 5 shows the AI explanation levels numbered from 1 to 4 which the user was asked to rank by preference. Level 1 showed the estimated remaining lifetime of the equipment in engine-hours. Level 2 added the confidence interval of the remaining lifetime prediction. Level 3 provided a plain-English description of the remaining lifetime and confidence interval. Level 4 presented the normal distribution of the equipment’s residual lifetime and a timeline for the expected maintenance scheduling. In the prototype, we implemented level 2 for the PdM scenario. However, for the ranking, we hypothesized that level 3 would be the most popular among our participants due to its concise, actionable instructions and easily understandable presentation.
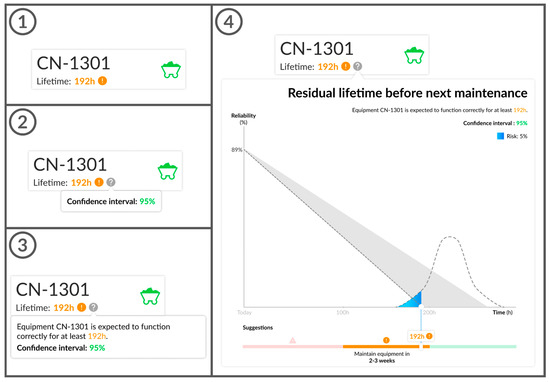
Figure 5.
AI explanation levels. (1) No explanation. (2) Confidence score. (3) Confidence score and suggestion. (4) Confidence score, suggestion, and visual aid.
Section 4 was the debriefing questionnaire containing questions to evaluate the overall experience and scenario preferences. We also asked participants to state aspects of the system that helped in their decision making and aspects that could be improved. Finally, we invited participants to ask questions or to share additional commentary on the test.
3.2.5. Data Analysis
We analyzed UEQ+ responses by using the sheet provided by [32]. The analysis tool provided methods to establish means, variances, and confidence intervals for each scale. Once transcribed, the original 1 to 7 scores are transformed into a −3 to 3 interval to mimic the original UEQ’s data format. A global KPI was calculated by averaging the score of all responses among participants. We surmised participants’ understanding of each questionnaire item by using Cronbach’s alpha coefficient. However, due to the alpha coefficient’s acute sensitivity to low sample sizes (N < 20), no final interpretations were made [72,73]. We used similar analysis methods for the RIS. Although participants provided answers for both scenarios, we only documented RIS answers for the PdM scenario. This is due to participants’ confusion regarding automation questions for a scenario where explicit automation was not provided. Regarding AI explanation ranking, we organized the results by popularity. Each rank (1 most appreciated, 4 least appreciated) was given a unique value where the value for rank R equals 5 − R. We multiplied the number of occurrences of an explanation level by the respective ranking’s value for all ranks. Then, we calculated the cumulative sum, which resulted in the final score. For the debriefing questionnaire, we transcribed the key moments of each recording and divided our notes into 3 categories. Category 1 consisted of aspects that were appreciated by users. Category 2 consisted of suggestions to improve the prototype. Category 3 comprised all the general comments concerning the experience of the participant. The mentioned categories respect those identified in the debriefing questionnaire.
4. Results
We organized our results into four sections directly derived from the user tests’ format. Section 4.1 and Section 4.2 display user responses to the UEQ+ and RIS, respectively. Section 4.3 presents the rankings of different levels of AI explanation. Section 4.4 summarizes participants’ responses during the debriefing questionnaire.
4.1. UEQ+
Table 2 presents the consistency for all scales among both scenarios. Consistencies are generally strong (alpha > 0.70) except for the Trustworthiness of Content scale in the PM scenario, which obtained a poor alpha coefficient of 0.49.

Table 2.
Alpha coefficient per UEQ+ Scale.
Further evaluation of this scale is shown in Table 3.

Table 3.
Item correlation of the scale “Trustworthiness of Content” for the PM scenario.
Table 2 suggests the presence of two subgroups in the targeted scale, namely a subgroup composed of items 1 (useful) and 2 (plausible) and another with items 3 (trustworthy) and 4 (accurate). The corresponding data validate this claim in that some participants tended to assign high values to data usefulness and plausibility but assigned lower values to data trustworthiness and accuracy.
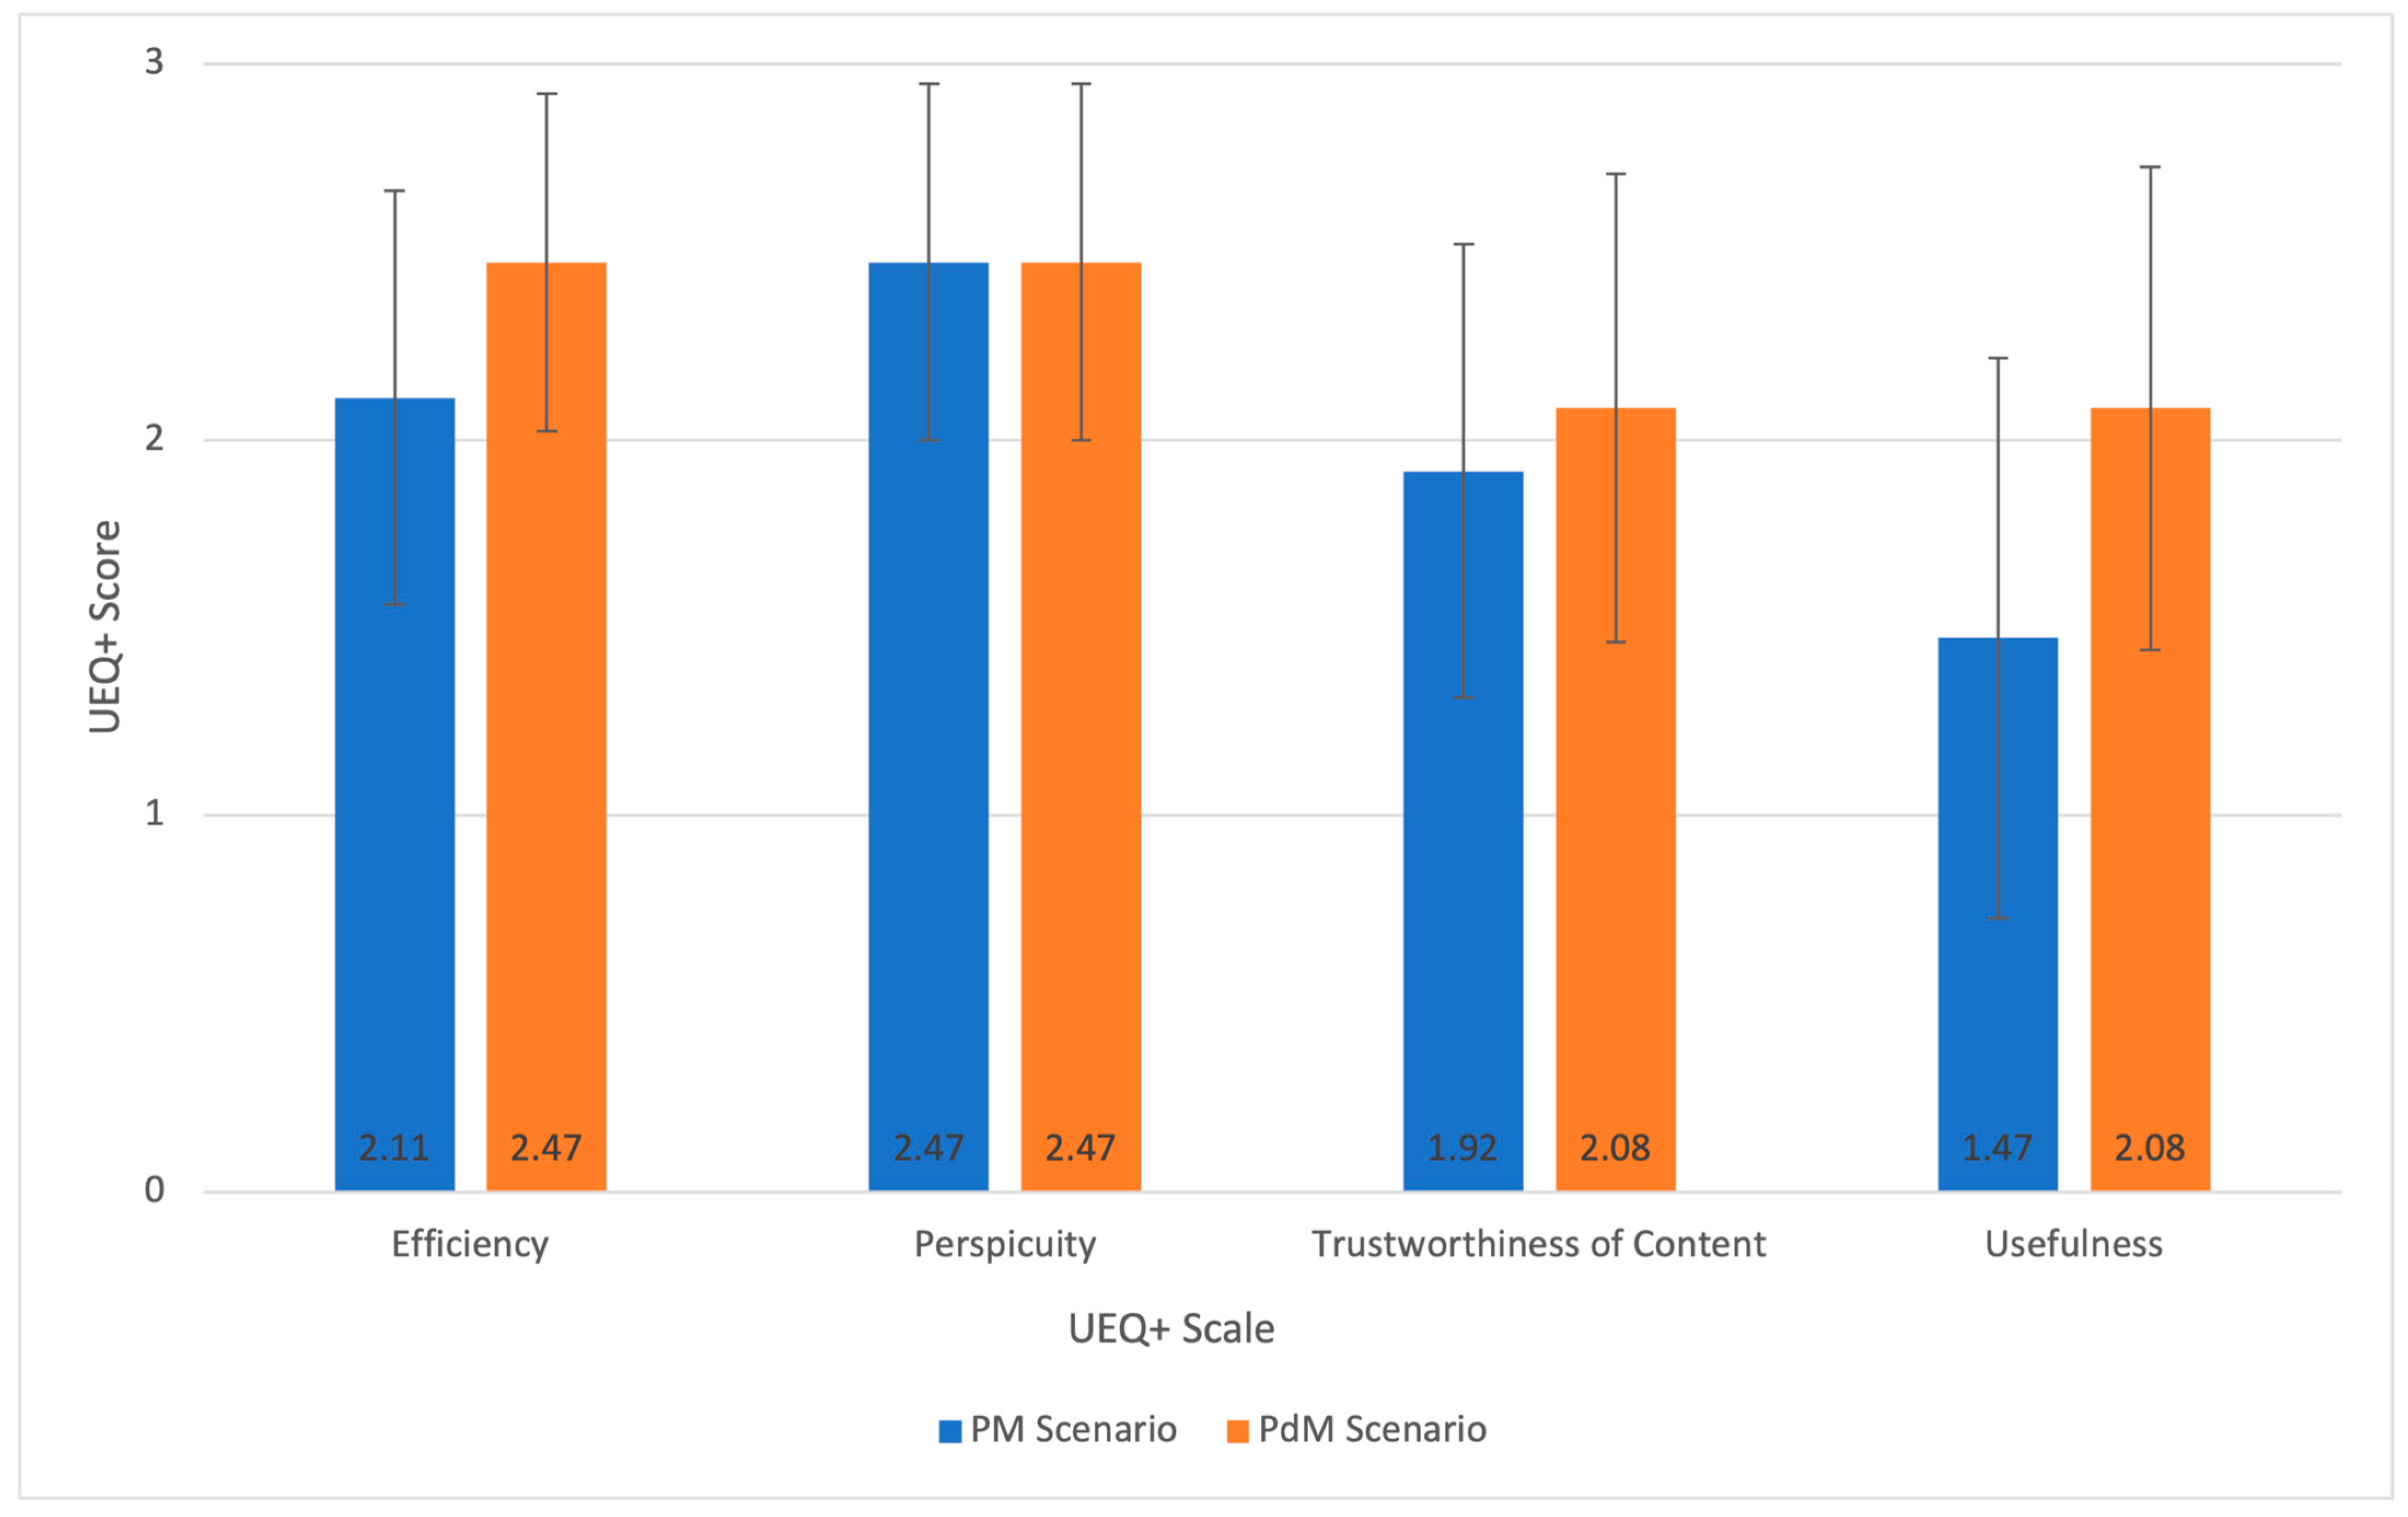
Figure 6 shows the UEQ+ means score and 95% confidence interval for both scenarios. Usual UEQ+ results range from −3 to 3 but, due to the absence of negative results, we limited the interval to only display positive numbers.
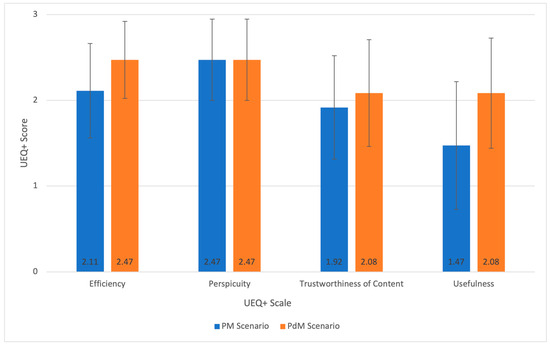
Figure 6.
UEQ+ scores for PM and PdM scenarios.
Perspicuity was unchanged between the two scenarios while the other three scales presented slight differences. For the PM scenario, the Perspicuity scale scored highest with items “easy to learn” and “easy” obtaining 2.56. For the PdM scenario, the Efficiency and Perspicuity scales obtained similar results with the item “organized” of the Efficiency scale, scoring 2.67. Regarding scale importance, the difference between the PM and PdM scenarios was minimal with importance for all scales being 2.56 on average. Finally, the KPI for the overall UX impression of the product was 2.00 ± 0.43 for the PM scenario and 2.28 ± 0.61 for the PdM scenario.
4.2. RIS
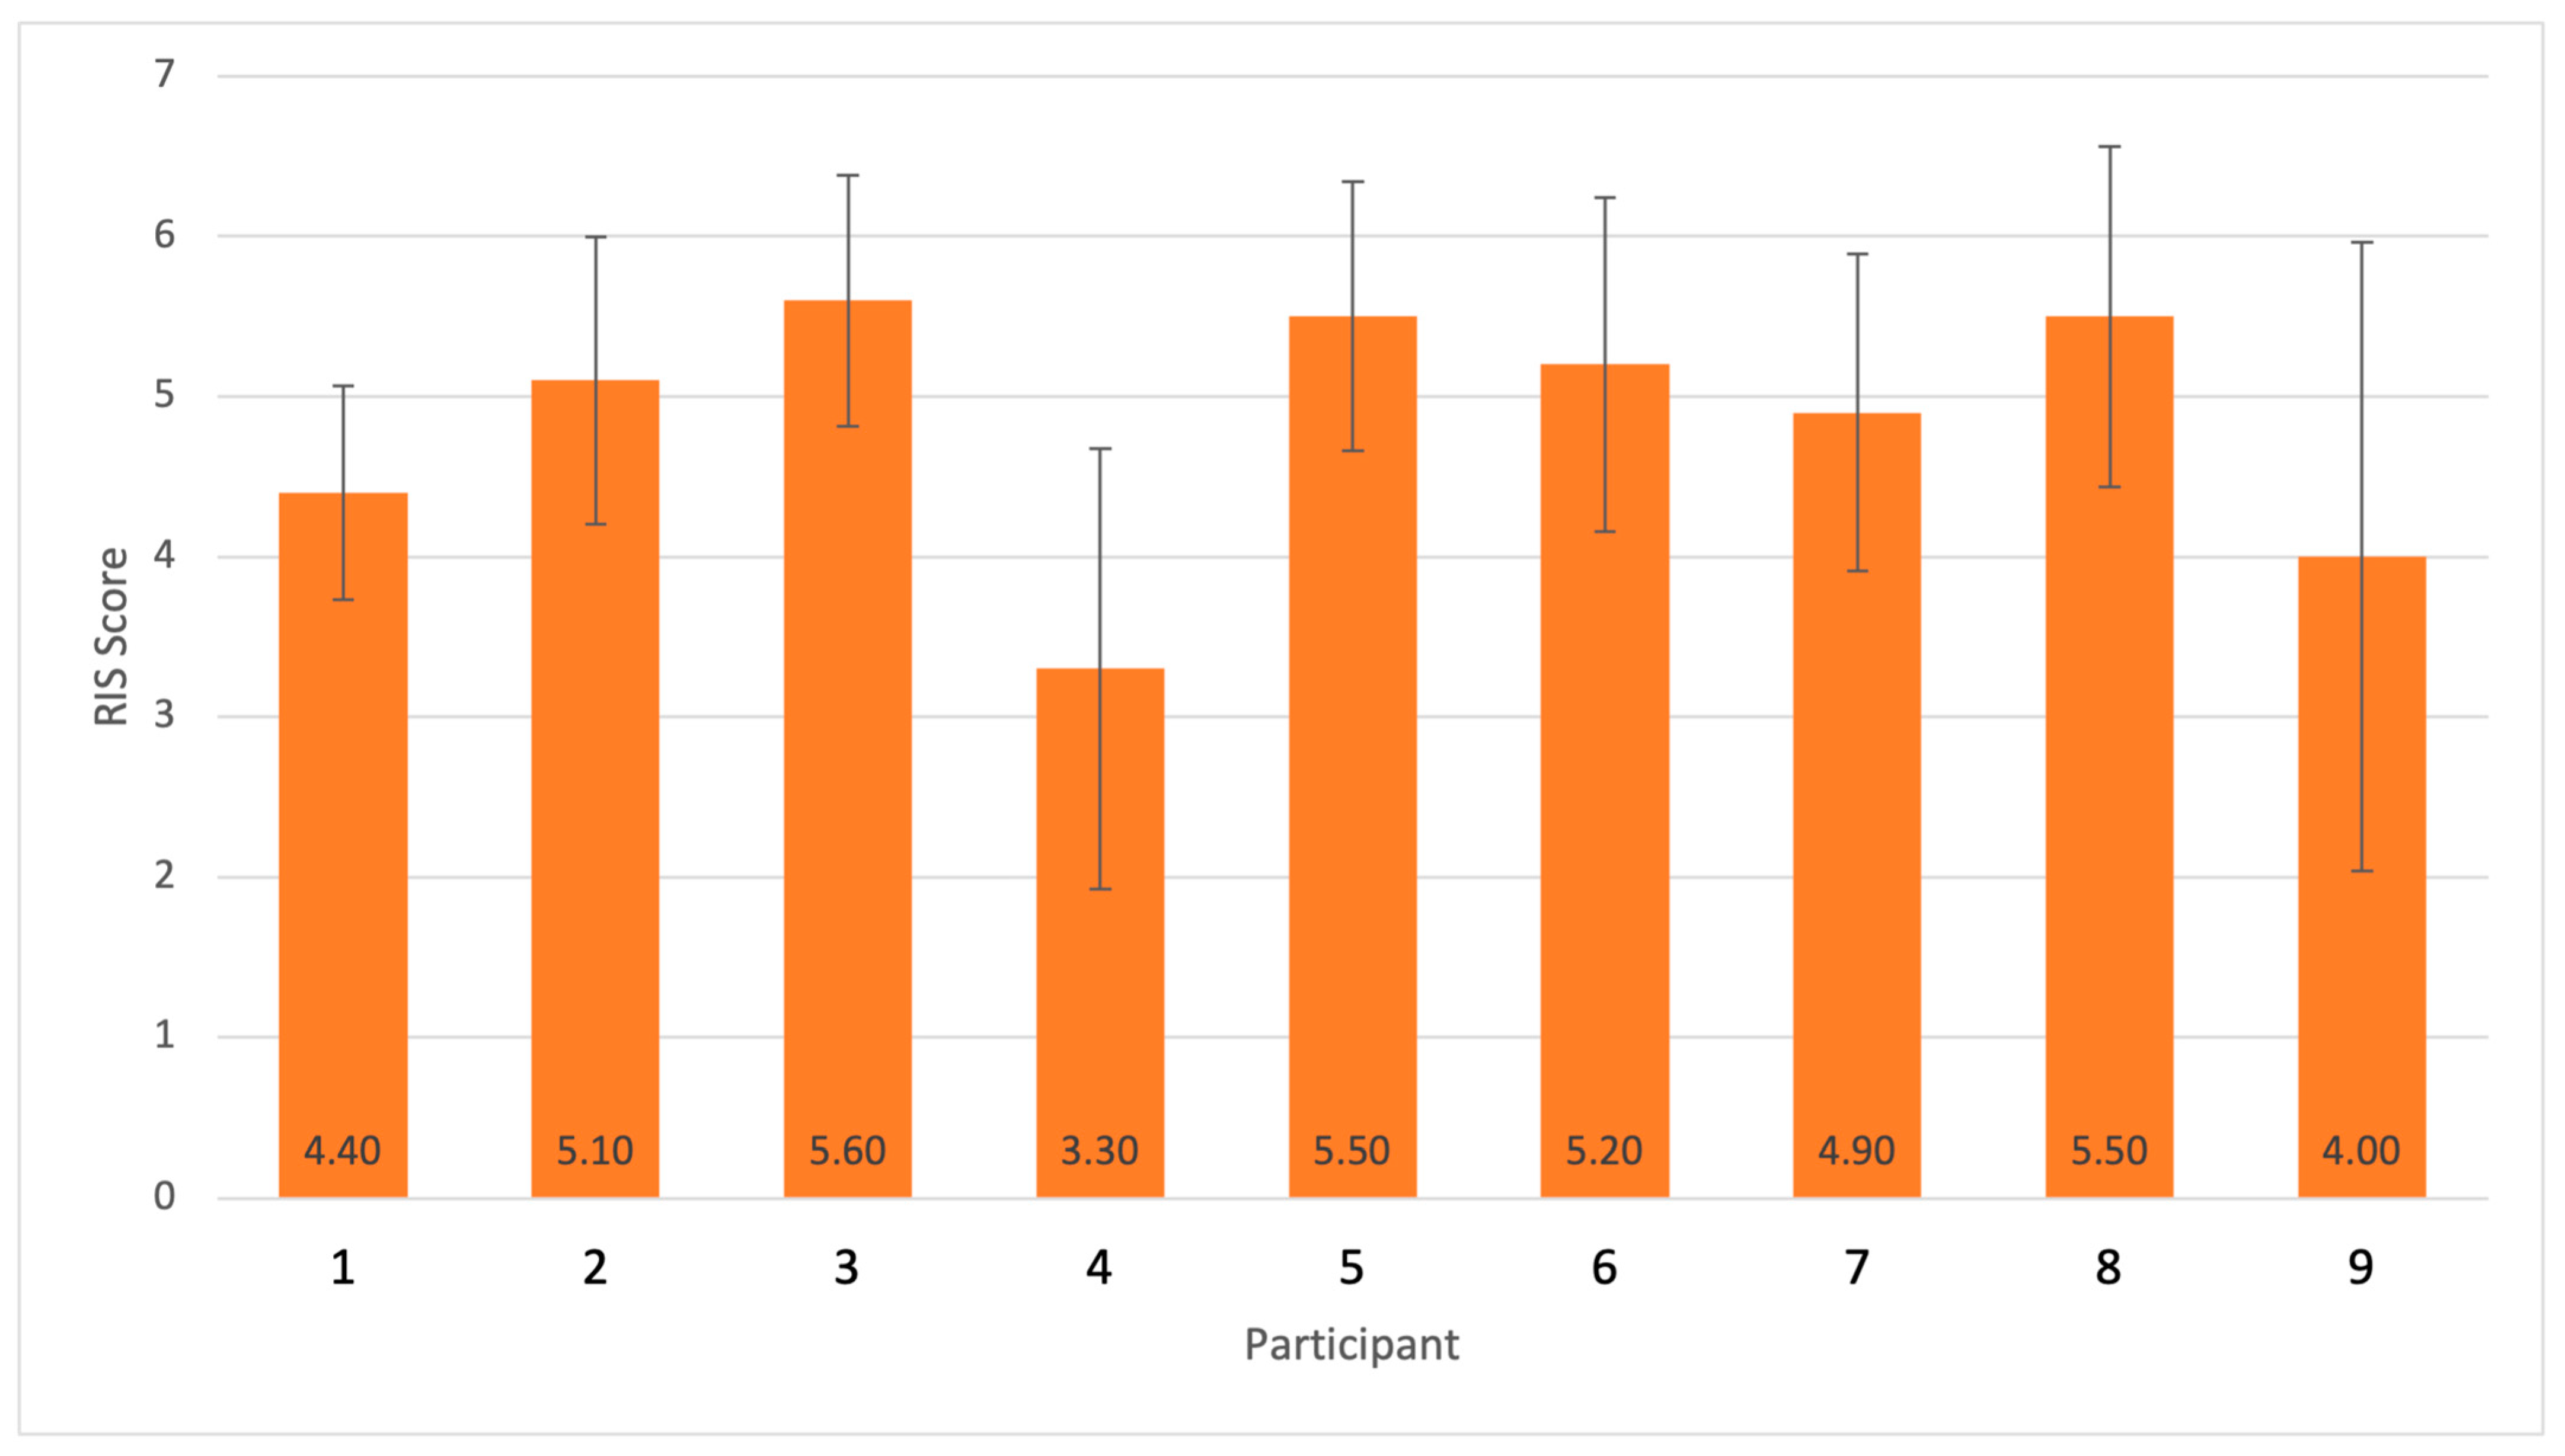
Consistency for the PdM scenario was alpha = 0.69, which is hardly inferior to the accepted value of 0.7. Trust scores per participant for the RIS are shown in Figure 7. Scores were calculated according to [58]. Questions Q1 and Q3 were reverse-coded and, therefore, adapted accordingly.
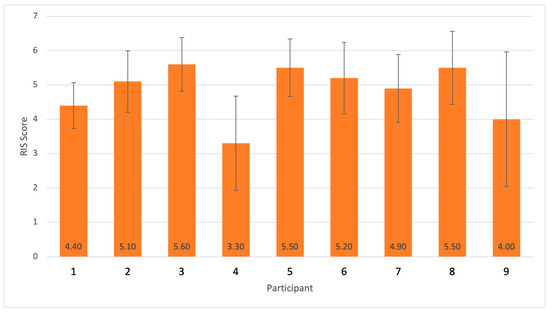
Figure 7.
RIS trust score per participant for the PdM scenario.
As highlighted by Figure 7, the PdM scenario displays an elevated reliance tendency with an average score of 4.83 ± 1.07 out of 7.
4.3. AI Explanation Ranking
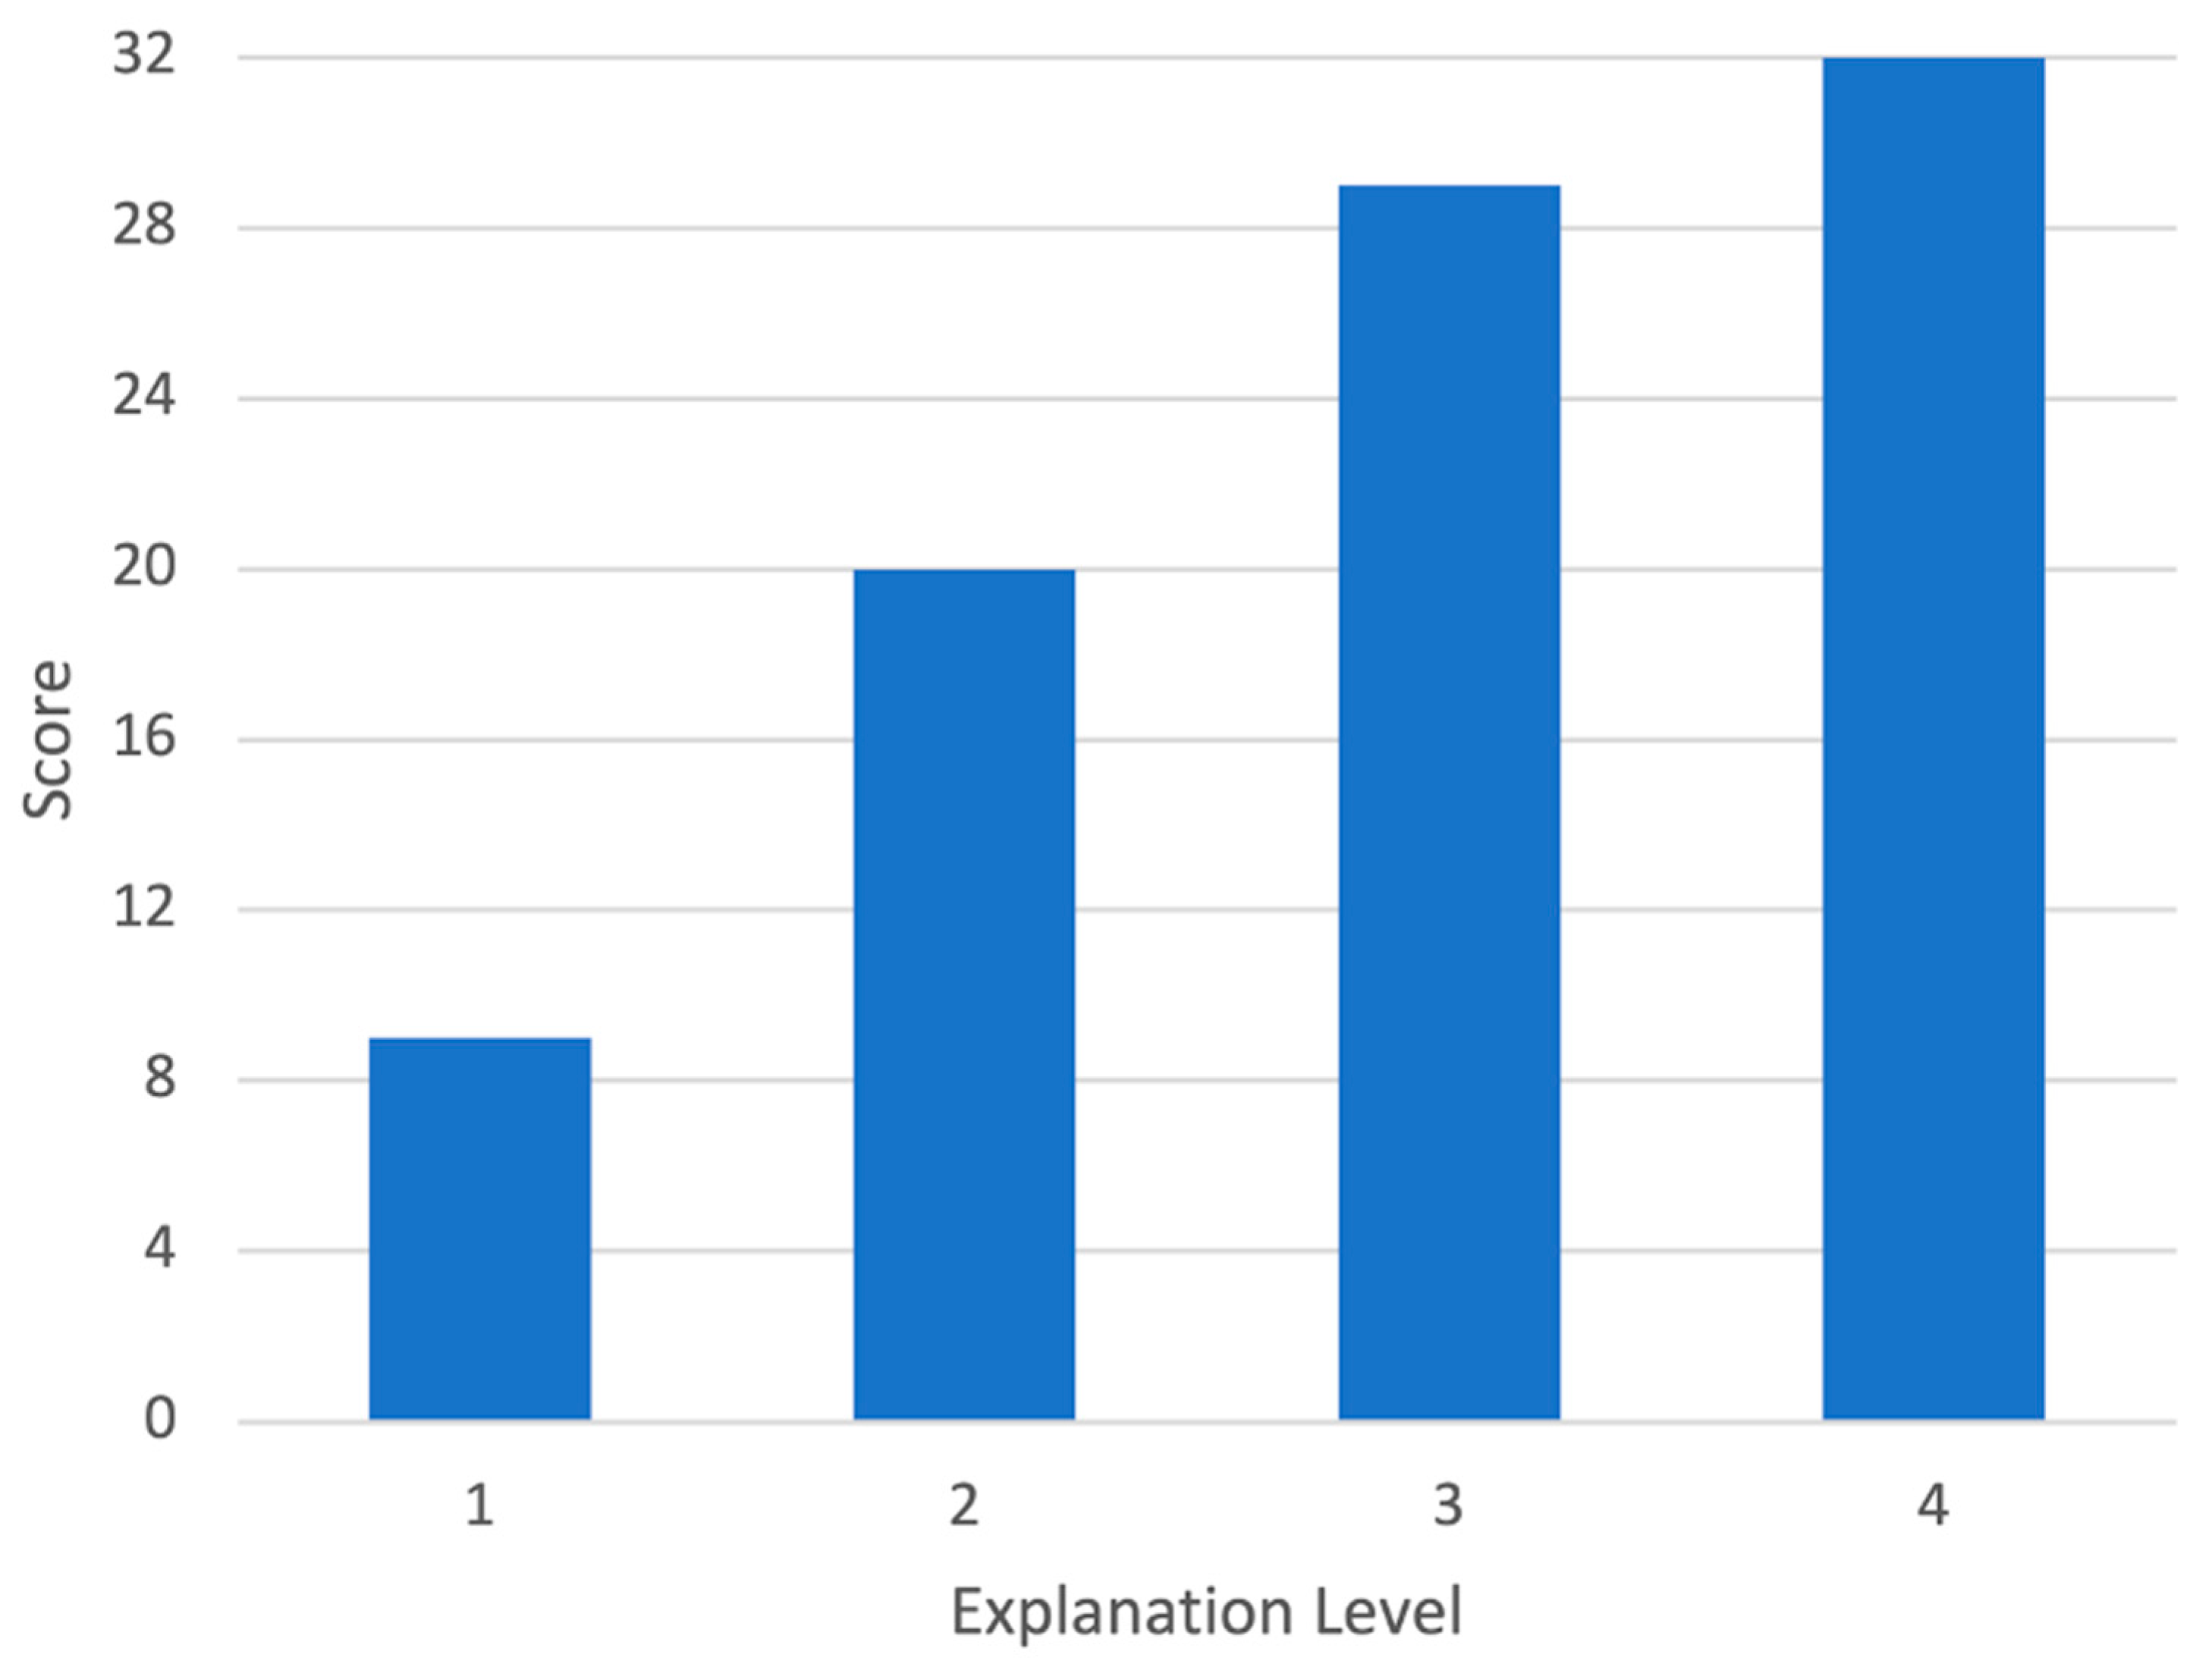
The ranking of AI explanation levels is shown in Figure 8. A higher score is desirable.
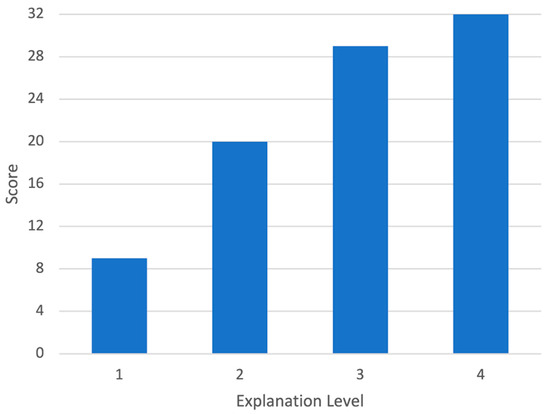
Figure 8.
AI explanation rankings (higher score is preferred, maximum 36).
The most popular explanation levels were levels 3 and 4. The highest score was attributed to level 4, having been placed in first place by six out of nine participants. The main reason for this choice is that level 4 presented the most detailed explanation. In fact, according to participants, the more information the system provides, the more enlightened their decision making. Additionally, the visual aid was greatly appreciated by participants, who commented that it was a necessary addition to the explanation. Level 3 was selected as the second preferred explanation by five out of nine participants, as it indicated both a confidence score and a suggested action. Level 2 was selected in third place by seven out of nine participants as it did not display the information required for sound decision making. In last place can be found explanation level 1 which shows that a minimal amount of explanation is required by experts. Concerning outliers, two participants stated that the visual aid in explanation level 4 was hard to understand and therefore useless to them. This sentiment was voiced mostly by participants who did not occupy a managerial job. In fact, participants occupying a non-supervisory role preferred level 3. Two participants stated that level 3 added redundant information claiming that an expert user would not need action suggestions. Hence, they prioritized level 2 above level 3 mainly due to its conciseness.
4.4. Debriefing Questionnaire
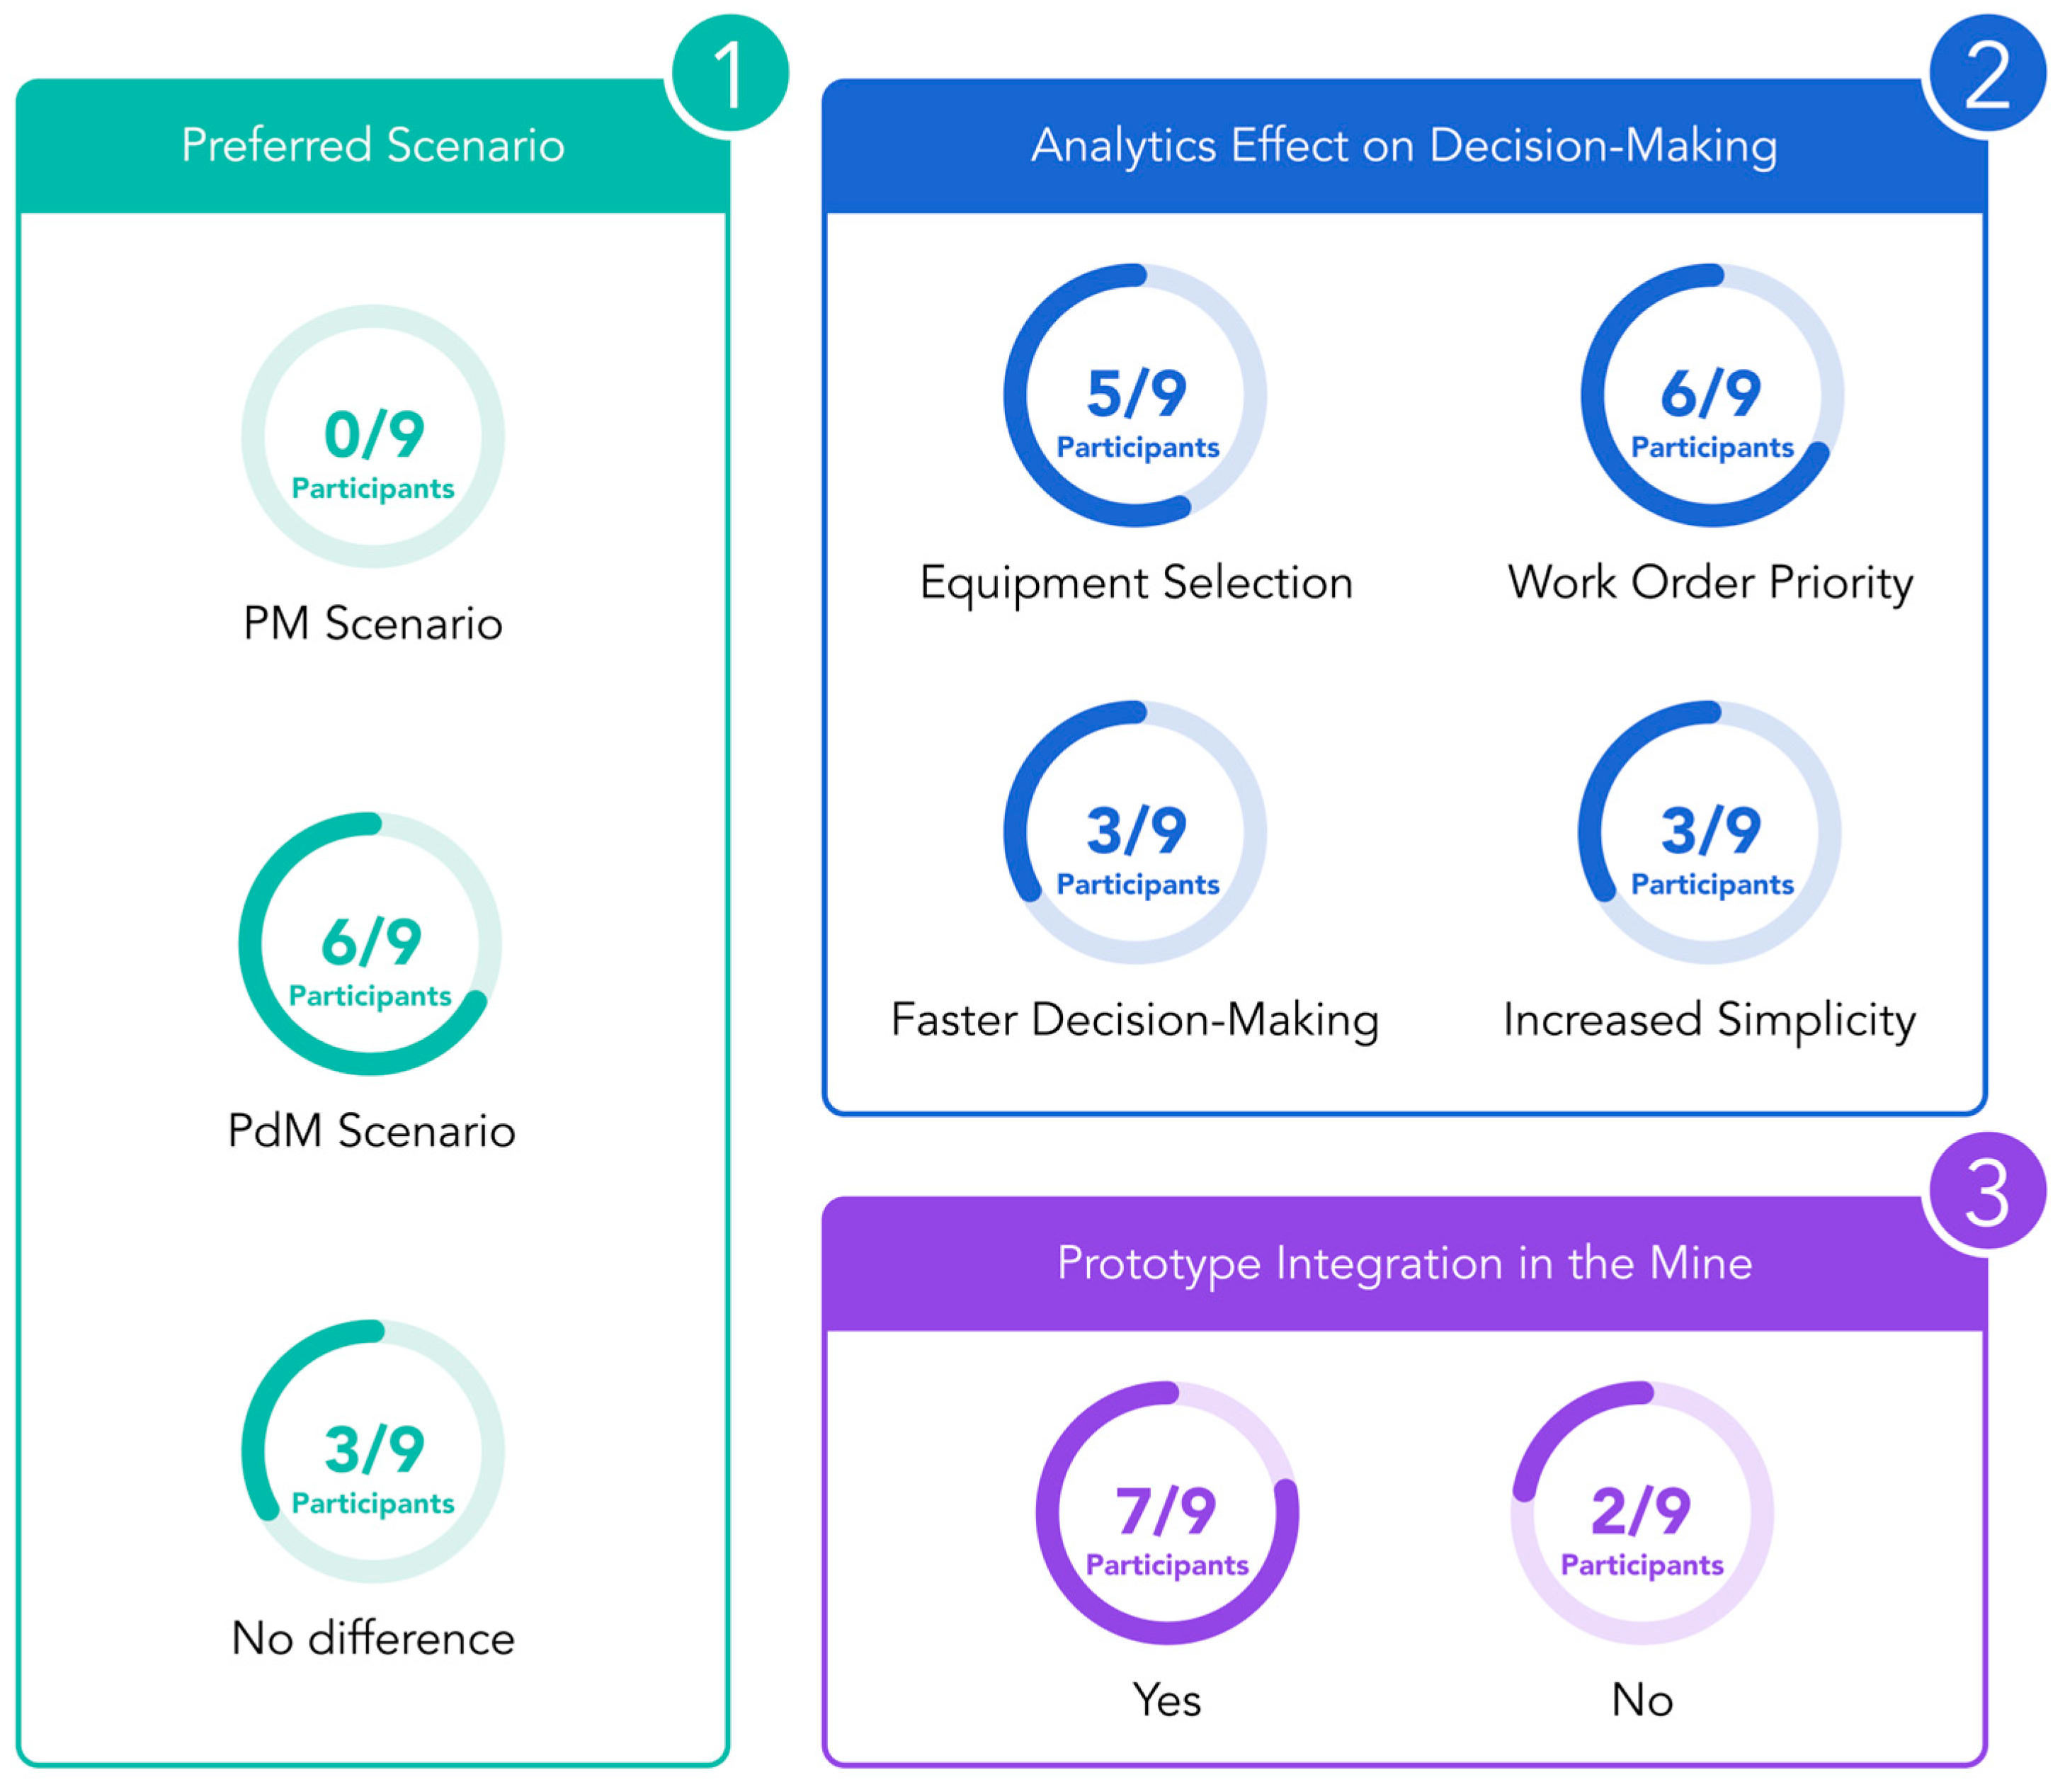
We divided debriefing responses into three themes inspired by those highlighted in the questionnaire: the preferred scenario, the effect of PdM on decision making, and participants’ willingness to integrate the prototype in their mine. Figure 9 displays a summary of participants’ responses to these themes.
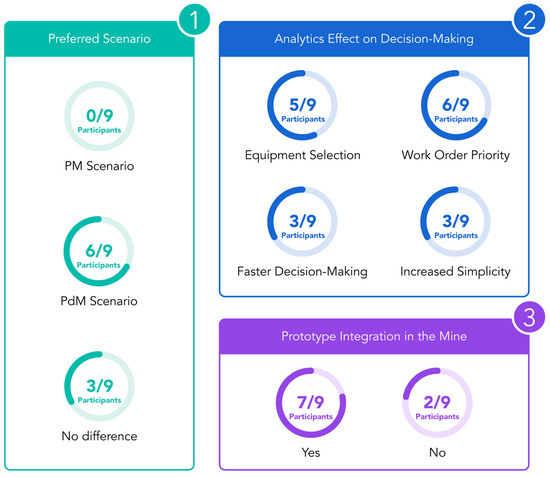
Figure 9.
Debriefing questionnaire responses.
As shown in Figure 9, most participants (6/9) preferred the PdM scenario over PM for maintenance planning. According to participants, the advantages of PdM on decision making were most notable during equipment selection and work order prioritization, and it was linked to a faster and simpler decision-making process. On the prototype’s integration in the participants’ mines, seven out of nine participants answered positively. Participants’ comments on this choice mentioned the prototype’s great user-friendliness (5/9), UI cleanliness (4/9), and high learnability (3/9). On the other hand, one participant stated that the prototype may not be optimized for larger mining operations, while another participant did not provide a definitive answer.
5. Discussion
5.1. Summary
The main objective of this study was to evaluate the usability of VulcanH. At the same time, we clarified TiA constraints related to PdM through the analysis of reliance intentions and level-of-detail recommendations of explainability via rankings of PdM suggestions. From our results, we concluded that VulcanH shows great potential in terms of usability, with intuitiveness and ease-of-use being among the most appreciated aspects. Concerning participants’ tendency to rely on automation, our results displayed a generally acceptable level of trust towards PdM. As for explainability ranking, we recommend the implementation of complete and actionable suggestions related to the context at hand with emphasis on graphical means to convey information.
5.2. Usability
The overall UEQ+ score for the PM scenario was 2.00 ± 0.43 whereas it was 2.28 ± 0.61 for the PdM scenario. This shows that the prototype had good usability for both preventive and predictive maintenance. Indeed, the authors of [32] correlated general satisfaction of products to the KPI to demonstrate its effectiveness. The portrayed values seem to indicate that KPIs between 0 and 1 offer an acceptable user experience, while values above 1 are satisfactory. For purposes of comparison, Netflix’s and Amazon Prime’s KPIs were 1.73 ± 0.74 and 1.35 ± 0.87, respectively. Similarly, a recent study concluded that a KPI value of 1.53 reflected a positive usability of the system [74]. This value was accompanied by a SUS score of 69% which can be considered slightly above average according to SUS benchmarks [75]. In the same vein, a recent thesis evaluated the usability of online management systems for university students and associated KPI values between 0.48 and 0.99 to an average experience [76]. Our results on UEQ+ scale importance were considerably elevated (2.56/3) and consistent. Hence, we believe that the chosen scales correctly represent users’ usability expectations towards a CMMS. Overall, the usability of our prototype may be deemed more than satisfactory, which consolidates the primary objective of our study.
The expected method of evaluating UEQ+ responses is via product comparison [32]. However, our usability results are too similar to identify a superior solution between PM and PdM. This similarity may be due to two factors. First, we previously found the user experience of participants’ maintenance management tools to be noticeably improvable [10]. We suppose this had an impact on participants’ perception of our prototype’s usability although a formal comparison is required to effectively prove this hypothesis. Second, the integration of PdM in our design seemed to have had little impact on participants’ decision making with three of nine participants noticing no difference between the proposed scenarios. Yet, most participants (6/9) preferred being aided by the PdM analytics.
Alpha coefficients for UEQ+ responses were generally above the expected threshold of 0.7 [32]. As stated, due to our low sample size (N = 9), we did not extract any final conclusions regarding each scale’s consistency [73]. Cronbach’s coefficient was used mainly to validate participants’ understanding of the measured items and comment on unexpected results, as was the case for the scale of Trustworthiness of Content for the PM scenario. Addressing this scale’s low alpha coefficient, we suspect it to be related to the prototyped nature of the test. In fact, some participants (3/9) stated that contextual information was missing from the scenarios to realistically ascertain the content’s trustworthiness or accuracy, most importantly manpower, costs, and materials availability. This was the case even if participants felt that the content was useful for their decision making and plausible in the given picture.
On a per-scale basis, participants’ comments concerned mostly Perspicuity and Efficiency. Perspicuity was appreciated by all participants. During the debriefing phase, all participants commented on the prototype’s ease-of-use and clarity, with one participant stating that the tool he or she used for maintenance planning was less user-friendly than our prototype. Additionally, this participant mentioned that, compared to the evaluated prototype, the aforementioned tool offered little visual aid to help in decision making. Another participant commented on the efficiency and simplicity of the prototype stating their enjoyment of the “Drag&Drop” feature for equipment scheduling and expressing a feeling of wonder towards the visual aspect of our solution. Efficiency-wise, all participants appreciated the prototype’s speed during task execution as well as the practical way in which information was presented. However, one of the most mentioned improvements concerned the practicality aspect. In fact, seven participants noted how the work orders table could offer functions such as sorting or filtering to better aid in task completion.
5.3. Trust in Automation
We measured TiA for the PdM scenario using the RIS from [58] and obtained a score of 4.83 ± 1.07 (out of 7). The alpha value for our measurement was 0.69 which is close to the accepted threshold of 0.7 [73]. Previous literature associated a score of 3.61 ± 1.05 to a moderate amount of trust [77]. This association is supported by [58], where values between 3 and 4 were portrayed as being acceptable, albeit the authors made no explicit comments regarding absolute trust. Hence, based on score alone, we concluded that participants generally trusted VulcanH. Our study adds to the body of knowledge on expert users’ trust on automation.
Qualitative results from participants’ comments throughout the test or during the debriefing phase consolidated our conclusion. One participant stated that it would be pointless to implement PdM if one were not ready to trust it. Additionally, almost all participants (7/9) based their decisions on the system’s suggestions without questioning it. We believe that this may be due to the analytics’ elevated confidence score, the complex nature of the task, and the confined amount of contextual information. On the other hand, one participant expressed needing to thoroughly test the system before a trusted relationship may be established, while another stated that the PdM suggestions were too unclear to be able to rely on them.
Our results highlighted a common trend among participants, who generally trusted the system, to select a high value for the reverse-coded question: “I really wish I had a good way to monitor the decisions of the system”. Admittedly, participants tended to rely on the system but expressed a need for explanation before committing to it. This result respects current findings on TiA research targeting expert users [48] and findings in expert related XAI studies [50,51,52,53]. We believe that accountability plays an important role in the expert’s interaction with automated systems. In fact, the creation of a poor maintenance schedule may lead to the loss of millions of dollars in unplanned equipment breakage or production downtime, and maintenance experts are responsible to ensure the quality of said schedule [10].
On the topic of explanations, we found that the more information is presented to the expert users, the better. This finding contradicted our initial hypothesis that expected explanation level 3 to be the most popular. When commenting on their choices, participants mentioned how the residual lifetime graph was preferable even if they did not understand it entirely at first glance. It was stated multiple times that a graphical approach would be more appreciated than a textual one. This finding suggests that explanations should be conveyed to the maintenance expert by leveraging graphical means as opposed to explaining recommendations through text.
5.4. PM and PdM Integration
During the debriefing phase, we were able to ascertain that six out of nine participants preferred the PdM scenario. These participants were greatly satisfied by the increase in decision-making speed considering AI suggestions. Admittedly, one participant stated that this kind of system is exactly what the industry needs for the future. The remaining three participants did not find enough difference between the proposed scenarios to soundly express their preference. Similarity between scenarios was an aspect of our tests that all participants highlighted. This was surprising, as it was the first time that participants were exposed to PdM whereas they were all familiar with PM. In our previous study, maintenance planners stated that the passage from PM to PdM needed to be accomplished in an exclusive manner [10]. Our results suggest that a gradual adaptation of the process is possible. Indeed, the high level of usability and trust towards VulcanH suggest an overlap between PM and PdM practices. It is also plausible that the similarity between the two scenarios is due to limitations in our methodology, specifically concerning the absence of workforce management and schedule proposition. The inclusion of these aspects in future studies may offer insights into the issue of PdM integration. Overall, our results validated our objective to integrate PdM into the current maintenance workflow while ensuring minimal disruption of active PM practices.
5.5. Limitations and Future Work
There are three main limitations to this study. First, our choice to ignore workforce availability and parts management removed a substantial portion of the planning phase. The choice ensured that all participants completed the test regardless of their familiarity with maintenance planning but sacrificed the realism of the experience. Thus, participants’ decisions were oftentimes less rigorous than expected in real circumstances. Future studies should conduct user tests including these aspects of the planning phase. Second, since this study focused on the usability evaluation of VulcanH, we developed test-cases that did not account for the quality of the final schedule. To analyze a CMMS’s usefulness, measures for performance and error-rate are essential [34]. Hence, future research should establish a baseline for performance analysis through error detection for complex systems such as CMMSs and compare the user’s schedule to this baseline. Third, our evaluation was limited to the prototype stage. An actual implementation of the system within the maintenance process would allow for a clearer understanding of the prototype’s capabilities for maintenance planning and scheduling on the field and would enable an accurate comparison with existing CMMSs. Furthermore, evaluating the system’s usage in a high-stakes scenario would most likely yield more accurate results from which researchers may better identify avenues for improvement.
The nearing of PdM practices into the everyday mine emphasizes the need for user-oriented research. CMMSs capable of providing an exciting user experience will generate an increased level of productivity, a reduction in human-related error, and an overall greater symbiosis between the expert and the automated system. This work has shown how to bring this vision into practice.
6. Conclusions
In this study, we conducted user tests with nine participants from five mining sites to evaluate the usability of our PM and PdM CMMS prototype, VulcanH. Simultaneously, we measured experts’ TiA through the analysis of their reliance intentions and explored user-dictated constraints regarding the level of detail of PdM explanations. Our main contribution is the proposal and development of a CMMS prototype aimed at providing improved decision support for current PM and future PdM practices for mobile equipment in the mining industry. We found that the usability and efficiency of VulcanH were satisfactory for expert users and encouraged the gradual transition from PM to PdM practices, with participants appreciating the prototype’s learnability and ease-of-use. Concerning TiA, our results indicated an elevated tendency to rely on the PdM’s suggestions. Quantitative and qualitative results allowed us to conclude that the participants were willing to rely on predictions if suitable explanations are provided. On PdM explanations, most participants preferred graphical explanations covering the full spectrum of the derived data. This finding may guide future research in PdM to select an analytical algorithm capable of supplying adequate and causal justifications for informed decision making, preferably leveraging graphical means.
Author Contributions
Conceptualization, S.R.S. and P.D.-P.; methodology, S.R.S. and P.D.-P.; validation, S.R.S., P.D.-P. and M.G.; investigation, S.R.S.; resources, M.G.; data curation, S.R.S.; writing—original draft preparation, S.R.S.; writing—review and editing, P.D.-P. and M.G.; visualization, S.R.S.; supervision, P.D.-P. and M.G.; project administration, P.D.-P. and M.G.; funding acquisition, M.G. All authors have read and agreed to the published version of the manuscript.
Funding
This research was funded by Fonds de recherche du Québec—Nature et technologies (FRQ-NT), grant number 2020-MN-281330.
Data Availability Statement
The original contributions presented in the study are included in the article, further inquiries can be directed to the corresponding author.
Acknowledgments
The authors thank greatly all the expert participants who decided to take part in this study. Your feedback was pivotal in the evaluation of VulcanH and the completion of this research.
Conflicts of Interest
The authors declare no conflicts of interest.
Appendix A
Table A1 displays the respected requirements adapted from [10].

Table A1.
User requirements for VulcanH.
Table A1.
User requirements for VulcanH.
| General |
|
| Equipment Information |
|
| Work Order Information |
|
| KPIs |
|
| Scheduling |
|
Legend: (*)—Requirements that were not selected for the creation of VulcanH.
Appendix B
This section presents more information on VulcanH’s functionalities such as how they were explained to participants.
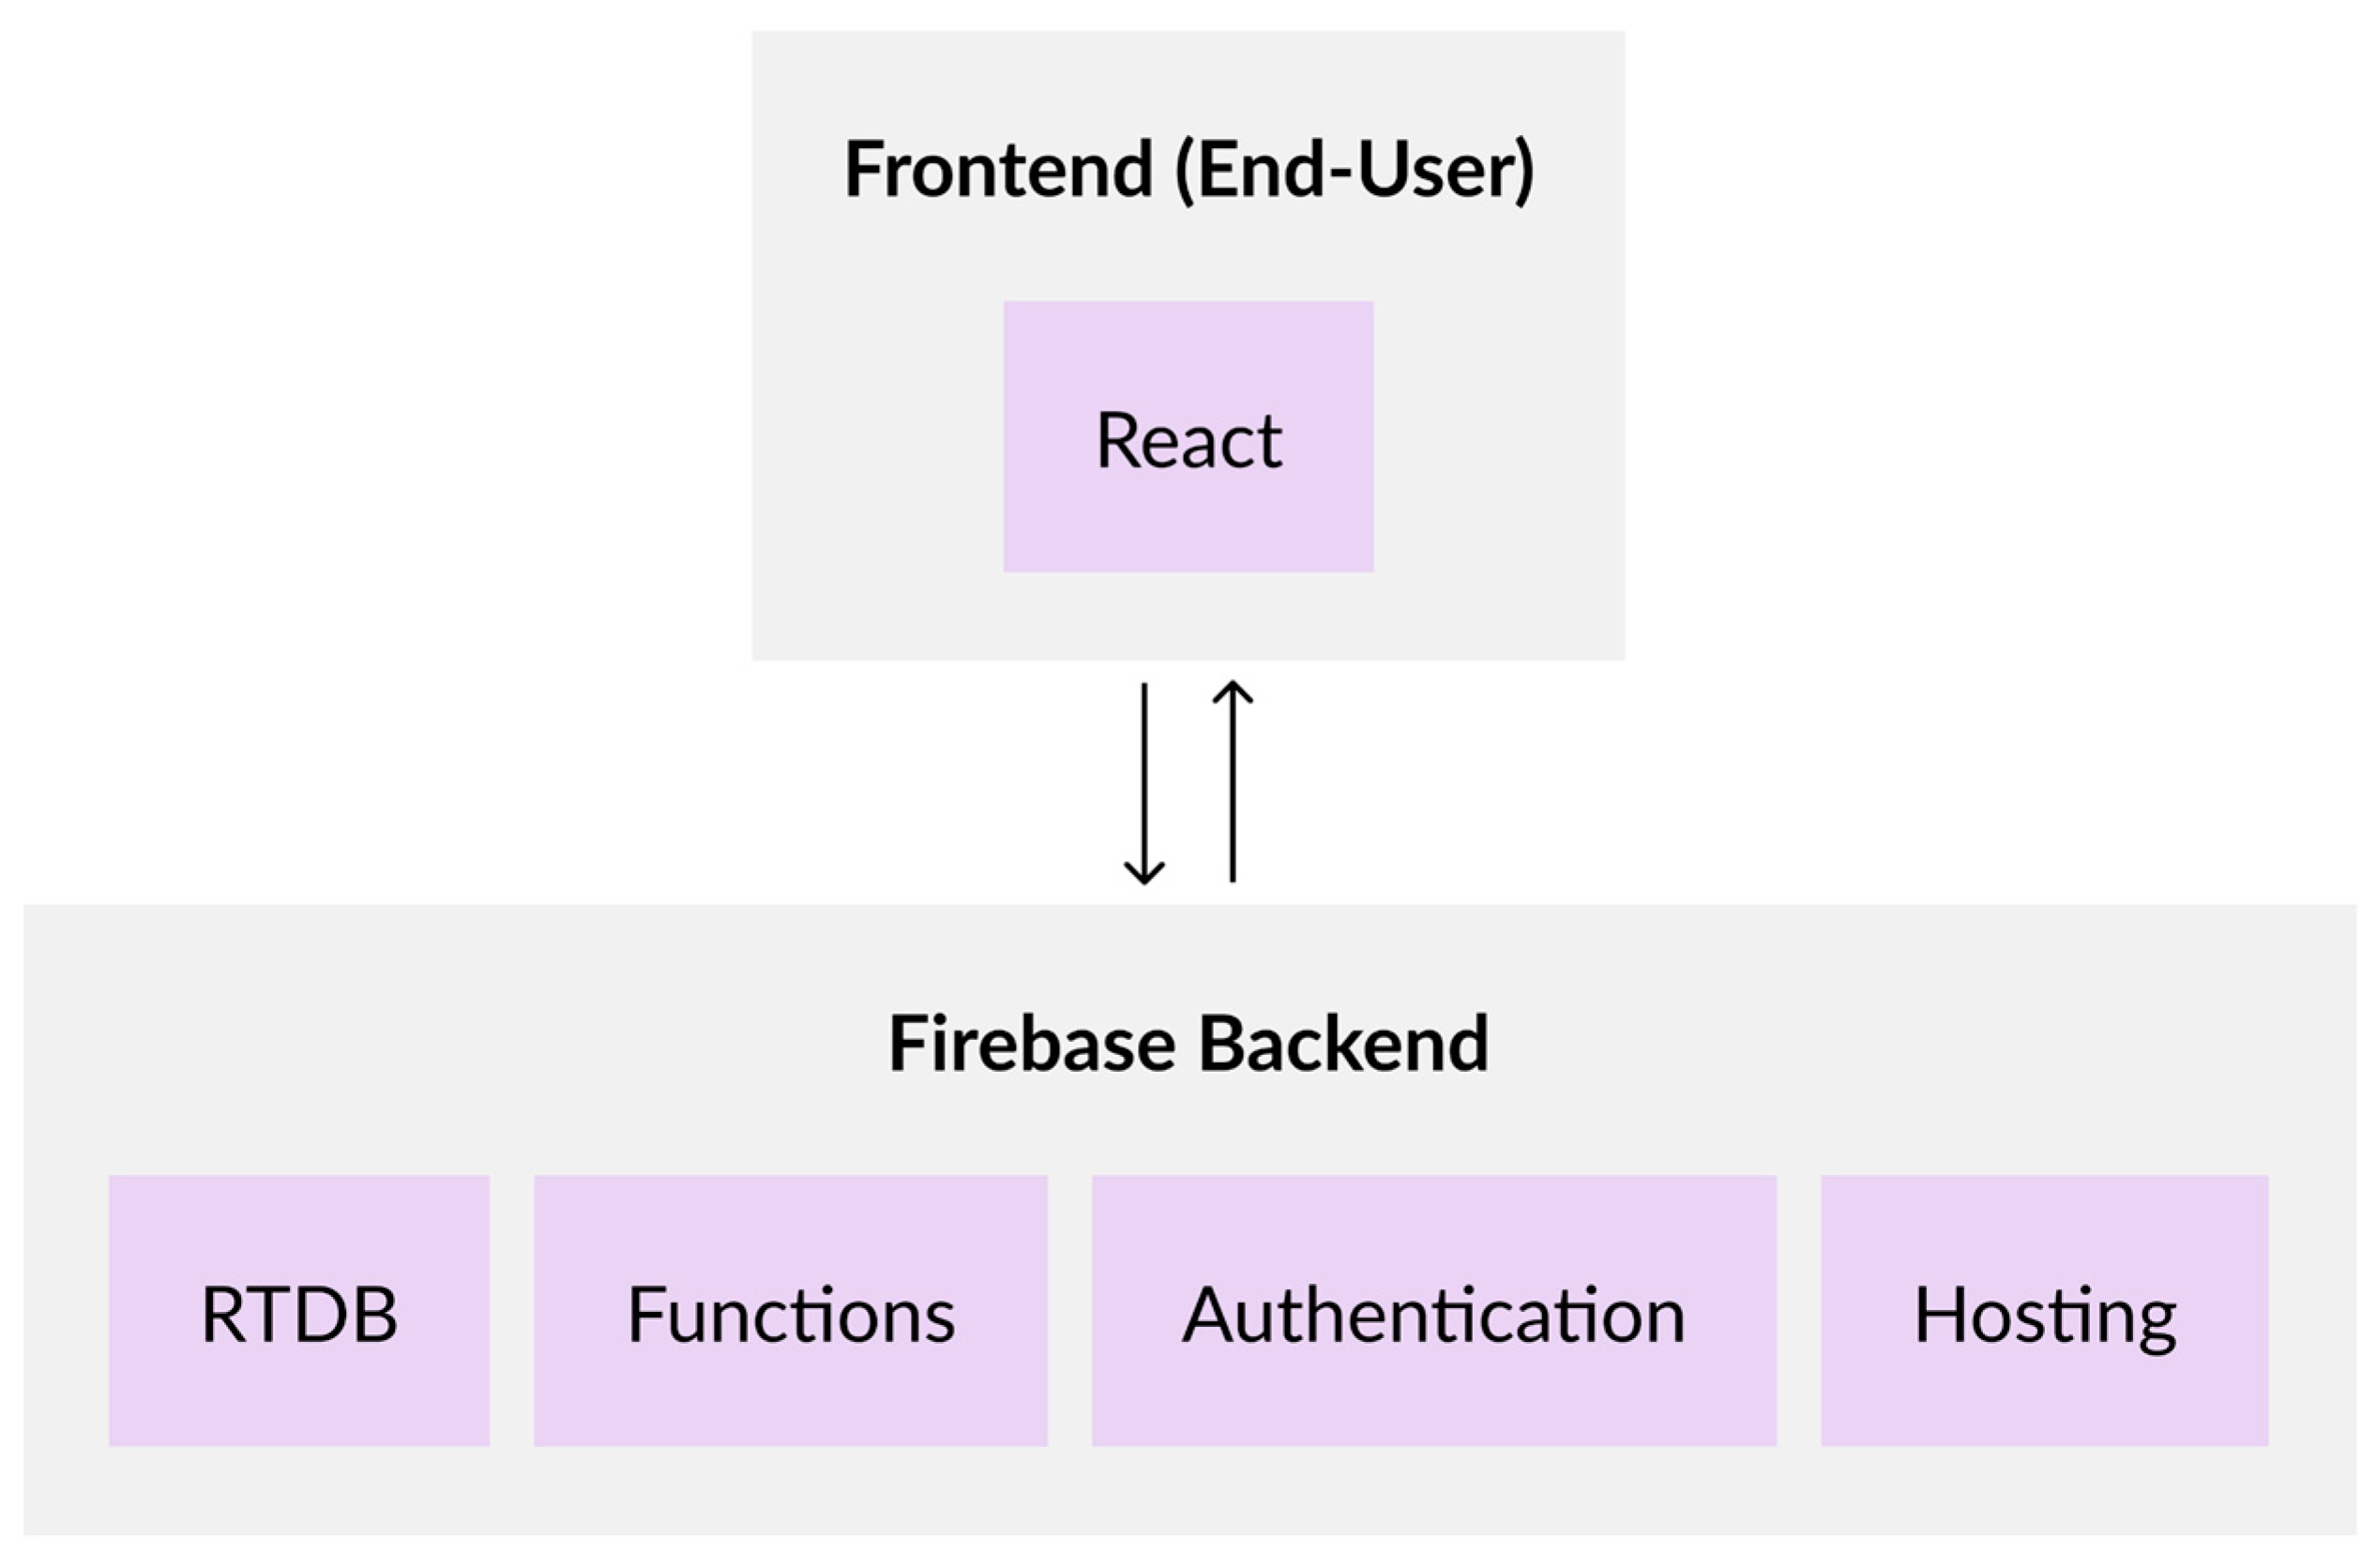
Figure A1 shows VulcanH’s architecture diagram. As it was implemented as a web application, we used React for the front-end interaction and Firebase for the back-end operations.
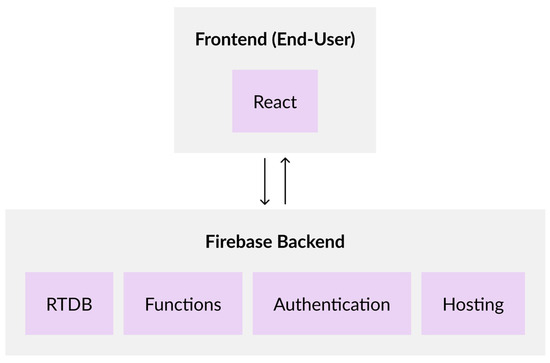
Figure A1.
VulcanH architecture diagram with arrows representing the flow of information.
Figure A1.
VulcanH architecture diagram with arrows representing the flow of information.
The planning dashboard’s main body lists all the mobile equipment of the mine, grouped by categories. Each piece of equipment is presented as a card with its identification number, status (available, broken, or in maintenance), remaining time before next planned maintenance, and whether the equipment is marked for maintenance. Additional equipment information may be shown by clicking on the respective card. This opens the equipment sheet (Figure A2), where users can evaluate the state of the equipment, obtain information on previous maintenance jobs or indications for future maintenance jobs, and can assess the remaining maintenance workload by analyzing the work orders table. The table is split between work orders for the next preventive maintenance and the backlog. Each work order has a priority which can either be 1 (immediate action required), 2 (execution in the current week), or 3 (job planned). The most important priority for maintenance planning is 3 because 1 and 2 represent unplanned jobs.
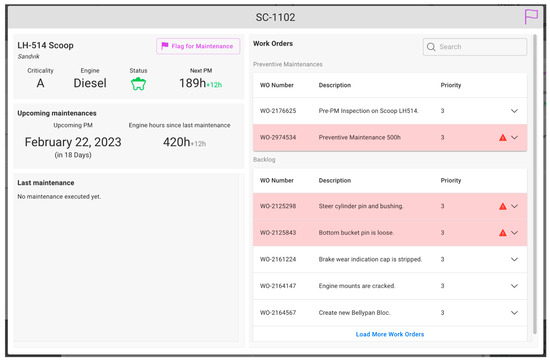
Figure A2.
Equipment sheet.
Figure A2.
Equipment sheet.
Work orders can be prioritized by clicking on the prioritization icon and selecting the planning priority desired (Figure A3). The planning priority constitutes a sub-priority which differs from a work order’s actual priority. Whereas a work order’s priority determines the lifecycle of the work order, its planning priority indicates when a work order should be scheduled. Some mines have implemented their own work order sub-priorities, for example by labeling a work order P3.1 to indicate a priority 3 work order with level 1 sub-priority. In the prototype, users have access to three planning priority levels:
- Level 0: No planning priority;
- Level 1: To be scheduled for next week;
- Level 2: To be scheduled in 2 to 3 weeks.
This reflects the common practices observed in Canadian Mines [10].
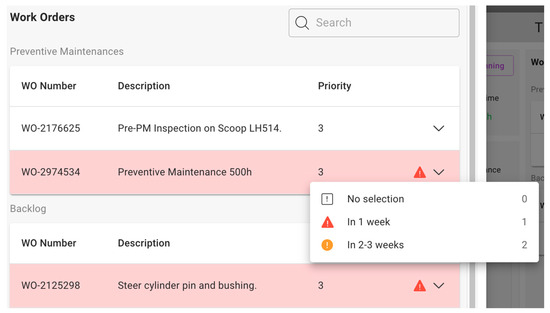
Figure A3.
Work order prioritization.
Figure A3.
Work order prioritization.
A user can flag a piece of equipment for maintenance by clicking on the respective button or on the purple flag on the sheet’s header (Figure A4).

Figure A4.
Maintenance flagging.
Figure A4.
Maintenance flagging.

From the scheduling view, the user can view a maintenance’s scheduled work orders by clicking on the equipment header’s arrow in the calendar. It is also possible to change an equipment’s bay by dragging the calendar’s entry header on the wanted bay. The same action is used to remove an equipment from the calendar if the equipment is dragged towards the initial left panel. Additionally, the user can modify the maintenance’s start time by dragging horizontally on the calendar entry. When adding an equipment to the calendar, the work orders selection screen opens (Figure A5).
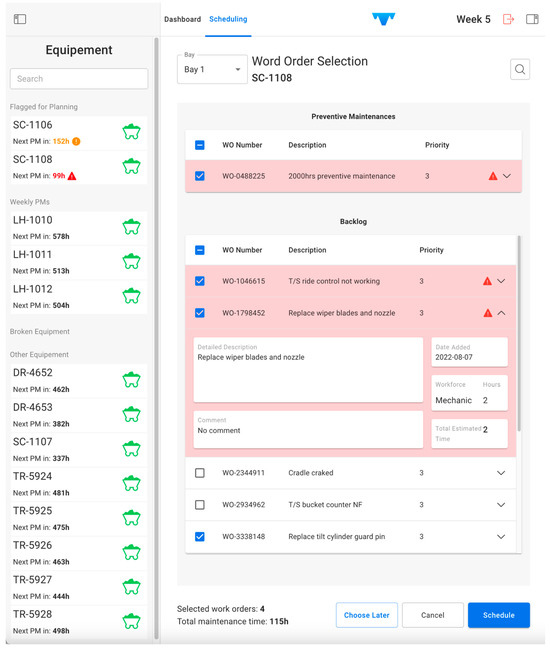
Figure A5.
Work order selection.
Figure A5.
Work order selection.
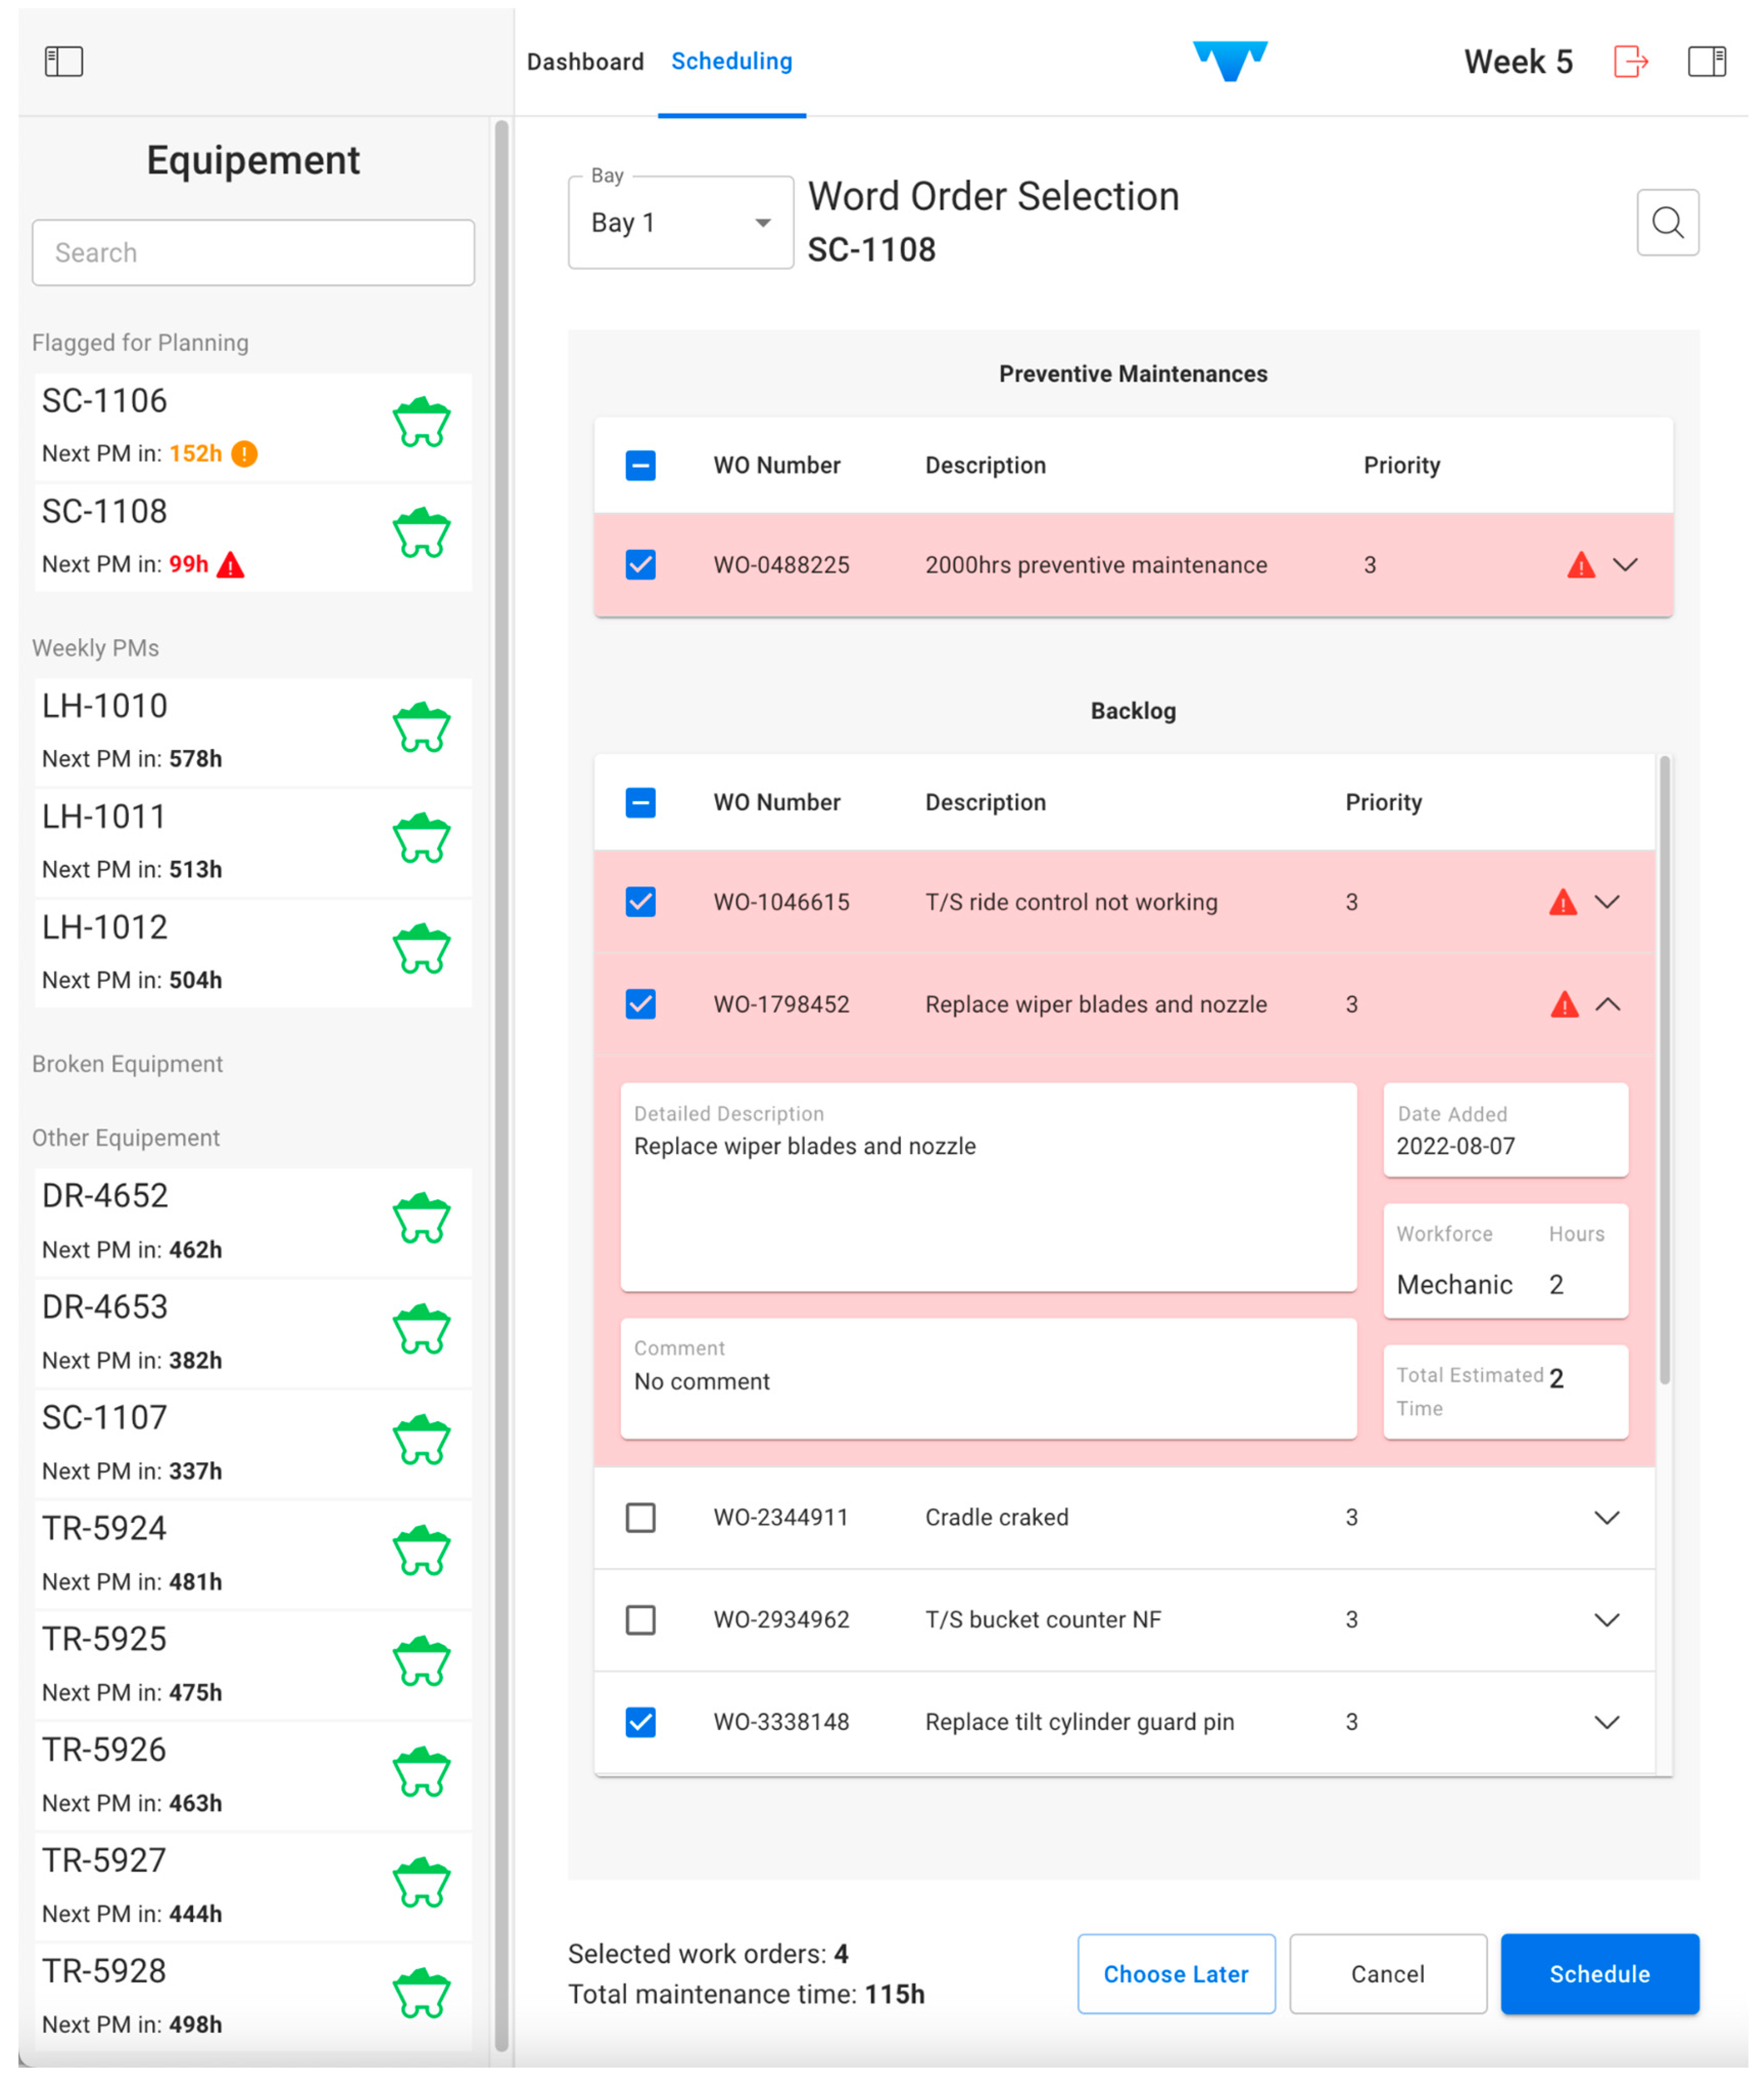
Users can select work orders to add to the schedule and information on total stoppage time is presented on the bottom left corner of the screen. Clicking on the blue “Schedule” button will add the maintenance to the calendar.
Appendix C
Table A2 displays the questions adapted from the original RIS [58] to fit the needs of our study.

Table A2.
RIS Questionnaire.
Table A2.
RIS Questionnaire.
| # | Question |
|---|---|
| 1 | If I had my way, I would NOT let the system have any influence over important scheduling issues. (Reverse-coded) |
| 2 | I would be comfortable giving the system complete responsibility for the planning of maintenance. |
| 3 | I really wish I had a good way to monitor the decisions of the system. (Reverse-coded) |
| 4 | I would be comfortable allowing the system to implement the schedule, even if I could not monitor it. |
| 5 | I would rely on the system without hesitation. |
| 6 | I think using the system will lead to positive outcomes. |
| 7 | I would feel comfortable relying on the system in the future. |
| 8 | When the task was hard, I felt like I could depend on the system. |
| 9 | If I were facing a very hard task in the future, I would want to have this system with me. |
| 10 | I would be comfortable allowing this system to make all decisions. |
References
- Ben-Daya, M.; Kumar, U.; Murthy, D.N.P. Introduction to Maintenance Engineering: Modelling, Optimization and Management; John Wiley & Sons: New York, NY, USA, 2016; Available online: http://ebookcentral.proquest.com/lib/polymtl-ebooks/detail.action?docID=4432246 (accessed on 18 January 2023).
- Choudhary, B. A Brief History of CMMS and How It Changed the Maintenance Management? FieldCircle. Available online: https://www.fieldcircle.com/articles/history-of-cmms/ (accessed on 18 January 2023).
- Choudhary, B. Top 18 Industries That Benefits from Implementing CMMS Software. FieldCircle. Available online: https://www.fieldcircle.com/articles/cmms-software-industries-benefits/ (accessed on 18 January 2023).
- Dudley, S. What Is CMMS? Absolutely Everything you Need to Know. IBM Business Operations Blog. Available online: https://www.ibm.com/blogs/internet-of-things/iot-history-cmms/ (accessed on 18 January 2023).
- IBM. What Is a CMMS? Definition, How It Works and Benefits | IBM. IBM. Available online: https://www.ibm.com/topics/what-is-a-cmms (accessed on 18 January 2023).
- Pintelon, L.; Parodi-Herz, A. Maintenance: An Evolutionary Perspective. In Complex System Maintenance Handbook; Kobbacy, K.A.H., Murthy, D.N.P., Eds.; Springer Series in Reliability Engineering; Springer: London, UK, 2008; pp. 21–48. [Google Scholar] [CrossRef]
- Labib, A. Computerised Maintenance Management Systems. In Complex System Maintenance Handbook; Kobbacy, K.A.H., Murthy, D.N.P., Eds.; Springer Series in Reliability Engineering; Springer: London, UK, 2008; pp. 417–435. [Google Scholar] [CrossRef]
- Mahlamäki, K.; Nieminen, M. Analysis of manual data collection in maintenance context. J. Qual. Maint. Eng. 2019, 26, 104–119. [Google Scholar] [CrossRef]
- Boznos, D. The Use of Computerised Maintenance Management systems to Support Team-Based Maintenance. 1998. Available online: https://dspace.lib.cranfield.ac.uk/handle/1826/11133 (accessed on 20 January 2023).
- Simard, S.R.; Gamache, M.; Doyon-Poulin, P. Current Practices for Preventive Maintenance and Expectations for Predictive Maintenance in East-Canadian Mines. Mining 2023, 3, 26–53. [Google Scholar] [CrossRef]
- Lemma, Y. CMMS benchmarking development in mining industries. In Proceedings of the 2nd International Workshop and Congress on eMaintenance, Luleå, Sweden, 12–14 December 2012. [Google Scholar]
- Campbell, J.D.; Reyes-Picknell, J.V.; Kim, H.S. Uptime: Strategies for Excellence in Maintenance Management, 3rd ed.; CRC Press: Boca Raton, FL, USA, 2015. [Google Scholar]
- Basri, E.I.; Razak, I.H.A.; Ab-Samat, H.; Kamaruddin, S. Preventive maintenance (PM) planning: A review. J. Qual. Maint. Eng. 2017, 23, 114–143. [Google Scholar] [CrossRef]
- Wang, K. Intelligent Predictive Maintenance (IPdM) System—Industry 4.0 Scenario, WIT Transactions on Engineering Sciences. 2016. Available online: https://www.semanticscholar.org/paper/Intelligent-Predictive-Maintenance-(-IPdM-)-System-Wang/f84a9c62aa15748024c7094179545fa534b70eeb (accessed on 6 February 2023).
- Li, Z.; Wang, Y.; Wang, K.-S. Intelligent predictive maintenance for fault diagnosis and prognosis in machine centers: Industry 4.0 scenario. Adv. Manuf. 2017, 5, 377–387. [Google Scholar] [CrossRef]
- Richard, C.; Tse, P.; Ling, L.; Fung, F. Enhancement of maintenance management through benchmarking. J. Qual. Maint. Eng. 2000, 6, 224–240. [Google Scholar] [CrossRef]
- Silva, F.J.d.S.; Viana, H.R.G.; Queiroz, A.N.A. Availability forecast of mining equipment. J. Qual. Maint. Eng. 2016, 22, 418–432. [Google Scholar] [CrossRef]
- Almomani, M.; Abdelhadi, A.; Seifoddini, H.; Xiaohang, Y. Preventive maintenance planning using group technology: A case study at Arab Potash Company, Jordan. J. Qual. Maint. Eng. 2012, 18, 472–480. [Google Scholar] [CrossRef]
- Kimera, D.; Nangolo, F.N. Maintenance practices and parameters for marine mechanical systems: A review. J. Qual. Maint. Eng. 2019, 26, 459–488. [Google Scholar] [CrossRef]
- Christiansen, B. Exploring Biggest Maintenance Challenges in the Mining Industry. mining.com. Available online: https://www.mining.com/web/exploring-biggest-maintenance-challenges-mining-industry/ (accessed on 29 November 2022).
- Lewis, M.W.; Steinberg, L. Maintenance of mobile mine equipment in the information age. J. Qual. Maint. Eng. 2001, 7, 264–274. [Google Scholar] [CrossRef]
- Topal, E.; Ramazan, S. A new MIP model for mine equipment scheduling by minimizing maintenance cost. Eur. J. Oper. Res. 2010, 207, 1065–1071. [Google Scholar] [CrossRef]
- Lafontaine, E. Méthodes et Mesures pour L’évaluation de la Performance et de L’efficacité des Équipements Miniers de Production. Ph.D. Thesis, Université Laval, Québec, QC, Canada, 2006. Available online: https://www.collectionscanada.gc.ca/obj/s4/f2/dsk3/QQLA/TC-QQLA-23714.pdf (accessed on 6 May 2024).
- Ben-Daya, M.; Kumar, U.; Murthy, D.P. Computerized Maintenance Management Systems and e-Maintenance. In Introduction to Maintenance Engineering: Modeling, Optimization, and Management, 1st ed.; Wiley: Hoboken, NJ, USA, 2016. [Google Scholar] [CrossRef]
- ISO 9241-210:2019; Ergonomics of Human-System Interaction–Part 210: Human-Centred Design for Interactive Systems. International Organization for Standardization: Geneva, Switzerland, 2019. Available online: https://www.iso.org/standard/77520.html (accessed on 13 February 2021).
- Brooke, J. SUS: A ‘Quick and Dirty’ Usability Scale. Usability Eval. Ind. 1996, 189, 4–7. [Google Scholar]
- Lewis, J.R. The System Usability Scale: Past, Present, and Future. Int. J. Human–Computer Interact. 2018, 34, 577–590. [Google Scholar] [CrossRef]
- Lewis, J.R. IBM computer usability satisfaction questionnaires: Psychometric evaluation and instructions for use. Int. J. Human–Computer Interact. 1995, 7, 57–78. [Google Scholar] [CrossRef]
- Finstad, K. The Usability Metric for User Experience. Interact. Comput. 2010, 22, 323–327. [Google Scholar] [CrossRef]
- Lewis, J.R.; Utesch, B.S.; Maher, D.E. UMUX-LITE: When there’s no time for the SUS. In Proceedings of the SIGCHI Conference on Human Factors in Computing Systems, Paris France, 27 April–2 May 2013; ACM: New York, NY, USA, 2013; pp. 2099–2102. [Google Scholar] [CrossRef]
- Laugwitz, B.; Held, T.; Schrepp, M. Construction and Evaluation of a User Experience Questionnaire. In HCI and Usability for Education and Work; Holzinger, A., Ed.; Springer: Berlin/Heidelberg, Germany, 2008; pp. 63–76. ISBN 978-3-540-89349-3. [Google Scholar] [CrossRef]
- Schrepp, M.; Thomaschewski, J. Design and Validation of a Framework for the Creation of User Experience Questionnaires. Int. J. Interact. Multimed. Artif. Intell. 2019, 5, 88–95. [Google Scholar] [CrossRef]
- Mirel, B. Usefulness: Focusing on Inquiry Patterns, Task Landscapes, and Core Activities. In Interaction Design for Complex Problem Solving; Mirel, B., Ed.; Interactive Technologies; Morgan Kaufmann: Burlington, MA, USA, 2004; pp. 31–63. [Google Scholar] [CrossRef]
- Redish, J. Expanding Usability Testing to Evaluate Complex Systems. J. Usability Stud. 2007, 2, 102–111. [Google Scholar]
- Norros, L.; Savioja, P. Towards a theory and method for usability evaluation of complex human-technology systems. Activites 2007, 4, 143–150. [Google Scholar] [CrossRef]
- Alves, F.; Badikyan, H.; Moreira, H.A.; Azevedo, J.; Moreira, P.M.; Romero, L.; Leitao, P. Deployment of a Smart and Predictive Maintenance System in an Industrial Case Study. In Proceedings of the 2020 IEEE 29th International Symposium on Industrial Electronics (ISIE), Delft, The Netherlands, 17–19 June 2020; pp. 493–498. [Google Scholar]
- Poppe, S. Design of a Low-Fidelity Prototype Interface for a Computerised Maintenance Management System: A Case Study for Thales B.V. Master’s Thesis, Hengelo University of Twente, Enschede, The Netherlands, 2021; p. 89. [Google Scholar]
- Rajšp, A.; Horng-Jyh, P.W.; Beranič, T.; Heričko, M. Impact of an Introductory ERP Simulation Game on the Students’ Perception of SAP Usability. In Learning Technology for Education Challenges; Uden, L., Liberona, D., Ristvej, J., Eds.; Communications in Computer and Information Science; Springer International Publishing: Cham, Switzerland, 2018; pp. 48–58. [Google Scholar] [CrossRef]
- Wang, C.; Li, H.; Yap, J.B.H.; Khalid, A.E. Systemic Approach for Constraint-Free Computer Maintenance Management System in Oil and Gas Engineering. J. Manag. Eng. 2019, 35, 3–4. [Google Scholar] [CrossRef]
- Tretten, P.; Karim, R. Enhancing the usability of maintenance data management systems. J. Qual. Maint. Eng. 2014, 20, 290–303. [Google Scholar] [CrossRef]
- Antonovsky, A.; Pollock, C.; Straker, L. System reliability as perceived by maintenance personnel on petroleum production facilities. Reliab. Eng. Syst. Saf. 2016, 152, 58–65. [Google Scholar] [CrossRef]
- Aslam-Zainudeen, N.; Labib, A. Practical application of the Decision Making Grid (DMG). J. Qual. Maint. Eng. 2011, 17, 138–149. [Google Scholar] [CrossRef]
- Fernandez, O.; Labib, A.W.; Walmsley, R.; Petty, D.J. A decision support maintenance management system: Development and implementation. Int. J. Qual. Reliab. Manag. 2003, 20, 965–979. [Google Scholar] [CrossRef]
- Labib, A.W. A decision analysis model for maintenance policy selection using a CMMS. J. Qual. Maint. Eng. 2004, 10, 191–202. [Google Scholar] [CrossRef]
- Jamkhaneh, H.B.; Pool, J.K.; Khaksar, S.M.S.; Arabzad, S.M.; Kazemi, R.V. Impacts of computerized maintenance management system and relevant supportive organizational factors on total productive maintenance. Benchmarking Int. J. 2018, 25, 2230–2247. [Google Scholar] [CrossRef]
- Mazloumi, S.H.H.; Moini, A.; Kermani, M.A.M.A. Designing synchronizer module in CMMS software based on lean smart maintenance and process mining. J. Qual. Maint. Eng. 2022, 29, 509–529. [Google Scholar] [CrossRef]
- Wandt, K.; Tretten, P.; Karim, R. Usability aspects of eMaintenance solutions. In Proceedings of the International Workshop and Congress on eMaintenance, Luleå, Sweden, 12–14 December 2012; Luleå Tekniska Universitet: Luleå, Sweden, 2012; pp. 77–84. [Google Scholar]
- Wickens, C. Aviation. In Handbook of Applied Cognition; John Wiley & Sons, Ltd.: Hoboken, NJ, USA, 2007; pp. 361–389. [Google Scholar] [CrossRef]
- Lyons, J.B.; Koltai, K.S.; Ho, N.T.; Johnson, W.B.; Smith, D.E.; Shively, R.J. Engineering Trust in Complex Automated Systems. Ergon. Des. Q. Hum. Factors Appl. 2016, 24, 13–17. [Google Scholar] [CrossRef]
- Bayer, S.; Gimpel, H.; Markgraf, M. The role of domain expertise in trusting and following explainable AI decision support systems. J. Decis. Syst. 2021, 32, 110–138. [Google Scholar] [CrossRef]
- Holzinger, A.; Biemann, C.; Pattichis, C.S.; Kell, D.B. What do we need to build explainable AI systems for the medical domain? arXiv 2017, arXiv:1712.09923. [Google Scholar]
- Holzinger, A.; Langs, G.; Denk, H.; Zatloukal, K.; Müller, H. Causability and explainability of artificial intelligence in medicine. WIREs Data Min. Knowl. Discov. 2019, 9, e1312. [Google Scholar] [CrossRef]
- Holzinger, A.; Carrington, A.; Müller, H. Measuring the Quality of Explanations: The System Causability Scale (SCS). Comparing Human and Machine Explanations. Künstl. Intell. 2020, 34, 193–198. [Google Scholar] [CrossRef]
- Reeves, B.; Nass, C. The Media Equation: How People Treat Computers, Television, and New Media like Real People and Pla; Bibliovault OAI Repository; The University of Chicago Press: Chicago, IL, USA, 1996. [Google Scholar]
- Mayer, R.C.; Davis, J.H.; Schoorman, F.D. An Integrative Model of Organizational Trust. Acad. Manag. Rev. 1995, 20, 709. [Google Scholar] [CrossRef]
- Lee, J.D.; See, K.A. Trust in Automation: Designing for Appropriate Reliance. Hum. Factors J. Hum. Factors Ergon. Soc. 2004, 46, 50–80. [Google Scholar] [CrossRef] [PubMed]
- Kohn, S.C.; de Visser, E.J.; Wiese, E.; Lee, Y.-C.; Shaw, T.H. Measurement of Trust in Automation: A Narrative Review and Reference Guide. Front. Psychol. 2021, 12, 604977. [Google Scholar] [CrossRef] [PubMed]
- Lyons, J.B.; Guznov, S.Y. Individual differences in human–machine trust: A multi-study look at the perfect automation schema. Theor. Issues Ergon. Sci. 2018, 20, 440–458. [Google Scholar] [CrossRef]
- Calhoun, C.S.; Bobko, P.; Gallimore, J.J.; Lyons, J.B. Linking precursors of interpersonal trust to human-automation trust: An expanded typology and exploratory experiment. J. Trust. Res. 2019, 9, 28–46. [Google Scholar] [CrossRef]
- Lyons, J.B.; Vo, T.; Wynne, K.T.; Mahoney, S.; Nam, C.S.; Gallimore, D. Trusting Autonomous Security Robots: The Role of Reliability and Stated Social Intent. Hum. Factors: J. Hum. Factors Ergon. Soc. 2021, 63, 603–618. [Google Scholar] [CrossRef] [PubMed]
- Croijmans, I.; van Erp, L.; Bakker, A.; Cramer, L.; Heezen, S.; Van Mourik, D.; Weaver, S.; Hortensius, R. No Evidence for an Effect of the Smell of Hexanal on Trust in Human–Robot Interaction. Int. J. Soc. Robot. 2022, 15, 1429–1438. [Google Scholar] [CrossRef] [PubMed]
- Lin, J.; Panganiban, A.R.; Matthews, G.; Gibbins, K.; Ankeney, E.; See, C.; Bailey, R.; Long, M. Trust in the Danger Zone: Individual Differences in Confidence in Robot Threat Assessments. Front. Psychol. 2022, 13, 601523. [Google Scholar] [CrossRef]
- Lyons, J.B.; Jessup, S.A.; Vo, T.Q. The Role of Decision Authority and Stated Social Intent as Predictors of Trust in Autonomous Robots. Top. Cogn. Sci. 2022, 10–12. [Google Scholar] [CrossRef]
- Chita-Tegmark, M.; Law, T.; Rabb, N.; Scheutz, M. Can You Trust Your Trust Measure? In Proceedings of the 2021 ACM/IEEE International Conference on Human-Robot Interaction, in HRI ’21, Boulder, CO, USA, 8–11 May 2021; Association for Computing Machinery: New York, NY, USA, 2021; pp. 92–100. [Google Scholar] [CrossRef]
- Schaefer, K. Measuring Trust in Human Robot Interactions: Development of the ‘Trust Perception Scale-HRI’; Springer: Boston, MA, USA, 2016; pp. 191–218. [Google Scholar] [CrossRef]
- Ullman, D.; Malle, B.F. What Does it Mean to Trust a Robot?: Steps Toward a Multidimensional Measure of Trust. In Proceedings of the HRI ’18: Companion of the 2018 ACM/IEEE International Conference on Human-Robot Interaction, Chicago, IL, USA, 5–8 March 2018; pp. 263–264. [Google Scholar]
- Agnico Eagle. Agnico Eagle Mines Limited—Operations—Operations—LaRonde Complex. Available online: https://www.agnicoeagle.com/English/operations/operations/laronde/default.aspx (accessed on 18 October 2022).
- Annual Report 2021; IAMGOLD Corporation: Toronto, ON, Canada, 2021.
- Stornoway Diamonds. Stornoway Diamonds—Our Business—Renard Mine. Available online: http://www.stornowaydiamonds.com/English/our-business/renard-mine/default.html (accessed on 18 October 2022).
- Agnico Eagle. Agnico Eagle Mines Limited—Operations—Operations—Meliadine. Available online: https://www.agnicoeagle.com/English/operations/operations/meliadine/default.aspx (accessed on 18 October 2022).
- Lallemand, C.; Gronier, G. Méthodes de design UX: 30 Méthodes Fondamentales Pour Concevoir et Évaluer les Systèmes Interactifs; Éditions Eyrolles: Paris, France, 2018. [Google Scholar]
- Schrepp, M. User Experience Questionnaire Handbook; ResearchGate: Hockenheim, Germany, 2015. [Google Scholar]
- Taber, K.S. The Use of Cronbach’s Alpha When Developing and Reporting Research Instruments in Science Education. Res. Sci. Educ. 2018, 48, 1273–1296. [Google Scholar] [CrossRef]
- Theodorou, P.; Tsiligkos, K.; Meliones, A.; Filios, C. A Training Smartphone Application for the Simulation of Outdoor Blind Pedestrian Navigation: Usability, UX Evaluation, Sentiment Analysis. Sensors 2022, 23, 367. [Google Scholar] [CrossRef] [PubMed]
- Sauro, J. Measuring Usability with the System Usability Scale (SUS)—MeasuringU. Available online: https://measuringu.com/sus/ (accessed on 14 December 2022).
- Montaño Guerrero, H.A.; Alamo Sandoval, F.E. Análisis de la Experiencia de Usuario de los Estudiantes de la Ficsa Utilizando el Cuestionario de Experiencia de USUARIO (Ueq+) en el Sistema Servicios en Línea para la Gestión Universitaria; Universidad Nacional Pedro Ruiz Gallo: Lambayeque, Peru, 2021; Available online: http://repositorio.unprg.edu.pe/handle/20.500.12893/9386 (accessed on 24 January 2023).
- Guznov, S.; Lyons, J.; Nelson, A.; Woolley, M. The Effects of Automation Error Types on Operators’ Trust and Reliance. In Virtual, Augmented and Mixed Reality; Lackey, S., Shumaker, R., Eds.; Lecture Notes in Computer Science; Springer International Publishing: Cham, Switzerland, 2016; pp. 116–124. [Google Scholar] [CrossRef]
Disclaimer/Publisher’s Note: The statements, opinions and data contained in all publications are solely those of the individual author(s) and contributor(s) and not of MDPI and/or the editor(s). MDPI and/or the editor(s) disclaim responsibility for any injury to people or property resulting from any ideas, methods, instructions or products referred to in the content. |
© 2024 by the authors. Licensee MDPI, Basel, Switzerland. This article is an open access article distributed under the terms and conditions of the Creative Commons Attribution (CC BY) license (https://creativecommons.org/licenses/by/4.0/).

