Article

Toward Automatic Monitoring for Anomaly Detection in Open-Pit Phosphate Mines Using Artificial Vision: A Case Study of the Screening Unit

1
Engineering Research Laboratory (LRI), Networks Embedded Systems and Telecommunications Team (NEST), National and High School of Electricity and Mechanic (ENSEM), Hassan II University of Casablanca, 5366 Maarif, Casablanca 8118, Morocco
2
Research Foundation for Development and Innovation in Science and Engineering (FRDISI), Casablanca 20100, Morocco
3
Analytics Laboratory, Mohammed VI Polytechnic University (UM6P), Ben Guerir 43150, Morocco
4
Optics Laboratory, National Institute of Posts and Telecommunications (INPT), Av. Allal Al Fassi, Madinat Al Irfane, Rabat 10000, Morocco
*
Author to whom correspondence should be addressed.
Mining 2023, 3(4), 645-658; https://doi.org/10.3390/mining3040035
Submission received: 16 September 2023 / Revised: 16 October 2023 / Accepted: 18 October 2023 / Published: 20 October 2023
(This article belongs to the Special Issue Envisioning the Future of Mining)

Abstract

:
Phosphorus is a limited resource that is non-replaceable worldwide. Its significant role as a fertilizer underlines the necessity for prudent and strategic management. The adequate monitoring of the phosphate extraction process mitigates anything that can influence the quantity or quality of the product. The phosphate extraction process’s most important phase is the screening unit, which can be used to separate phosphate minerals from unwanted materials. Nevertheless, it encounters several anomalies and malfunctions that influence the performance of the whole chain. This unit requires continuous automated control to avoid any blockages or risks caused by malfunctions. Using artificial intelligence and image processing techniques, the main goal of the investigations described in this paper was to evaluate the performances of machine-learning and deep-learning models to detect the screening unit malfunction in the open pit of the phosphate mine in Benguerir-Morocco. These findings highlight that the CNN and HOG-based models are the most suitable and accurate for the given case study.

1. Introduction

The phosphate industry is one of the most essential industries in the world since phosphorus is an irreplaceable resource in agriculture and, at the same time, it is limited in terms of availability [1]. The phosphorus fertilizer is in high demand for crop production [2,3,4] because its use can improve yields by up to 50% [5]. Phosphorus fertilizers consume more than 80% of the phosphorus produced. Otherwise, phosphorus and its compounds are used in animal feed, detergents, and operations for metal processing [2]. Therefore, this resource must be managed adequately to prevent or at least minimize future supply limitations. A part of this stewardship plan is to perform quality control analyses through real-time monitoring to ensure the final product’s quality and improve extraction yields.
Manual monitoring is more than monotone and leads to errors that are overlooked by humans; it is also often impractical, even as production volume increases, not to mention costly. In fact, the surveillance officer can only maintain an acceptable level of attention for up to 20 min when observing and analyzing video surveillance monitors and can keep an attentive eye on 9 to 12 cameras for up to 15 min [6]. Thus, intelligent video surveillance systems could provide a solution to the limitations of manual human monitoring. This kind of intelligent system is one of the primary objectives of the Fourth Industrial Revolution.
Thus, constructing intelligent plants to modernize manufacturing processes is key to innovation, growth, and sustainable profitability. Several works have explored various aspects of intelligent monitoring. For example, in our specific context, work [7] presents a complete system that was designed to facilitate the condition monitoring of railway tunnels by structural examiners. This technology increases accuracy and robustness while reducing the time required for visual inspection. On the other hand, ref. [8] illustrates an example of intelligent video surveillance that was designed to automatically detect hex head bolts used to fasten rails to sleepers. This system is based on MLPNC (Multi-Layer Perceptron Neural Classifier) and FPGA (Field-Programmable Gate Array) technologies. Ref. [9] classifies the current mining applications of UAVs (Unmanned Aerial Vehicles) from exploration to reclamation. At the same time, video surveillance has been used in the mining context to anticipate risks and improve mining safety and productivity, as shown in the work [10]. The latter proposes a hybrid CNN-LSTM (convolutional neural networks and long short-term memory networks) prediction model to accurately anticipate miners’ health quality index and CH4 gas concentration. Finally, paper [11] presents a model to automatically identify and monitor open-pit mines in Hubei province, China, by exploiting Gaofen-2 and Google Earth satellite data using the R-CNN (region convolutional neural network) and transfer learning. These works contribute substantially to the progress of intelligent monitoring in different areas. However, notable gaps remain in the intelligent monitoring of the phosphate production chain associated with its unique challenges. Our research seeks to fill these gaps and provide insights into the specific challenges of the phosphate screening unit, which fundamentally influences the entire production process. This monitoring offers multiple benefits by automating the control of the screening unit and detecting anomalies, thereby considerably improving the yield of the phosphate production chain. Simultaneously, it significantly reduces machine maintenance costs, representing a significant financial advantage for mining operations.
Thus, we aim to provide a reliable and effective video surveillance system that can detect malfunctions in the Benguerir phosphate mine screening unit using computer vision and artificial intelligence tools. In previous works [12,13], we demonstrated that certain models provide enhanced results in the classification of anomalies within the screening unit. However, in this work, we extended our investigation by evaluating additional techniques known for their robustness in anomaly classifications. Our aim was to identify the most effective models capable of maintaining their performance in the presence of various future perturbations. The rest of this paper is organized as follows: Section 2 illustrates phosphate industry malfunctions/anomalies in the Benguerir mining site and their consequences, explaining the need for intelligent solutions. Section 3 explains the methods and materials. Section 4 presents the implementation process with the obtained results. Finally, we provide a discussion and then a conclusion.

2. Malfunctions of the Phosphate Production Chain in the Benguerir Mining Site

Morocco holds three-quarters of the world’s phosphate reserves, making it the world’s leading exporter with around a 1/3 of international trade, the world’s leading exporter of phosphoric acid (50% of the international market), and the world’s third largest phosphate producer. Despite its economic importance and beneficial effects, this status represents a major responsibility and a real challenge regarding the safeguarding of this resource against any loss or damage.
Malfunctions in any production process mean product loss, which negatively impacts the production line’s yield. In the phosphate industry, malfunctions and phosphate losses really affect ore recovery rates. There are two main sources of phosphate losses during mining [14]:
  • Project losses: there are losses of phosphate in places that have been abandoned and not mined; they involve the abandonment of phosphate levels whose mining generates very high ratios and is, therefore, economically unfeasible.
  • On-site losses: there are losses linked to different operational stages, from the kinematic chain that extracts the various phosphate layers to the final loading of the product.
At the Benguerir phosphate mine, operations begin with extracting phosphate layers, which consists of the following stages: drilling, blasting, stripping, and phosphate ore recovery. Once the ground has been drilled, explosives are placed in the holes and then blasted to reshape the ground and make it crumbly for easy stripping. Stripping is the operation that consists of removing the overburden or intervening layers to expose and recover the layer of ore to be exploited. Next, the ore (phosphate) is recovered once stripping is complete. The ore then undergoes a series of treatments, mainly destoning and screening, to reduce the quantity of waste rock and ensure the required product’s quality.
Ref. [14] presents the problems and losses encountered during phosphate ore recovery at the Benguerir mining site in Morocco. This paper highlights problems and losses in relation to staff qualifications and lack of supervision, as well as other challenges linked to the soil’s nature concerning the adaptation of equipment used, the encumbrance of impurities on the phosphate, and problems related to drilling, blasting, cleaning, and transport operations. Following the phosphate ore recovery operation, the phosphate ore beneficiation process begins. Effective beneficiation can be achieved through various processes, depending on the liberation size of phosphate, gangue minerals, and other ore specifications [13]. The screening operation is one of the most effective beneficiation processes used in the Benguerir mine. The screening station contains a certain number of screens, which are used to separate the phosphate minerals from unwanted materials. As part of this research project, we had the opportunity to visit the Benguerir site and received a detailed report on the various anomalies encountered at the phosphate screening station. This station has an intrinsic role, meaning that any dysfunction during this stage directly affects the overall effectiveness of the process.
The main problems encountered in the screening unit can be generalized into two primary anomalies: the abnormal presence of sterile stones on screens, which negatively impacts the quality of the final product, and the rejection of high-quality phosphate. Indeed, the machines cannot eliminate the stones mixed with the phosphate during the de-stoning operation. As a result, the stones that cannot be removed could block the hoppers’ opening in the main screening building and create a blockage in the production line that can last anywhere from half an hour to eight hours. The situation worsens when a poor phosphate ore layer is extracted. The screens overflow with waste rock contained in low-concentration phosphate ore. The screens may be unable to re-screen the product because the mesh is blocked. The existence of large quantities of phosphate mixed with waste rock is another malfunction that leads to the loss of large quantities of net product due to a delay in detecting the root cause of the problem. In some cases, the screens cannot filter all the material due to the high flow rate of the material. Figure 1 presents images illustrating malfunctions occurring in the screening unit at the Benguerir site.
These malfunctions affect the screening process in several ways, with infiltrated sterile stones producing a direct negative impact on (i) safety, (ii) production yield due to machine stoppages and micro-stoppages, (iii) machine life due to the vibrations produced by large stones, which have an impact on maintenance costs, and (iv) the loss of production caused by the passage of material to screen rejection.
Generally, the gravity of all these malfunctions lies in a delay in detection, resulting in ineffective intervention by the maintenance department. Therefore, the screening operation must undergo quality control analyses via real-time monitoring using surveillance cameras and intelligent computer vision and machine-learning techniques to automate surveillance and anomaly detection.

3. Materials and Methods

3.1. Method

The choice of monitoring method is mainly based on the information available in the system. Empirical feedback is represented by system expertise, historical data recorded after using the system under various conditions, physical models derived from a basic understanding of the system, and the physics of the system, expressed as a mathematical function in relational form [15]. There are two categories of monitoring approaches: model-based and data-based.
Model-based detection and diagnosis offer a description of dynamic behavior and a better physical understanding of the system, which is a major advantage. However, in practice, it is very difficult to develop an accurate mathematical model that considers the different sources of uncertainty due to the complexity of systems. The model-based approach is generally applied on the assumption that only simple failures occur. However, when a large amount of historical data are available, data-driven approaches are a good alternative [16].
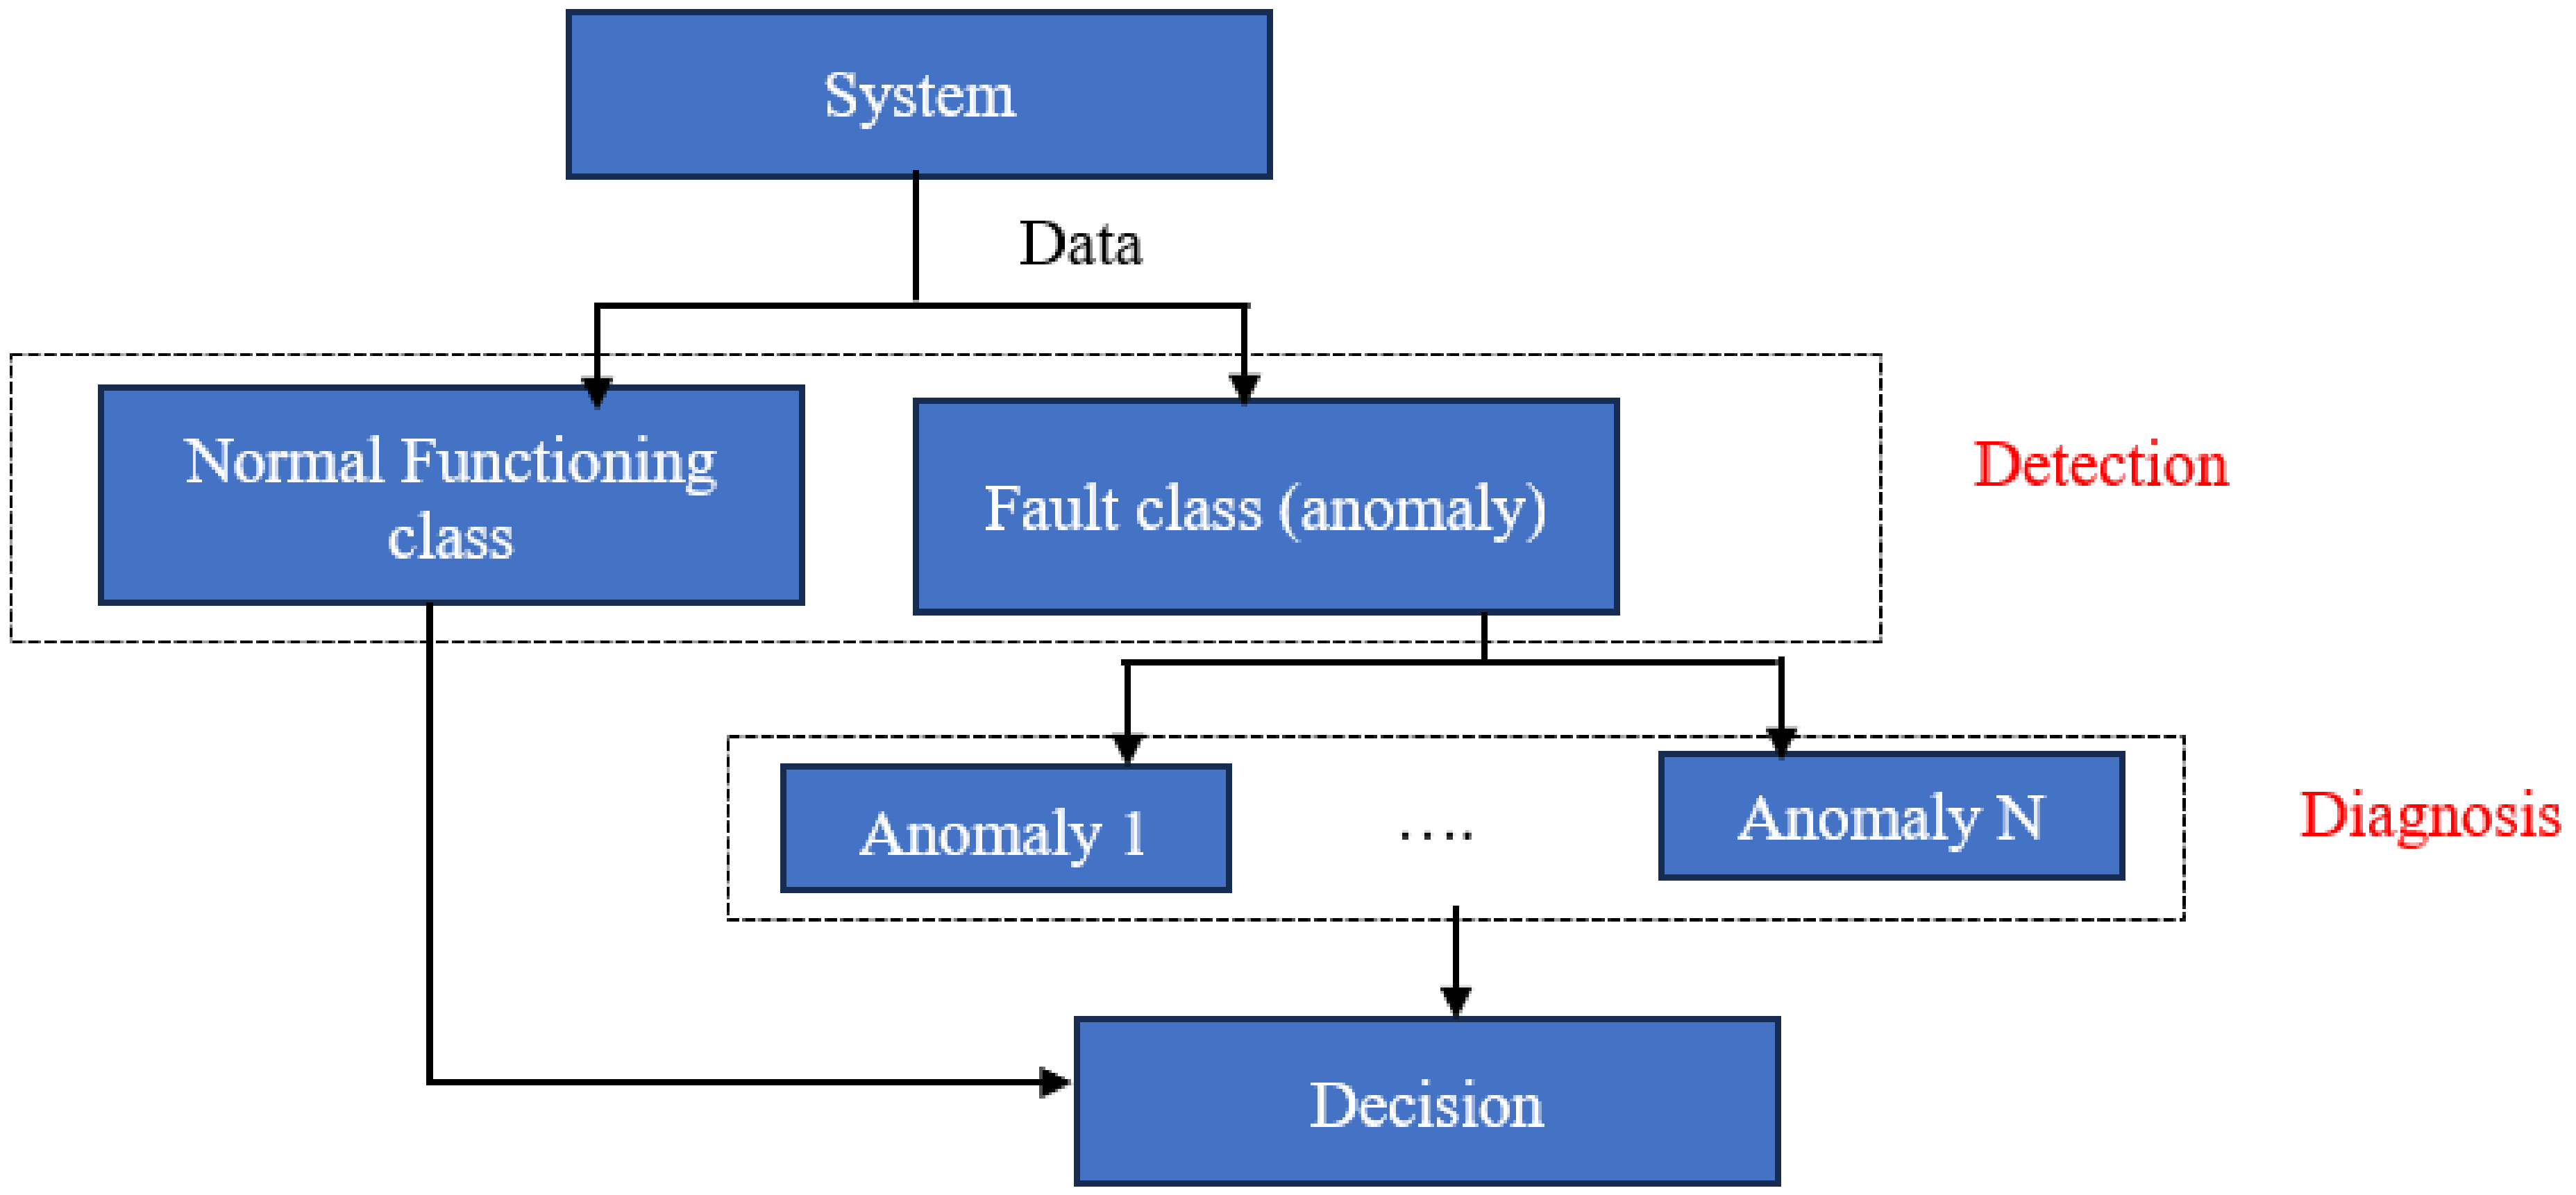
Most methods based on historical data consider detection and diagnosis as classification tasks (see Figure 2). The aim of detection is to identify whether an abnormal operation has occurred, which corresponds to a classification into two categories: the normal functioning class (NFC) and the fault class. Diagnosis aims to determine the type of fault, which can be seen as a classification into several classes: anomaly 1, anomaly 2, etc. [15].
In this work, we adopted a data-driven approach and investigated the classification technique based on supervised learning. We considered two main anomalies of the screening unit:
  • Anomaly 1: High sterilization rate.
  • Anomaly 2: The passage of phosphate material to screen rejection (phosphate loss).
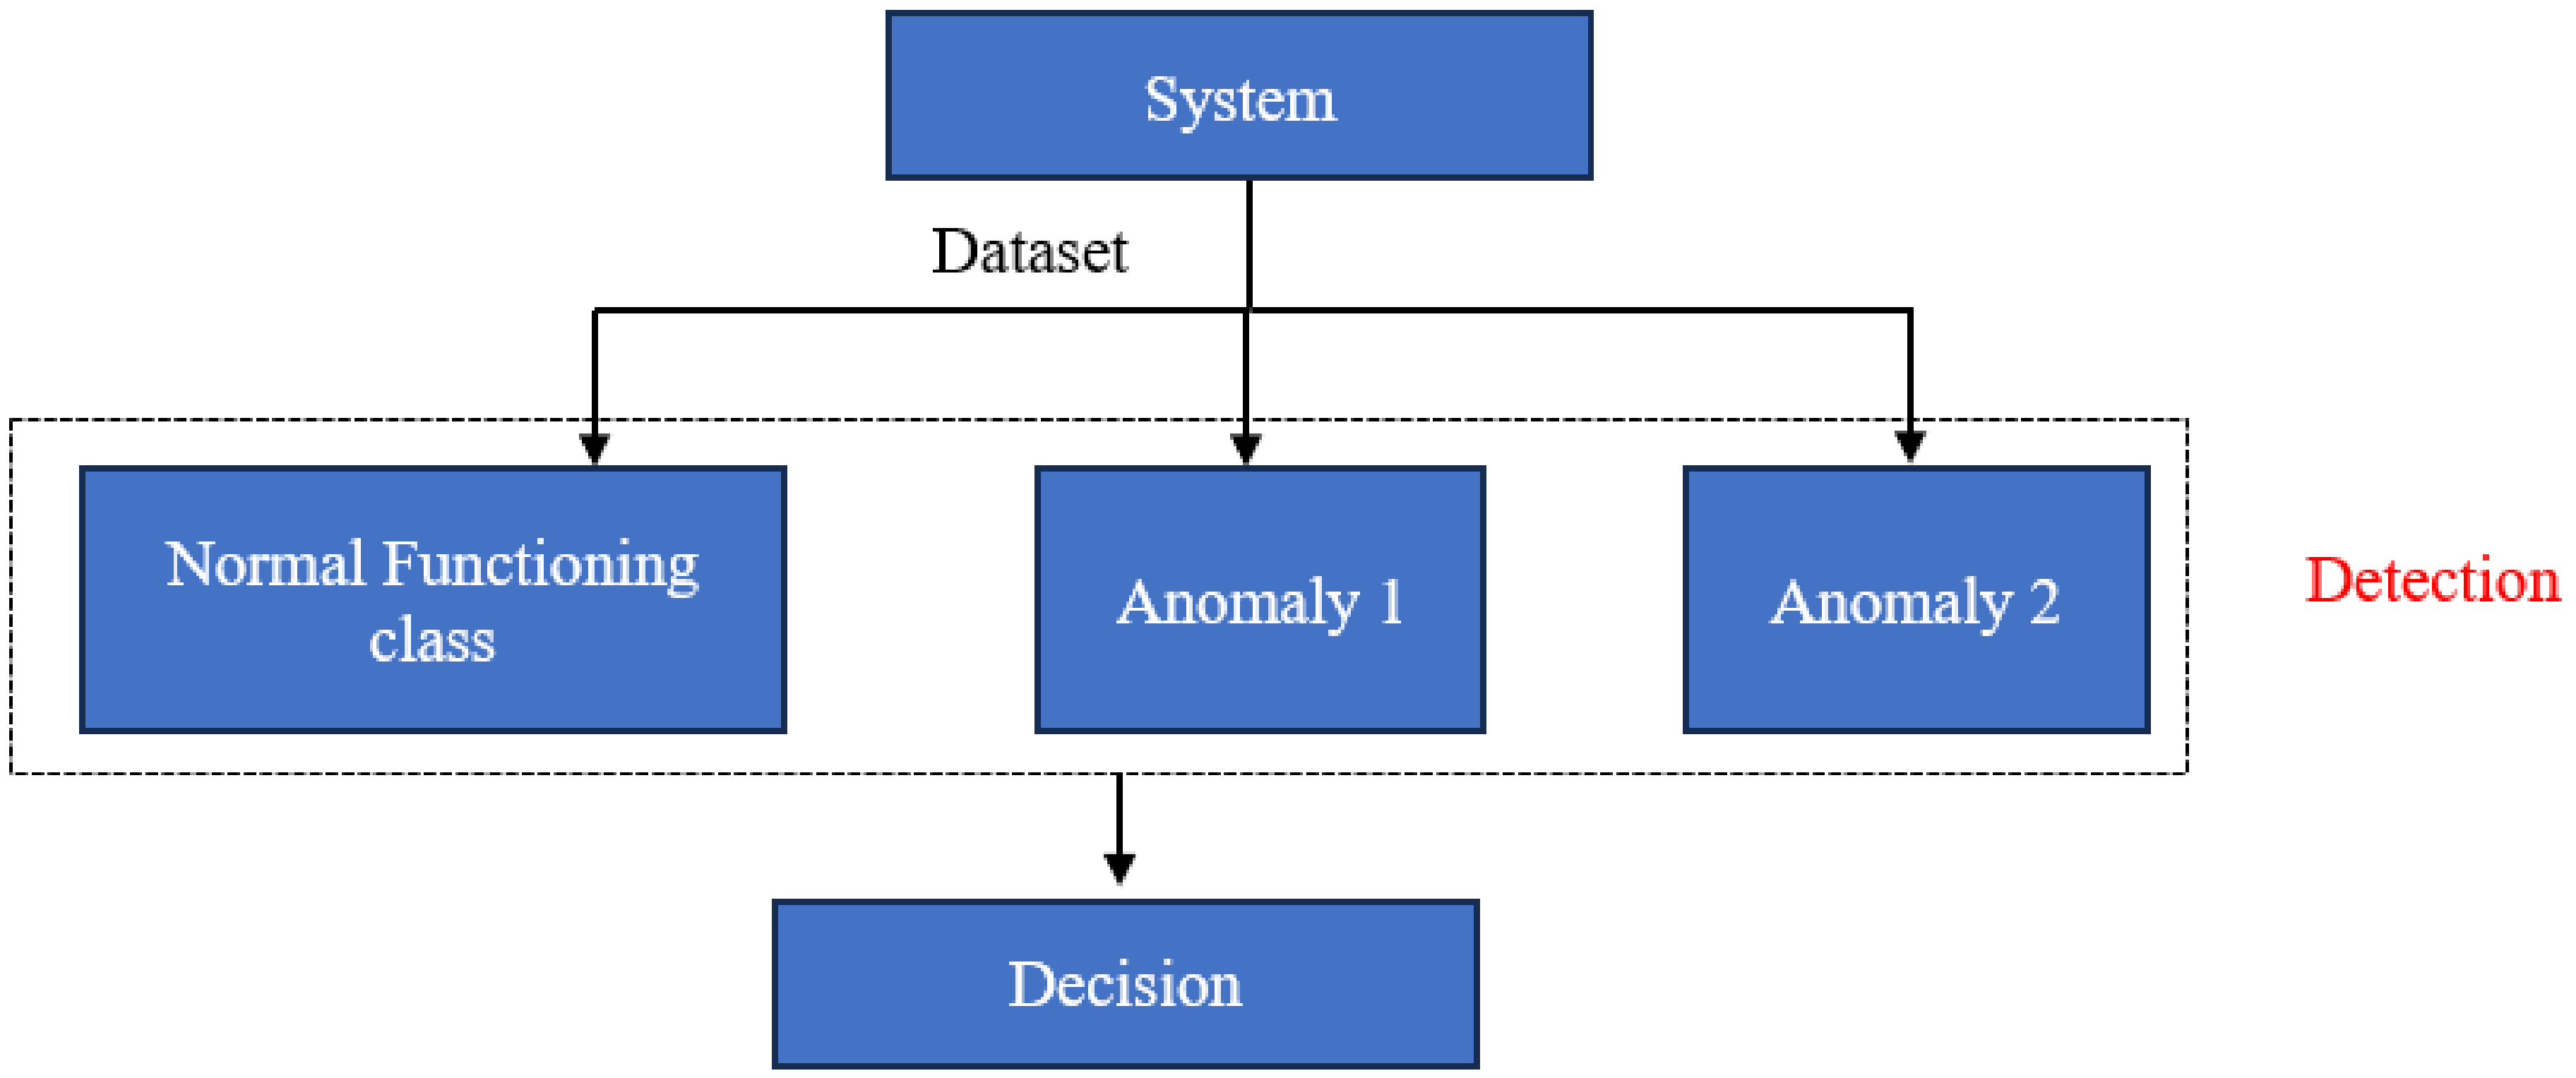
Therefore, we approached anomaly detection as a problem of image classification into three distinct classes: the NFC class, anomaly 1 class, and anomaly 2 class. Figure 3 illustrates our implemented method for detecting malfunctions using image classification with three classes.
Various methods have been developed for image classification tasks. There are mainly traditional machine learning techniques such as support vector machines (SVM), k-nearest neighbors (KNN), and random forest (RF), as well as deep learning techniques such as convolutional neural networks (CNN). Traditional machine learning techniques rely on hand-crafted features extracted from images using a feature extractor such as Histogram of Oriented Gradient (HOG) or Local Binary Pattern (LBP), while deep techniques automatically extract features using their convolutional layers. Although deep models have been the most used recently in many works, including industrial damage detection with excellent results such as [17,18,19], we believe that each problem has its own challenges. Hence, in this study, we conducted a comparative evaluation of machine-learning and deep-learning approaches to select the optimal models for our case study. For the machine-learning approach, we evaluated a combination of HOG, Scale Invariant Feature (SIFT), and LBP with one of the classifiers, SVM, KNN, or RF, while for the deep approach, we tested the CNN model.
The support vector machine (SVM) is a well-known classification algorithm. It seeks to create an optimal hyperplane, maximizing the separation between projected points, called support vectors. SVMs are versatile, handling both linear and non-linear classifications using kernel functions [20]. On the other hand, random forests, an ensemble learning method, build several decision trees during training. Each tree contributes a unit vote to classify an input vector based on the most common class [21]. K-nearest neighbors (KNN) is a simple and efficient non-parametric classification method that determines the class of a new data point by examining the majority class among its k-nearest neighbors from a set of labeled training data [22].
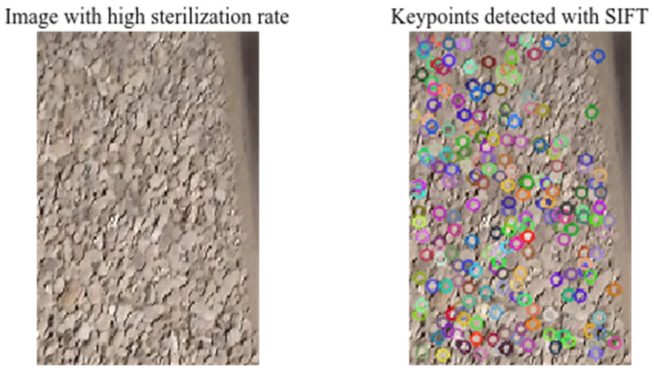
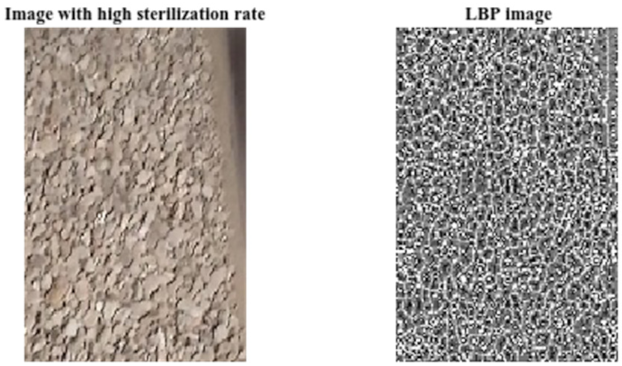
Furthermore, the convolutional neural network (CNN), a well-known model of feedforward neural networks, is particularly well suited to large datasets such as images and videos. CNNs work the same way as standard neural networks, except that each unit of a CNN layer is a two-dimensional convolution filter applied to the layer’s input. This convolution step is essential when learning models from high-dimensional inputs, such as images or videos [23]. Regarding feature extraction algorithms, Table 1 briefly describes the HOG, SIFT, and LBP algorithms, with an illustration of their application in an image corresponding to the situation with the high sterilization rate.
These techniques have proven their efficacy in various smart surveillance applications. For instance, the HOG descriptor has demonstrated its performance in human detection, tracking, and object detection [24,25]. LBP and Violent Flows (ViF), followed by Linear SVM, have been used to classify videos as either violent or non-violent [26]. Additionally, SIFT has proven its efficiency when used as a feature extractor for anomaly detection [27]. On the other hand, the widely used classification algorithm SVM has been employed, for example, when detecting abnormal events in public surveillance systems [28]. Random forest has been utilized to automate defect detection in tunnel images [29]. Moreover, the HOG-SVM combination has demonstrated its effectiveness in detecting anomalies in the screening unit [12]. However, this work aims to evaluate and compare other combinations to identify the most powerful models based on various evaluation metrics.
Figure 4 shows the flowchart used to build the models. Once the images were acquired, our knowledge database was built to train the different models evaluated, whether from classical or deep approaches. Finally, a comparative analysis was developed based on the evaluation metrics.
Table 1. HOG, SIFT and LBP principals and their application in an image corresponding to the situation of a high sterilization rate.
AlgorithmPrincipleApplication
HOG: Histogram of Oriented Gradient HOG is a feature descriptor proposed by Navneet Dalal and Bill Triggs in 2005 [30] and used in computer vision for object detection. The basic principle of this descriptor is the use of the intensity distribution of the gradient or the direction of the contours.Mining 03 00035 i001
SIFT: Scale Invariant Feature Transform SIFT is a feature extractor proposed by researcher David Lowe in [31]. The general idea of this algorithm is to extract characteristic points, called “features points”, on an image in such a way that these points are invariant to several transformations, including rotation, illumination, and, especially, invariant to scale.Mining 03 00035 i002
LBP: Local Binary PatternThis descriptor was first mentioned in 1993 to measure an image’s local contrast but was popularised three years later by Ojala et al. to analyze textures [32]; it is also used to detect and track moving objects in an image sequence. The general principle is to compare a pixel’s luminance level with its neighbors’ levels. Mining 03 00035 i003

3.2. Datasets Preparation and System Configuration

The experiments were carried out on a balanced dataset containing images in the jpg format, each measuring 180 × 120 × 3, and captured from the videos of the surveillance camera installed at the screening station. The captured images were converted to grayscale images and then pre-processed to prepare a dataset of learning. For each captured image, a 32° rotation, a cropping, and a resizing operation were introduced to eliminate the non-functional parts of the image. This dataset contains three different classes; one class is the normal case, and the others present two types of anomalies (see Figure 5). Figure 5 shows images corresponding to the normal functioning class, images corresponding to the high sterilization rate class, and images corresponding to the passage of the phosphate material to the rejection of the screens (phosphate loss class). The distribution of dataset images over the train and test samples is resented in Table 2.
The computation for this study was undertaken using Anaconda (version 4.10.3) with Python, employing various libraries such as OpenCV, scikit-learn, scikit-image, and TensorFlow. All experiments were performed on an Asus laptop, manufactured by ASUSTeK Computer Inc based in Taipei, Taiwan, equipped with an Intel(R) Core (TM) i5 (10th Gen) processor and 18 GB of RAM. The laptop ran at 2.50 GHz with the Windows 10 operating system. This hardware configuration provided a reliable and consistent computing environment for the execution of various computational tasks, ensuring the reproducibility and accuracy of experiments conducted throughout this study.

3.3. Evaluation Metrics

The classification of each test sample was based on four cases commonly represented by the confusion matrix. These four cases included TP, TN, FP, and FN, corresponding to True Positive, True Negative, False Positive, and False Negative, respectively. For multi-class classification, we used a one-against-all approach as follows:
  • “TP of Ci” is all Ci instances that are classified as Ci.
  • “TN of Ci” is all non-Ci instances not classified as Ci.
  • “FP of Ci” is all non-Ci instances that are classified as Ci.
  • “FN of Ci” is all Ci instances not classified as Ci.
To compare these models’ robustness, we estimated the models’ accuracy, sensitivity, and specificity. Accuracy gives us an idea of the proportion of correctly classified images (TP and TN) compared to the overall number of images entered into the model (TP, TN, FP, and FN). Sensitivity is a metric that measures the model’s capacity to predict each available class’s True Positives. On the other hand, specificity measures the model’s capacity to predict the true negatives of each available class. The equations of these metrics are as follows:
Accuracy = TP + TN TP + TN + FP + FN
Sensitivity = TP TP + FN
Specificity = TN TN + FP

4. Implementation and Results

4.1. Implementation

4.1.1. Machine-Learning Approach

The machine-learning approach combines a descriptor for extracting characteristic elements from the image and a classifier forming two blocks. The evaluation is based on supervised machine learning, which consists of two phases: a training phase in which the model learns from labeled data and a test phase to assess how well the model learns from unlabeled data. The implementation process is consistent across all models in this study and involves several key stages. Initially, required libraries are imported, followed by a definition of model parameters. Specifically, the HOG technique employs nine gradient orientations, with each cell covering a 16 × 16-pixel region and two cells included in each block. SIFT utilizes a 6-pixel step between key points, effectively reducing the feature vector’s size and runtime. LBP is configured with a circle radius (R) of one, circularly symmetric neighbors set points (P) equal to eight times the radius, and a uniform method to determine patterns. Our SVM used the radial basis function as its kernel with a C value of 100. For the random forest, we used 100 trees in the forest, while the KNN classifier retained its default parameters. Subsequently, the image dataset was imported, labeled, and prepared for training. The predictive model was then trained using the cross-validation method to avoid over-fitting. Finally, the model’s performance was evaluated with new images from the test dataset, and various evaluation metrics were calculated. This comprehensive process ensures the appropriate development and evaluation of each model under consideration.

4.1.2. Deep-Learning Approach

The critical difference of the deep learning approach is that it combines the two stages of feature extraction and classification in a single block while exploiting the power of neural networks. This idea is based on a trainable system consisting of modules corresponding to a processing step. The training of each module is performed with adjustable parameters such as linear classifier weights. The whole system is driven from scratch: for each sample, all parameters of the modules are adjusted to match the outcome of the system to the desired outcome. The in-depth qualifier is due to the successive layering of these modules.
The architecture of the CNN model that we implemented and tested on our dataset is detailed in Table 3. This model was not pre-trained; we learned it from scratch. It included two convolution layers, each producing 64 feature maps using a 4 × 4-pixel size filter, two max-pooling windows of size 2 × 2 pixels, two batch normalization layers, two dropout layers, and three fully connected layers (FC). The final classification was achieved using the SoftMax activation function. This model follows a modeling structure comprising several vital stages. First, the necessary libraries were imported, followed by the definition of model parameters. Next, the model was created, and the images in the dataset were prepared, resized, labeled, and augmented. This model was then trained over 40 epochs. Finally, a complete evaluation was carried out, including performance tests and the calculation of key evaluation metrics.

4.2. Results

We evaluated several classification models; HOG and SVM, HOG and RF, HOG and KNN, SIFT and SVM, SIFT and RF, SIFT and KNN, LBP and SVM, LBP and RF, LBP and KNN, and the CNN model. The learning accuracy results presented in Table 4 reveal that most models efficiently learned data features and could provide accurate predictions during the learning phase, with learning accuracies above 80%. However, it is worth mentioning that the LBP and SVM models achieved the lowest learning accuracy of 42%. It suggests that this combination encountered difficulties in learning effectively from the training data. On the other hand, the LBP and KNN models achieved a moderate learning accuracy of 76%
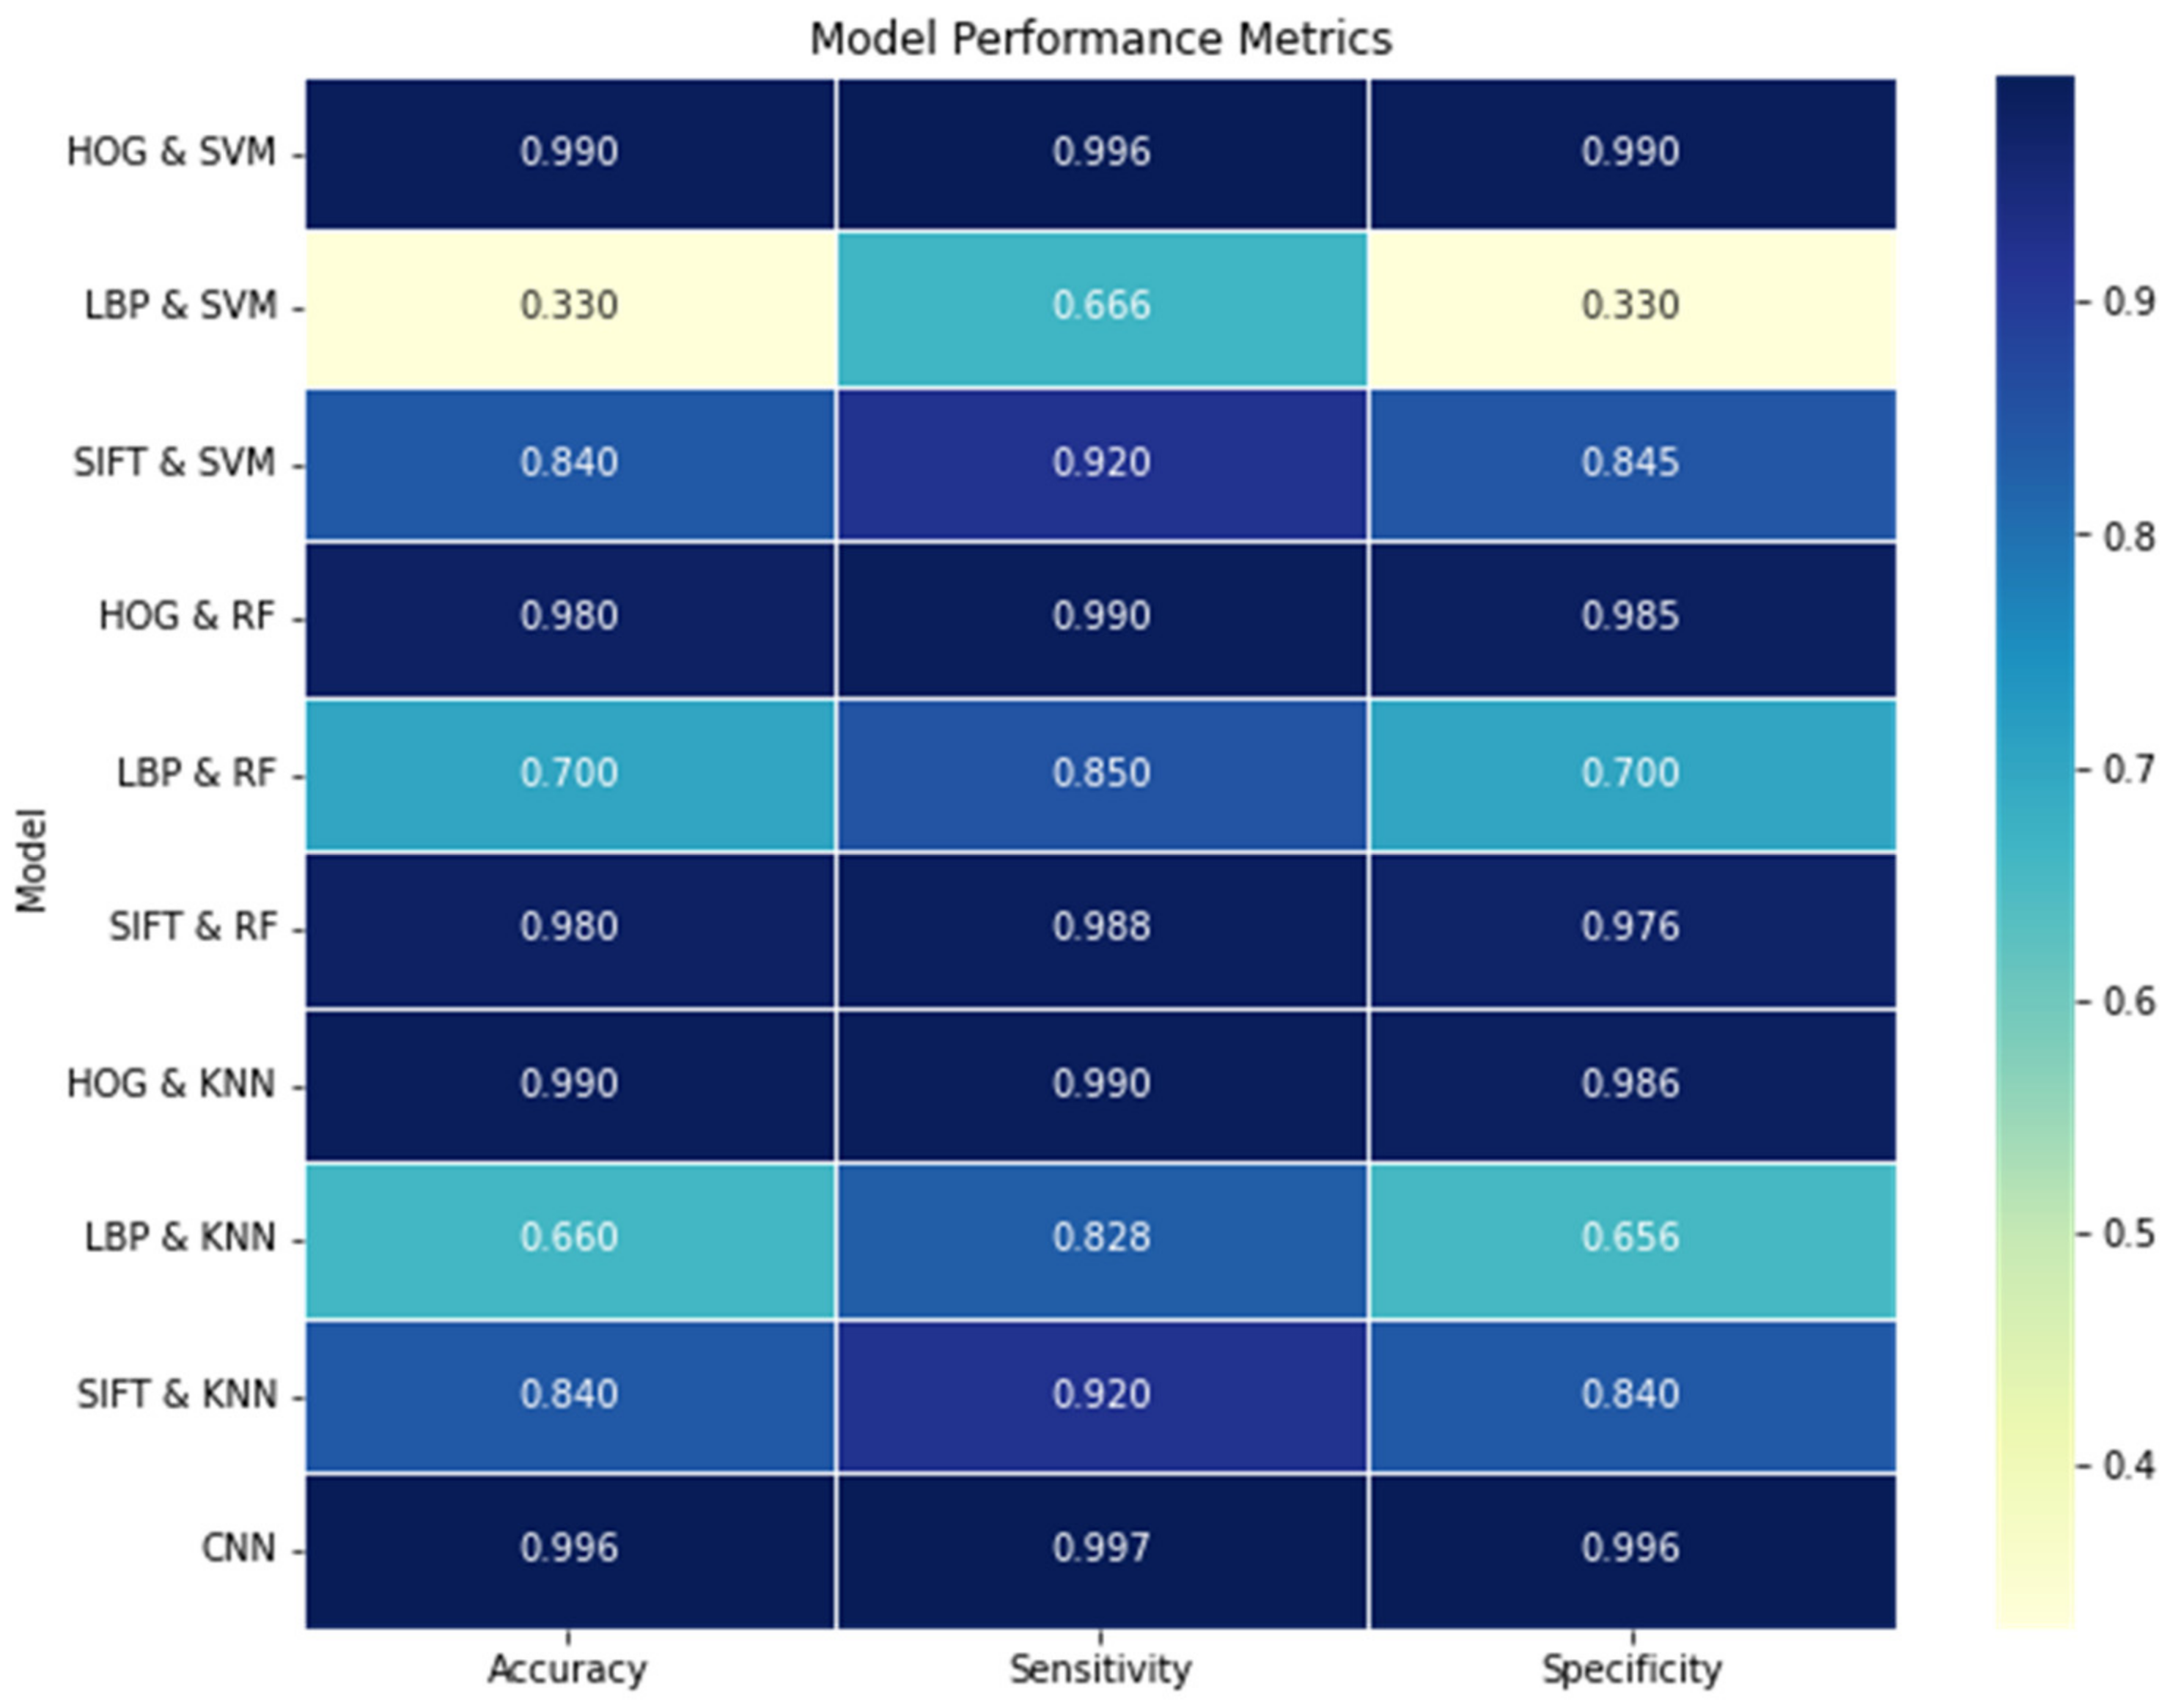
Figure 6 shows a heatmap illustrating the performance measures, including accuracy, sensitivity, and specificity, for the test dataset across different classification models explored in this study. The CNN model emerged as the best-performing model, with the highest accuracy, specificity, and sensitivity (99.6%, 99.6%, and 99.7%, respectively, as shown in Figure 6). The HOG-based models (HOG and SVM, HOG and RF, HOG and KNN) consistently performed well on all measures (exceeding 98%), especially for HOG and SVM, which achieved high accuracy (99%) and well-balanced sensitivity and specificity (99.6% and 99%, respectively). The SIFT-based models (SIFT and SVM, SIFT and RF, SIFT and KNN) also performed competitively, in particular the SIFT and RF model, which excelled in terms of accuracy and sensitivity (98% and 98.8%, respectively). By contrast, the -based models (LBP and SVM, LBP and RF, LBP and KNN) tended to provide lower accuracy and specificity. For example, the LBP and SVM models produced an accuracy and specificity of 33%, while the models based on HOG and SIFT yielded better results with higher values.
Moreover, it is worth noting that the RF classifier demonstrated consistent competence across different feature extraction methods. By contrast, the KNN classifier performed competitively despite having a slightly lower accuracy than SVM and RF.
In summary, considering the parameters evaluated, the CNN and HOG-based models were strong performers for achieving high robustness, with SIFT-based models proving competitive. Figure 7 illustrates the prediction results generated by the CNN model for a subset of images from the test sample.

5. Discussion

The previous section provided an overview of our study’s findings, highlighting the performance of the CNN, HOG, and SIFT-based models in the context of anomaly detection in the screening unit of the Benguerir phosphate mine. The LBP descriptor consistently showed better sensitivity than accuracy and specificity in all combinations with various classification methods (SVM, RF, and KNN). A notable observation was made for the LBP-SVM combination. Thus, this algorithm tends to fail in describing “True Negative” instances compared to “True Positive” instances. This limitation can be attributed to the limited discriminating power of LBP, which, in some cases, may struggle to capture subtle differences between textures. This factor led us to eliminate the LBP-based models for our specific case study.
To provide a more in-depth analysis of our findings, it is crucial to discuss the real-time aspect of the intended monitoring system. In fact, the image processing time was a critical factor in our real-time system, which required the processing of two images per second with a product residence time of 10 s on the screen. An analysis of the processing times of best-performing models, as shown in Table 5, revealed that all models met the stringent processing time requirements, with each model taking less than half a second to process a single image. In particular, the SIFT-based models and the CNN model showed the highest processing speed. Consequently, if we consider both success rates and execution times, the CNN model, along with the HOG and SIFT-based models, proved to be the most appropriate choices for our case study in terms of robustness and processing speed.
Furthermore, comparing the classical approach with the deep approach for convolution neural networks, the advantage of the deep architecture is that it is not necessary to build a feature extractor by hand since all these layers are trained to extract features in the image in an automatic way. In ref. [13], we evaluated and compared the performances of the CNN as a descriptor and the HOG, SIFT, and LBP descriptors, each using an SVM classifier. As a result, we found that the deep neural network approach is robust and offers the greatest accuracy despite a low runtime trade-off.

6. Conclusions

Intelligent monitoring systems require the use of powerful and robust models that are capable of accurately fulfilling their assigned purpose. In this paper, we present a case study in which we provide a comparative study of different classification models designed to accurately detect anomalies in the screening unit of the Benguerir phosphate mine.
The experimentation in this research section highlights the robustness of both the CNN and HOG-based models. The CNN model demonstrated exceptional accuracy, specificity, and sensitivity, all above 0.99. Simultaneously, the HOG-based models performed well, with accuracy, specificity, and sensitivity all exceeding 0.98. Notably, both models achieved these results while maintaining a highly tolerant processing speed. While the SIFT-based models did not match the performance of the CNN- and HOG-based models, they still achieved competitive results. These outcomes were obtained based on a dataset of images taken under normal conditions. However, the mine is an uncertain environment subject to severe weather conditions (fog, dust, rain, and high temperature). Hence, precise knowledge of these methods’ robustness in images containing parasites and noise caused by degraded weather conditions or other noise sources is imperative. Indeed, this concern is the major challenge of any artificial vision system in a context like mining.
Our perspective for the next step is to examine the noises and degradations that can alter the quality of images captured from surveillance cameras and then to study suitable solutions to rectify these defects. After this system is complete, the overall objective is to integrate this system with other systems, such as serving autonomy, to develop a global digital platform that ensures the remote control of all activities of the mine in Benguerir.

Author Contributions

Investigation, L.E.H.; Methodology, L.E.H.; Software, L.E.H.; Supervision, A.E. and N.A.; Validation, A.E. and N.A.; Writing—original draft, L.E.H.; Writing—review and editing, A.E. and N.A. All authors have read and agreed to the published version of the manuscript.

Funding

The UM6P and the National Centre for Scientific and Technical Research provided funding for this work.

Data Availability Statement

Data is unavailable due to privacy issues.

Conflicts of Interest

The authors declare no conflict of interest.

References

  1. Kelly, T.; Matos, G.R.; Buckingham, D.A.; DiFrancesco, C.A.; Porter, K.E.; Berry, C.; Crane, M.; Goonan, T.; Sznopek, J. Historical Statistics for Mineral and Material Commodities in the United States; Data Series; U.S. Geological Survey: Reston, VA, USA, 2005; Volume 140. [Google Scholar]
  2. Steen, I. Phosphorus Availability in the 21st Century: Management of a Non-Renewable Resource. Phosphorus Potassium 1998, 217, 25–31. [Google Scholar]
  3. Cordell, D.; Drangert, J.-O.; White, S. The story of phosphorus: Global food security and food for thought. Glob. Environ. Chang. 2009, 19, 292–305. [Google Scholar] [CrossRef]
  4. Van Vuuren, D.P.; Bouwman, A.F.; Beusen, A.H.W. Phosphorus demand for the 1970–2100 period: A scenario analysis of resource depletion. Glob. Environ. Chang. 2010, 20, 428–439. [Google Scholar] [CrossRef]
  5. Stewart, W.M.; Dibb, D.W.; Johnston, A.E.; Smyth, T.J. The Contribution of Commercial Fertilizer Nutrients to Food Production. Agron. J. 2005, 97, 1–6. [Google Scholar] [CrossRef]
  6. Gouaillier, V.; Fleurant, A.-E. La Vidéosurveillance Intelligente: Promesses et Défis; CRIM: Montreal, QC, Canada, 2009; Volume 104. [Google Scholar]
  7. David Jenkins, M.; Buggy, T.; Morison, G. An imaging system for visual inspection and structural condition monitoring of railway tunnels. In Proceedings of the 2017 IEEE Workshop on Environmental, Energy, and Structural Monitoring Systems (EESMS), Milan, Italy, 24–25 July 2017; pp. 1–6. [Google Scholar]
  8. Marino, F.; Distante, A.; Mazzeo, P.L.; Stella, E. A Real-Time Visual Inspection System for Railway Maintenance: Automatic Hexagonal-Headed Bolts Detection. IEEE Trans. Syst. Man Cybern. Part C 2007, 37, 418–428. [Google Scholar] [CrossRef]
  9. Park, S.; Choi, Y. Applications of Unmanned Aerial Vehicles in Mining from Exploration to Reclamation: A Review. Minerals 2020, 10, 663. [Google Scholar] [CrossRef]
  10. Dey, P.; Chaulya, S.K.; Kumar, S. Hybrid CNN-LSTM and IoT-based coal mine hazards monitoring and prediction system. Process Saf. Environ. Prot. 2021, 152, 249–263. [Google Scholar] [CrossRef]
  11. Wang, C.; Chang, L.; Zhao, L.; Niu, R. Automatic Identification and Dynamic Monitoring of Open-Pit Mines Based on Improved Mask R-CNN and Transfer Learning. Remote Sens. 2020, 12, 3474. [Google Scholar] [CrossRef]
  12. El Hiouile, L.; Errami, A.; Azami, N.; Majdoul, R.; Deshayes, L. Evaluation of Classical Descriptors coupled to Support Vector Machine Classifier for Phosphate ore Screening monitoring. In Proceedings of the 13th International Conference on Intelligent Systems: Theories and Applications, Rabat, Morocco, 23–24 September 2020; Association for Computing Machinery: New York, NY, USA, 2020; pp. 1–7. [Google Scholar]
  13. El Hiouile, L.; Errami, A.; Azami, N.; Majdoul, R. Deep Neural Network Descriptor for Anomaly Detection in the Screening Unit of an Open Pit Phosphate Mine. In International Symposium on Ubiquitous Networking; Elbiaze, H., Sabir, E., Falcone, F., Sadik, M., Lasaulce, S., Ben Othman, J., Eds.; Springer International Publishing: Cham, Switzerland, 2021; pp. 239–251. [Google Scholar]
  14. Laaniber, N.; El Krouni, M. Rapport du Projet de fin d Études—PDF Téléchargement Gratuit. Available online: https://docplayer.fr/82250671-Rapport-du-projet-de-fin-d-etudes.html (accessed on 20 May 2023).
  15. Tidriri, K. Decision Fusion Dedicated to the Monitoring of Complex Systems. Ph.D. Thesis, Université d’Angers, Angers, France, 2018. [Google Scholar]
  16. Tidriri, K.; Chatti, N.; Verron, S.; Tiplica, T. Bridging data-driven and model-based approaches for process fault diagnosis and health monitoring: A review of researches and future challenges. Annu. Rev. Control. 2016, 42, 63–81. [Google Scholar] [CrossRef]
  17. Weimer, D.; Scholz-Reiter, B.; Shpitalni, M. Design of deep convolutional neural network architectures for automated feature extraction in industrial inspection. CIRP Ann. 2016, 65, 417–420. [Google Scholar] [CrossRef]
  18. Staar, B.; Lütjen, M.; Freitag, M. Anomaly detection with convolutional neural networks for industrial surface inspection. Procedia CIRP 2019, 79, 484–489. [Google Scholar] [CrossRef]
  19. Haselmann, M.; Gruber, D.P.; Tabatabai, P. Anomaly Detection Using Deep Learning based Image Completion. arXiv 2018, arXiv:1811.06861. [Google Scholar]
  20. Ricco, R. SVM—Support Vector Machine. Available online: https://eric.univ-lyon2.fr/ricco/cours/slides/svm.pdf (accessed on 1 October 2023).
  21. Pal, M. Random forest classifier for remote sensing classification. Int. J. Remote Sens. 2005, 26, 217–222. [Google Scholar] [CrossRef]
  22. Cunningham, P.; Delany, S. k-Nearest neighbour classifiers. arXiv 2007, arXiv:2004.04523. [Google Scholar]
  23. Khan, S.; Rahmani, H.; Shah, S.A.A.; Bennamoun, M. A Guide to Convolutional Neural Networks for Computer Vision. In Lectures on Computer Vision; Springer: Cham, Switzerland, 2018; Volume 8, pp. 1–207. [Google Scholar] [CrossRef]
  24. Seemanthini, K.; Manjunath, S.S. Human Detection and Tracking using HOG for Action Recognition. Procedia Comput. Sci. 2018, 132, 1317–1326. [Google Scholar] [CrossRef]
  25. Patel, H.A.; Rajput, R.D. Smart Surveillance System Using Histogram of Oriented Gradients (HOG) Algorithm and Haar Cascade Algorithm. In Proceedings of the 2018 Fourth International Conference on Computing Communication Control and Automation (ICCUBEA), Pune, India, 16–18 August 2018; pp. 1–4. [Google Scholar]
  26. Vashistha, P.; Bhatnagar, C.; Khan, M.A. An architecture to identify violence in video surveillance system using ViF and LBP. In Proceedings of the 2018 4th International Conference on Recent Advances in Information Technology (RAIT), Dhanbad, India, 15–17 March 2018; pp. 1–6. [Google Scholar]
  27. Bilik, S.; Horak, K. SIFT and SURF based feature extraction for the anomaly detection 2022. arXiv 2022. [Google Scholar] [CrossRef]
  28. Amraee, S.; Vafaei, A.; Jamshidi, K.; Adibi, P. Abnormal event detection in crowded scenes using one-class SVM. SIViP 2018, 12, 1115–1123. [Google Scholar] [CrossRef]
  29. Decor, G.; Bah, M.D.; Foucher, P.; Charbonnier, P.; Heitz, F. Defect Detection in Tunnel Images using Random Forests and Deep Learning. In Proceedings of the 10th International Conference on Pattern Recognition Systems, Tours, France, 8–10 July 2019. [Google Scholar]
  30. Dalal, N.; Triggs, B. Histograms of Oriented Gradients for Human Detection. In Proceedings of the 2005 IEEE Computer Society Conference on Computer Vision and Pattern Recognition (CVPR’05), San Diego, CA, USA, 20–25 June 2005; IEEE: San Diego, CA, USA, 2005; Volume 1, pp. 886–893. [Google Scholar]
  31. Lowe, D.G. Distinctive Image Features from Scale-Invariant Keypoints. Int. J. Comput. Vis. 2004, 60, 91–110. [Google Scholar] [CrossRef]
  32. Ojala, T.; Pietikäinen, M.; Harwood, D. A Comparative Study of Texture Measures with Classification Based on Featured Distributions. Pattern Recognit. 1996, 29, 51–59. [Google Scholar] [CrossRef]
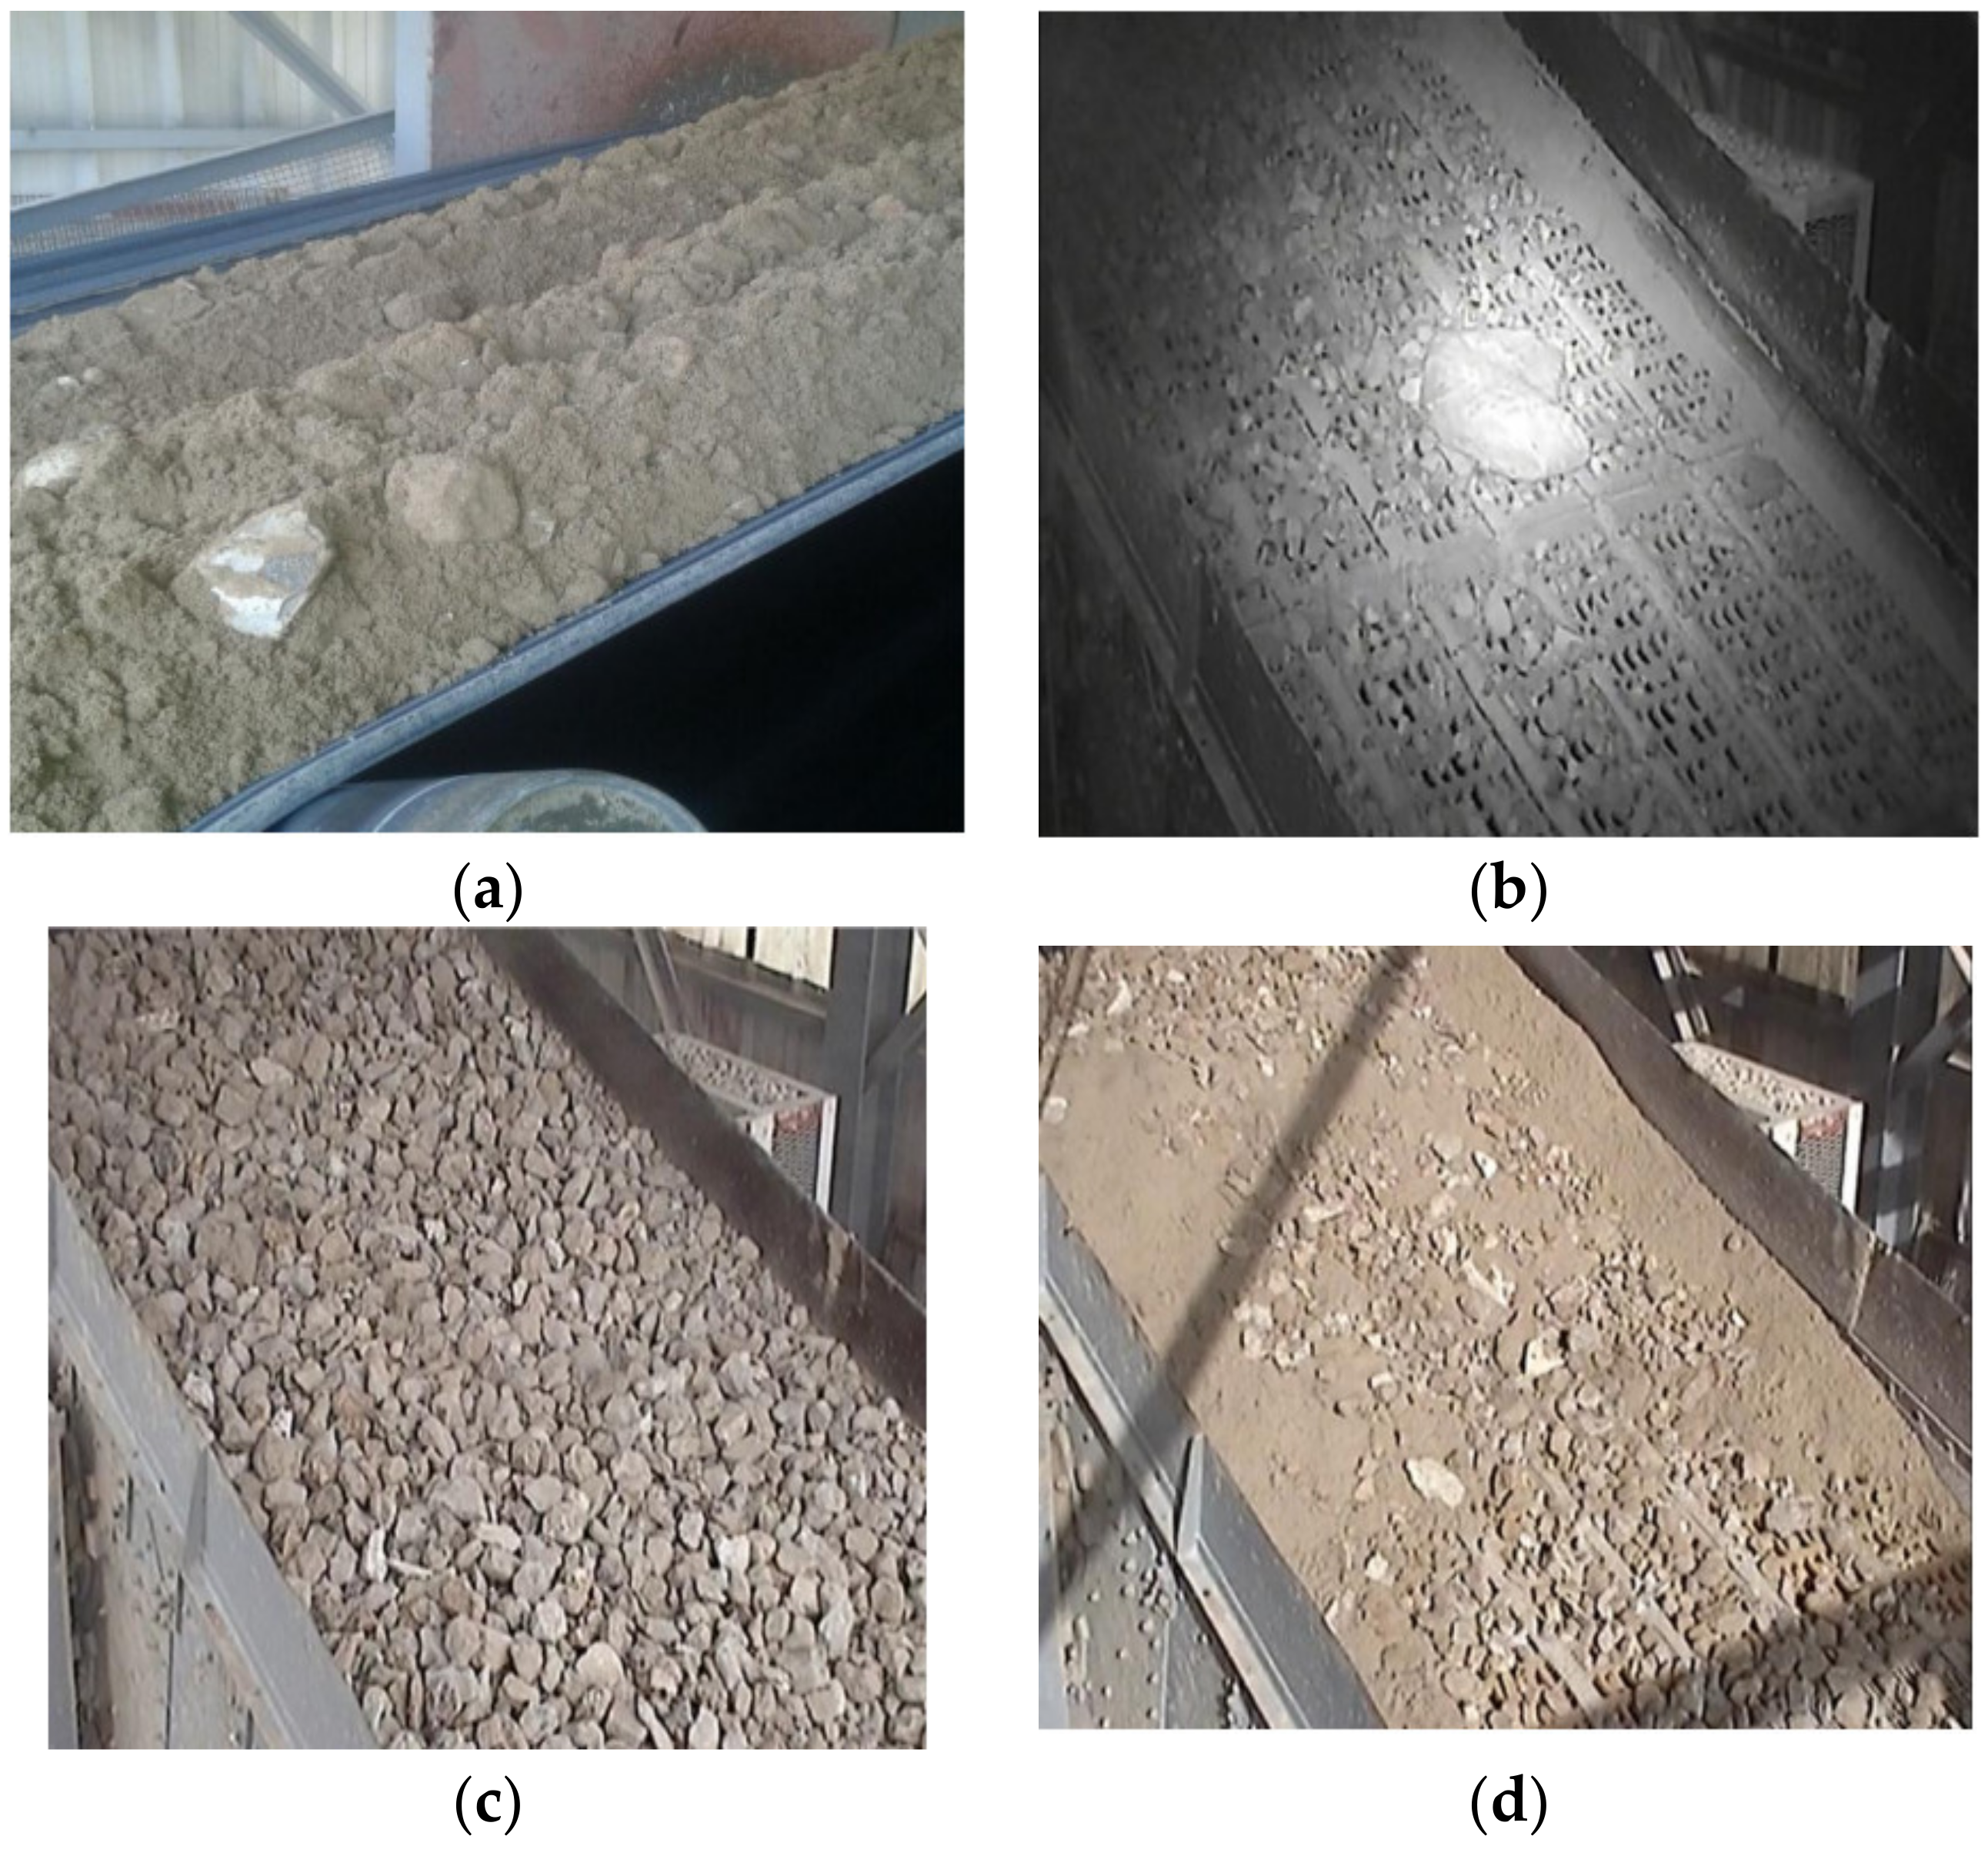
Figure 1. Illustration of some malfunctions in the screening unit at the Benguerir site. (a) Passage of pebbles to screens on the conveyor belt. (b) Pebbles in the screen. (c) High sterile content in the screen. (d) Passage of the product through the screen.
Mining 03 00035 g001
Figure 2. Detection and diagnosis of anomalies based on a data-driven approach.
Mining 03 00035 g002
Figure 3. Our method based on a data-driven approach and supervised learning-based classification technique.
Mining 03 00035 g003
Figure 4. Flowchart of the methodology followed.
Mining 03 00035 g004
Figure 5. Dataset sample.
Mining 03 00035 g005
Figure 6. Heatmap of the performance metrics (accuracy, sensitivity, and specificity) for each model.
Mining 03 00035 g006
Figure 7. Prediction results of some test images using the CNN model. “P” refers to the class predicted by the CNN model, and “C” designates the actual class of the image.
Mining 03 00035 g007
Table 2. Dataset distribution.
ClassTrainTest
Phosphate less399266
High-sterilization rate400267
Good functioning401267
Total 1200800
Table 3. CNN model architecture.
Input: Image (180, 120, 1)
Normalization
Conv4-64
Maxpol-2
Dropout (0.1)
Conv4-64
Maxpool-2
Dropout (0.3)
Flatten
Fc-256
Dropout (0.5)
Fc-64
Normalization
SoftMax
Convk-m: Convolution layer with m filters whose kernel has a dimension of k × k. Maxpool-k: window pooling layer of k × k. Fc-n: multilayer n-neuron perceptron. Dropout (p): dropout with a probability of p.
Table 4. Training accuracy of different models.
ModelHOG & SVMLBP & SVMSIFT & SVMHOG & RFLBP & RFSIFT & RFHOG & KNNLBP & KNNSIFT & KNNCNN
Train
Accuracy
0.990.420.840.970.930.940.990.760.811
Table 5. Processing time of an image for the models with highest accuracies.
ModelTime to Process an Image (s)
HOG and SVM0.025
HOG and RF0.013
HOG and KNN0.013
SIFT and SVM0.004
SIFT and RF0.0005
SIFT and KNN0.0007
CNN0.0008
Disclaimer/Publisher’s Note: The statements, opinions and data contained in all publications are solely those of the individual author(s) and contributor(s) and not of MDPI and/or the editor(s). MDPI and/or the editor(s) disclaim responsibility for any injury to people or property resulting from any ideas, methods, instructions or products referred to in the content.