Article

Assessment of Charge Initiation Techniques Effect on Blast Fragmentation and Environmental Safety: An Application of WipFrag Software

by
Blessing Olamide Taiwo
1,*,
Yewuhalashet Fissha
2,3,*,
Thomas Palangio
4,
Andrew Palangio
4,
Hajime Ikeda
2,
Nageswara Rao Cheepurupalli
5,
Naseer Muhammad Khan
6,
Adams Abiodun Akinlabi
1,
Oluwaseun Victor Famobuwa
7,
Joshua Oluwaseyi Faluyi
1 and
Youhei Kawamura
8
1
Mining Engineering Department, Federal University of Technology, Akure 340252, Nigeria
2
Department of Geosciences, Geotechnology and Materials Engineering for Resources, Graduate School of International Resource Sciences, Akita University, Akita 010-0852, Japan
3
Department of Mining Engineering, Aksum University, Aksum 7080, Ethiopia
4
Wipware Inc., North Bay, ON P1B 4Z5, Canada
5
Department of Mining Engineering, Bule Hora University, Bule Hora P.O. Box 144, Ethiopia
6
Department of Sustainable Advanced Geomechnical Engineering, Military College of Engineering, National University of Sciences and Technology, Risalpur 232002, Pakistan
7
Department of Mining Engineering, West Virginia University, Morgantown, WV 26506, USA
8
Faculty of Engineering, Hokkaido University, Sapporo 060-8628, Japan
*
Authors to whom correspondence should be addressed.
Mining 2023, 3(3), 532-551; https://doi.org/10.3390/mining3030030
Submission received: 7 June 2023 / Revised: 4 September 2023 / Accepted: 12 September 2023 / Published: 14 September 2023

Abstract

:
Blast charge initiation procedures have a significant impact on both mining safety and production rates. In this study, the inventory benefit of an electric initiation system was investigated to assess its influence on both fragmentation and blast-induced damages. The WipFrag software was used to examine the size distribution and productivity of 12 small-scale blasts initiated by both nonelectric and electric detonators. All blast rounds were initiated with plain-type electric and NONEL detonators. The average burden, spacing, stemming length, and charge weight were, respectively, 0.85 m, 1.10 m, 0.66 m, and 1.1 kg. The results showed that the mesh through which 80% of the blast fragments passed for the electric blast was smaller than the mesh through which the material products from the NONEL blast passed. The results also demonstrated that the generated blast-induced ground vibration (PPV) from all blast rounds for electric blast varied from 0.4–1.2 mm/s and 80–105 dB, while that for nonelectric blast ranged from 0.05–0.2 mm/s and 72–95 dB. As a result, the electric blast initiation technique was found to produce good fragmentation, with a higher percentage of optimum fragment sizes on spec than nonelectrically initiated blasts.

1. Introduction

Marble is a type of granular limestone or dolomite that has been recrystallized by heat, pressure, and aqueous solutions [1]. Marble is a coarse industrial rock element with a high carbonate content that varies in occurrence; it is widely used in the cement and paint industries [2]. Marble occurs in a wide range of geological environments, including mountain ranges, fault zones, and sedimentary basins [3]. Some of the most famous marble quarries in the world are in Italy, Greece, and Turkey, where the stone has been cherished for ages for its beauty and durability [4]. These countries have both large-scale and small-scale marble mines, which contribute to their gross domestic product (GDP) due to the widespread industrial use of marble powder and rock aggregates. Egypt has the highest volume of marble construction stone output, accounting for 93% of the total volume of African production [5]. Zambia comes in second, accounting for 2.3% of total production. African countries, such as South Africa, have also been involved in large-scale marble block manufacture. Nigeria is endowed with huge reserves of limestone and marble throughout the country. The limestone in Mfamosing, near Calabar, is Nigeria’s largest and purest deposit. The rate of marble production in Nigeria is determined by the mining process and the rate of output. The majority of Nigeria marble is fragmented using blasting procedures. Small-scale marble production, unlike large-scale mines with varied expert opinions and research inputs, requires innovation to increase safety and productivity. The ever-increasing need for industrial minerals such as carbonate material for cement and paint production in Nigeria has prompted the creation and management of both small-scale and large-scale quarries. According to [6], artisanal and small-scale mining (ASM) is mineral extraction by individuals, cooperatives, or small businesses with little financial investment and a heavy reliance on physical labor. According to Warra and Prasad, ASM has been identified as one of the most important economic activities in many rural communities in Sub-Saharan Africa. Artisanal mining in Nigeria, particularly in its southwestern section, is said to be, at best, unplanned and haphazard, with significant environmental consequences [7,8,9]. According to their findings, small-scale mining operations in Nigeria are expanding in intensity. The use of explosives to reduce rock mass can have a number of negative effects on the environment, mine workers, and major human health issues [8]. In mining, blasting operations are routinely employed to break up in situ rock masses in order to ensure material availability [10,11]. The fundamental purpose of blasting activities, according to Jhanwar, is to generate enough energetic wave energy for rock mass fracturing and size reduction [12]. The quantity of explosive energy during detonation is measured in a number of ways, including computations and experimental experiments. However, it is unclear how much of that explosive energy is delivered to the rock for fragmentation and how much of it is transformed into efficient work in the typical mining use of rock blasting. Although some of the effects of explosive excess energy utilization have been explained as vibration, fragmentation, and rock displacement, these measurements are normally performed for blast control purposes, and the results are usually important to guarantee a sustainable blasting environment. Blasting procedures are less productive when fine and boulder fragments are produced [13]. According to [14,15,16], a rise in fine fragment sizes in blast results influences the production rate as well as the effectiveness of loading and downstream activities. According to Jethro et al. in 2016, the presence of stones in blast muck has a negative impact on haulage and raises the cost of loading, transporting, and subsequent run-of-mine processing [17].
Overall, when the aftereffects of blasting operations are adjusted, the cost and effectiveness of run-of-mine size reduction operations (crushing and grinding) will be enhanced. For a long time, mining engineers had hoped that improving blasting fragmentation results would lead to increased productivity. The use of empirical and soft computing models, such as machine learning and ensemble learning algorithms for estimating blasting production and blast-induced consequences, is possibly the most important aspect of this anticipation [18]. These blast-induced consequences are caused by the unused energy released upon explosion and contribute to the mine’s significant environmental issues. Ground shock and vibration are caused by rock blasting, which can harm neighboring structures [19]. Because of the rising hazard posed by diverse humanmade activities, the reduction of blast-induced effects on natural and humanmade buildings has garnered a lot of attention in recent decades [20,21]. Nonetheless, small-scale mining sectors continue to dominate in terms of environmental effect generation. As small-scale mines become closer to human habitation, it is critical to conduct out blasts with safer initiating methods in order to limit ground vibrations and noise while maintaining a high output rate. Previous research work shows that the nonelectric shock tube system (NONEL) improves large-hole blast results while leaving clues about small-scale blasting performance [22].
The utilization of jackhammer small-hole diameter blasting with candle-type explosives for blasting at small-scale extraction levels is applicable to both industrial and metallic mineral extraction. This is commonly used in small-scale mines for primary blasting and in large-scale mines for secondary blasting operations. To understand the effect of charge initiation techniques on small-hole diameter blasting, this study examined the safety and production rate of electric and nonelectric detonation processes in a small-scale mine in Akoko Edo, Nigeria.

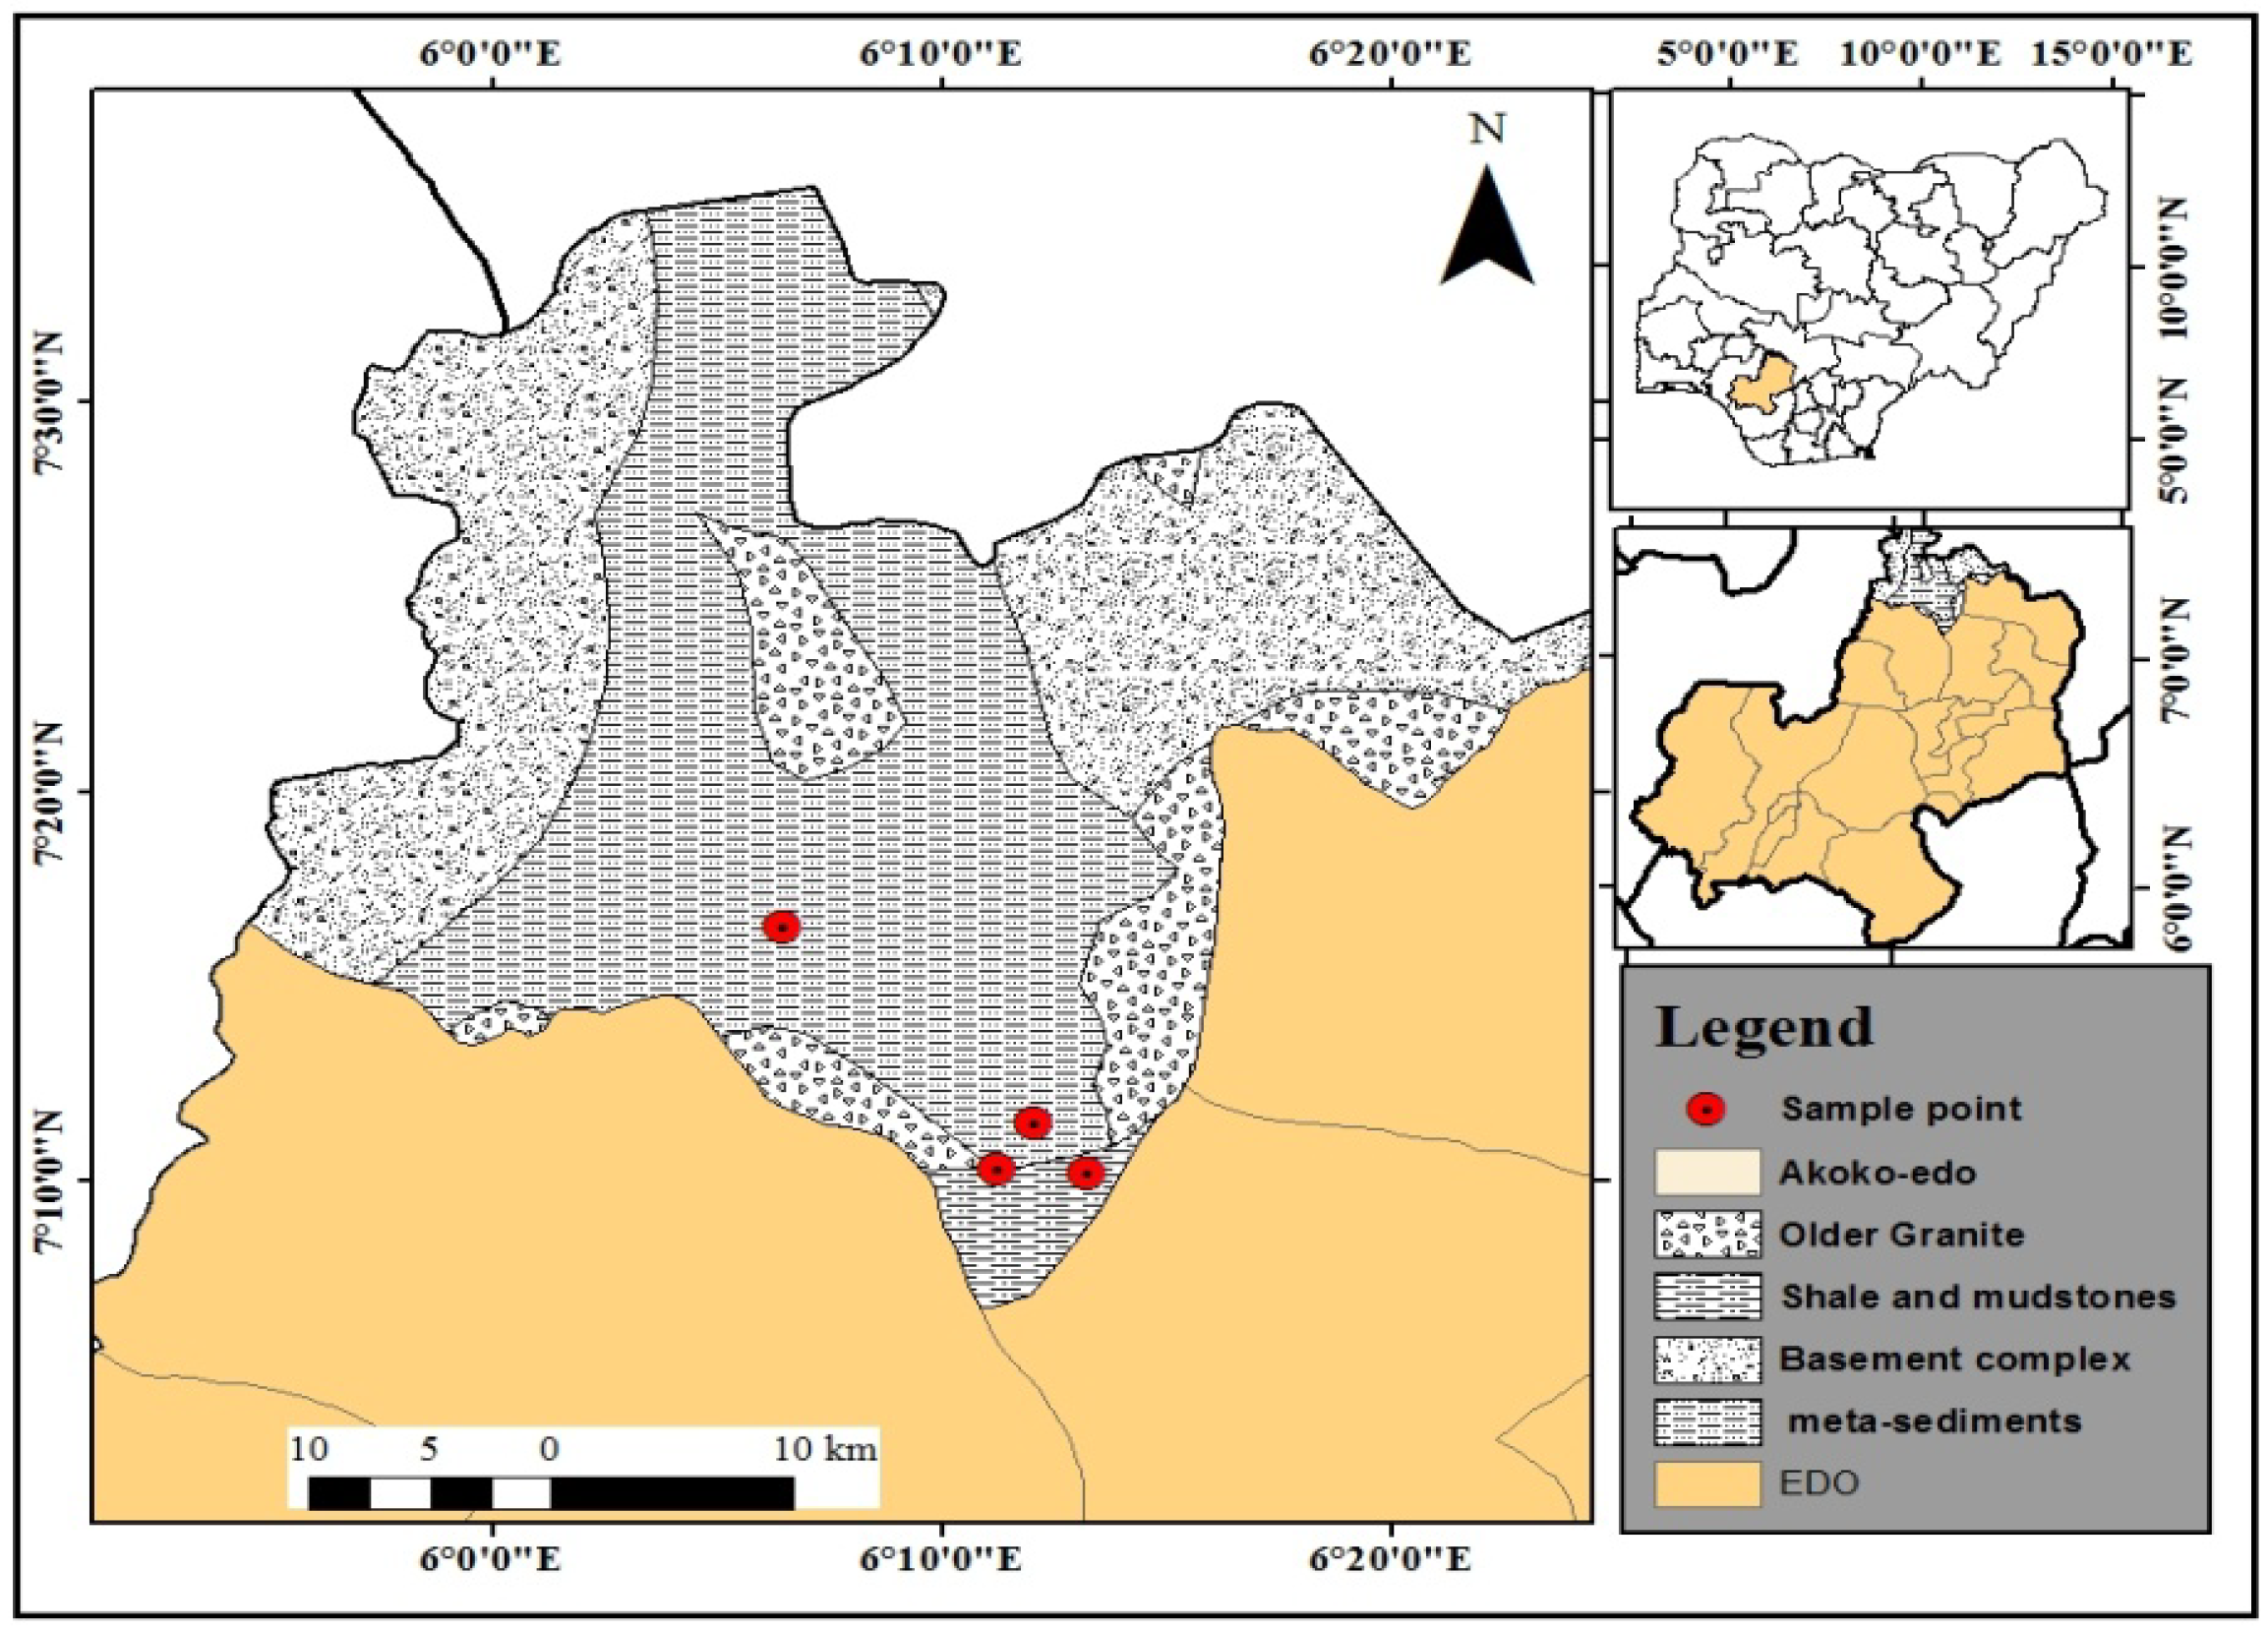
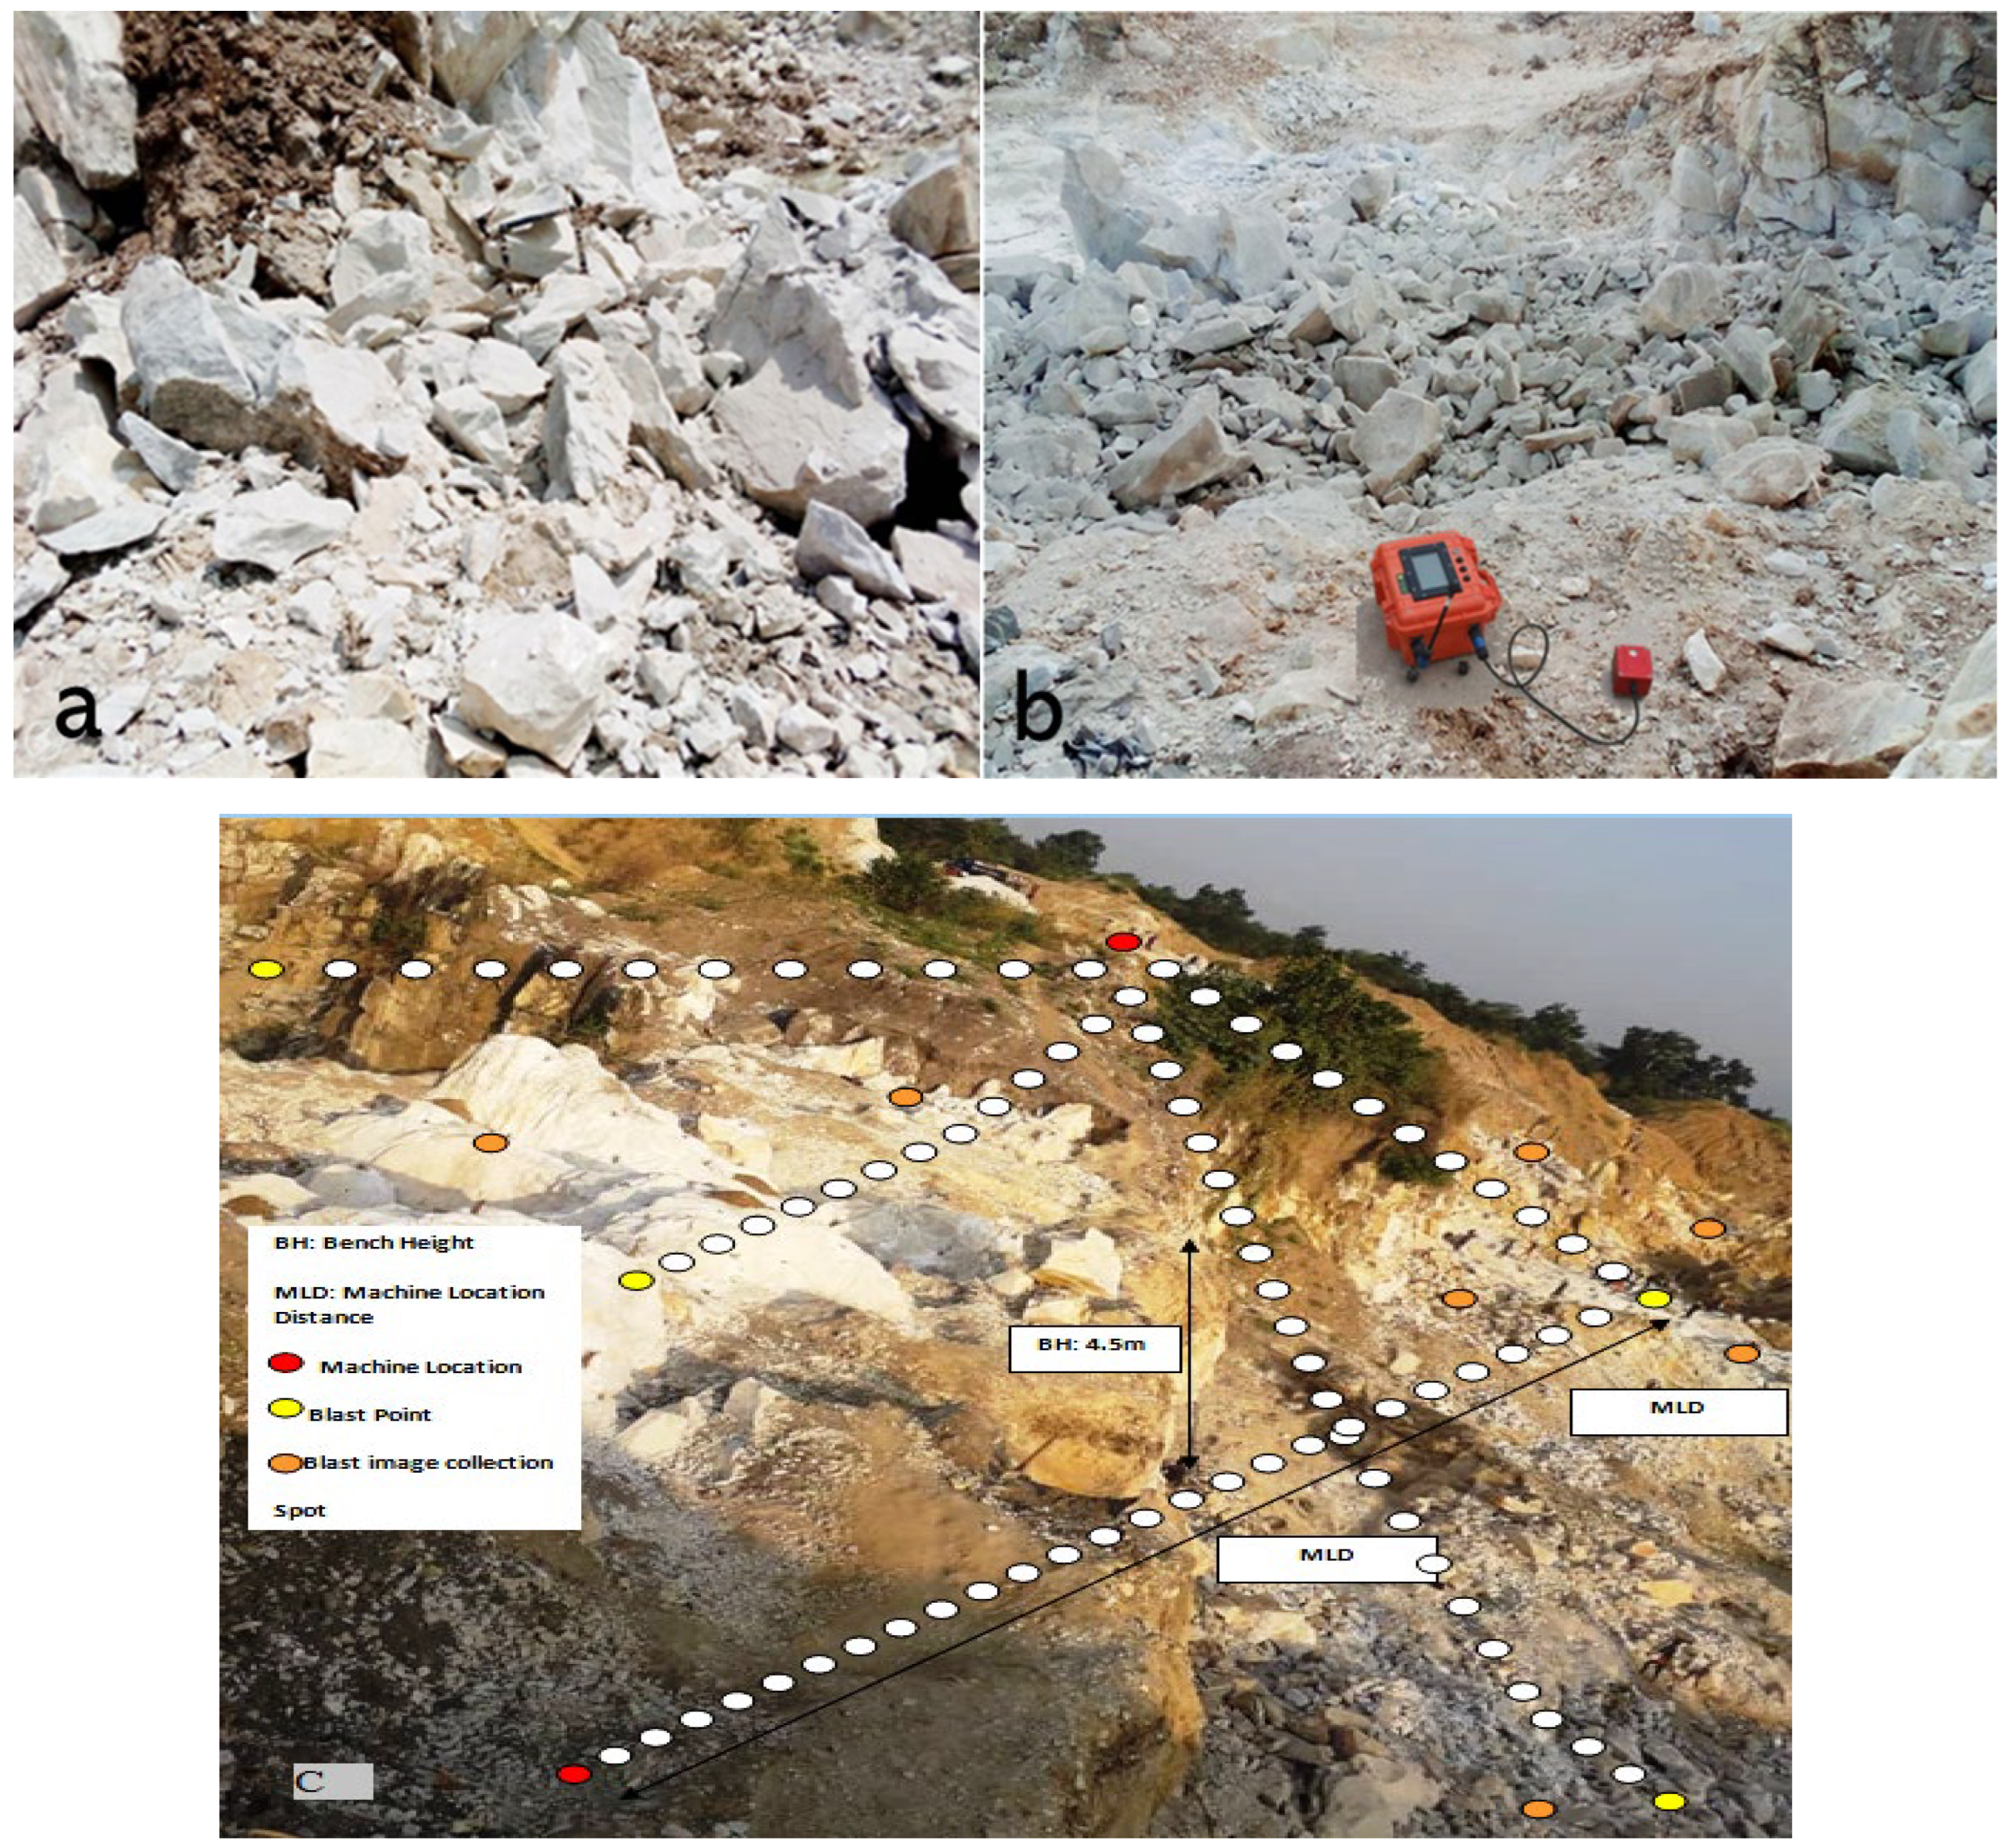
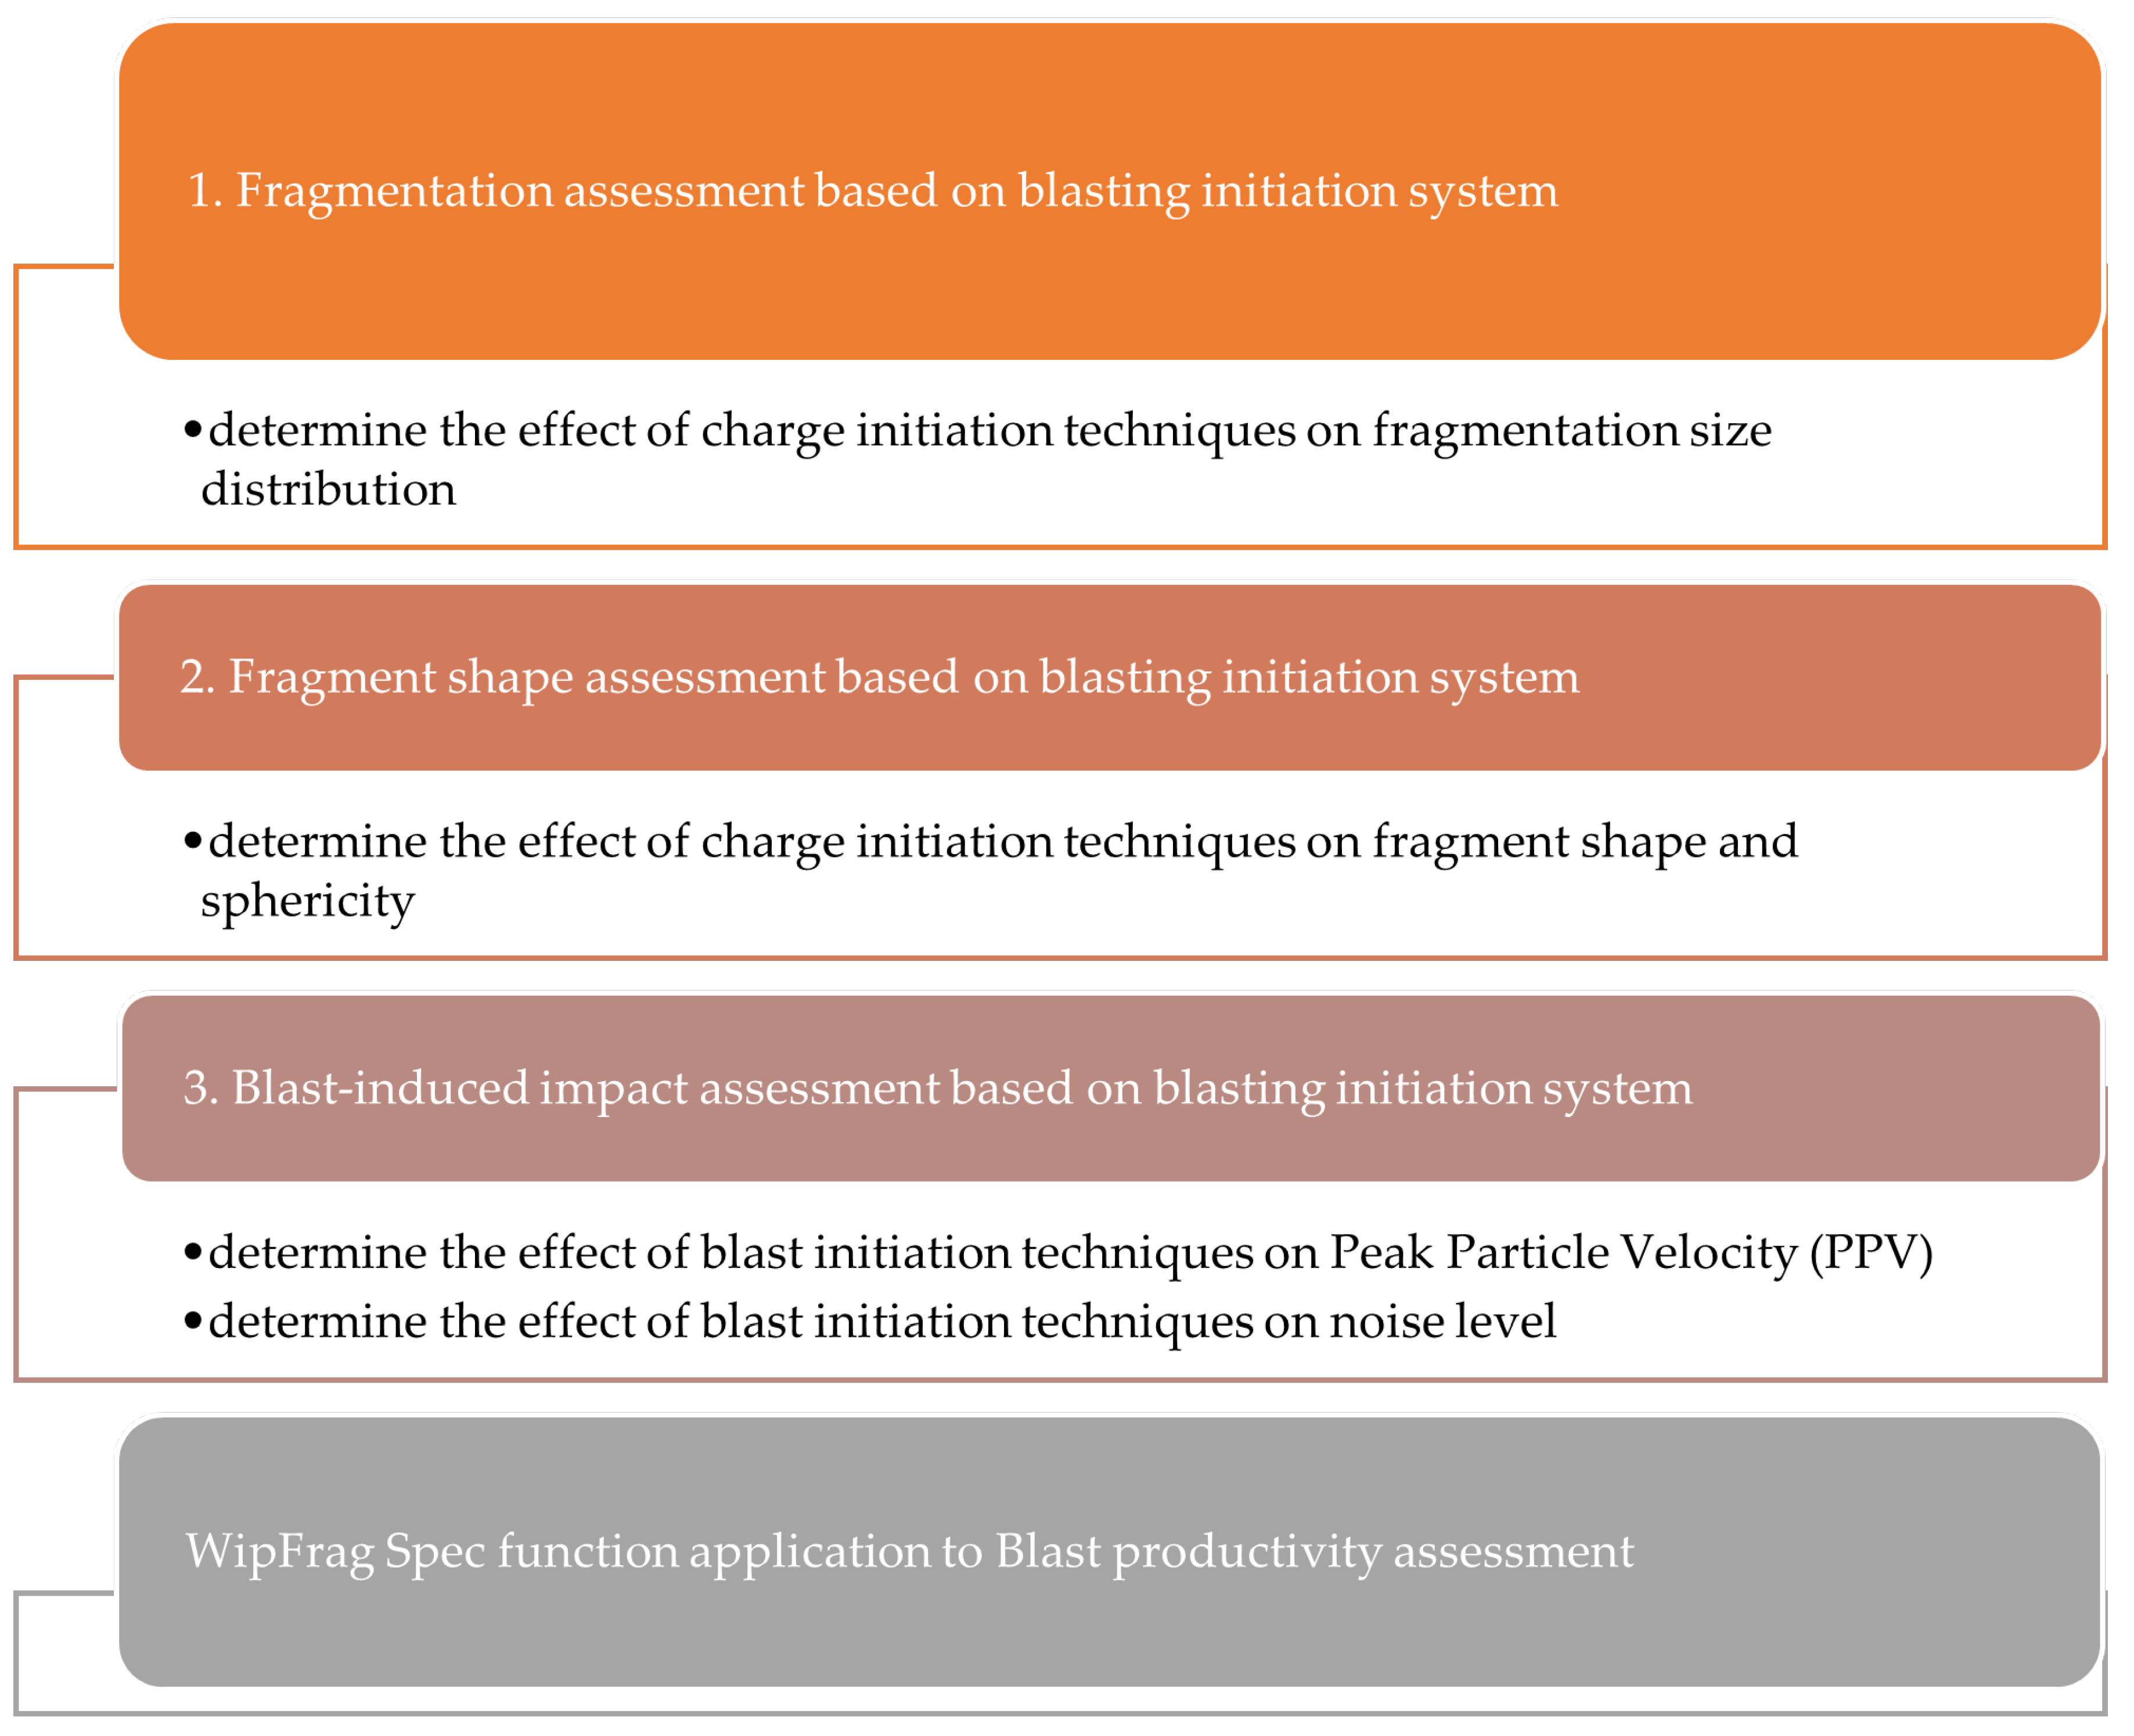
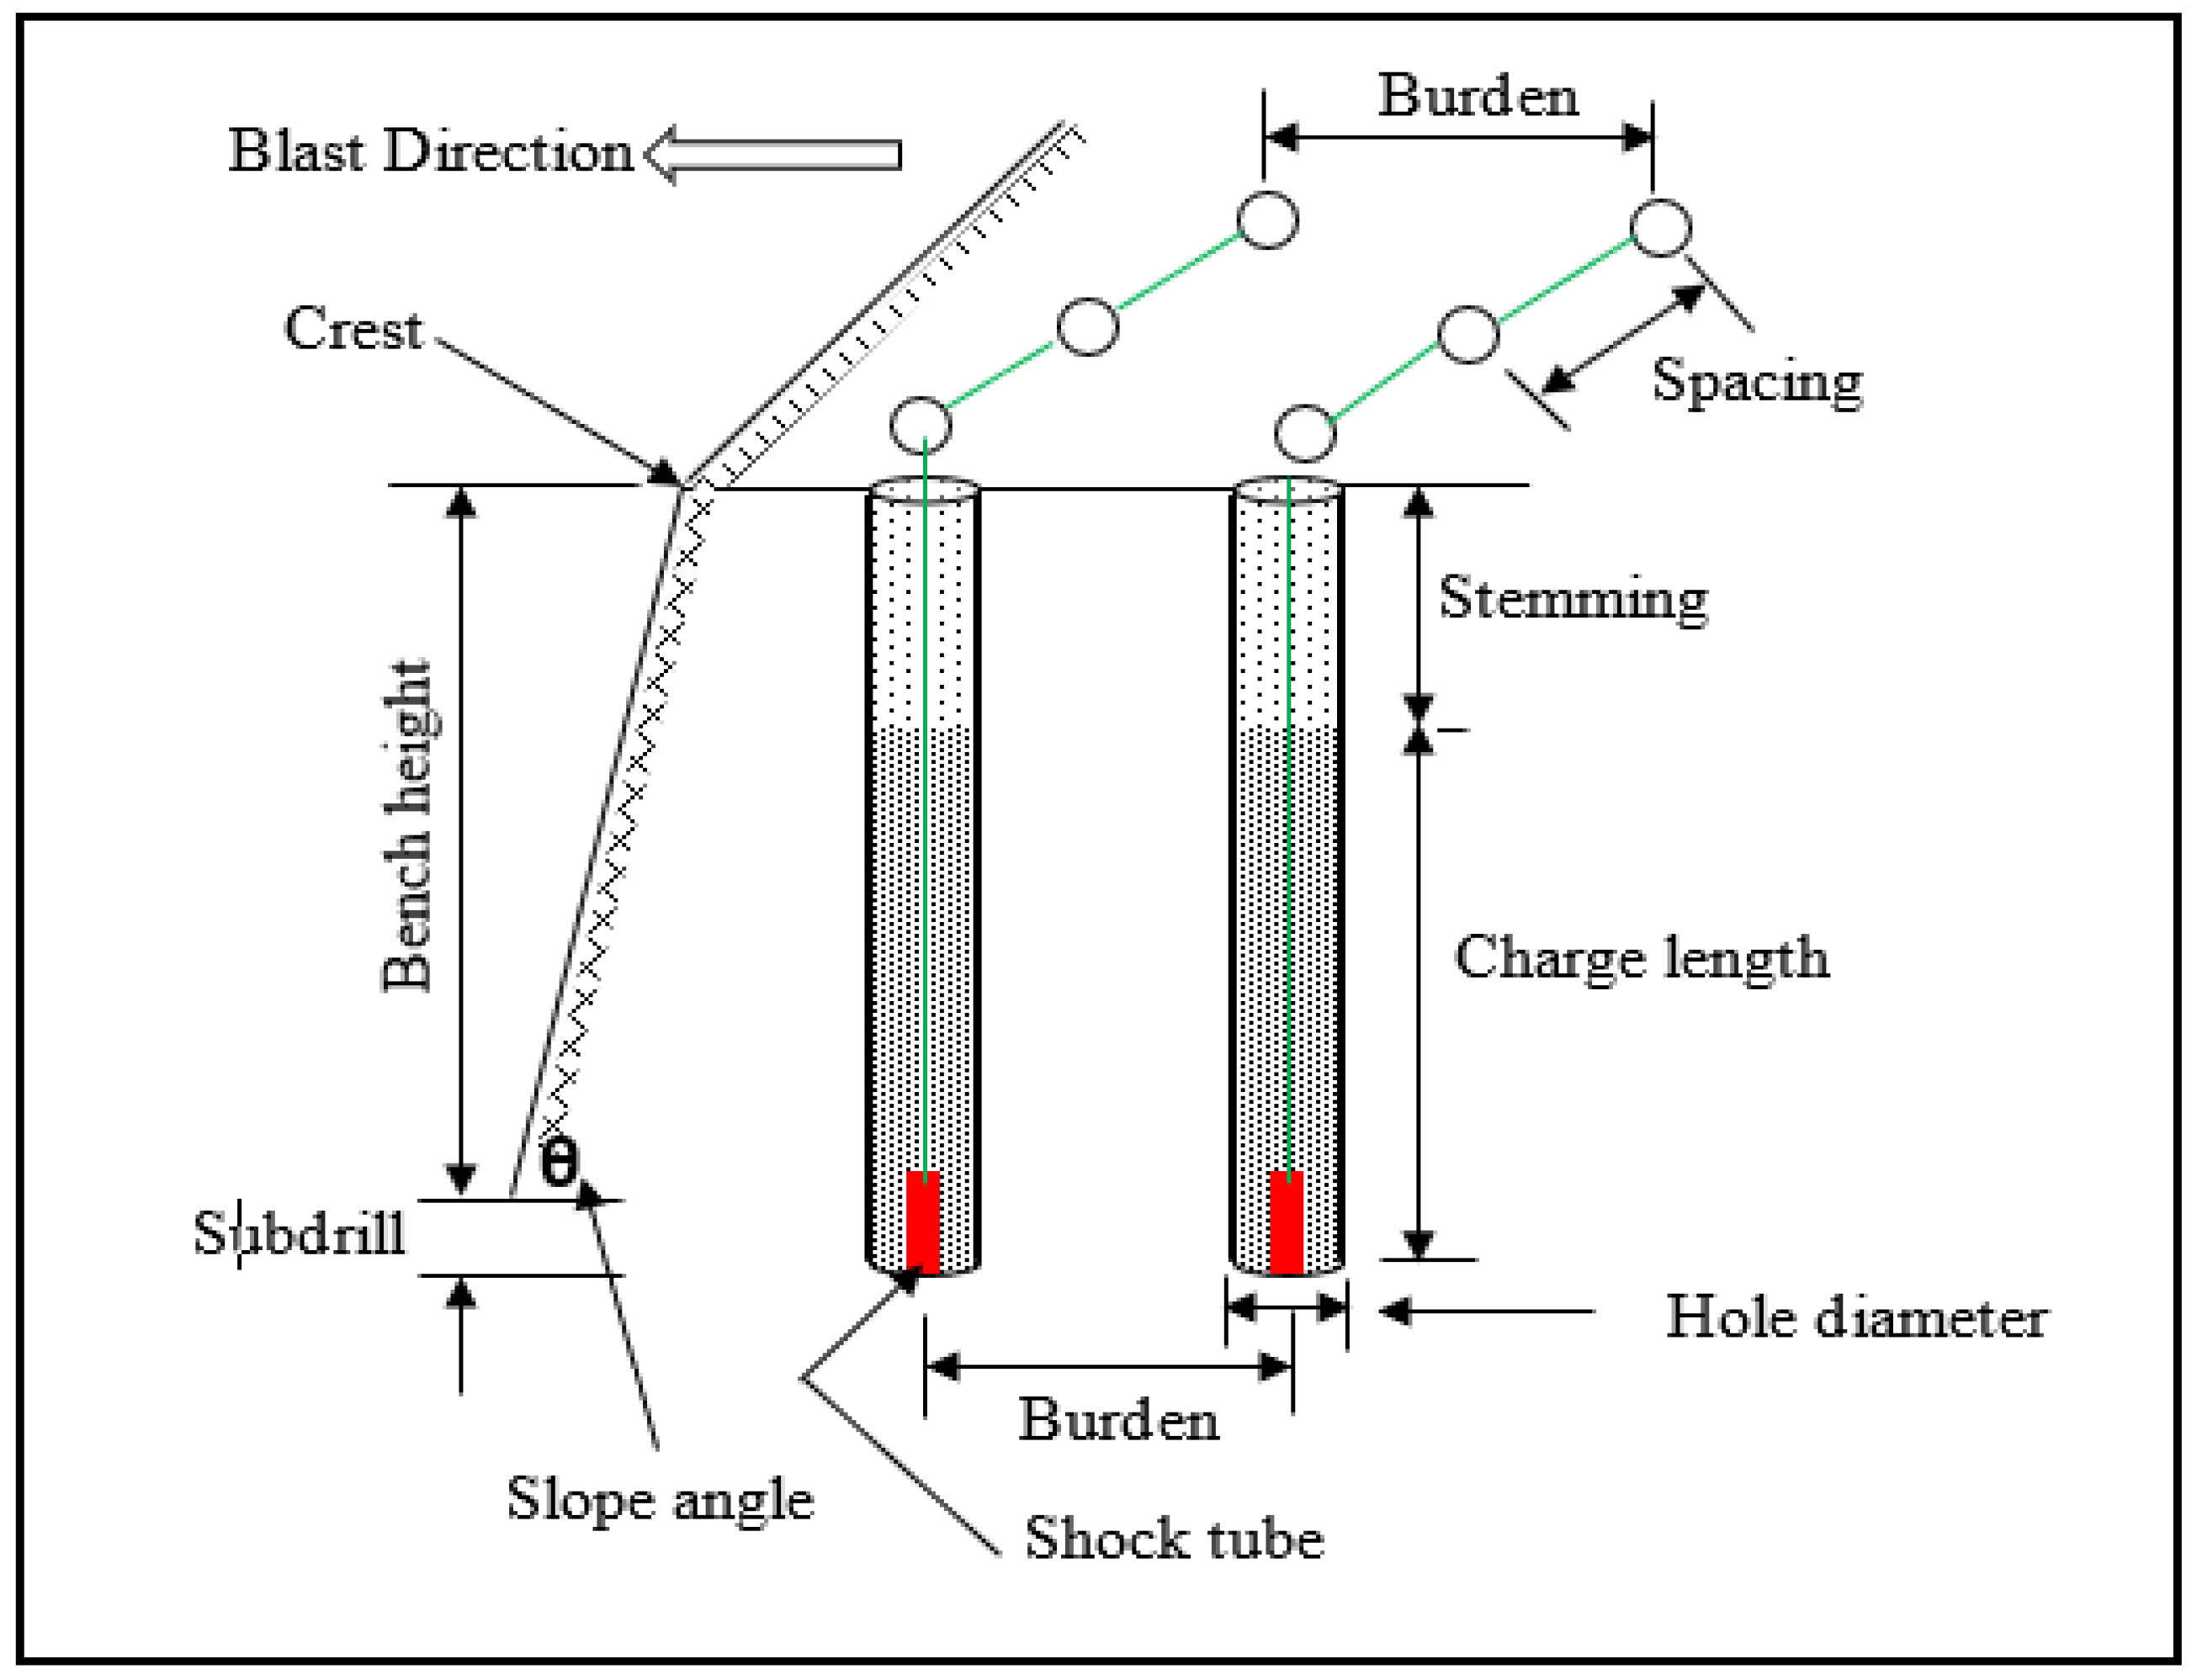
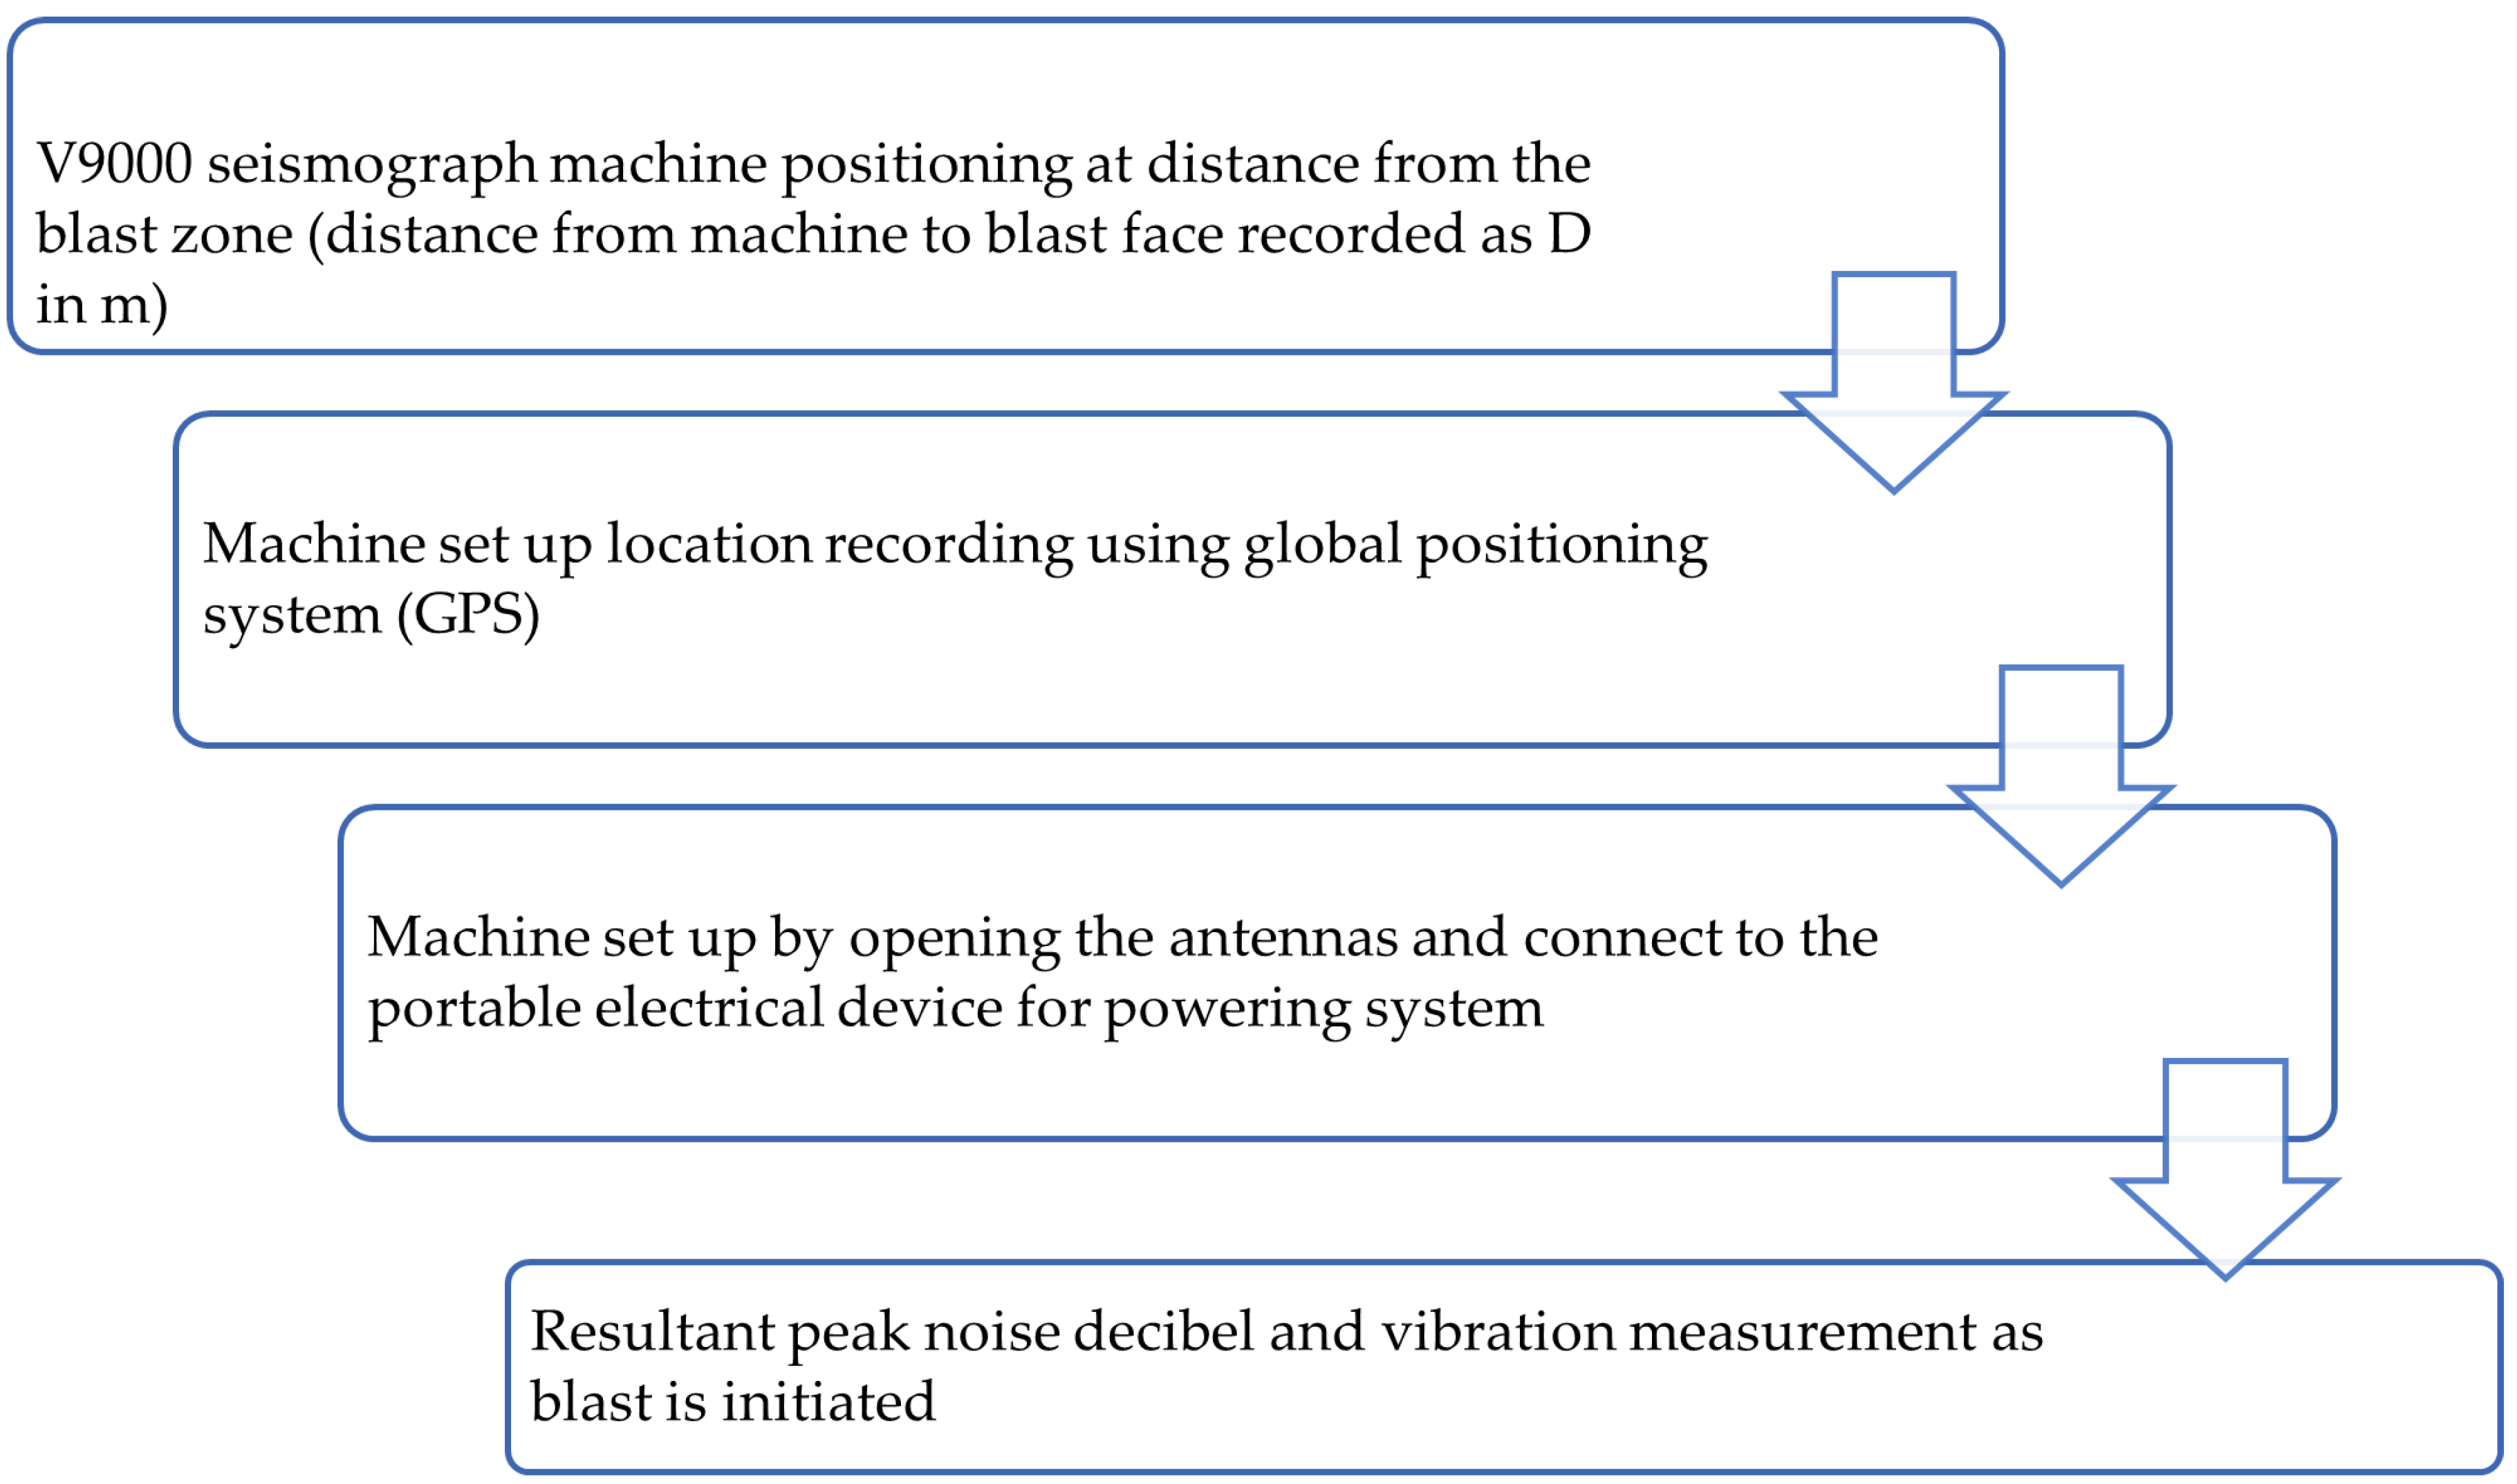
2. Materials and Methods

This section explains the methodology used in achieving the purpose of this study and also gives brief information about the mine’s geological properties and mine site’s state-of-art condition.
The case study mine, a small-scale quarry in Akoko Edo, Edo state, Nigeria, is located in Akoko Edo, Nigeria, as presented in Figure 1. WipFrag is an image inspection framework used to analyze the size distribution of material such as blasted or crushed stone heaps. WipFrag, according to Maerz, is a cutting-edge image-based granulometry solution built particularly for high-contrast graytone images [23]. The WipWare sample guide version 1 approach was used to acquire fragmentation images from 12 production blast rounds for size distribution analysis using WipFrag version 3.3 [23]. After blasting and midloading operation time, blast images were captured with a camera totally with the necessary scaling object, as specified by the WipWare sample guide (see Figure 2). Figure 3 depicts the flow sheet/specific objectives of this research project.
The quarry blast report provided blast design characteristics such as burden, spacing, drill hole length, hole diameter, and stemming for 12 blast rounds. According to the quarry blast design that was observed, the drill pattern utilized in the mine was identified as staggered. Twelve blast rounds were used in this investigation to assess the performance of electric and nonelectric blast initiation production. [24] A nonelectric detonator comprising a flexible tube made of plastic with a diameter of 3 mm was proposed. The detonator cord employed has a velocity of detonation (VOD) of 2000 m/s. The electric detonator is made up of a thin plate with a thickness of 0.3 mm and a copper or aluminum tube with a diameter of 6 mm and a length of 32 to 53 mm [23]. The detonator tube is made up of a base charge and a prime charge; the main charge includes the detonating medium, pentaerythritol tetranitrate (PETN). The lead azide, lead styphnate, and a trace of aluminum powder known as azide styphnate aluminum (ASA) are all present in the prime charge as an initiating substance [25,26]. In this study, plain electric and NONEL detonators were used for six explosion rounds each. The primer charge was placed at the bottom charge for all the blast rounds.
The impact of the initiation method on fragmentation results, blast-induced vibration, and noise levels generated was investigated using Vibrock V9000 seismograph obtained from Fanalou company located in Edo state Nigeria (see Figure 2). The distance between the seismograph locations and the blast’s center ranged from 100 to 305 m. The seismograph system (2 kg boxed weight) with an internet-based remote and GSM function was employed (see Figure 2). The seismograph is totally self-contained. The V9000 seismograph frequency analysis and plotting started from 0.1 mm/s, auto range from 0.1 mm/s to 200 mm/s, and auto record length from 2 to 18 seconds (in impulse mode). During each blast, seismographs were employed to capture the blast-induced ground vibrations. During each blast, the seismograph was placed close to the mine warehouse structure on the side facing blasting operations; the actual ground vibrations to which the structure was subjected were measured and quantified. According to Stagg and Engler [26], the distance from each seismograph station to the center of the blast was measured.
Additionally, the first stage of installation involved identifying and placing all the monitoring equipment. Prior to proceeding, the quarry management team assessed the dimensions of the quarry and the pit in general, the technique used for blasting, and the proximity to surroundings near the mine site. Once the location was determined, the equipment was arranged and adjusted in accordance with the guidelines provided by the manufacturer. The seismograph was placed on the ground to collect the vibration passing through and to create stable measurements. A pack of sand was placed on the top of the geophone to protect it from losing the ground and to create stability during measurement.
Table 1 provides a summary of the quarry blast design parameters. To achieve the study aim, three (3) separate pits were considered with two different blast rounds. For each pit, the first and second blast round was carried out with 35 and 56 drill holes, respectively, as presented in Table 2. The blast holes were charged with both secondary explosives and blast agents. The average burden, spacing, stemming length, and charge weight were, respectively, 0.85 m, 1.10 m, 0.66 m, and 1.1 kg (see Figure 4). The drill holes are vertically drilled with jackhammer of 40 mm diameter and average of 4.05 m (3 rods) bench height. The typical stiffness ratio was 1.6, and the mine blast power factor ranged from 0.6 to 1.0 kg/m3. The bottom charge material in the case study mine was Dynogel explosive, and the hole column charge material was ammonium nitrate fuel oil (ANFO). Blast images were captured using high-resolution camera after each blast. The blast rounds were initiated using instantaneous detonator for both cases.
WipFrag 3.3 software developed by WipWare Inc, ON, Canada was used to perform fragmentation analysis on the blasted material after each blast round. As [27] points out, fragmentation analysis allows for the determination of rock size and the distribution of particle sizes. In mining operations, digital image analysis technology (DIAT) as developed by WipWare Inc. provides an automated system that estimates material size distribution, resulting in cost savings and reduced damage caused by excessive materials. WipWare Inc. is a Canadian firm that specializes in image analysis software and technology for the mining, aggregate, and related industries. Tom Palangio launched the company in 1995, seeing a need for automated image analysis technologies in the mining industry. WipWare’s main product is the WipFrag program, which analyses the size distribution of fragmented particles in a rock mass using digital image processing. WipFrag is a Solo System software package designed to analyze the size distribution of fragmented particles in a rock mass [28]. In the mining industry, WipFrag is extensively used to examine the size distribution of blasted rock pieces in order to optimize drilling and blasting operations [29].
To evaluate photos of fragmented particles, the software uses a technique known as digital image processing [30]. The user uploads a snapshot of the rock pile or muck pile into the software. The software then recognizes and measures the size of each particle in the image automatically. WipFrag provides a size distribution graph of the particles, which may be used to calculate the average size of the fragments, maximum and minimum sizes, and size distribution uniformity. In this work, WipFrag version 3.3 was utilized to evaluate the influence of both electric and nonelectric initiation mechanisms on fragmentation shape and size distribution. A systematic sampling technique was used in this work to avoid the difficulty of material proportion oversight. Each blast round was scaled with known dimension objects and captured at different loading stages. The size distribution assessment took into account both the first material spread after blasting and the loading advancement image. Table 2 present the blast ID used for the representation of both electric and nonelectric blasting results. The burden, spacing, and powder factor were different for the first and second blast rounds in the three pits used as case study in this study. Blast 1-1, Blast 2-1, and Blast 3-1 have the same design, while Blast 1-2, Blast 2-2, and Blast 3-2 have the same design.
The procedure for the measurement of the generated noise level and vibration is presented in Figure 5. Adopting the [31] analysis method, information on blasting activities was used to compile values of scaled distance for each recorded seismograph reading, using distance to the nearest recording seismograph. Scaled distance is defined herein as the distance from the blast to the recording seismograph, D, divided by the square root of the maximum weight of explosives detonated per 8-millisecond delay window, W, in kg. The results generated are interpreted and presented quantitatively and qualitatively in Section 3. The scaled distance equation suggested mostly for cylindrical charge in the literature was used for the prediction of peak particle velocity (PPV), as presented in Equation (1) [32].
SD = D W
where SD is the scaled distance in m/kg0.5, D is the measuring equipment distance in m, and W is the total explosive weight (kg).

3. Results

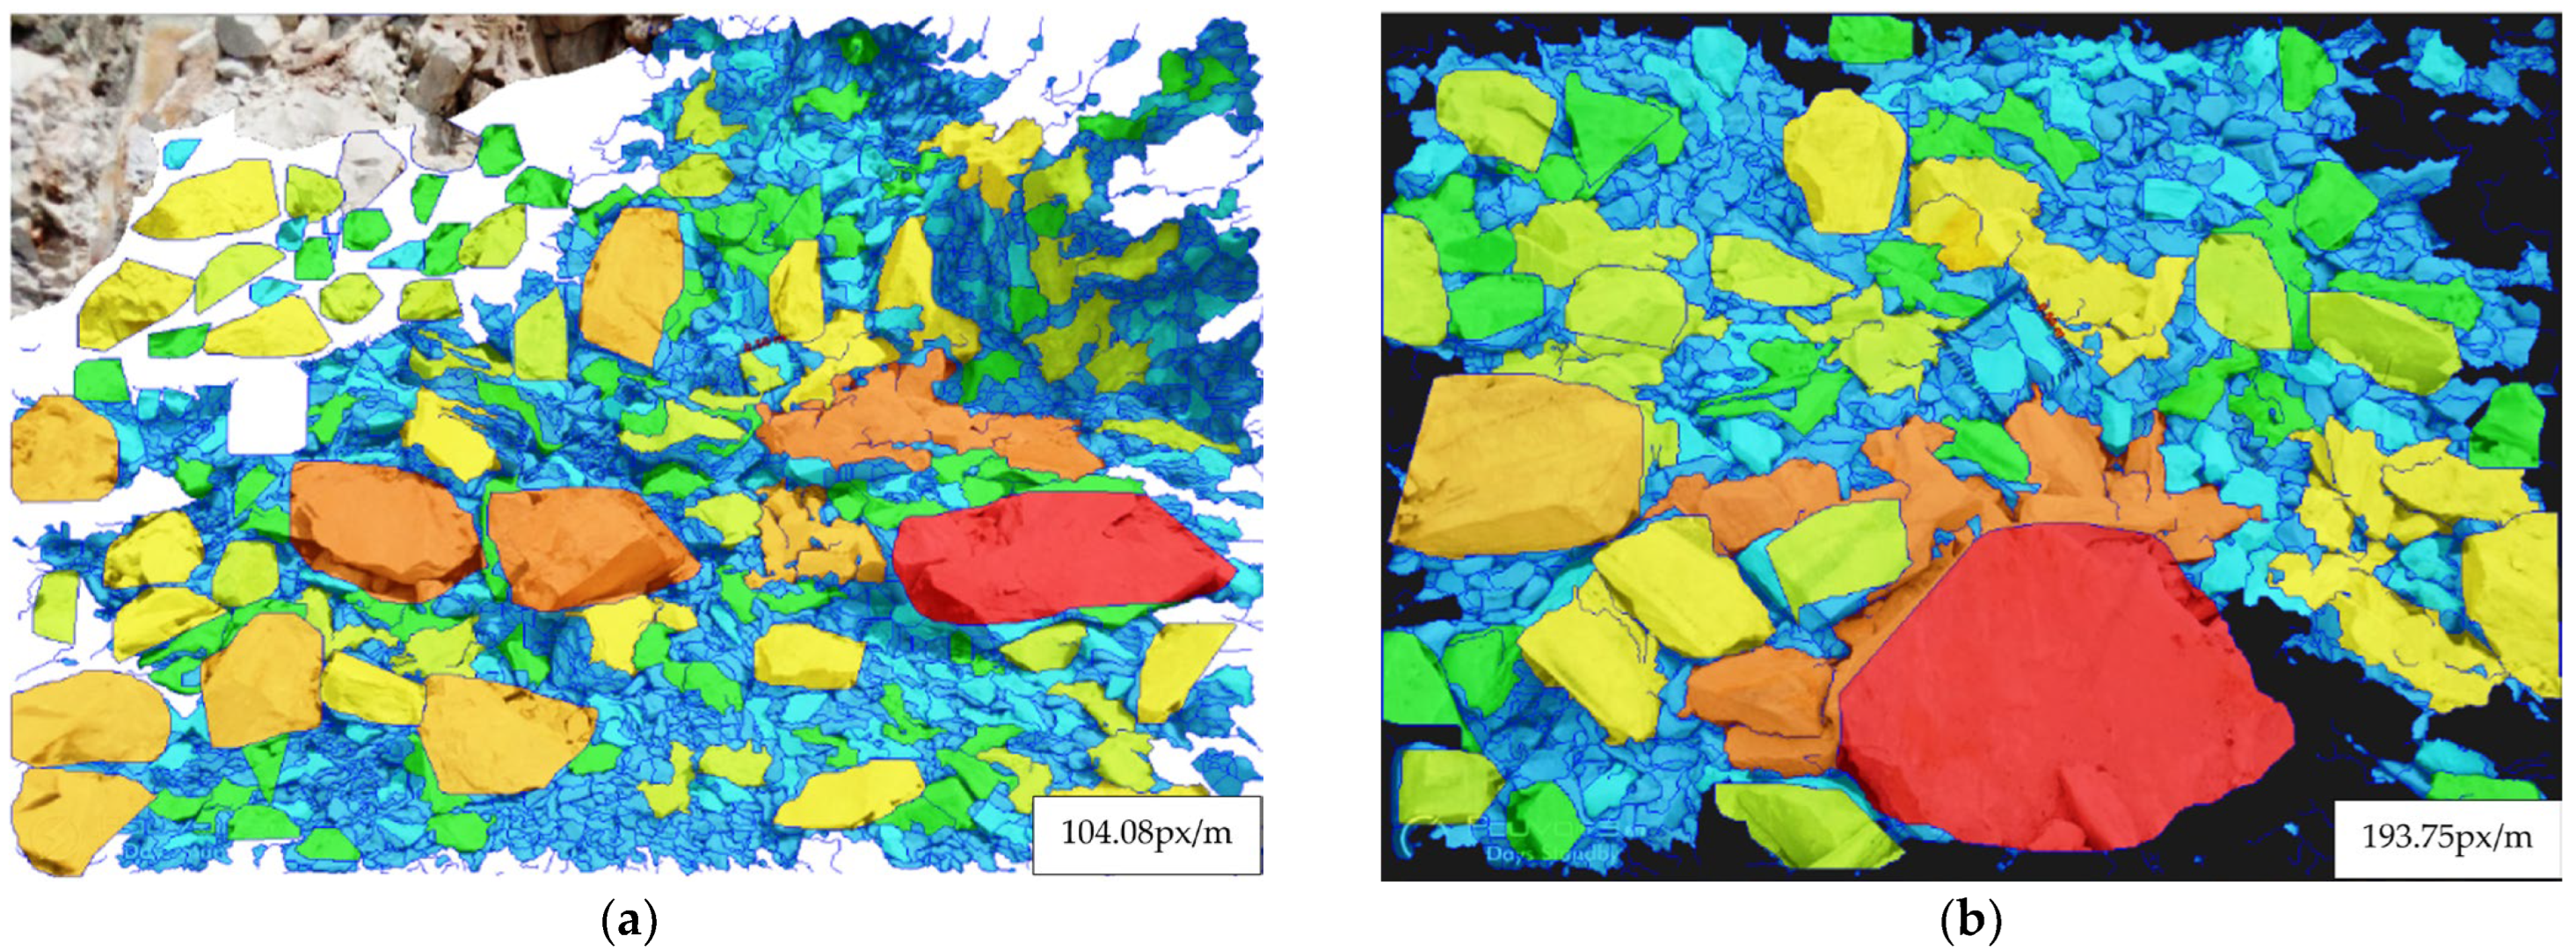
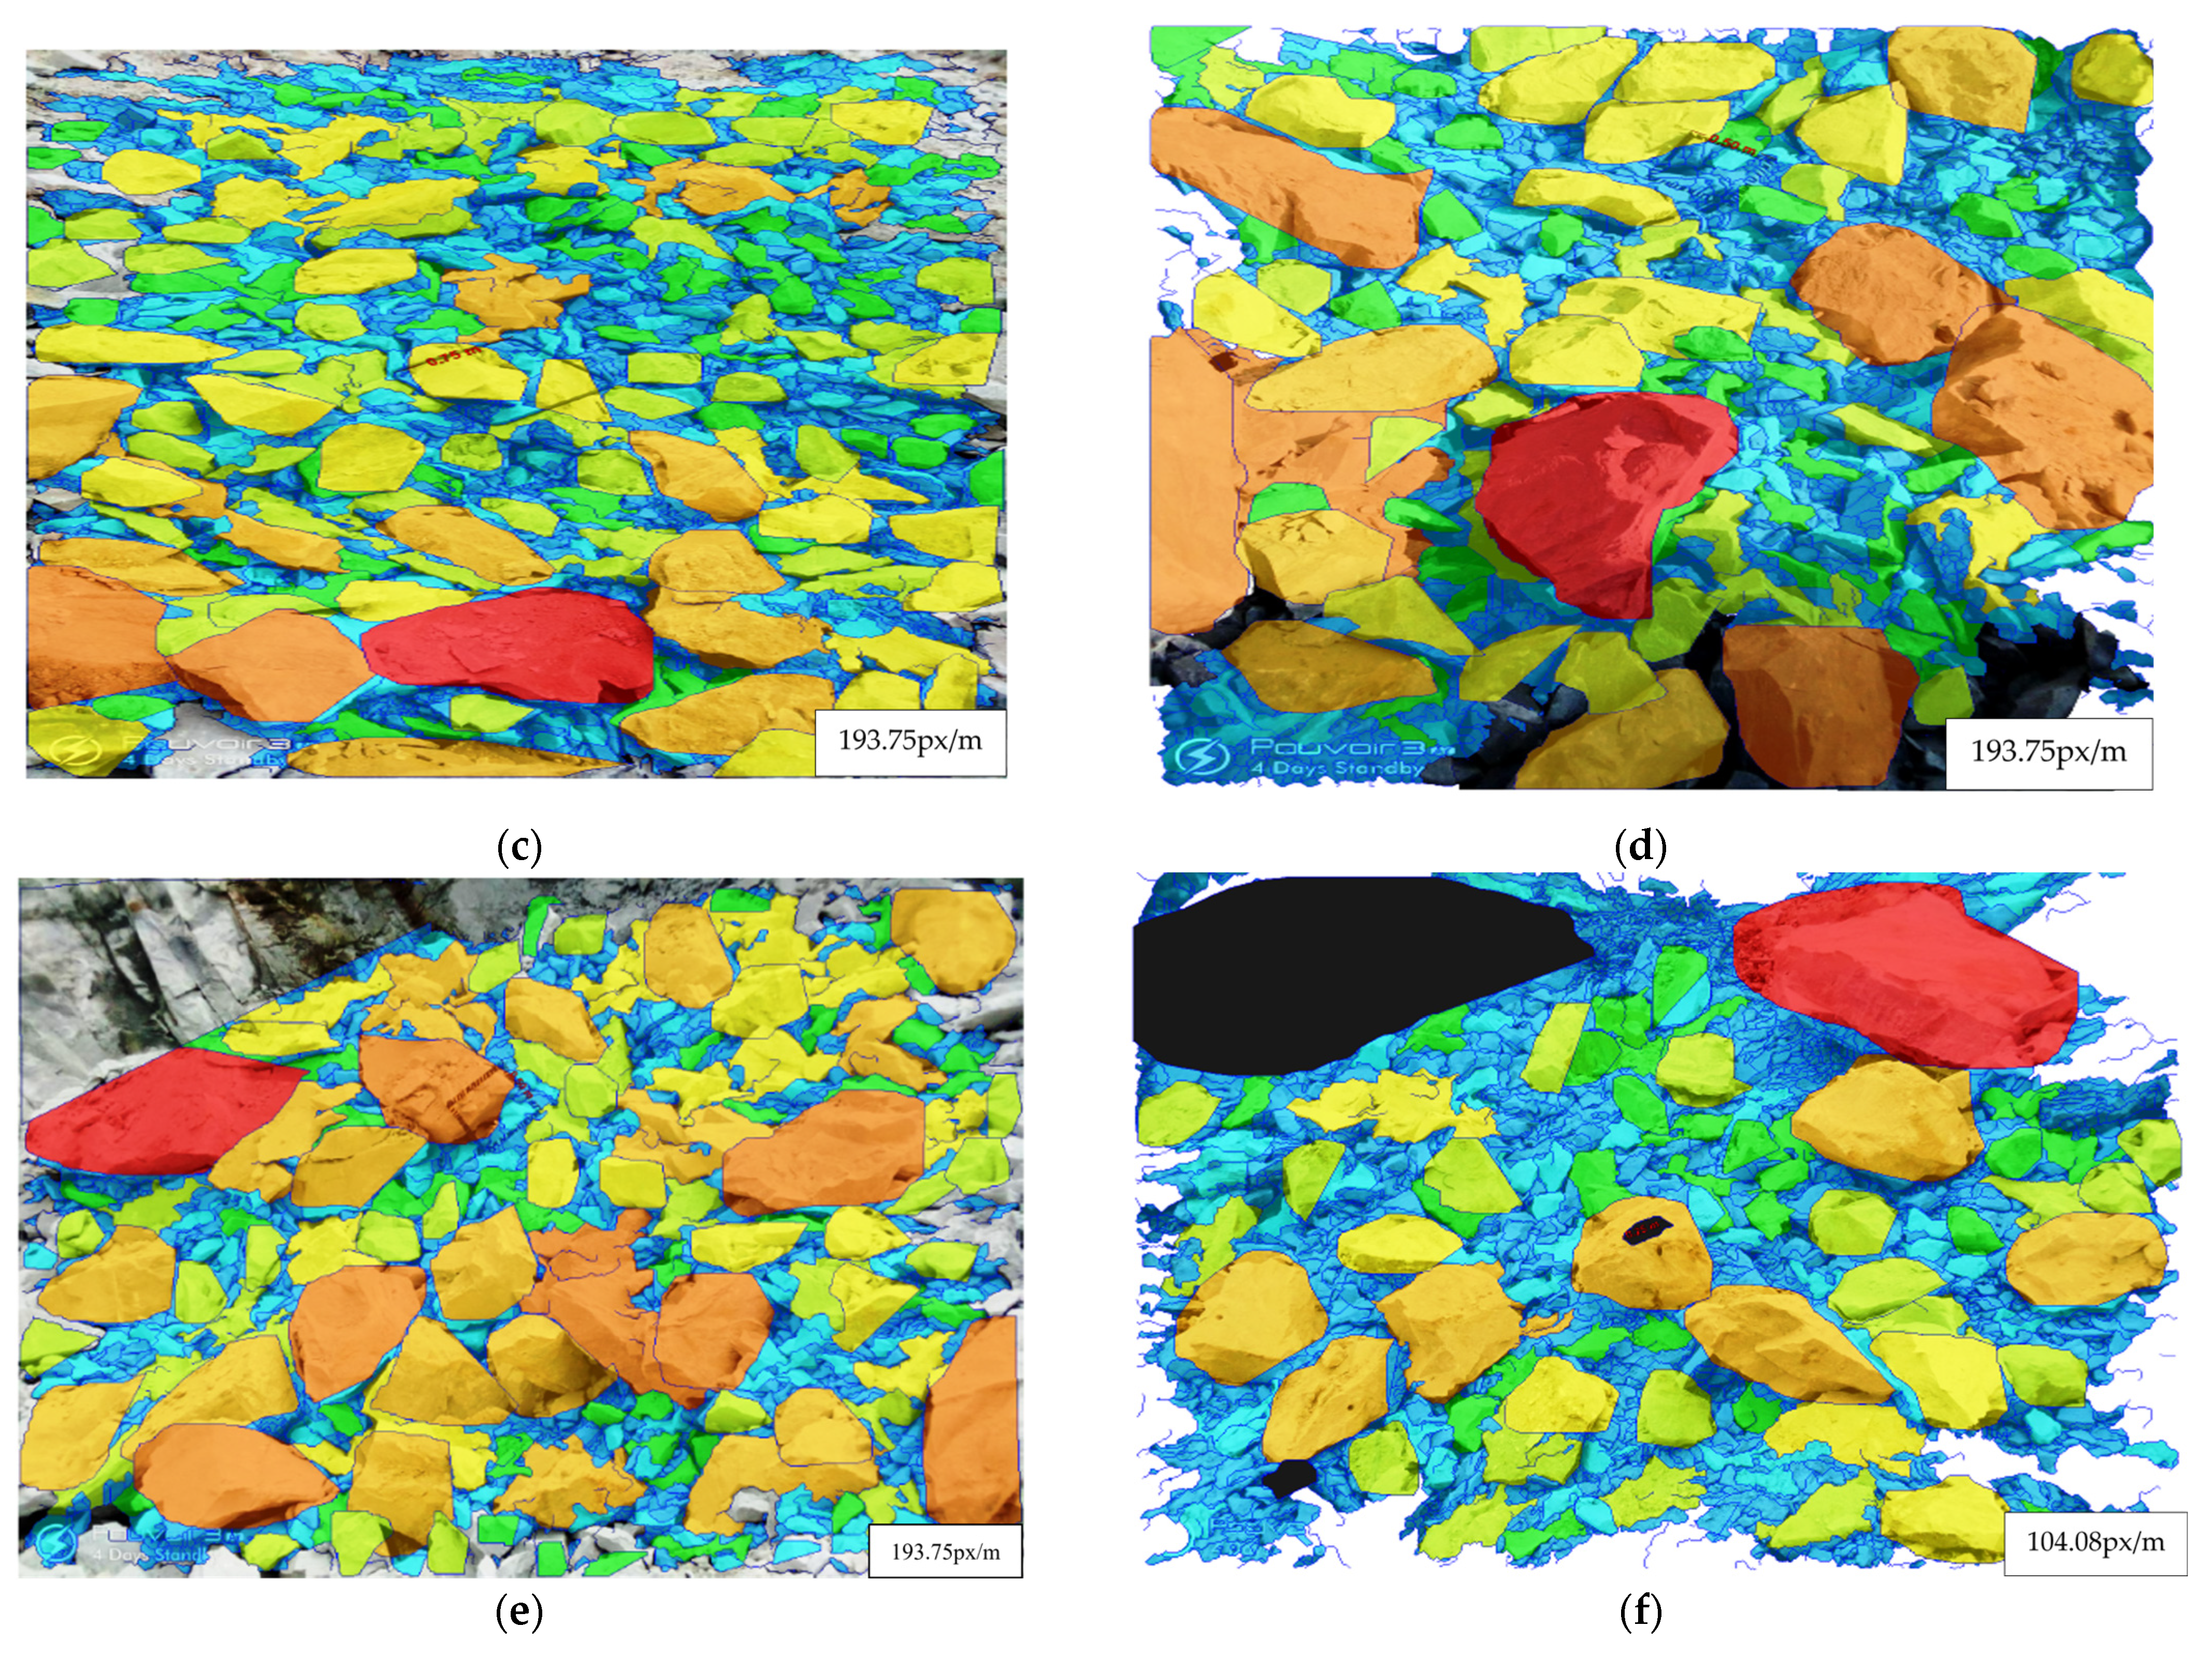
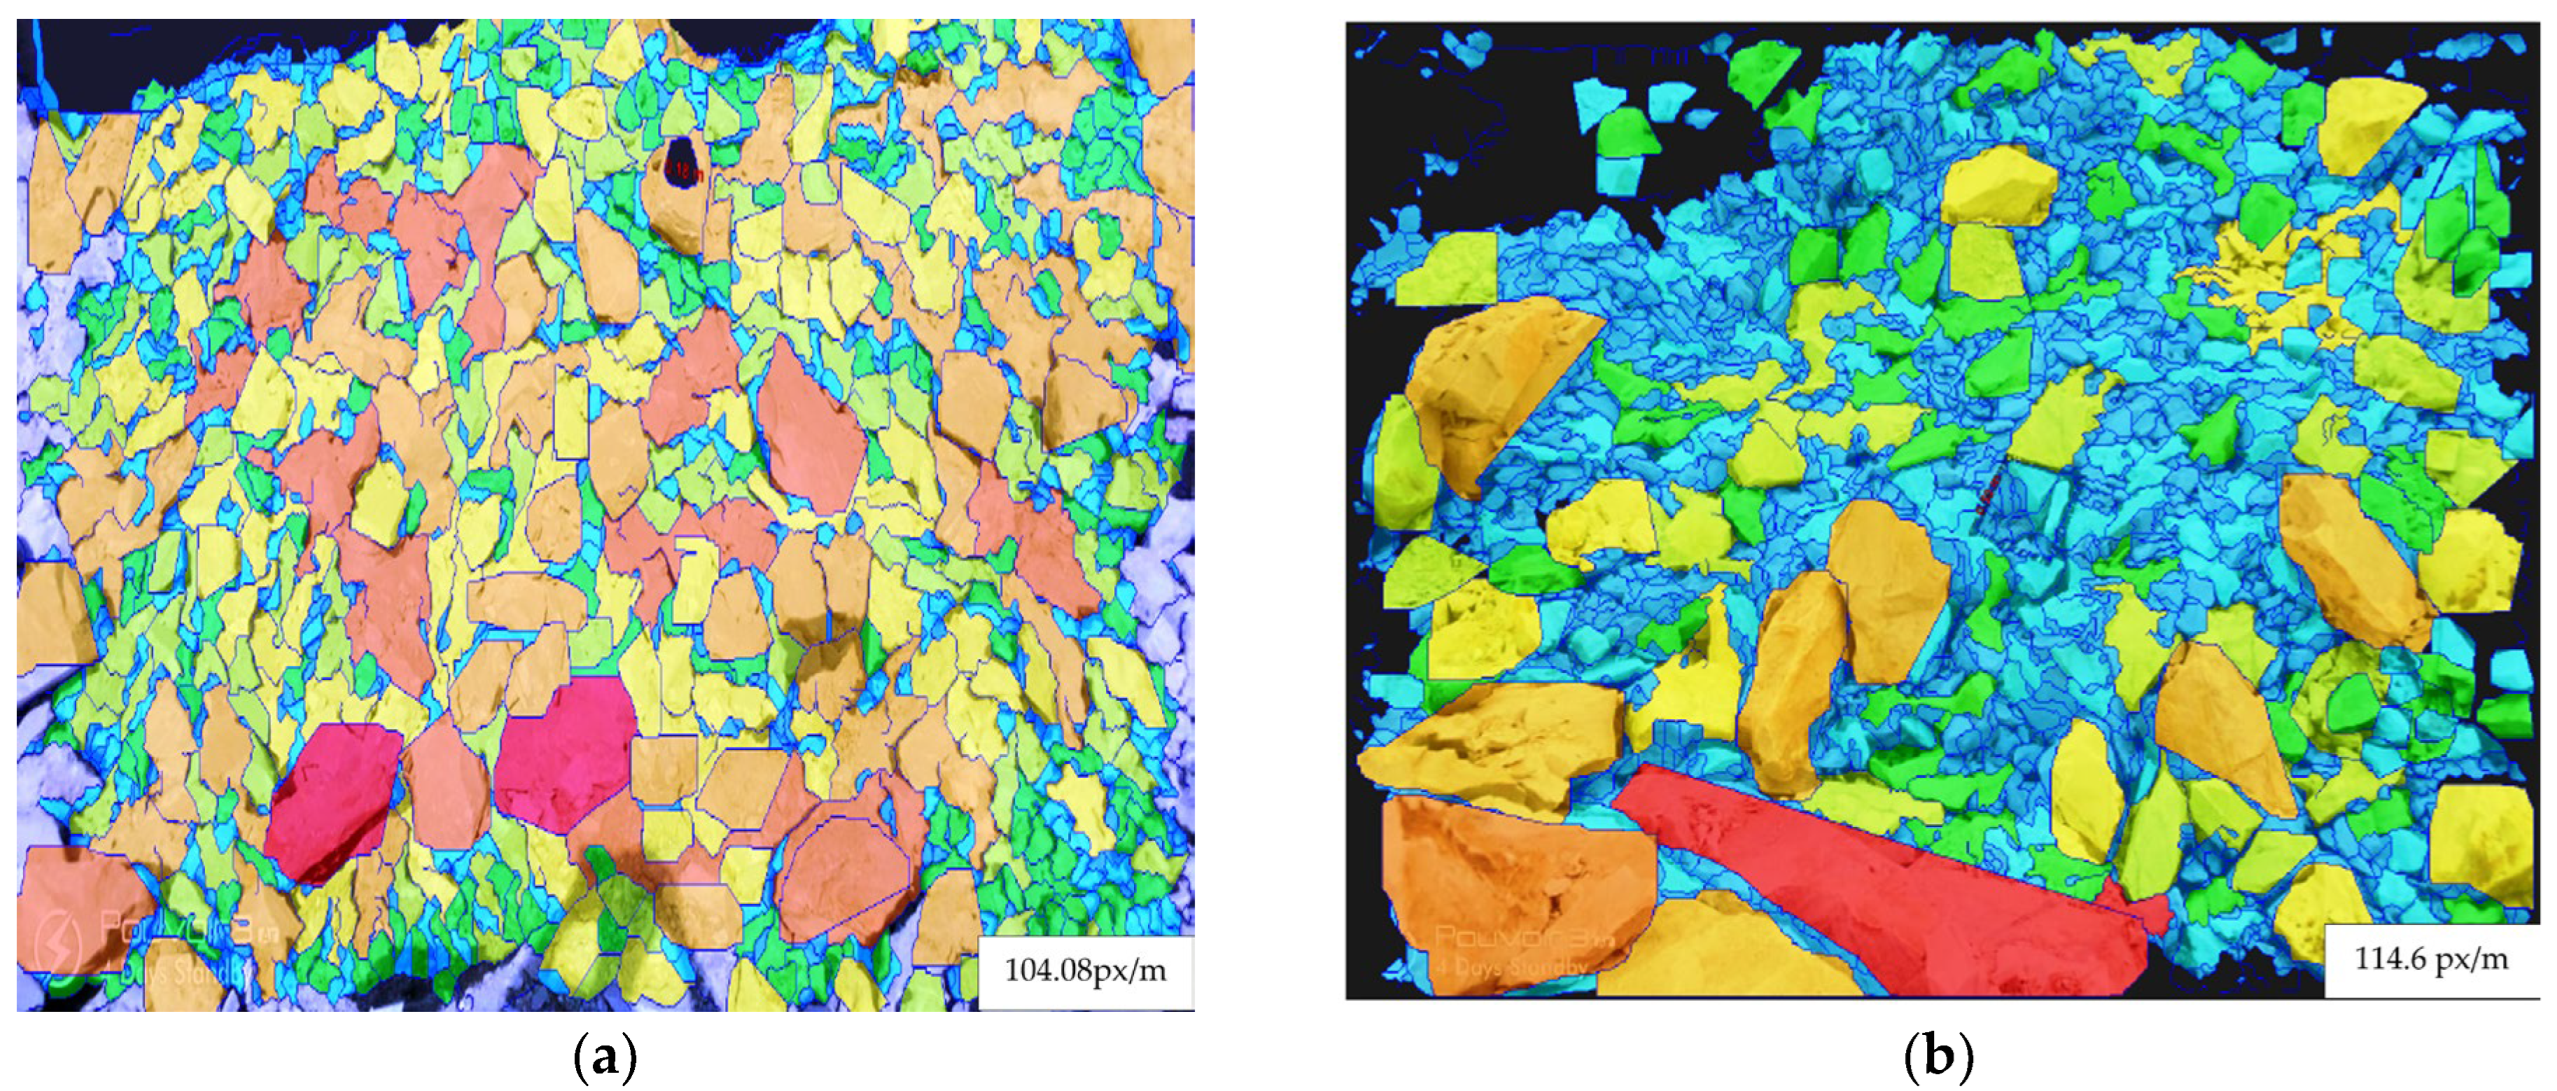
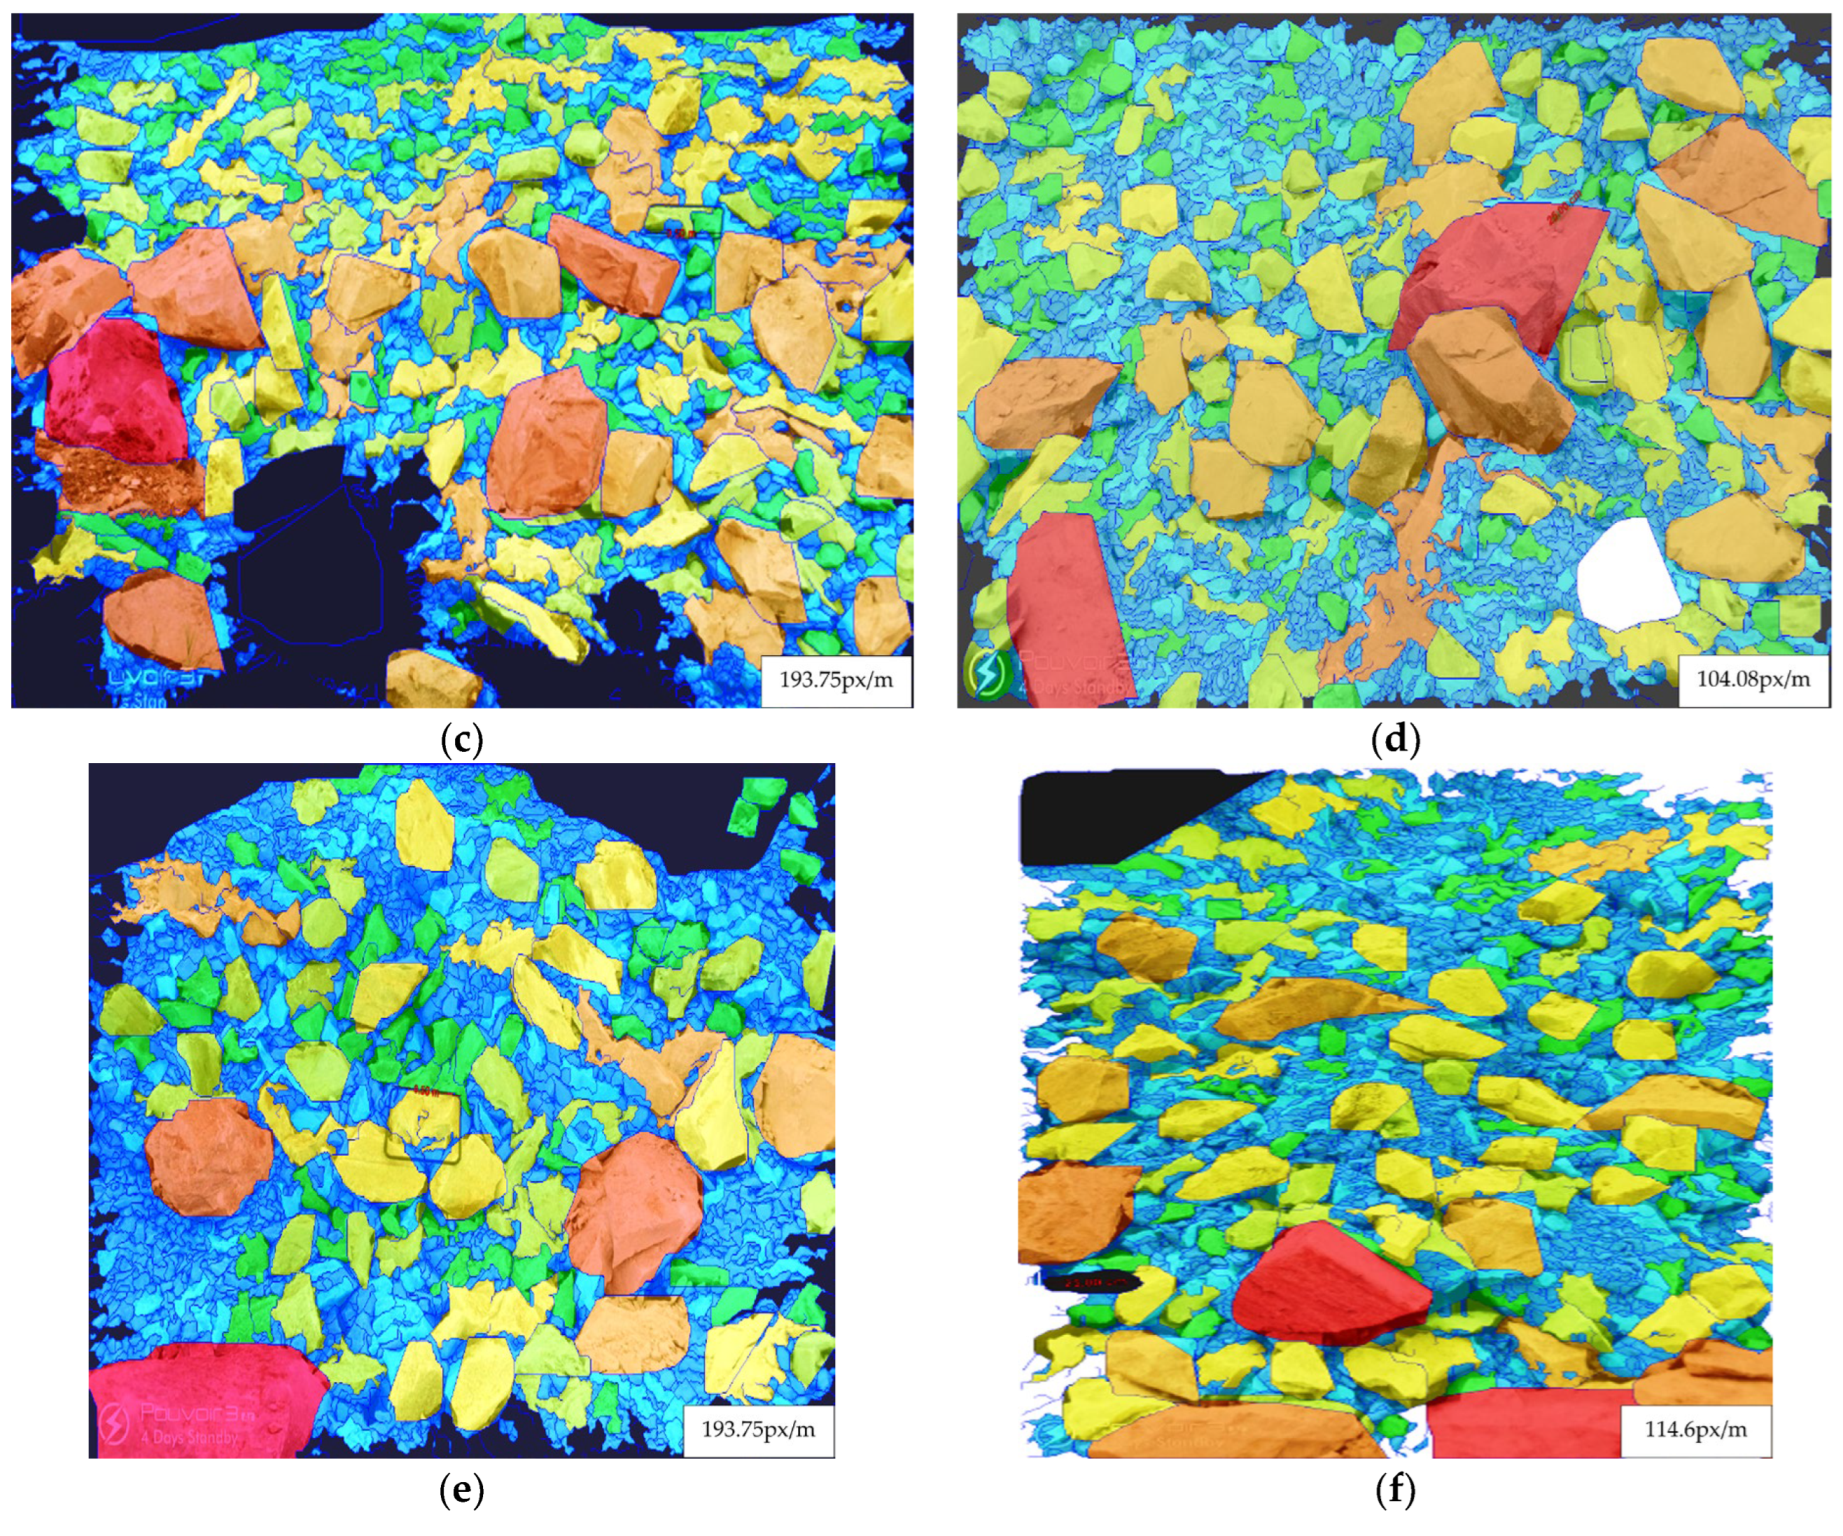
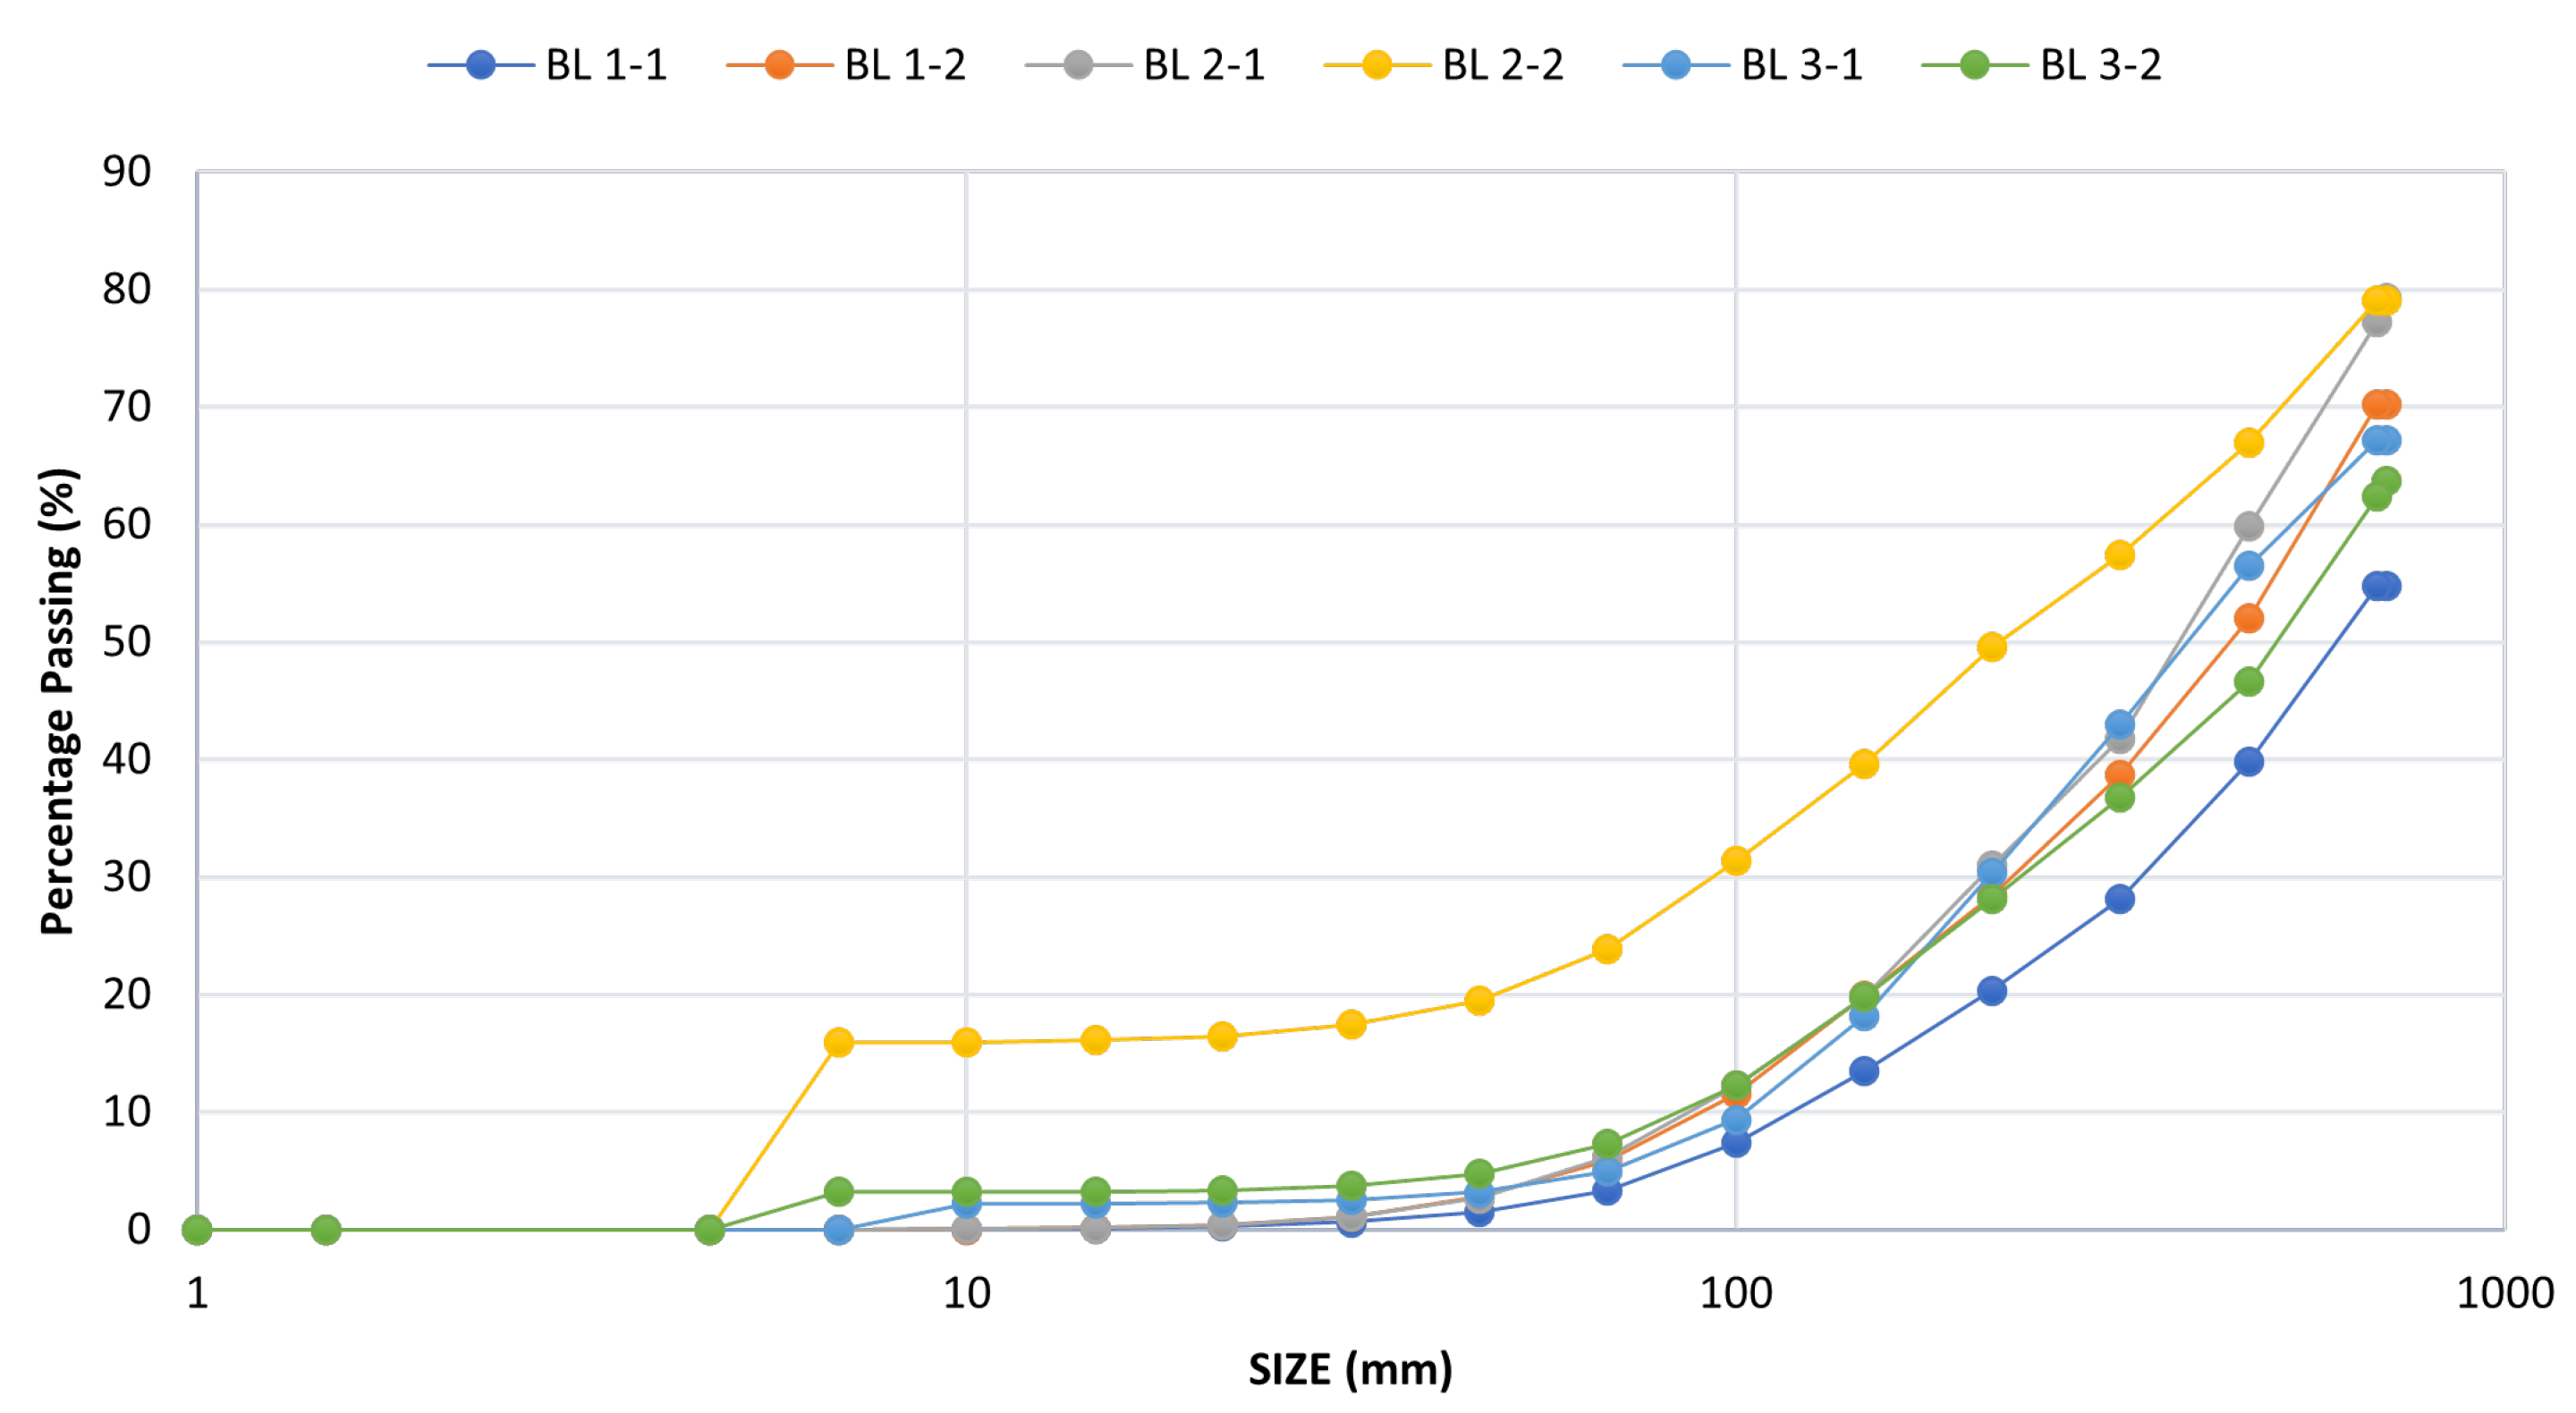
3.1. Fragmentation Analysis Results

The fragmentation results for both electric and NONEL blast rounds were determined and compared to assess the effect of blast initiation on fragmentation size. The image analysis results for electric and nonelectric blast rounds are presented in Figure 6 and Figure 7, respectively. The WipFrag 3.3 specification function used as downstream operation efficiency assessment was implemented in this study to consider the case company size distribution result expectation. Mesh sizes greater than 316 mm were tagged as oversized, and the spec was within a 0 to 20% retention rate. Mesh sizes less than 20 mm were tagged as undersized, and the spec was within a 0 to 20% grain passing rate. The optimum size range was set within 147–316 mm at a 70–100% spec range.

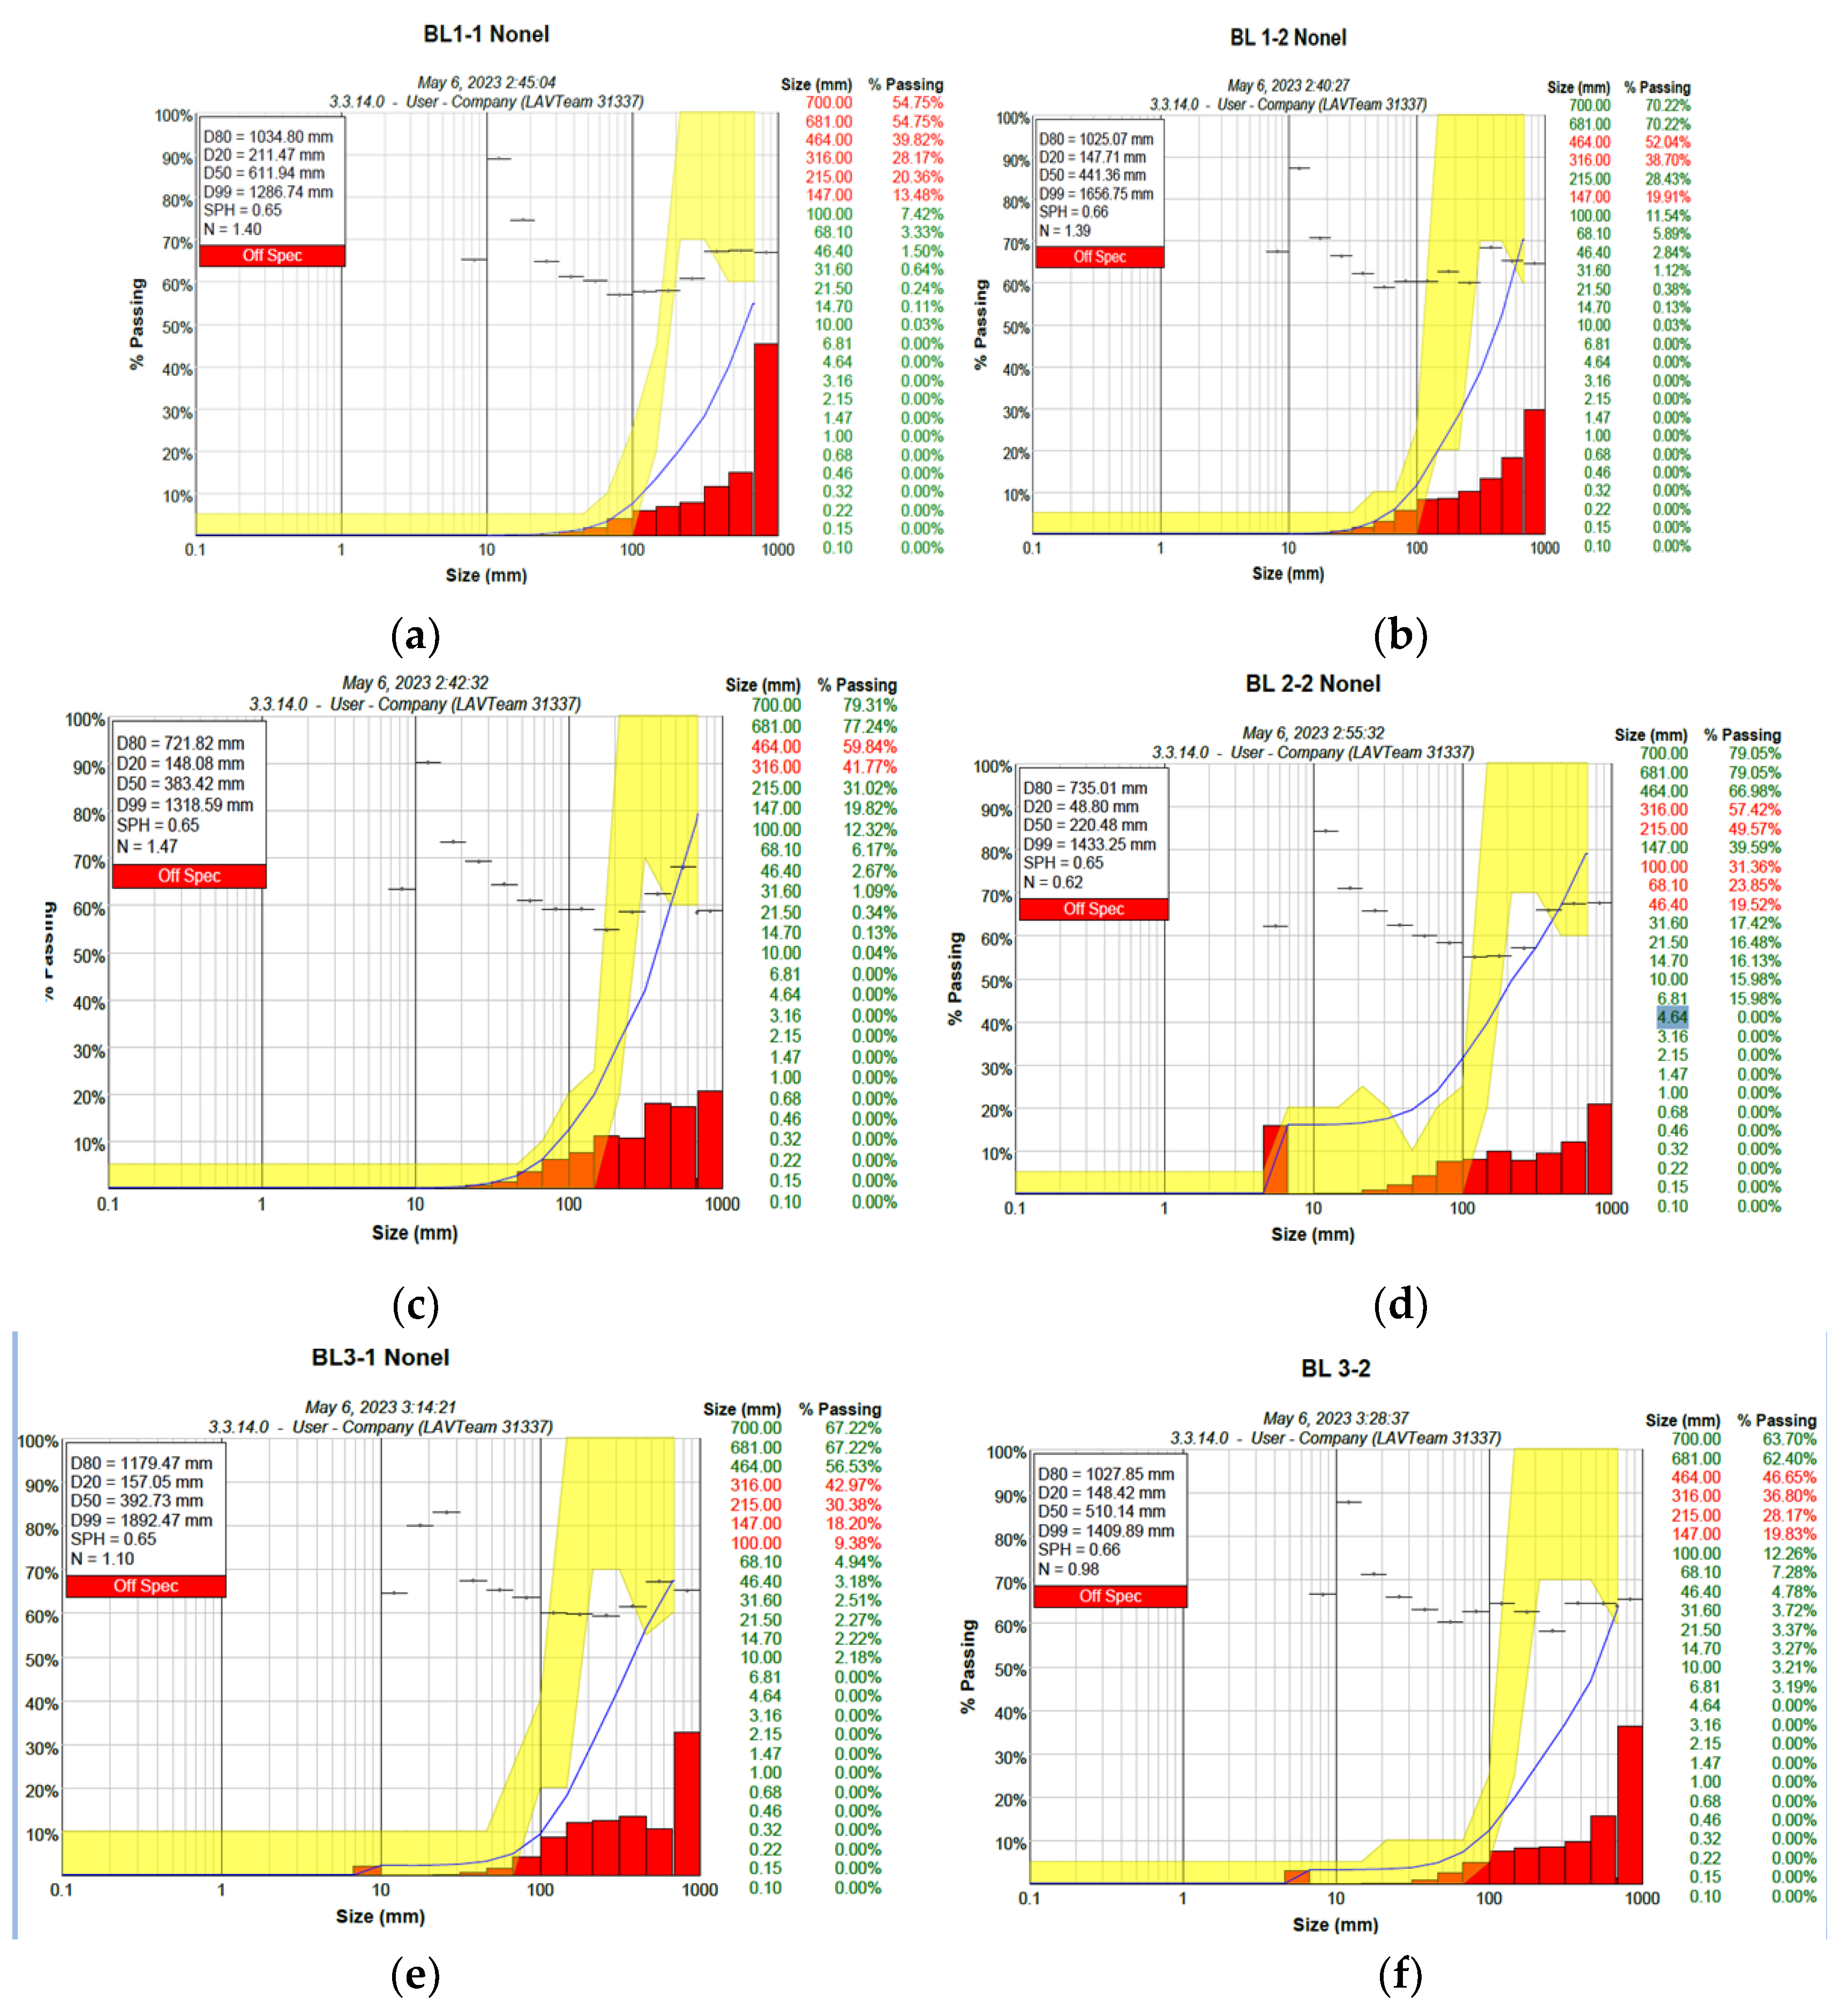
3.2. Fragmentation Result for NONEL Blasting

Figure 8 and Table 3 present the fragmentation size distribution obtained from the six nonelectric blasting results analyzed using WipFrag 3.3 software. The results, as shown in the cumulative curves, had bigger boulders, with sizes ranging from 735 mm to 1179.47 mm for the 80% passing size (X80).

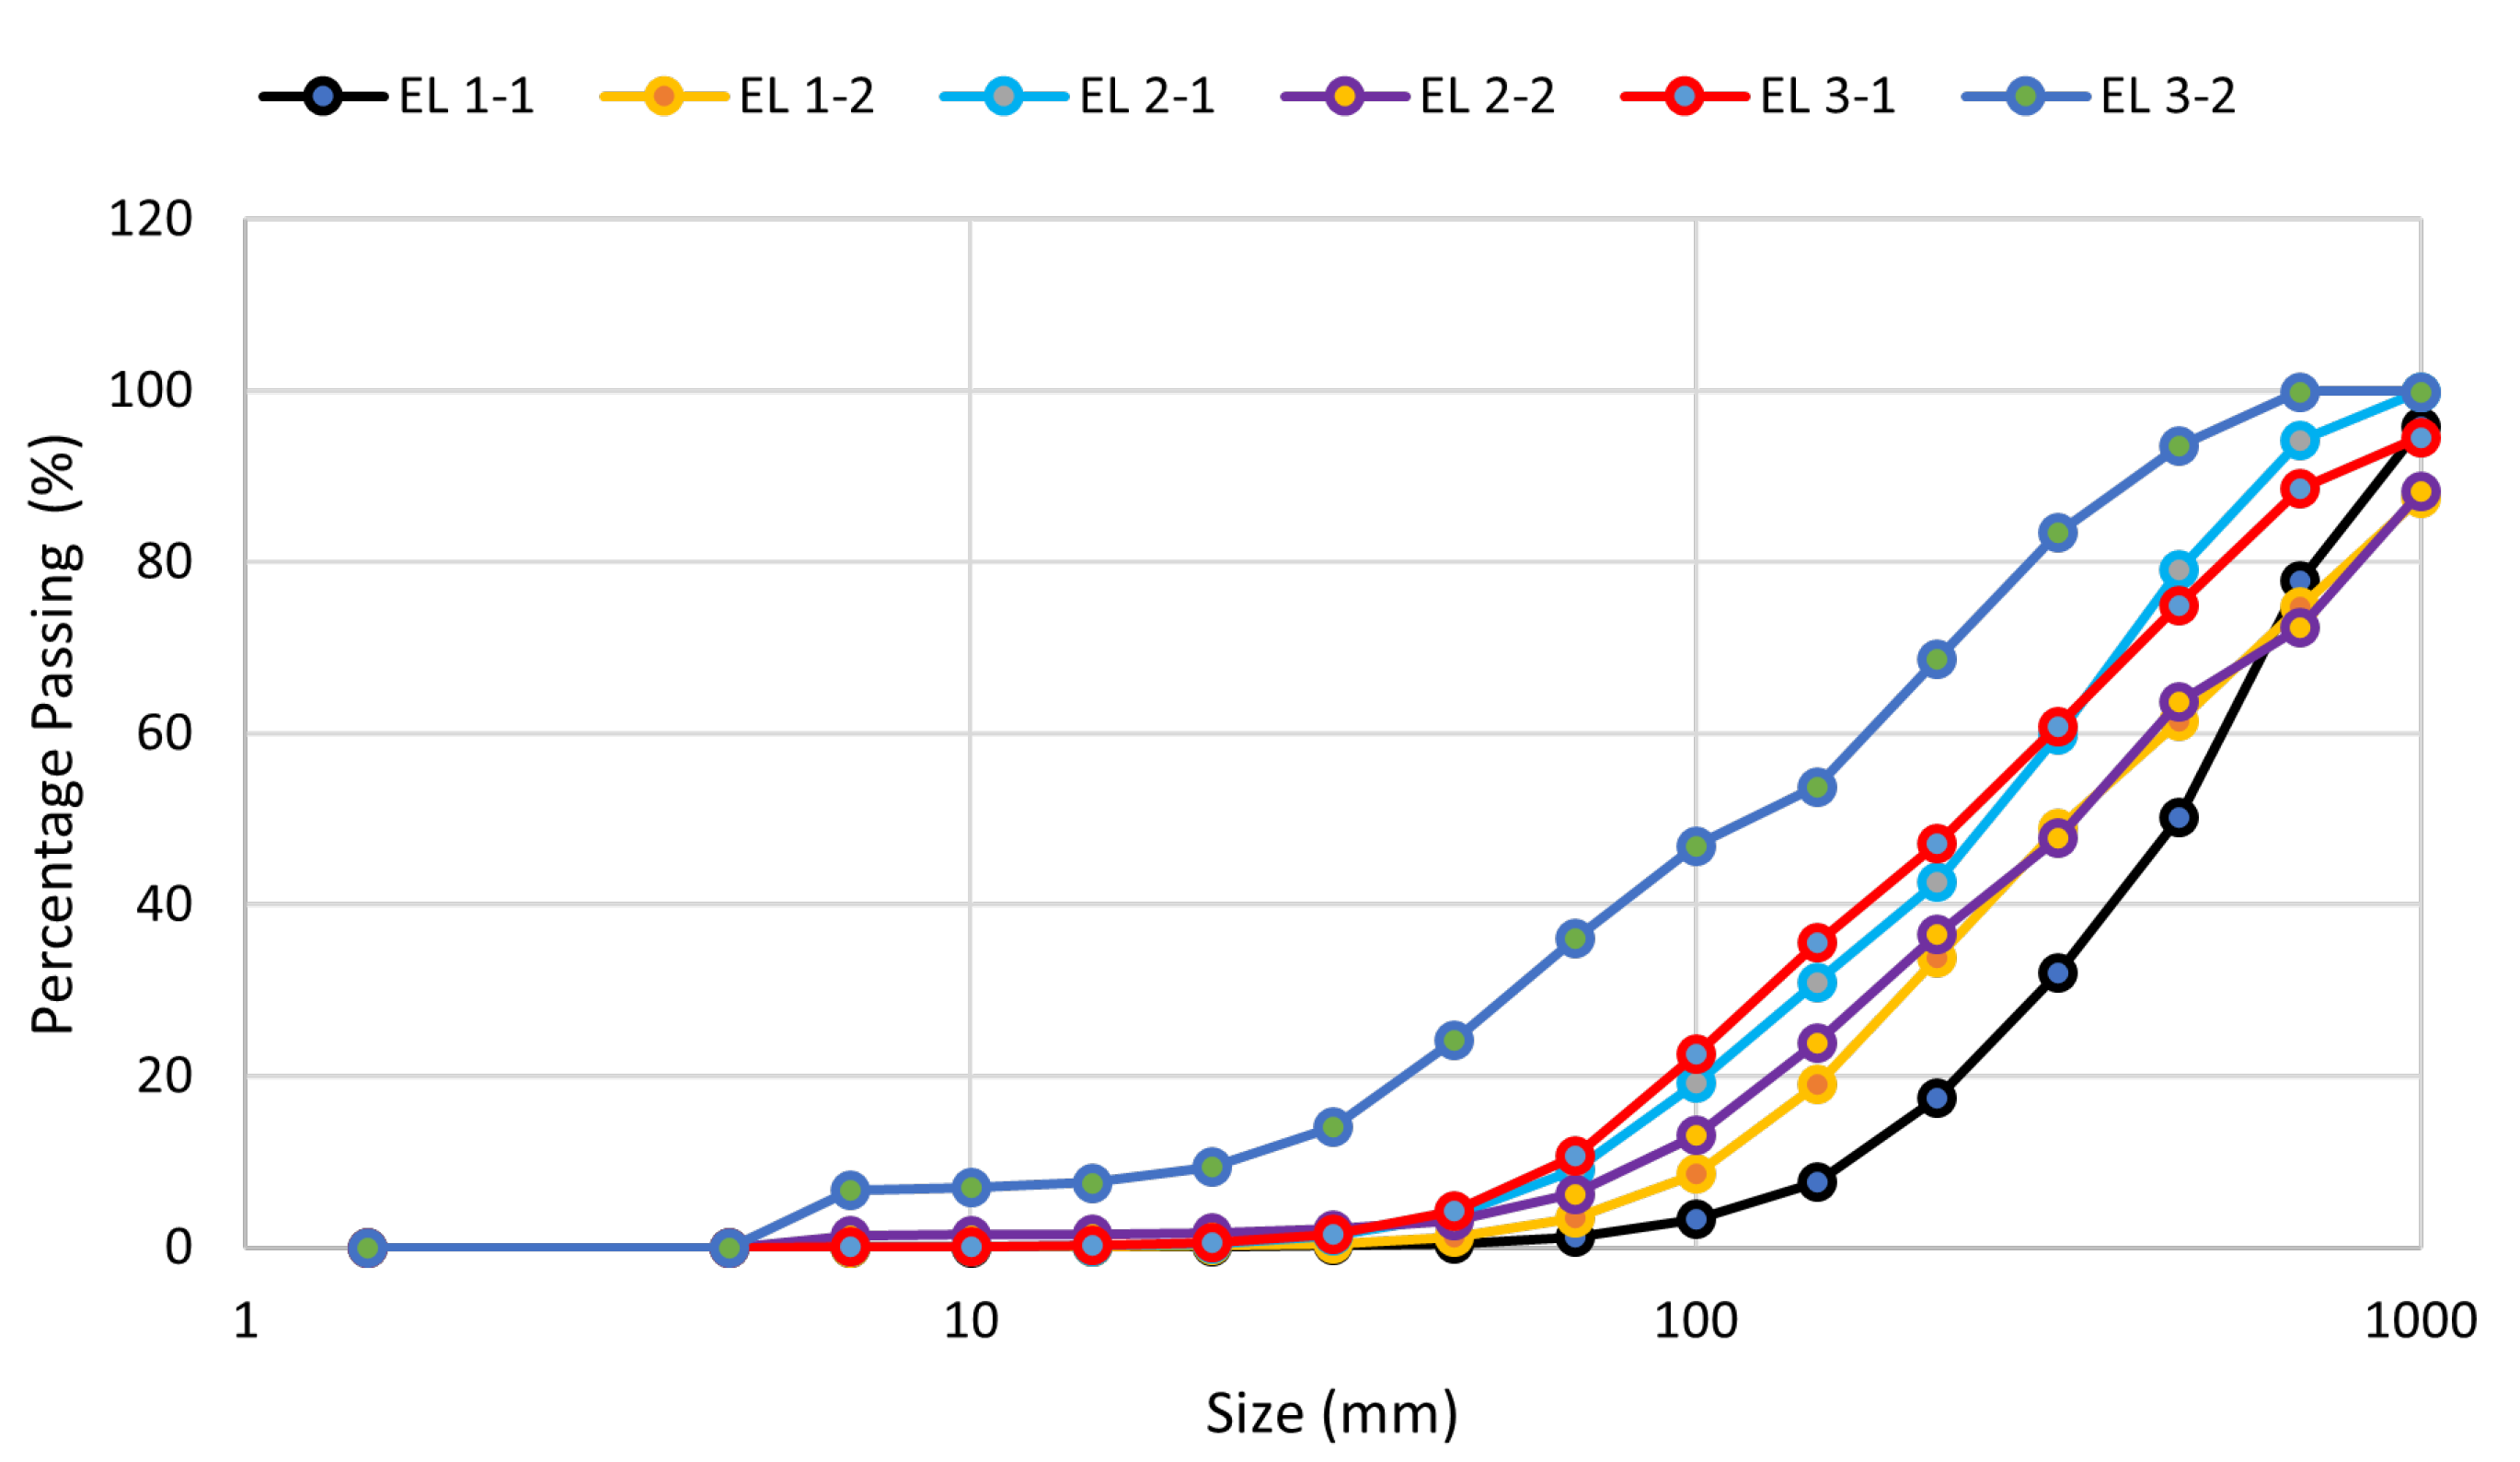
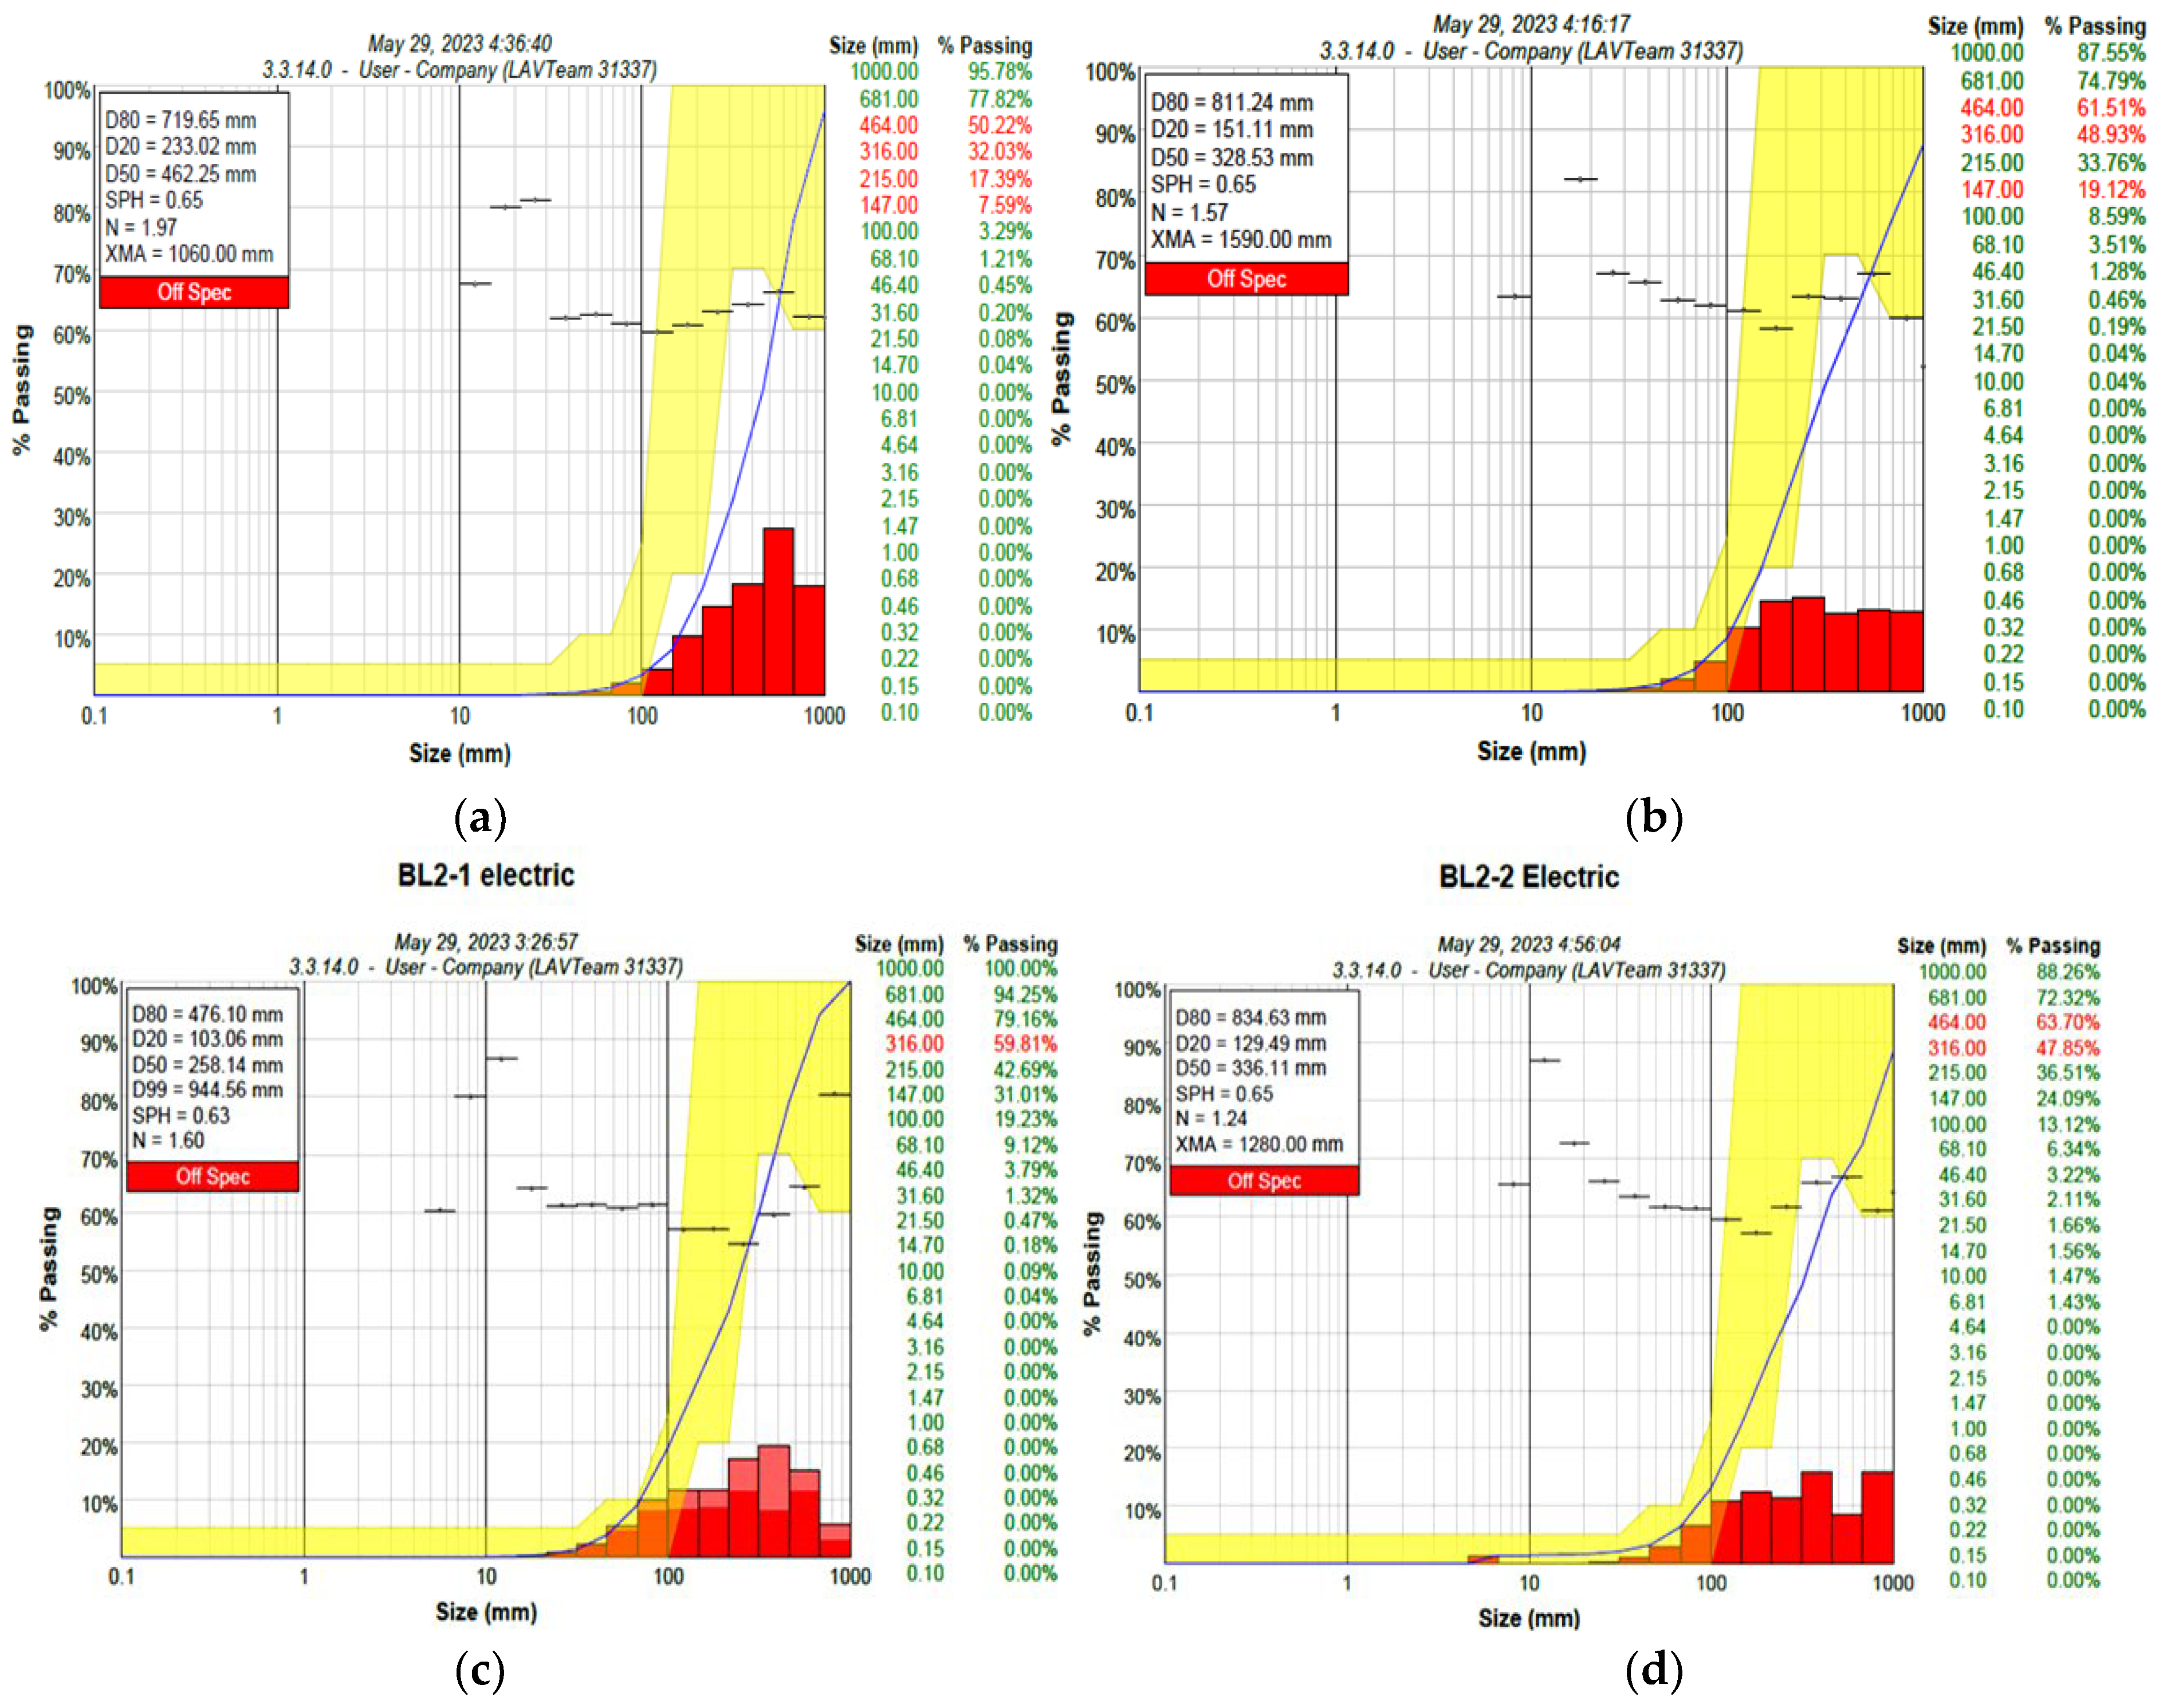
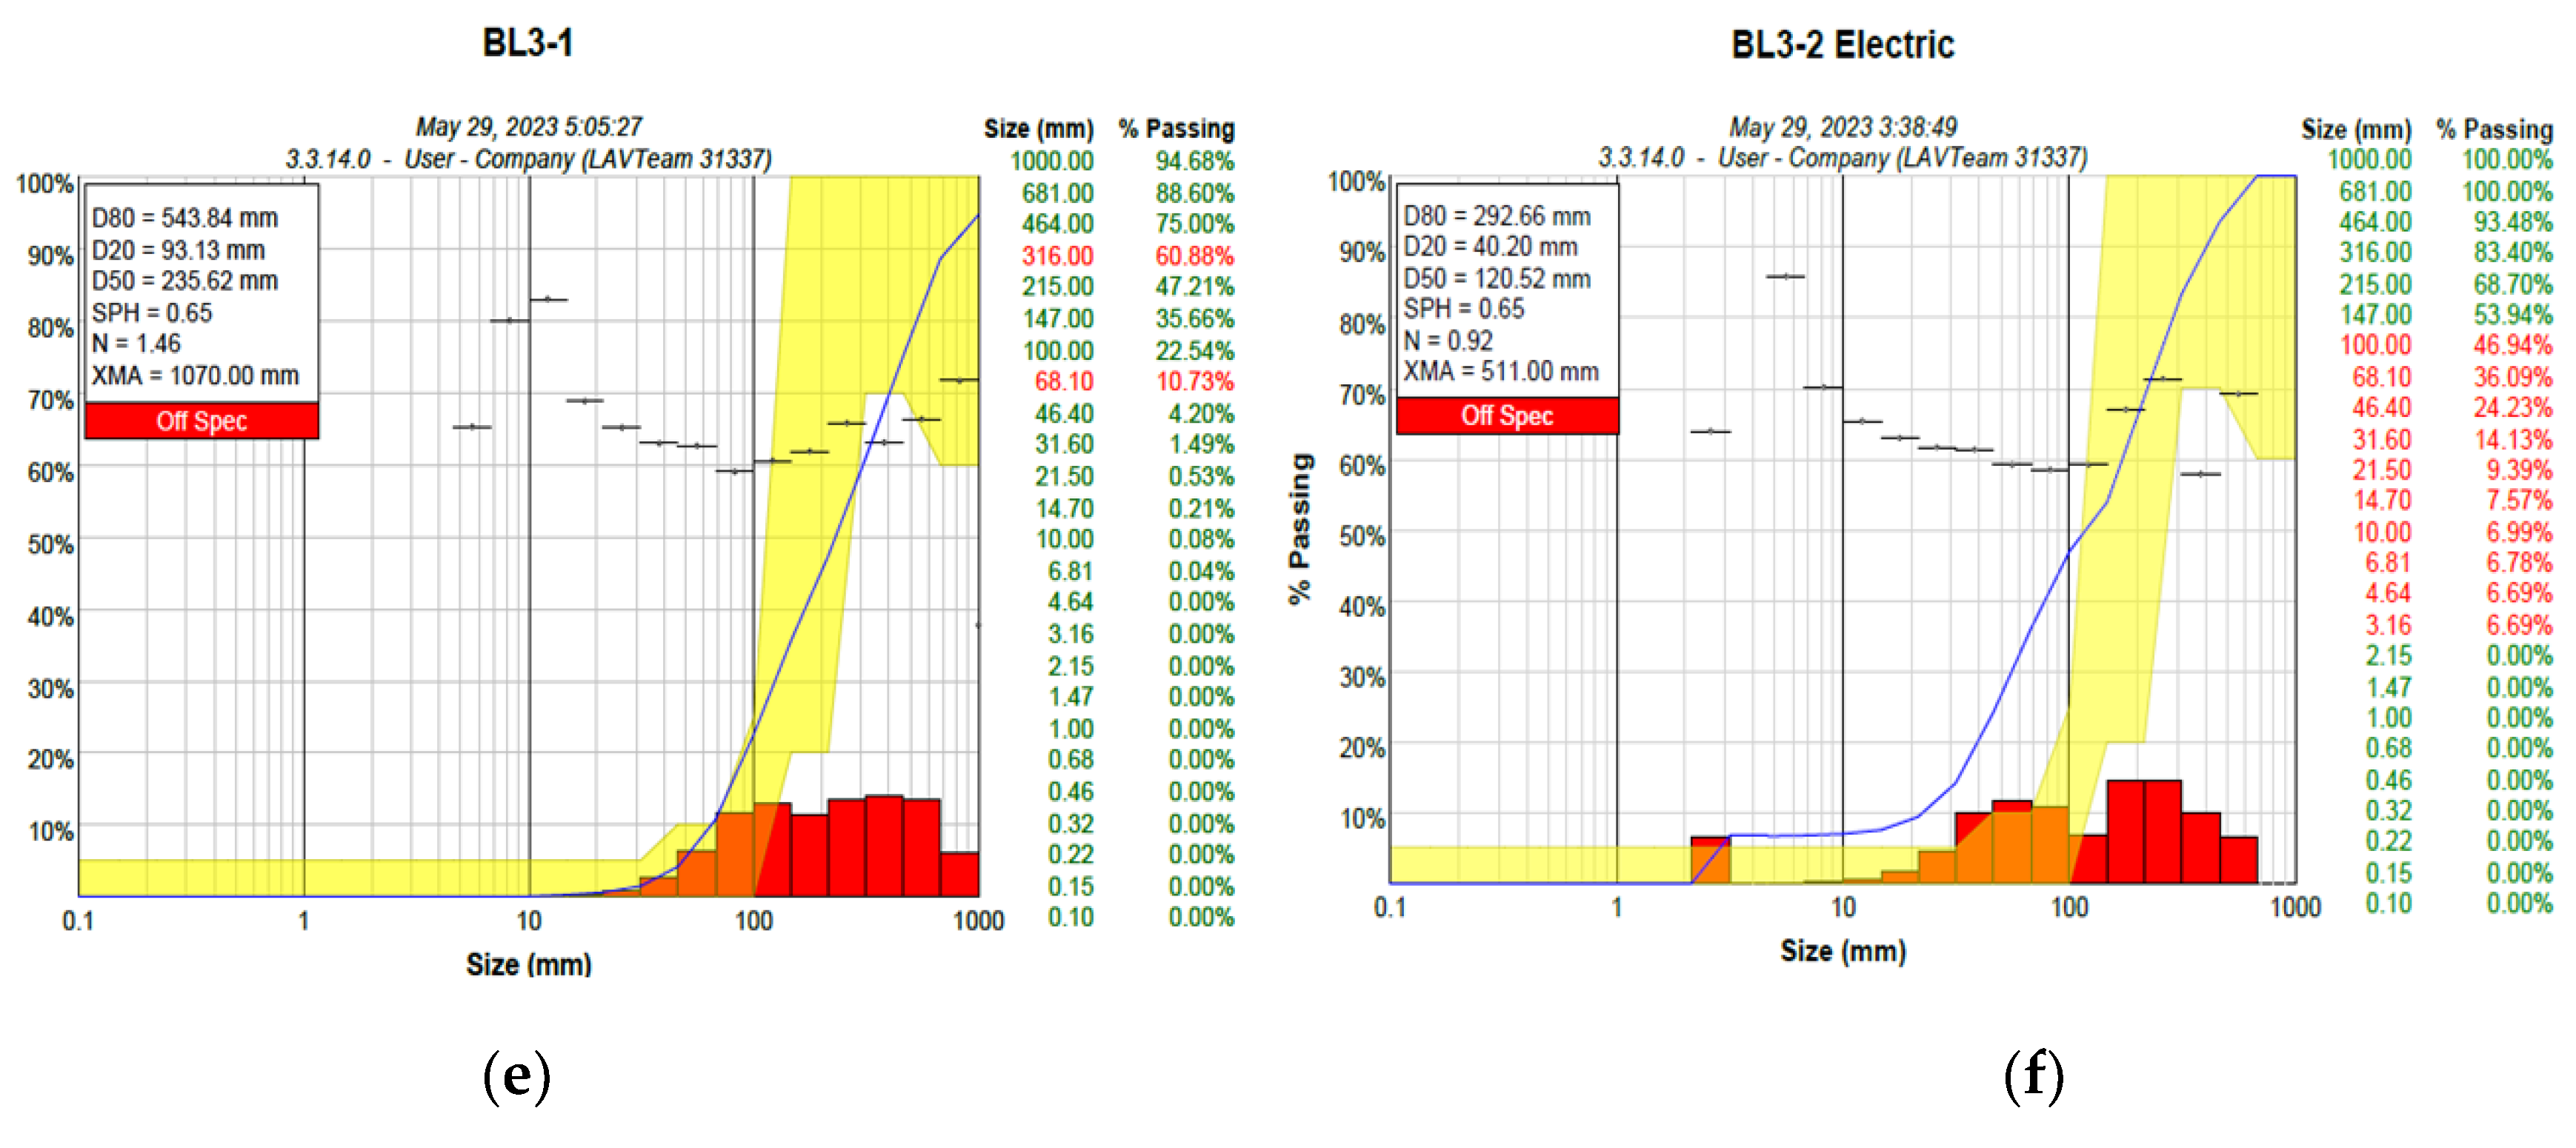
3.3. Fragmentation Result for Electric Blasting

The fragmentation analysis for the electric blast round result is illustrated in Figure 9 and Table 4. The mean size (X50) for EL 1-1, EL 1-2, EL 2-1, EL 2-2, EL 3-1, and EL 3-2 were 462.25 mm, 328.53 mm, 258.14 mm, 336.11 mm, 235.62 mm, and 120.52 mm, respectively.

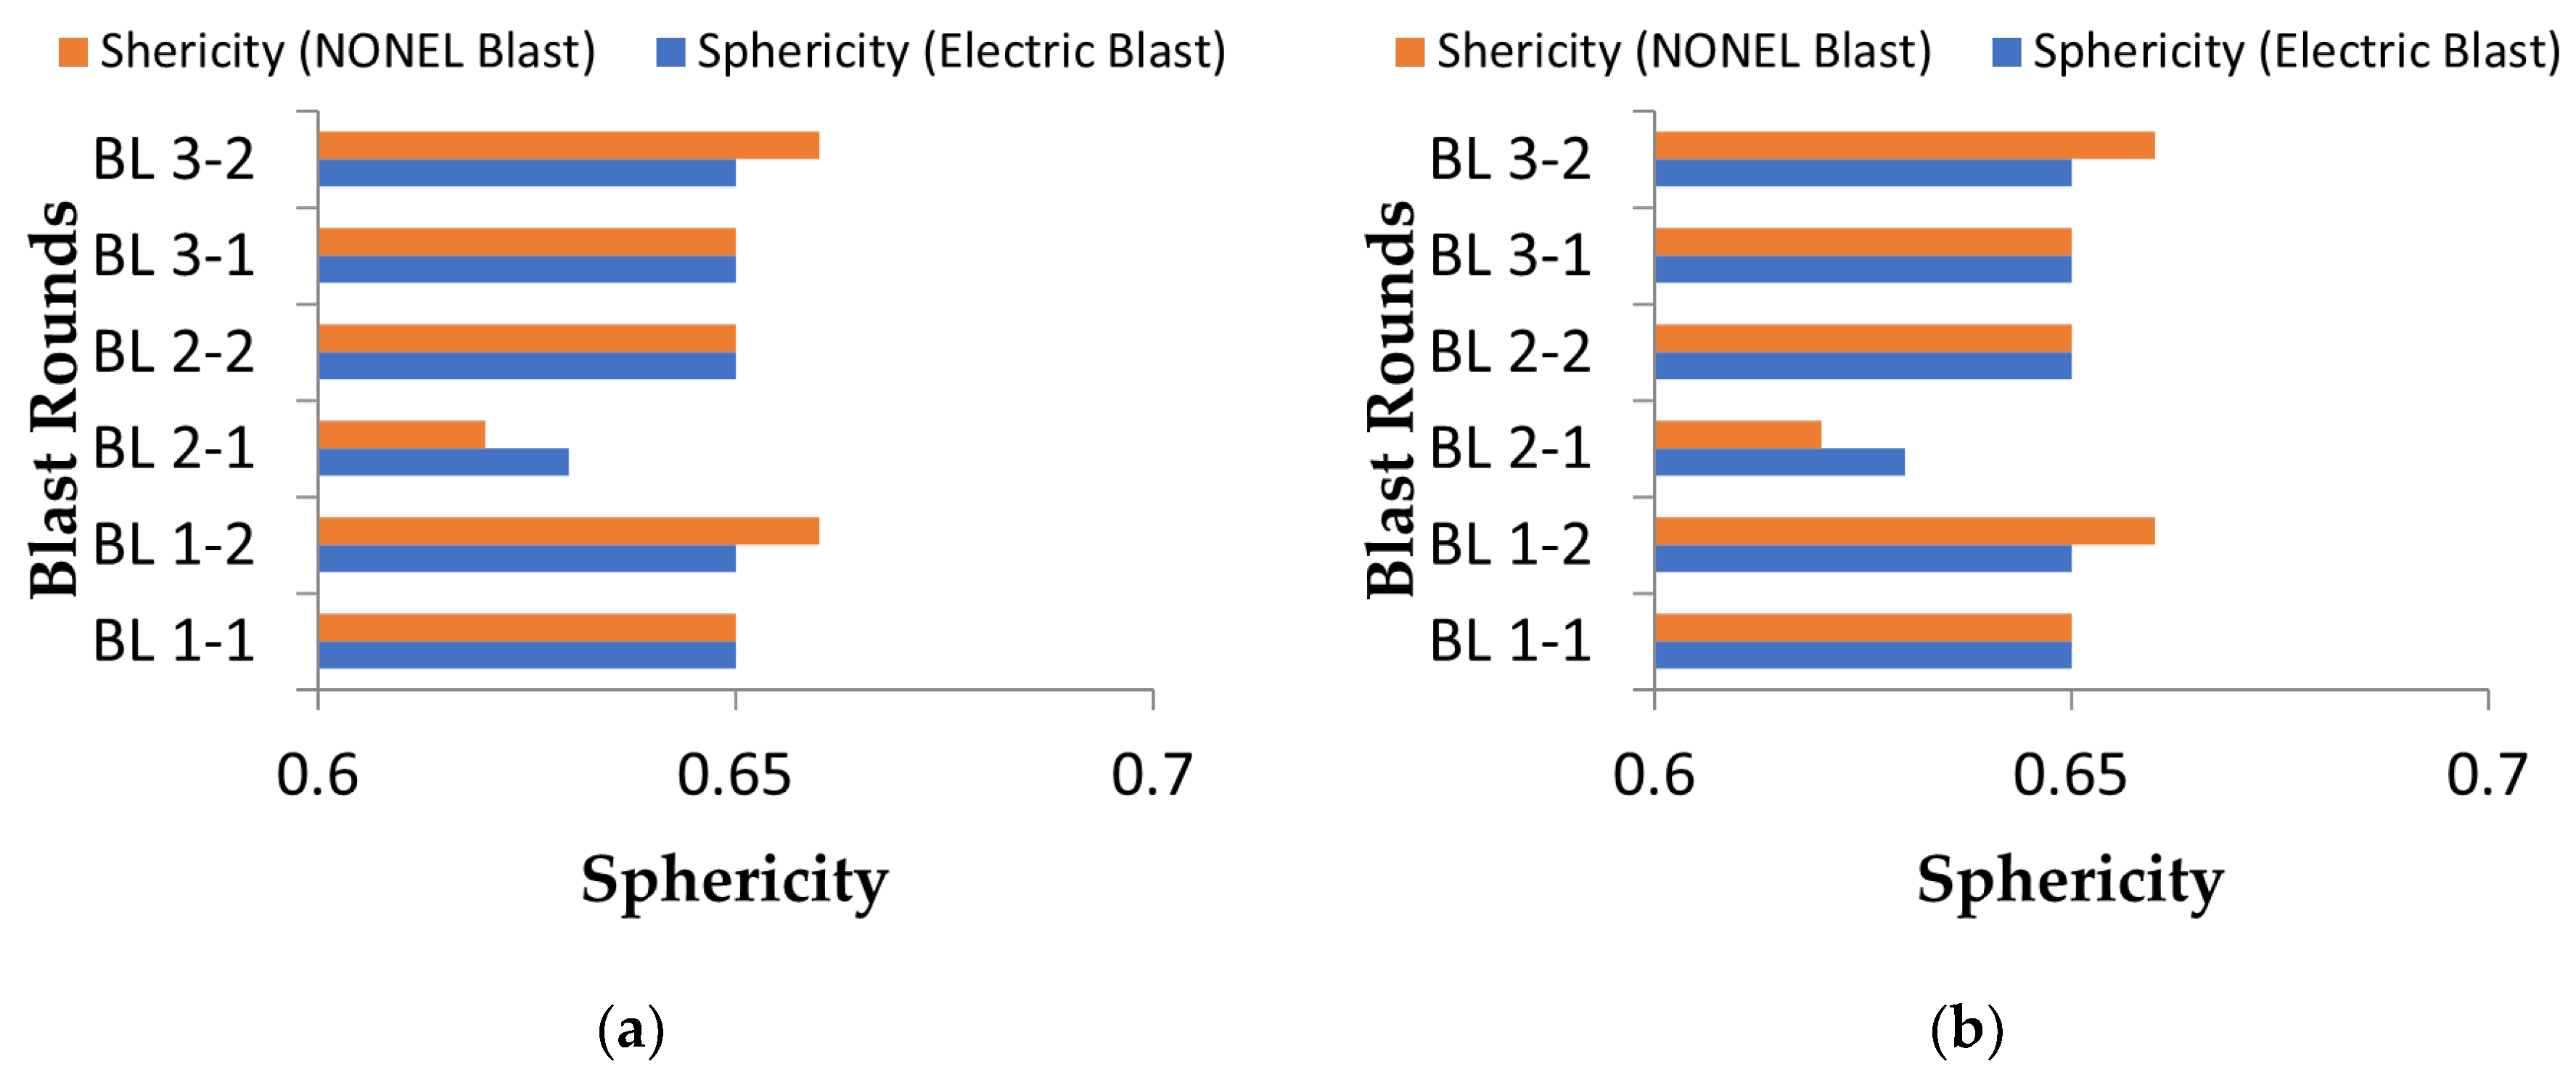
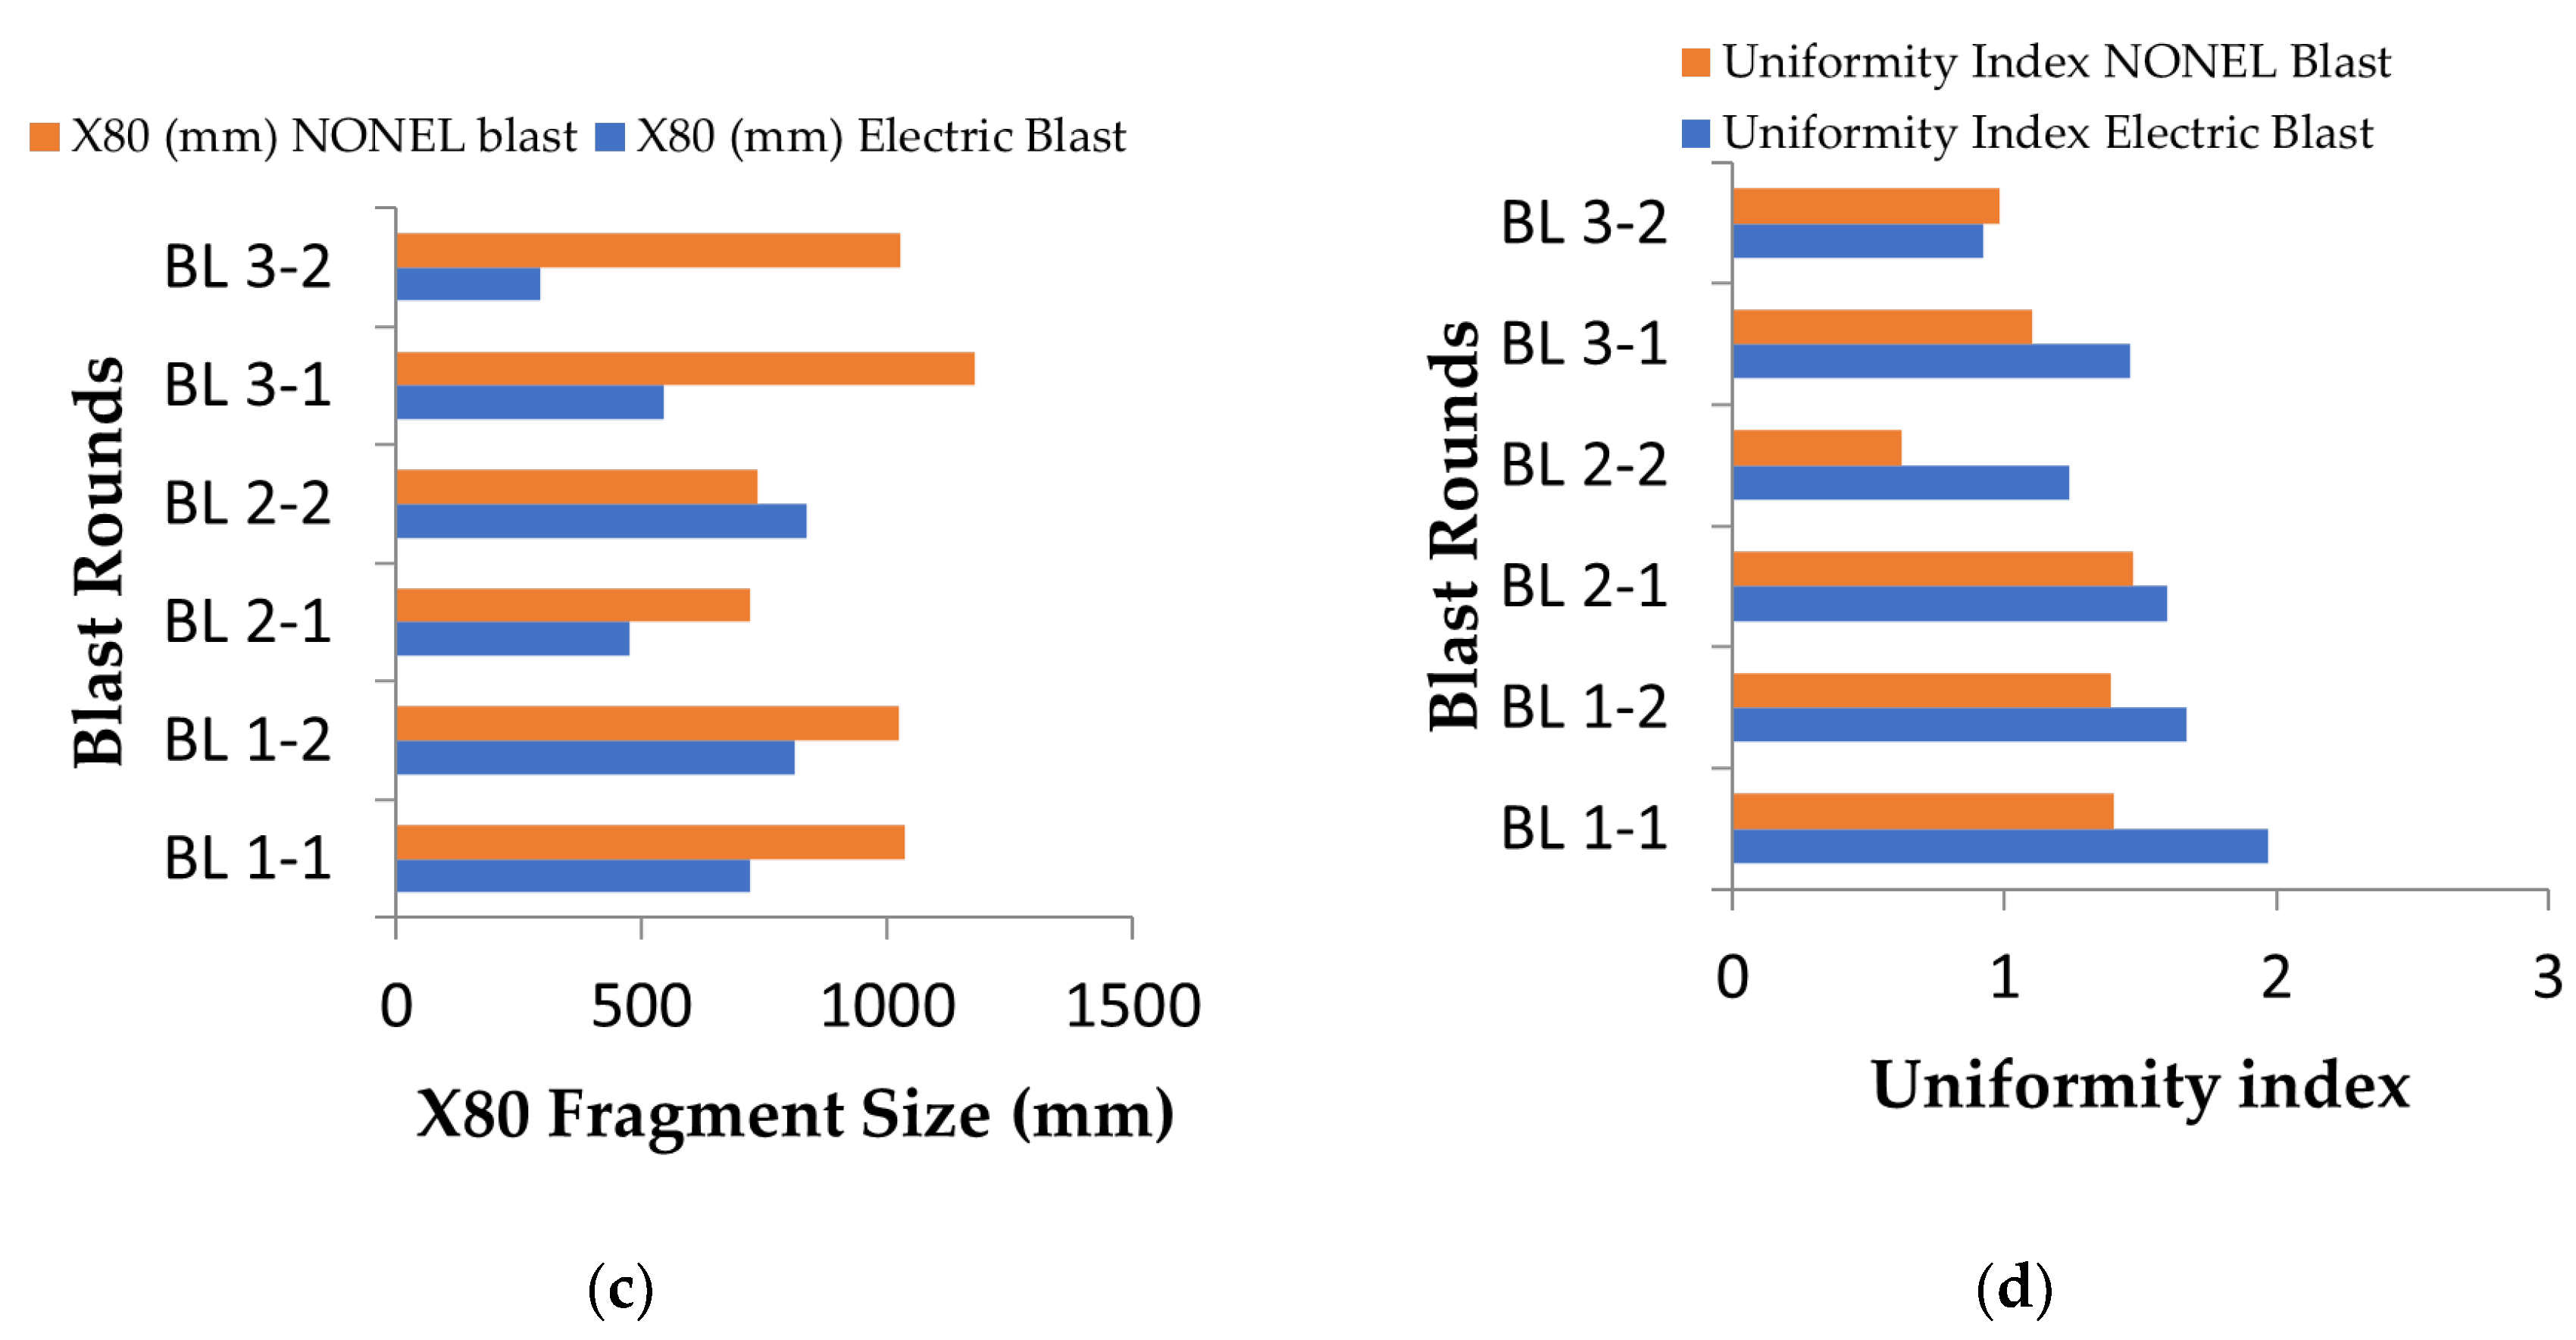
3.4. Fragmentation Assessment Results

Utilizing additional WipWare photo analysis software features, the efficacy of the two blast initiation techniques was further evaluated. The WipFrag analysis yielded both particle distribution curves and additional evaluation parameters. Image analysis sphericity is the average ratio of the largest dimension to the longest perpendicular dimension of each particle. For instance, a WipFrag result of a 0.5 wide-to-length ratio (sphericity) suggests that the average particle in the blast pile is twice as long as it is broad. The nonelectric blast provided the greatest sphericity sizes for the highest blast rounds, as demonstrated by the result. The sphericity of blast fragments from both electric and nonelectric blast rounds is depicted in Figure 10a. Figure 10b,c displays the average particle size and 80% passage size for both electric and nonelectric blasts, as determined by the WipFrag 3.3 software.
The fragmentation result seems not to be sufficient for decision-making due to other factors different from production assessment. Most importantly, the safety of the mine, nearby structures, and mine equipment requires considerable assessment. The results of the structural and environmental impacts of both initiation techniques are presented and discussed in the next section.

3.5. Blast-Induced Impact Result

Blasting operations have been cognizant of blast impacts on the environment, mine personnel, and equipment for decades [33,34,35,36,37]. In addition to facilitating the separation of mineral fragments from rock masses, blasting operations contribute to a variety of other environmental maladies, such as ground vibration, backbreak, noise pollution, and dust dispersion. This section compares the effectiveness of electric and nonelectric detonators based on the impact generated by six explosion rounds (see Table 5).
The average ground vibration and noise level for the nonelectric blasting rounds were 0.108 mm/s and 81.7 dB, respectively. The average ground vibration and decibel level for the six monitored electric blasting rounds were 0.76 mm/s and 92.5 dB, respectively. The results indicate that the blast-induced ground vibration (peak particle velocity) generated by all of the blast rounds for electric blast ranged from 0.4–1.2 mm/s and 80–105 dB, while that of the nonelectric blast round ranged from 0.05–0.2 mm/s and 72–95 dB.

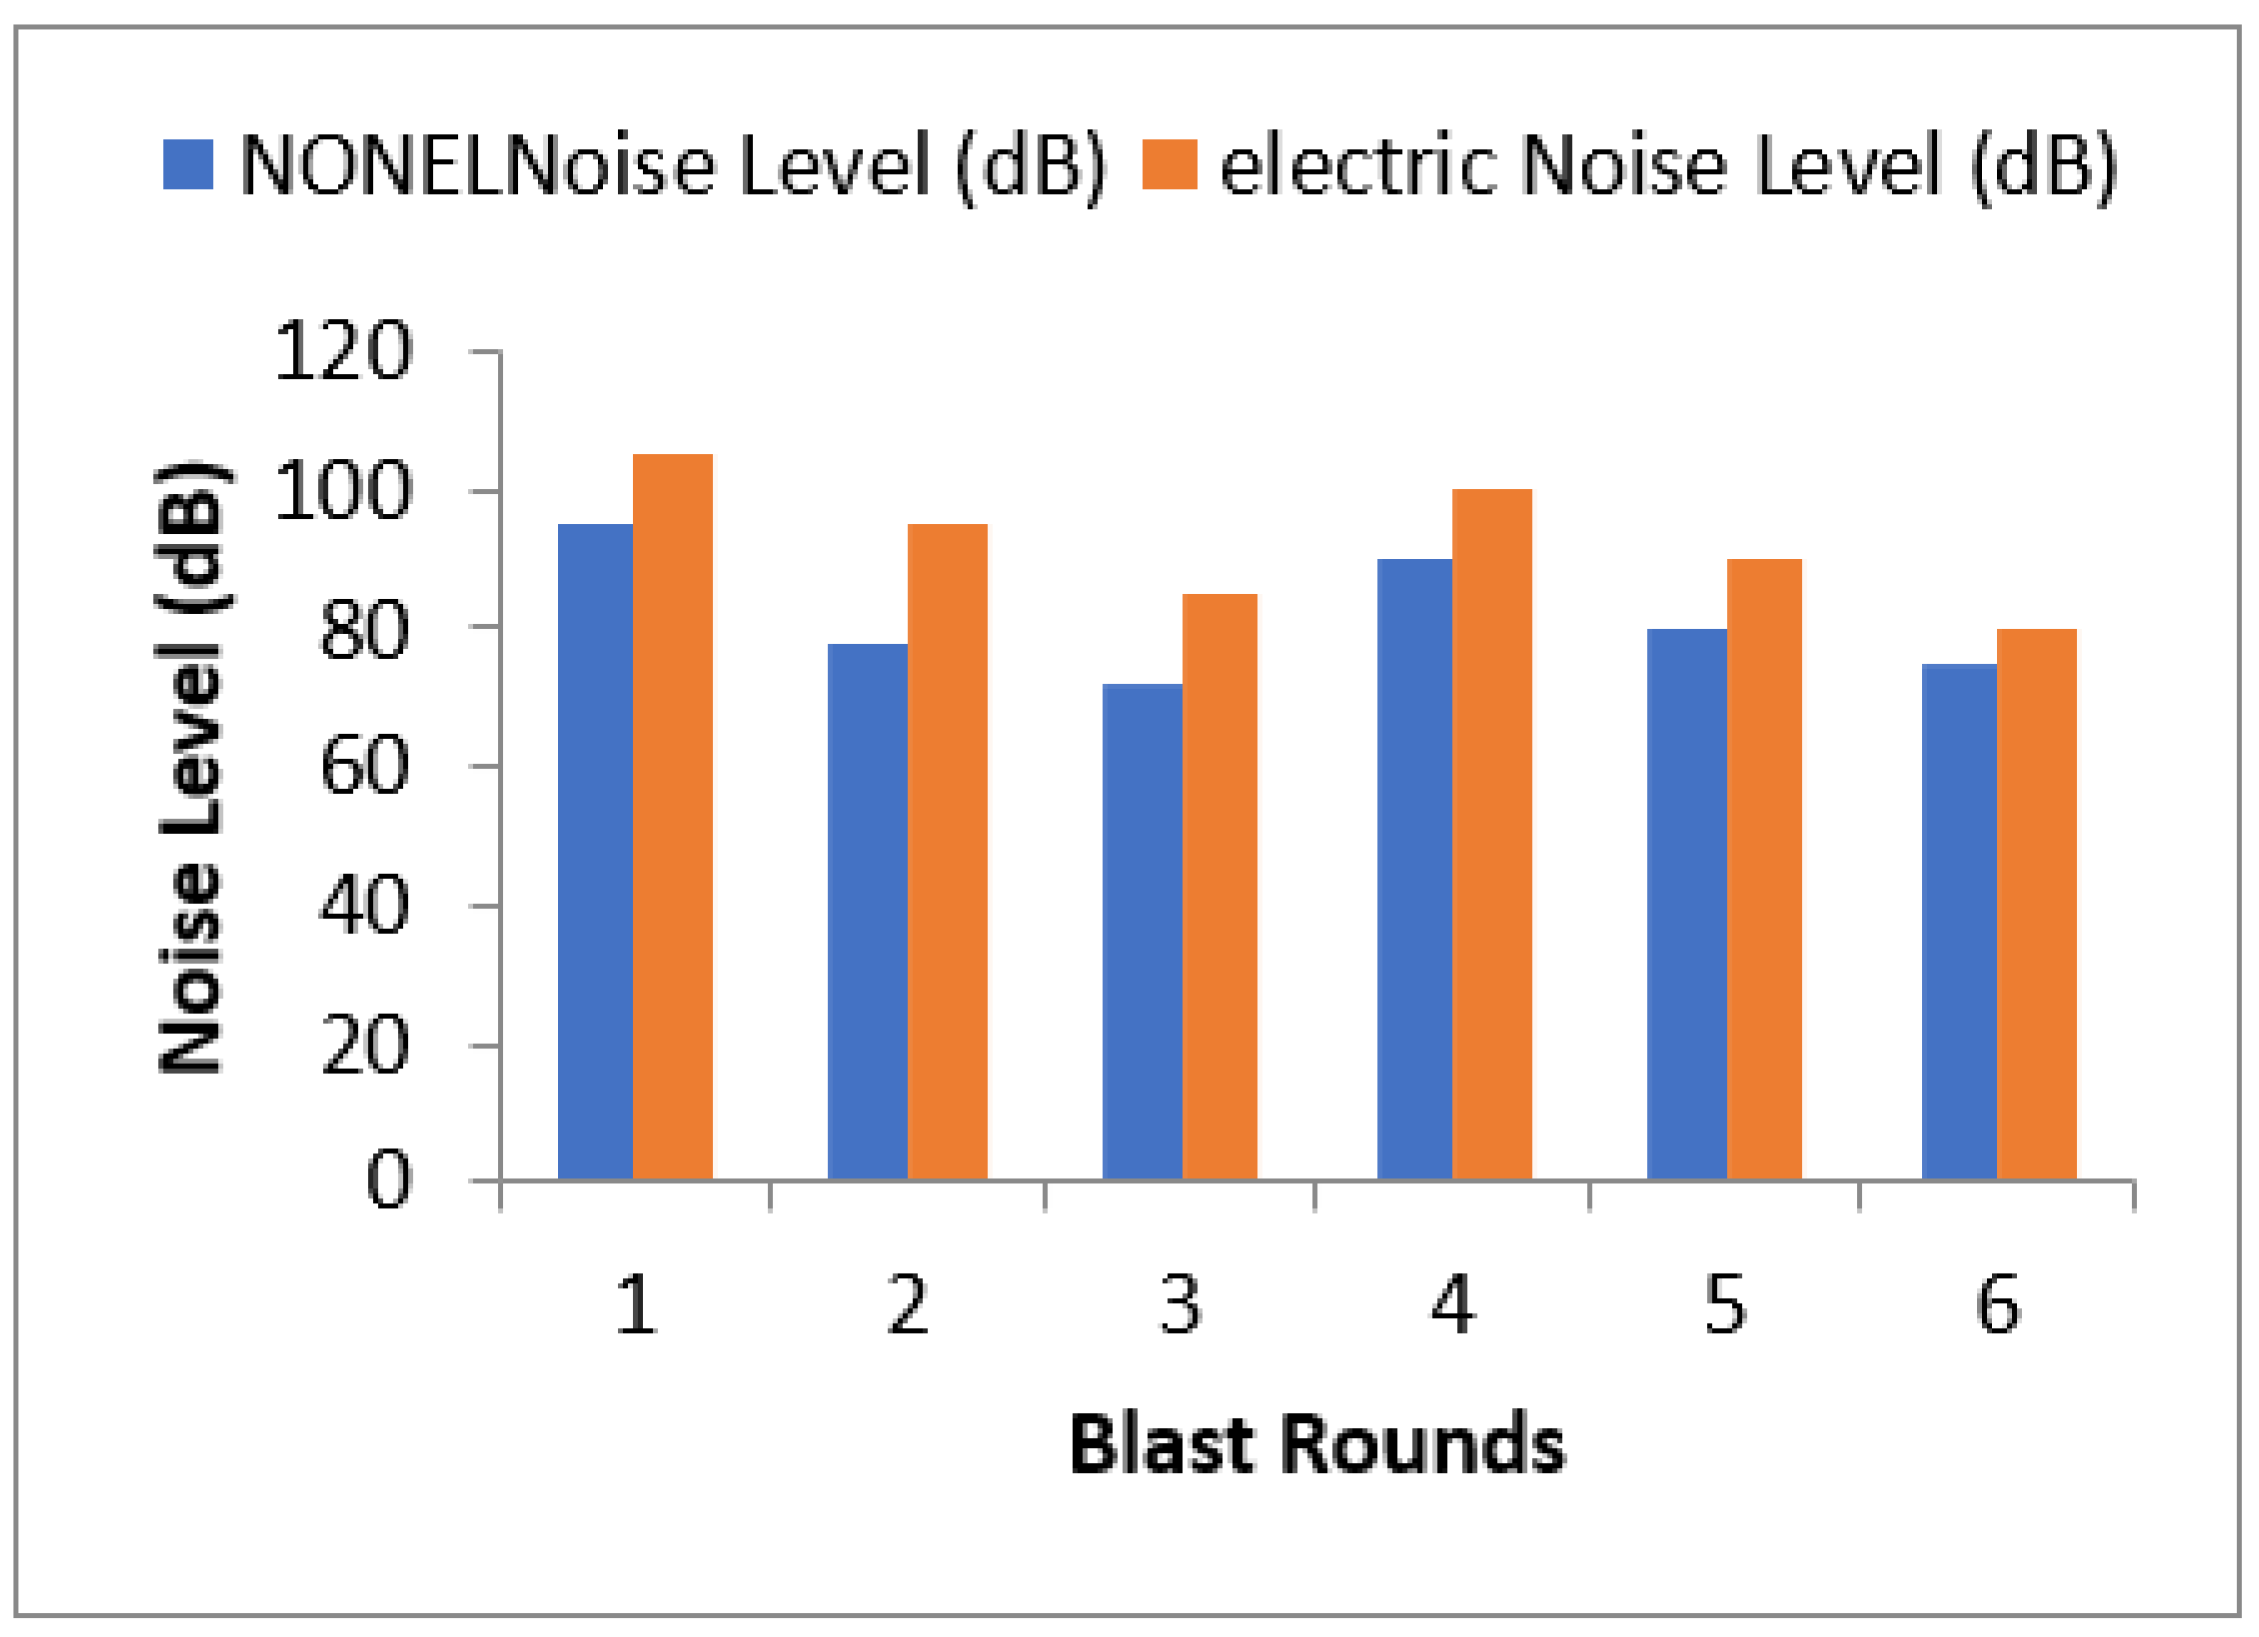
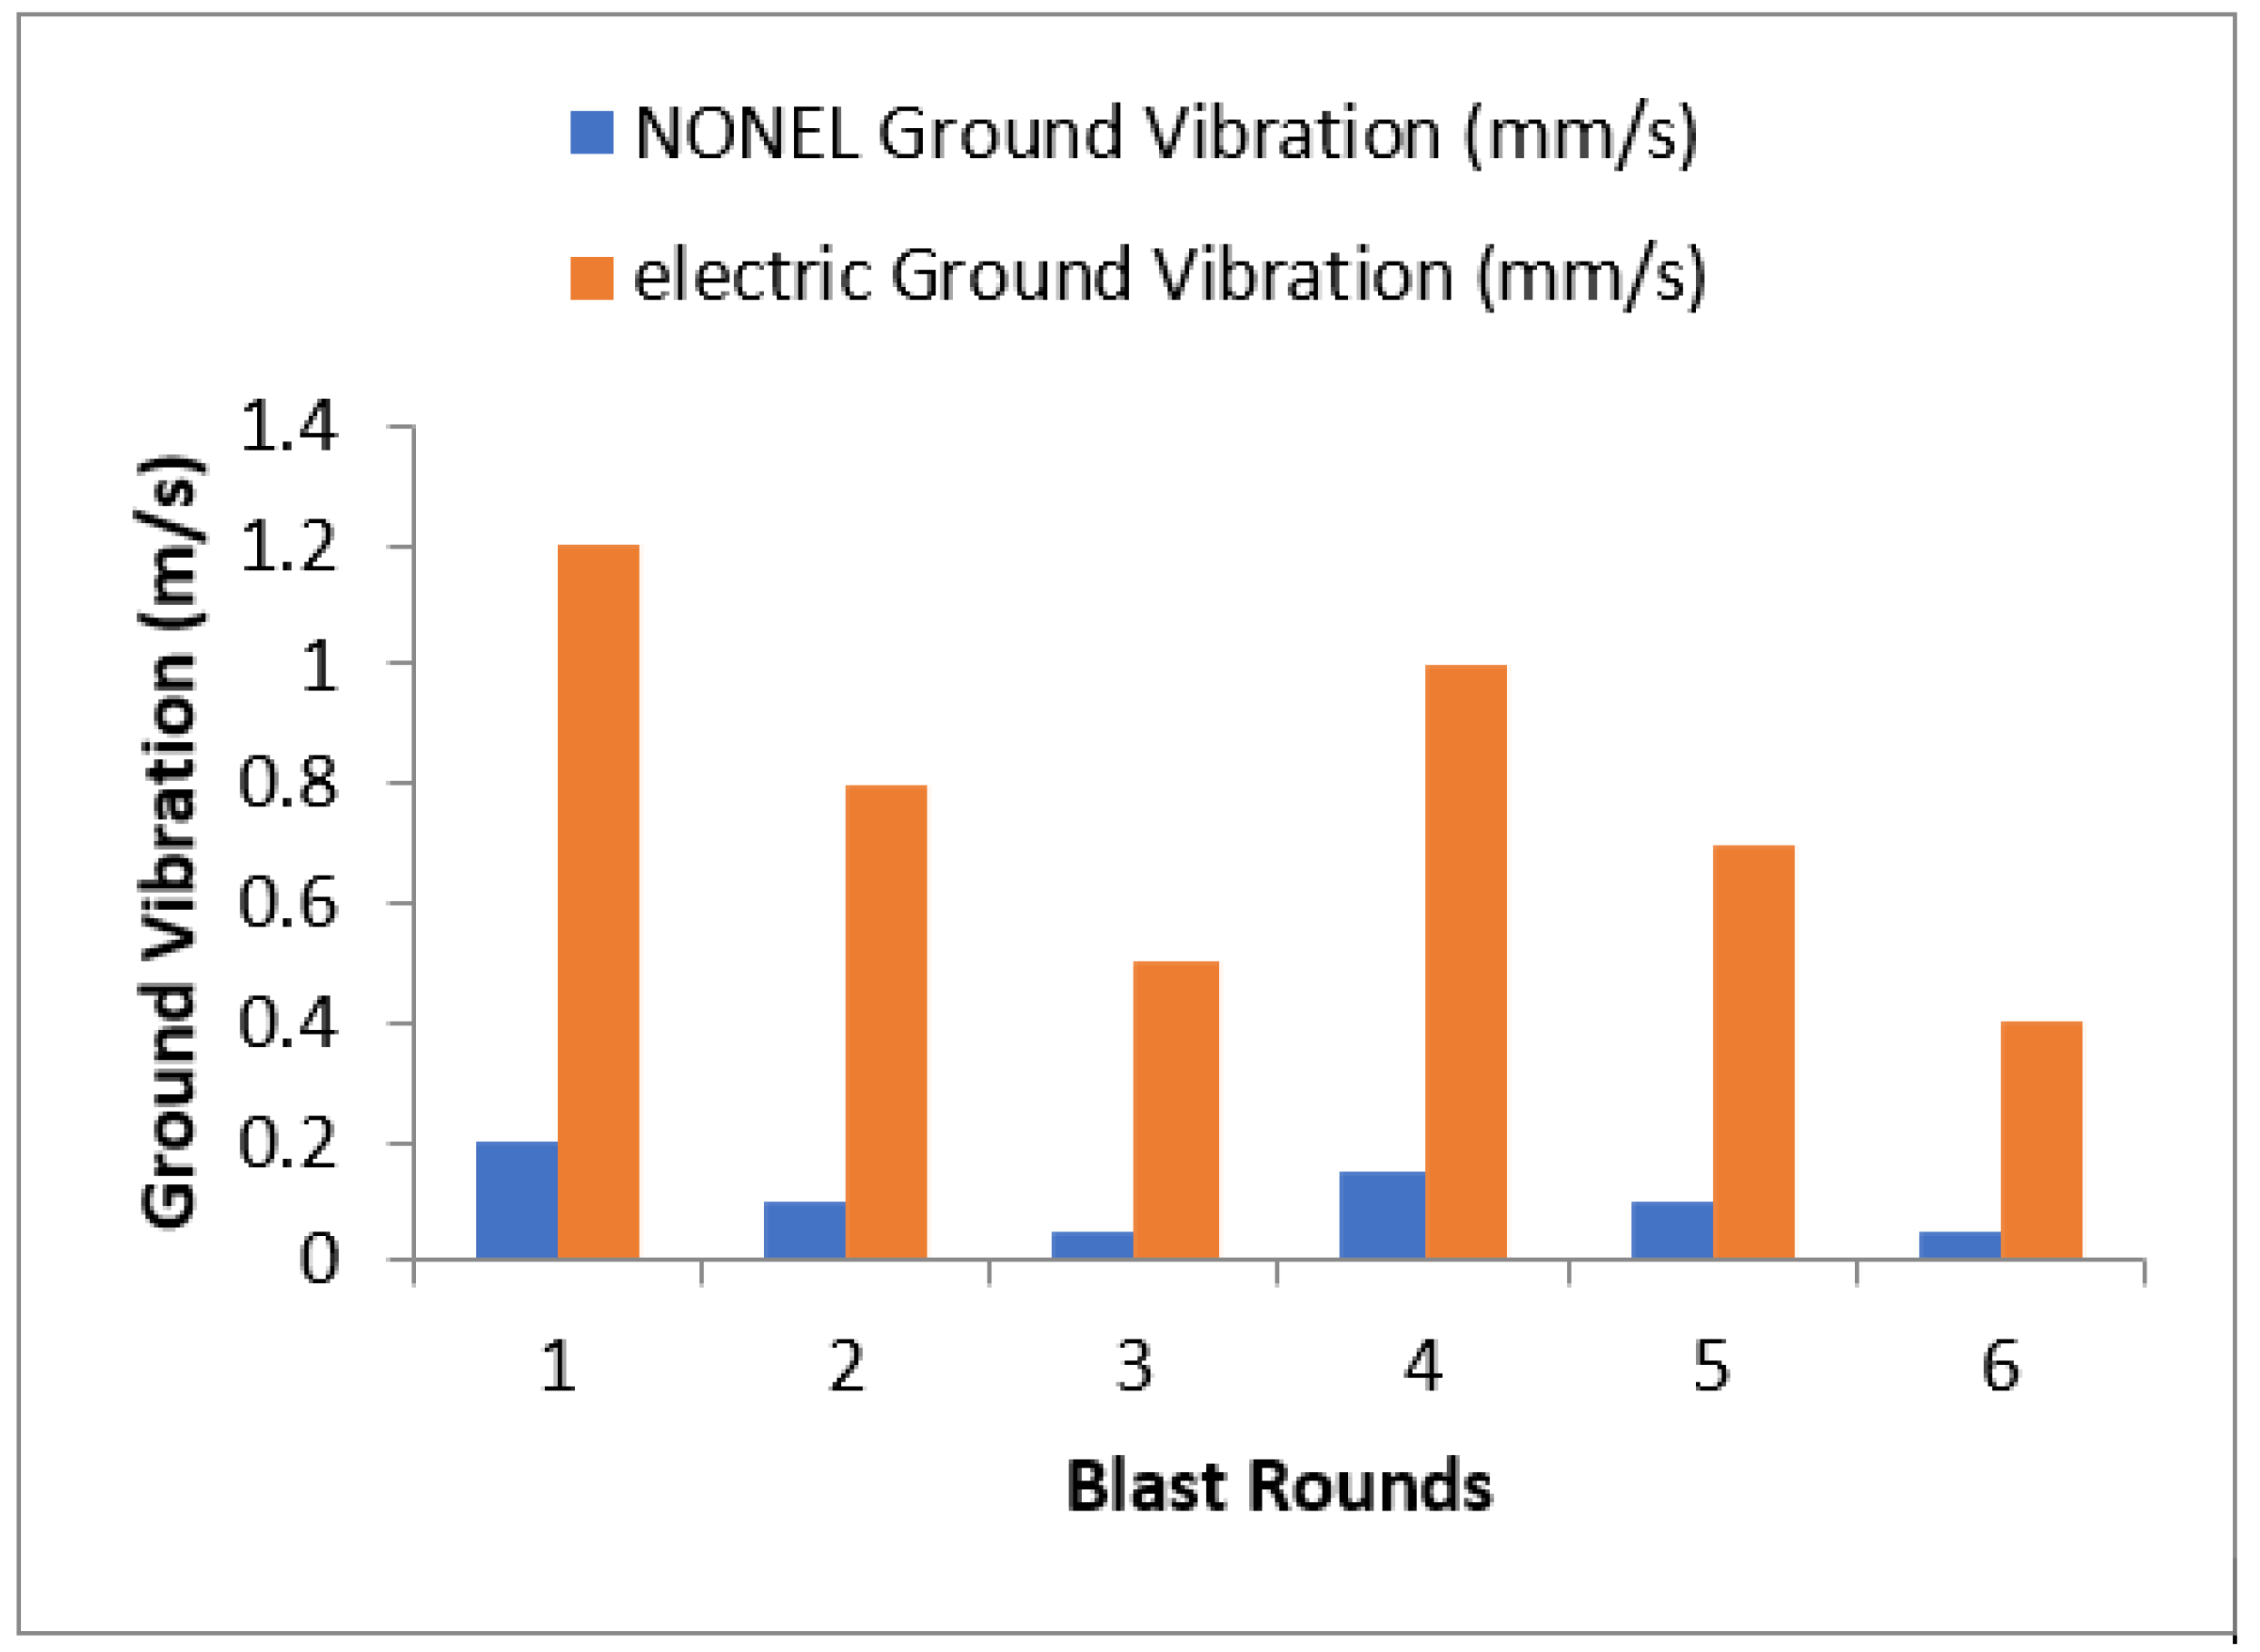
3.5.1. Comparison between the Two Initiation Techniques

The comparison between the blast-induced ground vibration and decibel level from the electric and nonelectric blasting rounds is depicted in Figure 11 and Figure 12. In comparison to the nonelectric detonators, the decibel levels and ground vibrations during electric blasting were greater than those from the nonelectric blasting rounds.

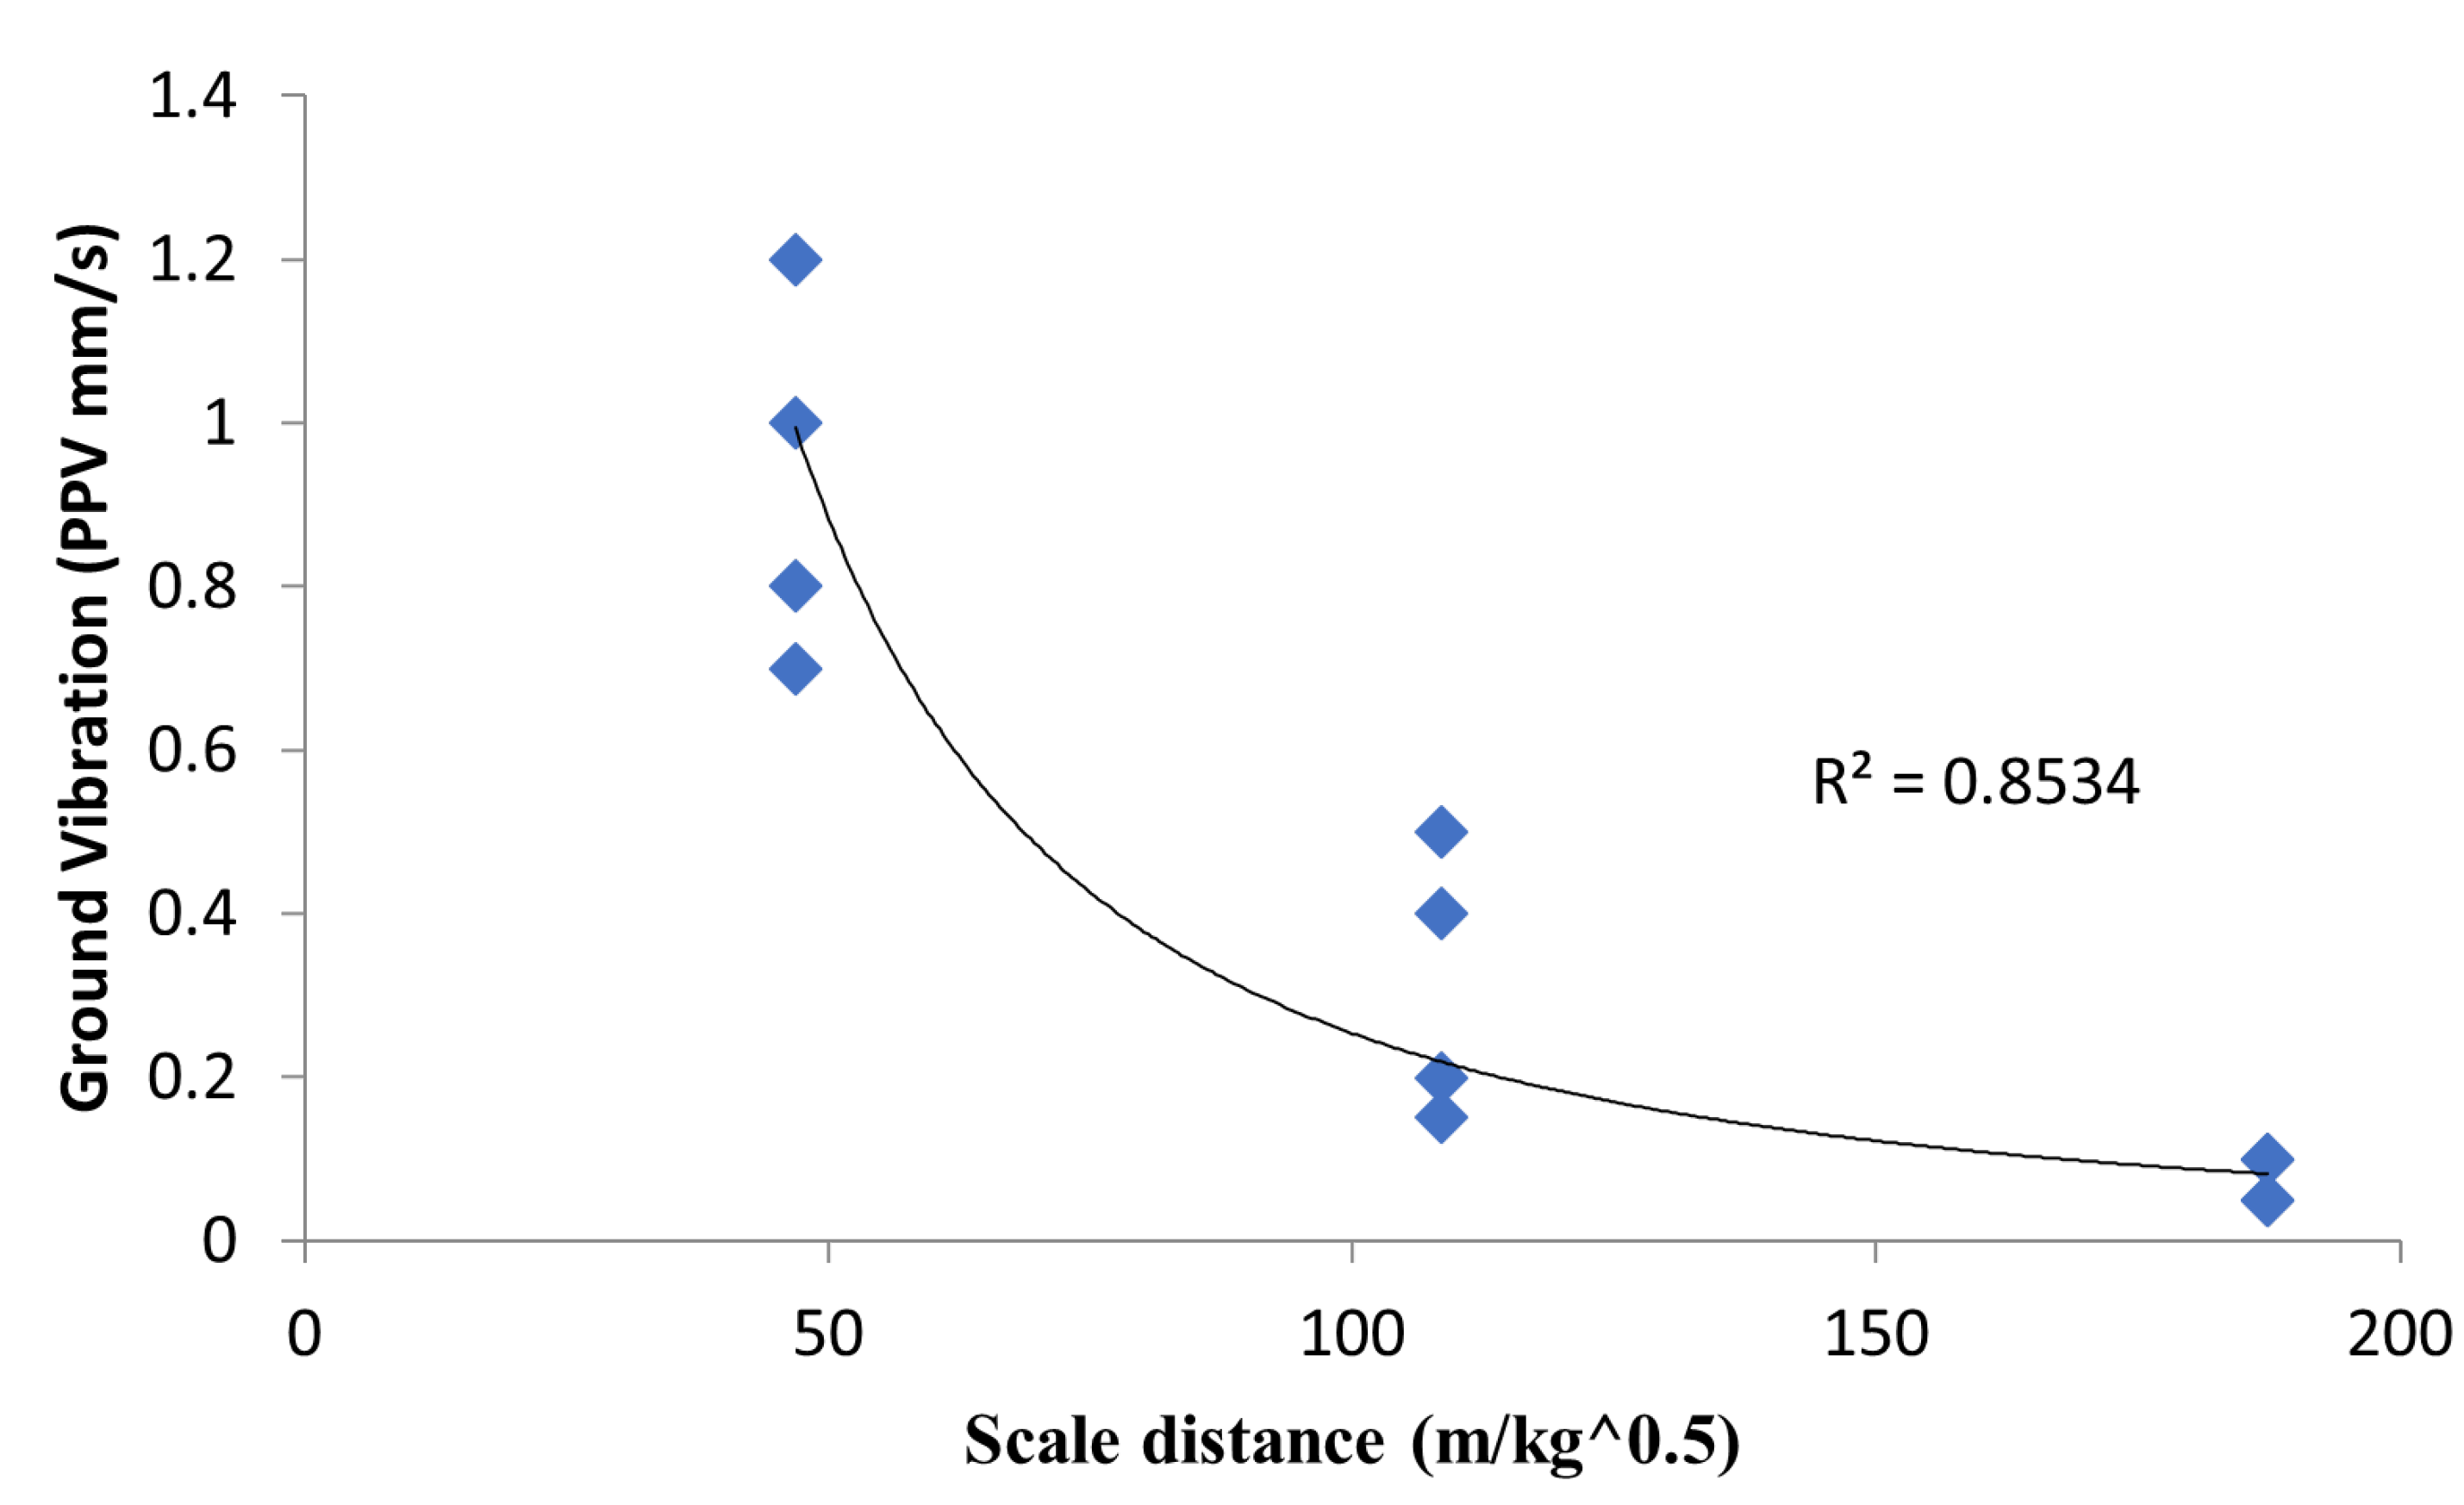
3.5.2. Regression Model for Blast Impact Prediction

Figure 13 and Figure 14 show the relationship between scale distance, ground vibration (PPV) impact, and noise level of the blasting operation at the case study mine. Ground vibration variability with scaled distance was revealed to have a negative correlation. The peak particle velocity and noise level values decreased as the scaled distance increased, supporting existing works [38,39,40,41]. The combined results from all the study blast experiments were used to develop a logarithmic model for predicting ground vibration and noise level using the scale distance as the input variable. The developed logarithmic model is presented in Equations 1 and 2. The model result shows good prediction accuracy with a high correlation coefficient (R2) of 0.853 for ground vibration and 0.65 for noise level estimation.
PPV =1021.5 × SD−1.803
NL = 180.85 × SD−0.161
where PPV is the peak particle velocity mm/s, SD is the scale distance in m/kg0.5, and NL is the noise level in dB.

3.6. WipFrag Software Spec Function and Chart Size Classifier Results

This section presents the application of the WipFrag software specification function (Spec) as a tool for fragmentation efficiency assessment based on the primary crusher inlet size. The sieve size was adjusted for a low percentage passing range for fine material less than 30 mm and a large percentage passing range for the optimum size between 215 mm and 464 mm gape. The oversize gape (>464 mm) was specified at the maximum passing size.
The yellow boundary demonstrates the projected optimum size distribution region for efficient blast particle size distribution based on the crusher gape specification. The fragment size with red color notation represents those fragment sizes that were off spec; that is, they fell below the expected particle size based on the downstream primary crusher gape specification. The green fragment size with green color notation in Figure 15 and Figure 16 represents those fragment sizes in each blast that were on spec; that is, they fell below the expected particle size based on the downstream primary crusher gape specification.

3.6.1. Nonelectric Blast Result Production Assessment

The six blast rounds from the nonelectric blasting were assessed using the WipFrag 3.3 spec adjustment function. The results of the nonelectric blast had a lower percentage on spec result, as shown in Figure 15. All the nonelectric blast round results were revealed as off spec for 316 mm and 215 mm sieves. The result implication is that the percentage of rock fragments passing through 316 mm and 215 mm mesh was lower than the 70% minimum benchmark set for all the nonelectric blast results. Furthermore, as for all the experiment blast outputs, the primary inlet size material fell below the production-efficient spec area.

3.6.2. Electric Blast Result Production Assessment

The electric blast results had a higher percentage of spec results, as shown in Figure 16. A total of 80% of the electric blast round results were revealed to be on spec for 316 mm and 215 mm sieves. The result implication is that the percentage of rock fragments passing through 316 mm and 215 mm mesh was greater than 70%, the minimum benchmark set for all the electric blast results. Furthermore, as for all the experiment blast outputs, the primary inlet size material fell within the production efficiency spec area. As such, the electric blast initiation technique was found to have generated good fragmentation, with a larger percentage of optimum fragment sizes on spec than those produced by a nonelectric blast.

4. Discussion

In general, all the blast rounds showed high passing efficiency, with sieve sizes ranging from 600 mm to 1000 mm. The mean size (X50) for BL 1-1, BL 1-2, BL 2-1, BL 2-2, BL 3-1, and BL 3-2 were 611.94 mm, 441.36 mm, 383.42 mm, 220.48 mm, 392.73 mm, and 510.14 mm, respectively. The mean size (X50) for EL1-1, EL 1-2, EL 2-1, EL 2-2, EL 3-1, and EL 3-3 were 462.25 mm, 328.53 mm, 258.14 mm, 336.11 mm, 235.62 mm, and 120.52 mm, respectively.
Blast rounds for the same design (blast 1-1 and blast 1-2), blast 2-1 and 2-2, and blast 3-1 and blast 3-2 gave different results, indicating the effect of rock intrinsic properties. This shows that blasting results do not only depend on the initiation method but also on the intrinsic properties of the rock, as mentioned in several findings [42,43,44]. This finding also revealed that nonelectric detonation techniques performed poorly with low percentage optimum-size material, as specified by the company’s primary crusher inlet size (350 mm by 420 mm).
This finding also revealed that electric detonation techniques performed better with higher percentages of optimum-size material, as specified by the company’s primary crusher inlet size (350 mm by 420 mm). As compared with the results of the nonelectric blasting, it was revealed that the electric blasting techniques gave a high percentage of small-size materials (see the horseshoe trend in Figure 8), as also mentioned in Cardu et al.’s [33] review work.
The illustration of the results demonstrates that the average particle sizes of nonelectric explosion fragments were larger than those of electric blast fragments. This demonstrates that electric blast techniques produce superior fragmentation results compared with NONEL blast techniques. The outcome indicated that the mesh size through which 80% of the explosion fragments passed for the electric blast was smaller than that for the NONEL blast. As depicted in Figure 9d, the Rosin–Rammler uniformity coefficient result for both blast initiation procedures is compared. The WipFrag software result indicated that, for more than 80 percent of the blast rounds, the fragmentation produced by electric blasting was more uniform than that of the NONEL blast material.
According to the measured ground vibration, noise level, and scale distance for six nonelectric blasting rounds, it was noted that the blast-induced ground vibration (PPV) generated by all of the blast rounds for electric blast ranged from 0.4–1.2 mm/s and 80–105 dB, while that of the nonelectric blast round ranged from 0.05–0.2 mm/s and 72–95 dB. Based on [38] findings, the results from both initiation techniques at the small-scale mine are lower than the values measured at the Ewekoro limestone mine. In addition, the average value of all experimental explosions was found to be below the Federal Environmental Protection Agency’s safety threshold.
The comparison between the blast-induced ground vibration and decibel level from electric and nonelectric blasting rounds is depicted in Figure 11 and Figure 12. In comparison to nonelectric detonators, the decibel levels and ground vibrations during electric blasting were greater. According to [23], this result is attributed to the simultaneous occurrence of the instantiated discharge command effect. High instantaneous initiation from the electric detonator has been observed to support the release of high explosive pressure from the blast charge, which contributes to the generation of large-magnitude waves [39].

5. Conclusions

The present study was carried out to assess the effect of electric and nonelectric initiation techniques on blast production and blast-induced impact generation. The present research also demonstrates the application of WipFrag’s spec function and spec outline chart in assessing blast production efficiency. From the overall analysis, the following conclusions are drawn:
  • The study result revealed that electric detonation produces high percentages of fines compared with the WipFrag analysis result from nonelectric detonator blasting.
  • The finding revealed that electric detonation techniques generate high percentages of optimum-size material for 80% of the overall blast rounds compared with the company’s primary crusher inlet size range (316 mm and 215 mm mesh).
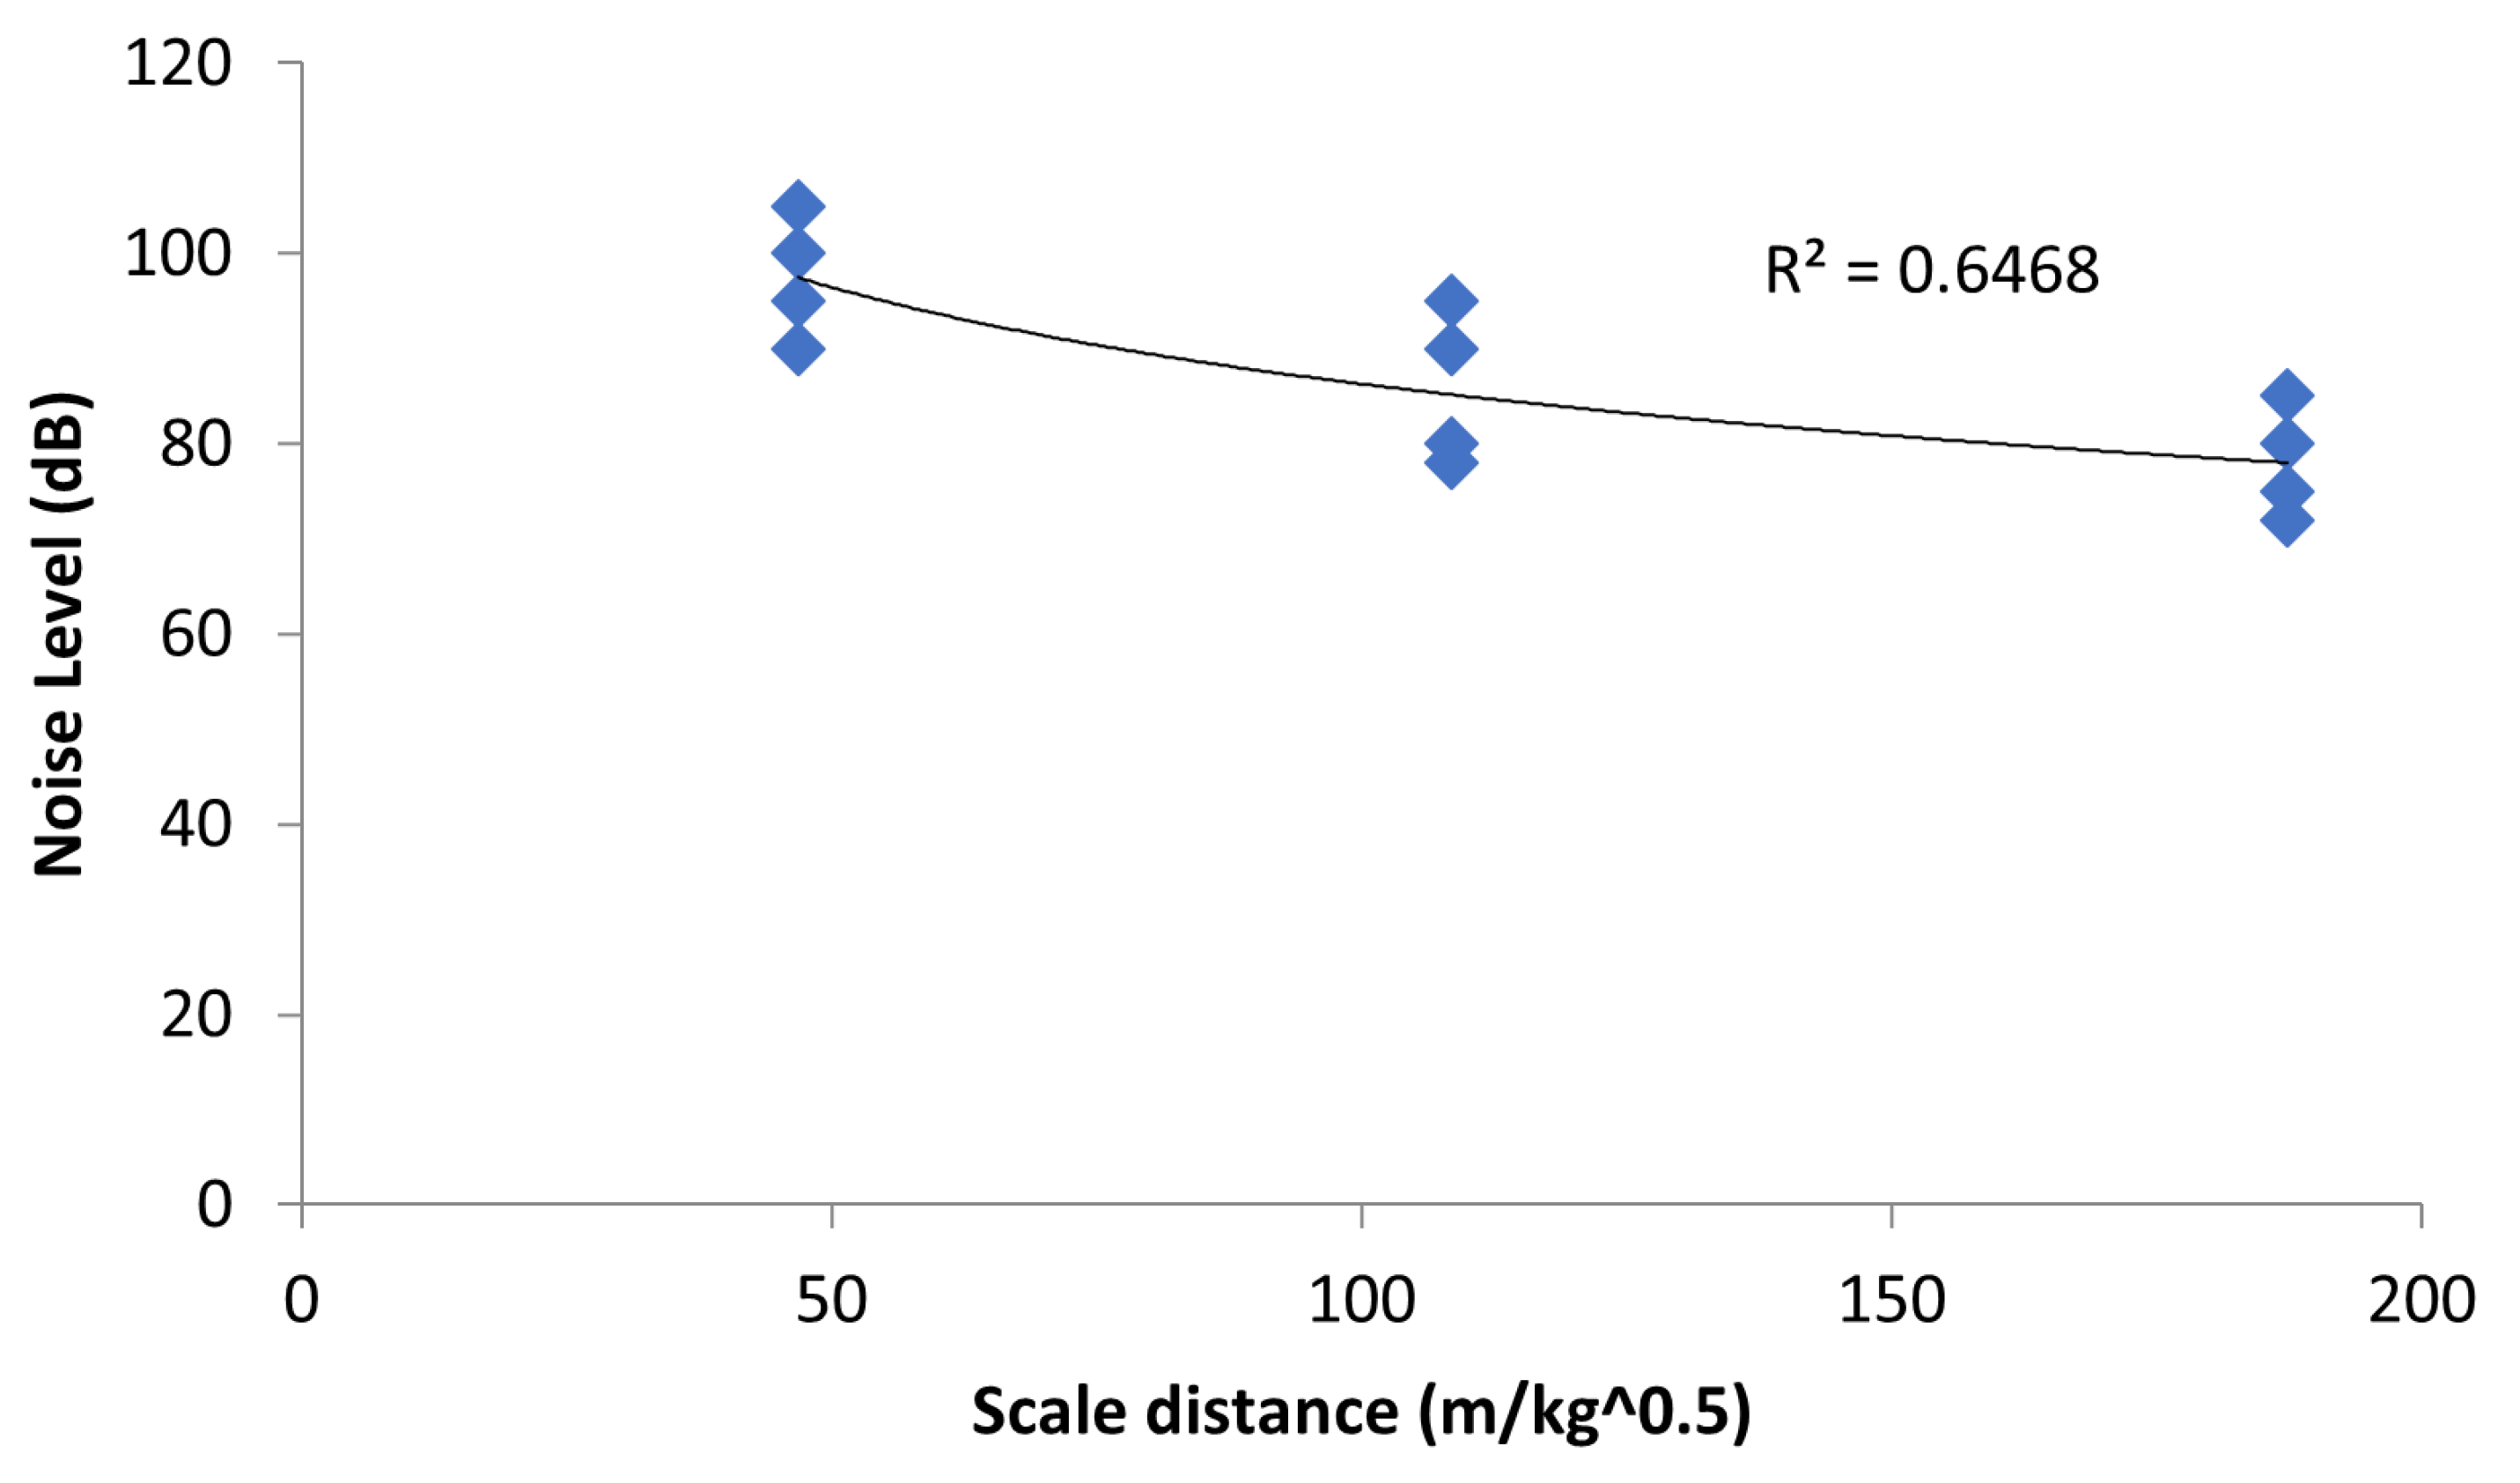
  • The average ground vibration and noise level for the nonelectric blasting rounds in the mine were 0.108 mm/s and 81.7 dB, respectively. The average ground vibration and decibel level for the six monitored electric blasting rounds were 0.76 mm/s and 92.5 dB, respectively. The results indicate that the blast-induced ground vibration (peak particle velocity) generated by all of the blast rounds for electric blast ranged from 0.4–1.2 mm/s and 80–105 dB, while that of the nonelectric blast round ranged from 0.05–0.2 mm/s and 72–95 dB. The obtained readings from the case study blast site were lower than the limits set by the Federal Environmental Protection Agency (FEPA) of 5.0 mm/s and 150 dB [45].
  • The result revealed that the noise levels and ground vibrations were higher in electric blasting compared with nonelectric detonator blasting. Ground vibration variability with scaled distance was revealed to have a negative correlation. In addition, the peak particle velocity and noise level were revealed to decrease as the scaled distance increased.
  • The WipFrag spec function indicates that 80% of the electric blast round results were on spec for 316 mm and 215 mm sieves, with mesh passing greater than 70% of the minimum benchmark set for all blast results.
  • The authors’ future work will focus on applying the deep learning algorithm in WipFrag 4.0 to simulate more blast image analysis for better assessment. Moreover, the authors also plan to utilize the orthomosaic features in the new version to capture underlying particles and more fine materials in the muck pile. Future work will also consider comparing the WipFrag analysis with other image analysis software, such as Split Desktop, among others.

Author Contributions

B.O.T.: main author, conceptualization, methodological development, literature review (lead), manuscript preparation, writing—original draft preparation, data curation, methodological development, site data collection, statistical analysis, detailing, overall analysis, software application, and supervision of data collection; N.M.K. and N.R.C.: conceptualization, methodological development, literature review (support), manuscript preparation, methodological development, statistical analysis, detailing, overall analysis, and project administration; Y.F.: literature review (support), detailed review, editing, conceptualization, overall analysis, manuscript finalization, and validation; H.I. and Y.K.: literature review (support), detailed review, final editing, conceptualization, and overall analysis; T.P. and A.P.: resources (WipFrag), software (lead), project administration, detailed review, conceptualization, and supervision; O.V.F.: validation, literature review (support), editing, and manuscript proofreading; A.A.A. and J.O.F.: resources, supervision, data collection, conceptualization, editing, investigation, detailed review, and editing. All authors have read and agreed to the published version of the manuscript.

Funding

This research received no external funding.

Informed Consent Statement

Not applicable.

Data Availability Statement

All data have been included in the paper.

Acknowledgments

The author acknowledged the support of Fatai Jimoh, the chief operating officer of Fanalou quarry, in data acquisition. The authors wish to express deep appreciation to WipWare Inc. for the support offered in analyzing the blast images using their image analysis software.

Conflicts of Interest

The authors declare no conflict of interest.

References

  1. Le Bas, M.J.; Spiro, B.; Xueming, Y. Oxygen, carbon and strontium isotope study of the Carbonatitic dolomite host of the Bayan Obo Fe-Nb-REE deposit, Inner Mongolia, N China. Mineral. Mag. 1997, 407, 531–541. [Google Scholar] [CrossRef]
  2. Taiwo, B.O.; Omotehinse, A.O. The economic potential of some metacarbonate rocks in Akoko-Edo, Edo state Nigeria. Appl. Earth Sci. 2022, 3, 167–178. [Google Scholar] [CrossRef]
  3. Dzikowski, T.J.; Cempírek, J.; Groat, L.A.; Dipple, G.M.; Giuliani, G. Origin of gem corundum in calcite marble: The Revelstoke occurrence in the Canadian Cordillera of British Columbia. Lithos 2014, 198, 281–297. [Google Scholar] [CrossRef]
  4. Winkler, E. Stone in Architecture: Properties, Durability; Springer Science & Business Media: Berlin/Heidelberg, Germany, 1997. [Google Scholar]
  5. Pitra, P.; De Waal, S.A. High-temperature, low-pressure metamorphism and development of prograde symplectites, Marble Hall Fragment, Bushveld Complex (South Africa). J. Metamorph. Geol. 2001, 3, 311–325. [Google Scholar]
  6. Hilson, G. Formalization bubbles: A blueprint for sustainable artisanal and small-scale mining (ASM) in sub-Saharan Africa. Extr. Ind. Soc. 2020, 7, 1624–1638. [Google Scholar] [CrossRef]
  7. Warra, A.A.; Prasad, M.N. Artisanal and small-scale gold mining waste rehabilitation with energy crops and native flora—A case study from Nigeria. In Bio-Geotechnologies for Mine Site Rehabilitation; Elsevier: Amsterdam, The Netherlands, 2018; pp. 473–491. [Google Scholar]
  8. Zhu, F.; Lu, G. A review of blast and impact of metallic and sandwich structures. Electron. J. Struct. Eng. 2007, 1, 92–101. [Google Scholar] [CrossRef]
  9. Nton, M.E. Report Submitted to the Honourable Minister Federal Ministry of Solid Minerals Development Abuja, FASD-2012-2016-FMMSD-Report.pdf. Available online: https://www.neiti.gov.ng/ (accessed on 22 February 2023).
  10. Kanchibotla, S.S.; Valery, W.; Morrell, S. Modelling fines in blast fragmentation and its impact on crushing and grinding. In Explo ‘99–A Conference on Rock Breaking; The Australasian Institute of Mining and Metallurgy: Kalgoorlie, Australia, 1999; pp. 137–144. [Google Scholar]
  11. Taiwo, B.O. Effect of charge load proportion and blast controllable factor design on blast fragment size distribution. J. Brill. Eng. 2022, 3, 46–58. [Google Scholar] [CrossRef]
  12. Jhanwar, J.C. Theory and practice of air-deck blasting in mines and surface excavations: A review. Geotech. Geol. Eng. 2011, 5, 651–663. [Google Scholar] [CrossRef]
  13. Deniz, V.; Deniz, O.T. The environmental effects of the air shock generated by blasting. Mugla J. Sci. Technol. 2017, 2, 166–170. [Google Scholar] [CrossRef]
  14. Jethro, M.A.; Shehu, S.A.; Kayode, T.S. Effect of Fragmentation on Loading at Obajana Cement Company Plc, Nigeria. Int. J. Sci. Eng. Res. 2016, 7, 608–620. [Google Scholar]
  15. Kinyua, E.M.; Jianhua, Z.; Kasomo, R.M.; Mauti, D.; Mwangangi, J. A review of the influence of blast fragmentation on downstream processing of metal ores. Miner. Eng. 2022, 186, 107743. [Google Scholar] [CrossRef]
  16. Dotto, M.S.; Pourrahimian, Y. Effects of Fragmentation Size Distribution on Truck-Shovel Productivity. In MOL Report Nine; University of Alberta: Edmonton, AB, Canada, 2018; pp. 335–342. [Google Scholar]
  17. Mackenzie, A.S. Cost of explosive—Do you evaluate it properly? Min. Congr. J. 1996, 32–41. [Google Scholar]
  18. Murlidhar, B.R.; Armaghani, D.J.; Mohamad, E.T. Intelligence prediction of some selected environmental issues of blasting: A review. Open Constr. Build. Technol. J. 2020, 14, 298–308. [Google Scholar] [CrossRef]
  19. Kumar, R.; Choudhury, D.; Bhargava, K. Determination of blast-induced ground vibration equations for rocks using mechanical and geological properties. J. Rock Mech. Geotech. Eng. 2016, 3, 341–349. [Google Scholar] [CrossRef]
  20. Hilson, G. Small-scale mining and its socio-economic impact in developing countries. In Natural Resources Forum; Blackwell Publishing Ltd.: Oxford, UK; Boston, MA, USA, 2002; Volume 26, pp. 3–13. [Google Scholar]
  21. Hilson, G. Small-scale mining in Africa: Tackling pressing environmental problems with improved strategy. J. Environ. Dev. 2002, 2, 149–174. [Google Scholar] [CrossRef]
  22. Jhon Gladious, J.; Janarthanan, R.; Preethivi, R.; Rajakumar, S.; Ramadoss, R. Nonel Initiation for Eco-Friendly Blasting. Int. J. Curr. Eng. Sci. Res. 2019, 6, 223–229. [Google Scholar]
  23. Maerz, N.H.; Palangio, T.C.; Franklin, J.A. WipFrag image based granulometry system. In Measurement of Blast Fragmentation; Routledge: Oxfordshire, UK, 2018; pp. 91–99. [Google Scholar]
  24. Kalyan, D.; Gopi, B.; Kumar, B.P.; Kumar, B.G.; Raju, G. A study on various surface blast initiation systems. Int. Res. J. Eng. Technol. 2021, 7, 2616–2618. [Google Scholar]
  25. Matyáš, R.; Pachman, J.; Matyáš, R.; Pachman, J. Introduction to Initiating Substances. In Primary Explosives; Springer: Berlin/Heidelberg, Germany, 2013; pp. 1–10. [Google Scholar]
  26. Stagg, M.S.; Engler, A.J. Measurement of Blast-Induced Ground Vibrations and Seismograph Calibration; US Department of the Interior, Bureau of Mines: Washington, DC, USA, 1980; Volume 8506. [Google Scholar]
  27. Siddiqui, F.I. Measurement of size distribution of blasted rock using digital image processing. Eng. Sci. 2009, 20, 81–93. [Google Scholar] [CrossRef]
  28. Blanco, J.A.S.; Singh, A.K. (Eds.) Measurement and Analysis of Blast Fragmentation; CRC Press: Boca Raton, FL, USA, 2012. [Google Scholar]
  29. Maerz, N.H.; Palangio, T.W. Post-muckpile, pre-primary crusher, automated optical blast fragmentation sizing. Fragblast 2004, 8, 119–136. [Google Scholar] [CrossRef]
  30. Maerz, N.H.; Palangio, T.C. WipFrag System II–Online Fragmentation Analysis. In Proceeding of the FRAGBLAST 6, Sixth International Symposium for Rock Fragmentation by Blasting, Johannesburg, South Africa, 8–12 August 1999; pp. 8–12. [Google Scholar]
  31. Faramarzi, F.; Farsangi, M.A.E.; Mansouri, H. Simultaneous investigation of blast induced ground vibration and airblast effects on safety level of structures and human in surface blasting. Int. J. Min. Sci. Technol. 2014, 5, 663–669. [Google Scholar] [CrossRef]
  32. Nateghi, R. Evaluation of blast induced ground vibration for minimizing negative effects on surrounding structures. Soil Dyn. Earthq. Eng. 2012, 43, 133–138. [Google Scholar] [CrossRef]
  33. Cardu, M.; Giraudi, A.; Oreste, P. A review of the benefits of electronic detonators. Rem Rev. Esc. Minas 2013, 66, 375–382. [Google Scholar] [CrossRef]
  34. Gupta, I.D.; Marwadi, S.C.; Tripathy, G.R.; Shirke, R.R. Environmental Impact of Blasting and Safety of Historic Structures. In Proceedings of the First National Symposium on Environmental Hydraulics, CWPRS, Pune, India, 24–26 June 1992; pp. 26–35. [Google Scholar]
  35. Kahriman, A.; Ozer, U.; Aksoy, M.; Karadogan, A.; Tuncer, G. Environmental impacts of bench blasting at Hisarcik Boron open pit mine in Turkey. Environ. Geol. 2006, 50, 1015–1023. [Google Scholar] [CrossRef]
  36. Vasović, D.; Kostić, S.; Ravilić, M.; Trajković, S. Environmental impact of blasting at Drenovac limestone quarry (Serbia). Environ. Earth Sci. 2014, 72, 3915–3928. [Google Scholar] [CrossRef]
  37. Pantelic, U.; Lilic, P.; Cvjetic, A.; Lilic, N. Environmental Noise Impact Assessment for Large-Scale Surface Mining Operations in Serbia. Sustainability 2023, 3, 1798. [Google Scholar] [CrossRef]
  38. Nateghi, R. Prediction of ground vibration level induced by blasting at different rock units. Int. J. Rock Mech. Min. Sci. 2011, 6, 899–908. [Google Scholar] [CrossRef]
  39. Ndibalema, A. Capturing economic benefits from blasting. In Proceedings of the Southern African Institute of Mining and Metallurgy: Surface Mining Conference, Johannesburg, South Africa, 5–8 August 2008; pp. 97–112. [Google Scholar]
  40. Rodríguez Díez, R.; Fernández, P.; Lombardía, C.; Bascompta, M.M. Analysis of blasting vibrations produced in a gold mine using the damage prevention abacus. In Proceedings of the 8th World Congresson Mechanical, Chemical, and Material Engineering (MCM’22), Prague, Czech Republic, 31 July–2 August 2022; International ASET Inc.: Orléans, ON, Canada, 2022. [Google Scholar]
  41. Wang, X.; Li, J.; Zhao, X.; Liang, Y. Propagation characteristics and prediction of blast-induced vibration on closely spaced rock tunnels. Tunn. Undergr. Space Technol. 2022, 123, 104416. [Google Scholar] [CrossRef]
  42. Mutinda, E.K.; Alunda, B.O.; Maina, D.K.; Kasomo, R.M. Prediction of rock fragmentation using the Kuznetsov-Cunningham-Ouchterlony model. J. S. Afr. Inst. Min. Metall. 2021, 3, 107–112. [Google Scholar] [CrossRef]
  43. Taiwo, B.O. Improvement of Small-Scale Dolomite Blasting Productivity: Comparison of Existing Empirical Models with Image Analysis 44 Software and Artificial Neural Network Models. J. Min. Environ. 2022, 3, 627–641. [Google Scholar]
  44. Prasad, S.; Choudhary, B.S.; Mishra, A.K. Effect of stemming to burden ratio and powder factor on blast induced rock fragmentation–a case study. In IOP Conference Series: Materials Science and Engineering; IOP Publishing: Bristol, UK, 2017; Volume 225, p. 012191. [Google Scholar]
  45. Afeni, T.B.; Osasan, S.K. Assessment of noise and ground vibration induced during blasting operations in an open pit mine—A case study on Ewekoro limestone quarry, Nigeria. Min. Sci. Technol. 2009, 19, 420–424. [Google Scholar] [CrossRef]
Figure 1. Topographic map of Ikpeshi Akoko Edo showing the case study area.
Mining 03 00030 g001
Figure 2. Marble fragmentation pile (a) and pile with PPV measure device (b,c) ground vibration data collection and image capturing.
Mining 03 00030 g002
Figure 3. Summary of the study objectives.
Mining 03 00030 g003
Figure 4. Blast hole design geometry.
Mining 03 00030 g004
Figure 5. Ground vibration and noise level measurement procedures.
Mining 03 00030 g005
Figure 6. NONEL blast results image analysis (result from WipFrag 3.3 edge detection process): (a) BL 1-1, (b) BL 1-2, (c) BL 2-1, (d) BL 2-2, (e) BL 3-1, and (f) BL 3-2.
Mining 03 00030 g006aMining 03 00030 g006b
Figure 7. Electric blast results image analysis (result from WipFrag 3.3 edge detection process). (a) EL 1-1, (b) EL 1-2, (c) EL 2-1, (d) EL 2-2, (e) EL 3-1, and (f) EL 3-2.
Mining 03 00030 g007aMining 03 00030 g007b
Figure 8. Fragmentation analysis result for nonelectric detonator.
Mining 03 00030 g008
Figure 9. Fragmentation analysis result for electric detonator.
Mining 03 00030 g009
Figure 10. Comparison between nonelectric and electric blasts using WipFrag 3.3 analysis output: (a) sphericity results, (b) X50 results, (c) X80 results, and (d) uniformity index results.
Mining 03 00030 g010aMining 03 00030 g010b
Figure 11. Comparing blast-induced noise levels from both electric and NONEL-initiated blasts.
Mining 03 00030 g011
Figure 12. Comparing blast-induced ground vibrations from both electric and NONEL-initiated blasts.
Mining 03 00030 g012
Figure 13. Relationship between ground vibration and scale distance.
Mining 03 00030 g013
Figure 14. Relationship between noise level and scale distance.
Mining 03 00030 g014
Figure 15. WipFrag spec function cumulative curve for nonelectric blast rounds: (a) BL 1-1, (b) BL 1-2, (c) BL 2-1, (d) BL 2-2, (e) BL 3-1, and (f) BL 3-2.
Mining 03 00030 g015
Figure 16. WipFrag spec function cumulative curve for nonelectric blast rounds: (a) EL 1-1, (b) EL 1-2, (c) EL 2-1, (d) EL 2-2, (e) EL 3-1, and (f) EL 3-2.
Mining 03 00030 g016aMining 03 00030 g016b
Table 1. Blast design parameters for the case study quarry.
Blast ParameterAverage Value
Burden (m)0.85
Spacing (m)1.10
Hole depth (m)1.35
Average bench height (m)4.05
Drill patternStaggered
Hole diameter (m)0.04
Drill hole depth (m)1.35
Stemming (m)0.66
Subdrill (m)0
Charge length (m)0.65
Charge weight (kg)1.1
Table 2. Assigned blast identification number for each captured image.
Blast IDDescriptionNumber of Drill Holes
BL 1-1Image from nonelectric blast round one at pit 135
BL 1-2Image from nonelectric blast round two at pit 156
BL 2-1Image from nonelectric blast round one at pit 235
BL 2-2Image from nonelectric blast round two at pit 256
BL 3-1Image from nonelectric blast round one at pit 335
BL 3-2Image from nonelectric blast round two at pit 356
EL 1-1Image from electric blast round one at pit 135
EL 1-2Image from electric blast round two at pit 156
EL 2-1Image from electric blast round one at pit 235
EL 2-2Image from electric blast round two at pit 256
EL 3-1Image from electric blast round one at pit 335
EL 3-2Image from electric blast round two at pit 356
Table 3. Nonelectric blast size distribution results.
Size (mm)BL 1-1BL 1-2BL 2-1BL 2-2BL 3-1BL 3-2
70054.7570.2279.3179.0567.2263.7
68154.7570.2277.2479.0567.2262.4
46439.8252.0459.8466.9856.5346.65
31628.1738.741.7757.4242.9736.8
21520.3628.4331.0249.5730.3828.17
14713.4819.9119.8239.5918.219.83
1007.4211.5412.3231.369.3812.26
68.13.335.896.1723.854.947.28
46.41.52.842.6719.523.184.78
31.60.641.121.0917.422.513.72
21.50.240.380.3416.482.273.37
14.70.110.130.1316.132.223.27
100.030.030.0415.982.183.21
6.8100015.9803.19
4.64000000
1.47000000
1000000
Table 4. Electric blast size distribution results.
Size (mm)EL 1-1EL 1-2EL 2-1EL 2-2EL 3-1EL 3-2
100095.7887.5510088.2694.68100
68177.8274.7994.2572.3288.6100
46450.2261.5179.1663.77593.48
31632.0348.9359.8147.8560.8883.4
21517.3933.7642.6936.5147.2168.7
1477.5919.1231.124.0935.6653.94
1003.298.5919.2313.1222.5446.94
68.11.213.519.126.3410.7336.09
46.40.451.283.793.224.224.23
31.60.20.461.322.111.4914.13
21.50.080.190.471.660.539.39
14.70.040.040.181.560.217.57
1000.040.091.470.086.99
6.81000.041.430.046.69
4.64000000
1.47000000
Table 5. Blast result noise and ground vibration data for the 12 blasts.
Distance (m)NONEL Noise Level (dB)Electric Noise Level (dB)NONEL Ground
Vibration (mm/s)
Electric Ground
Vibration (mm/s)
50951050.21.2
10078950.10.8
20072850.050.5
50901000.151
10080900.10.7
20075800.050.4
Mean116.666781.6666792.50.1083330.766667
StDev68.313018.9591679.3541430.0584520.301109
Variance4666.66780.2666787.50.0034170.090667
Disclaimer/Publisher’s Note: The statements, opinions and data contained in all publications are solely those of the individual author(s) and contributor(s) and not of MDPI and/or the editor(s). MDPI and/or the editor(s) disclaim responsibility for any injury to people or property resulting from any ideas, methods, instructions or products referred to in the content.

