Abstract
The island of Cyprus is famous for its rich deposits of volcanic mineralisation that yielded large quantities of copper, gold, and silver. The abandonment of the waste material in several dump sites during exploitation severely impacted the environment. A significant environmental issue is the acid mine drainage from the hydration of large barren piles that cover these old open pit mines. However, abandoned piles are still enriched in precious metals and perhaps even rare earth metals. These dump sites may form a new possible “deposit”, which may attract companies’ economic interest. Removing the stockpiles can be cost-effective, since the secondary extraction process is profitable, in addition to the benefits from the restoration of the natural environment. The case study considered here pertains to the North Mine of Mathiatis, where unmanned aerial vehicle (UAV) images were used to create not only a 3D topographic map but also to locate these dump sites and finally to create a 3D model of one of these waste stockpiles. The methodology proposed here to locate dump sites by using point cloud data (x, y, z, RGB) and high-resolution images provided by UAVs will assist in the secondary mining of old open-pit mines by defining the bottom and top stockpile surfaces. The reconstructed 3D waste piles can also be used to calculate the volume they occupy and other parameters, such as the gradient of slopes, that are essential for estimating the cost of possible restoration. The proposed methodology was applied to the stockpile STK1 with the most available drillhole data, and its volume was estimated at 56,000 m3, approximately.
1. Introduction
According to the Mines Department of the Republic of Cyprus, in an area of 142 square kilometres, there are currently 61 active exploration licenses (and another 15 under consideration) for the discovery of copper, gold, silver and other precious metals and generally mixed sulfide ores. Most of these exploration licenses relate to already exploited areas that were abandoned several years ago due to various problems that had arisen.
The possibility of exploiting these areas, apart from the economic benefits, also directly impacts the environment, as the main problem in the areas of the old mines is related to acid drainage. Much research has been carried out to study and restore these areas [1,2,3,4], where restoration by phytoremediation using low-pH-resistant plants is suggested in [2]. However, rehabilitation, apart from being a long-term process that helps to restore the landscape to its natural form visually, does not solve the problem of heavy metal contamination of water [3]. The old Mathiatis mines are one such case of mines that started to operate in the 1930s (1936–1938) and were abandoned in the 1980s, leaving behind open-pit mining (Figure 1) and piles of disposed waste material with or without mineralisation [2,3]. One of the major problems of these piles is the accurate estimation of their volume since usually there are no data on the area topography before mining began.
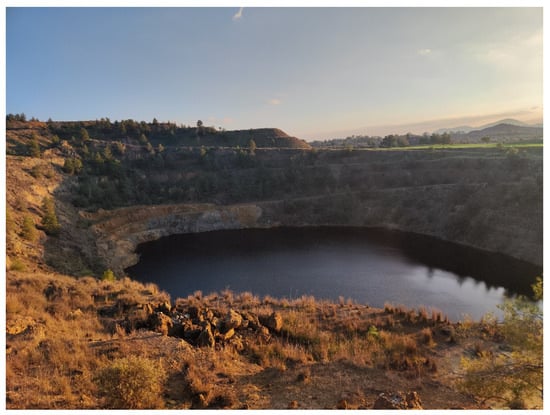
Figure 1.
South view of the abandoned open pit North Mathiatis mine (Personal photo of Papaconstantinou).
In this paper, based on high-resolution photographs from unmanned aerial vehicles (UAVs) [5,6,7,8,9], also known as drones, an attempt has been made to estimate the area occupied by the abandoned stockpiles, measure their volumes and to spot areas that need further exploration. UAVs have grown in recent years, and their use in the mining sector has provided a quick, effective, and cheap solution compared to other methods, such as using satellites or aerial photographs [10,11]. It is difficult to obtain direct results from these technologies due to factors such as dense cloud cover, the position of the satellite and dust in the atmosphere [12]. Thus, in many mining cases, UAVs have been used (Figure 2) in the exploration, exploitation, or rehabilitation phases [6,7,12,13,14,15].
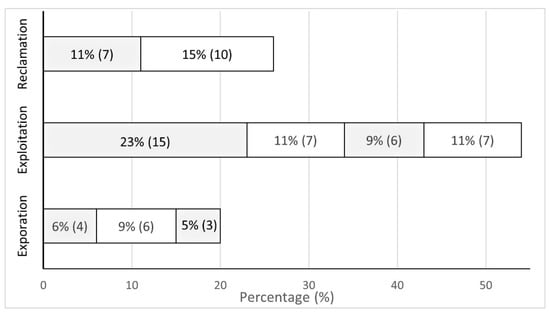
Figure 2.
Percentage presentation of UAV application in each mining process phase [14].
The main objective of this work was to create a 3D model of abandoned stockpiles and estimate the potentially exploitable reserves. For this purpose, the GEOVIA Surpac software [16] combined data from the UAV and available drillholes into resource calculations by applying the Kriging technique [17,18,19]. This is an interpolation technique commonly used in mining applications [20,21,22,23], with the advantage of using actual data spatial distribution in estimations and simultaneously minimising square error based on the spatial data position.
Treating waste from open-pit mines as a source of mineralisation increases the mining industry’s sustainability and simultaneously reduces the environmental footprint of old mines in the area. The proposed methodology was applied in the case of the Mathiatis mine, where there are three small and five large waste stockpiles (with a focus on the one with the most data available, stockpile STK1) with significant mineralisation and a total volume of about 56,000 m3. Based on the present investigation, the area is considered suitable for further investigation to be exploited in the future.
2. Geology of Cyprus (of the Study Area)
Cyprus is an island in the easternmost part of the Mediterranean region, considered one of the most geodynamically active regions globally. The wider area constitutes the junction of the Eurasian, Nubian, and Arabian plates [24,25,26,27,28,29,30]. In particular, the northward motion of the Arabian plate results in the westward Anatolian plate tectonic escape, leading to the Aegean micro-plate southwestern motion [31,32]. Eventually, the subduction process of the Nubian plate under the corresponding Eurasian one occurs along the subduction zone, extending from the southern parts of the Ionian Sea and Crete, respectively, to Cyprus [33,34,35,36,37]. Therefore, this geodynamic regime resulted in complicated geological processes imprinted in various lithological and tectonic features [38]. This paper focuses on the properties description of the geological-lithological formations structuring the island of Cyprus. These formations are documented in four distinct geological zones, which are: (i) Pentadaktylos—Kyrenia zone, (ii) Mamonia zone (or complex), (iii) autoch-thonous sedimentary rock zone, (iv) Troodos zone (or ophiolite) and (v) volcanogenic massive sulfide ore deposits.
The volcanogenic massive sulfide ore deposits are the main formation associated with this research. In particular, the Mt. Troodos ophiolite mass is related to significant massive sulfide ore deposits [39] resulting from marine volcanic procedures [40]. These ore deposits are of great importance for Cyprus Island, as more than 40% of sulfide minerals are included, such as pyrite (), chalcopyrite (), bornite (), sphalerite (), chalcocite (), galena (), etc., while they are characterised by significant concentrations of copper (), zinc (), lead (), gold () and silver () [40]. The sulfide mineral formations are directly associated with the hydrothermal fluid circulation procedure occurring in the oceanic crust rocks (Figure 3). The metal elements (ferrum, copper, zinc, sulfur, etc.) included in these fluids have been leached by the underlying rocks. In particular, the leaching process has predominantly been performed in a multiple dykes system due to the high-temperature water circulation through cracks and joints; the upward magma bodies’ motion along the extension axes of the sea floor causes this water overheating.
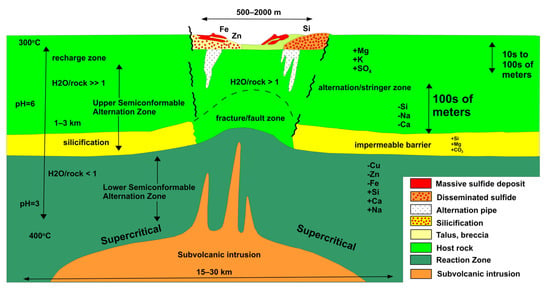
Figure 3.
Display of factors, resulting in the massive sulfide ore deposits formation [41].
The hydrothermal activity affects the metal elements mentioned above, resulting in oxide formations, such as cuprite () and tenorite (), while sulfur (e.g., chalcanthite—, brochantite—) and carbonate (e.g., malachite—, azurite—) compounds also occur.
3. Stockpile Volume Estimation
3.1. Proposed Methodology Plan
Data were collected from UAV flights at an elevation of 70 m with drone model DJI Phantom RTK Pro (having an accuracy 5 cm). Thirty control points combined with the 5100 photographs that were taken (with 80% overlap) generated a point cloud of a total of 21 million points. This point cloud (courtesy of Harold Andrew Daniels) was used first to create the study area’s topographic map and then to define the bottom stockpile’s surface with no topographic data available. For the reconstruction of the bottom surface, the following approach was used:
- The stockpile’s boundary was digitised by visual inspection on the point cloud.
- The points of the stockpile’s boundary combined with drillhole data were imported into the GEOVIA Surpac database to build a pseudo-3D block model (BM) The estimation parameter is the elevation Z since the z coordinate of imported data and blocks centroid is dummy (zero).
- After statistical and geostatistical analysis, estimates of elevation (here treated as a BM attribute) were calculated into each BM’s centroid using the Kriging technique.
- These elevation estimates were validated using Kriging residual statistics described analytically in Section 3.6 as proposed by [17,18]. If the Kriging validation failed, then corrections of the Block Kriging model variables were made, and the elevation estimations were repeated.
- After successful validation of Kriging, X, Y of the BM centroids along with the elevation estimated variable as Z were used as input data (points) for the bottom stockpile’s DTM.
The bottom and top DTM surfaces were combined to create the 3D solid model of the stockpile and its volume estimation. This methodology is best described in the flow diagram of Figure 4.
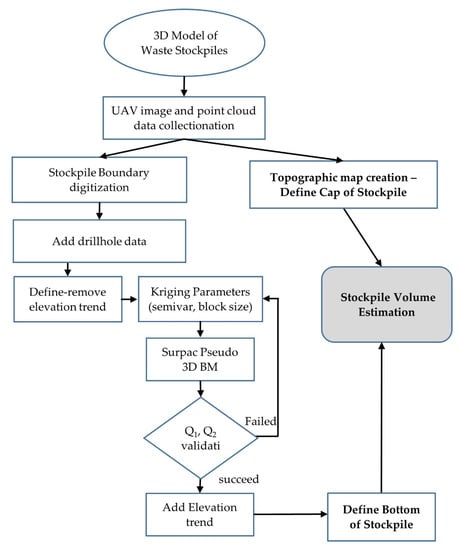
Figure 4.
Schematic diagram of the proposed methodology.
3.2. Topographic Map Creation
UAVs were used to scan the Mathiatis mine area, and the resulting point cloud dataset was employed to create the topographic map. A total of nine las files were combined in open access program CloudCompare (www.danielgm.net/cc/) (accessed on 25 November 2022), and after noise removal and point density reduction—one every 2 m (memory handling)—the final map of the area’s current state was created. This map and the relative digital terrain model (DTM) are displayed in Figure 5a,b, respectively.
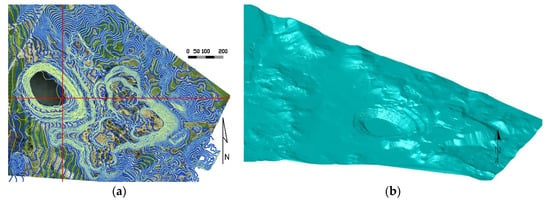
Figure 5.
Mathiatis mine area isolines with (a) aerial photo and (b) the relative DTM.
Concerning the digitisation of the stockpile boundary, a different procedure from the previous one was used. The boundary line of the stockpile was created on the point cloud itself (Figure 6). The resulting boundary consists of about 280 points which are the contact points of the stockpile with the ground and is common for both the upper and lower stockpile’s surface. Since the point cloud, apart from the coordinate values, also contains RGB (red-green-blue) values, this procedure was more accurate and flexible (erratic points could be easily identified and discarded manually).
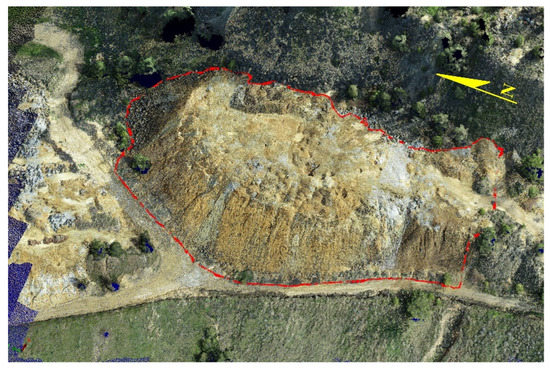
Figure 6.
Digitisation of the stockpile boundary on the point cloud dataset.
3.3. Drillhole Data Database
In the Mathiatis mine area, a new drilling program was developed with 39 drillholes (a total length of 829 m was drilled), most of them on the top of the stockpiles observed during the geological study. Since, in this study, the bottom surface of the tailings layer is needed, then only geological data were used. The locations of the 39 drillholes are presented in Figure 7. Three major formations were identified with minor differences in colouration and mineralogical composition. These formations are the wastes of the previous exploitation in the area (tailing formation—TF), the Perapedi formation (umber layer—U) and the upper pillow-lava formation (UPL). Each point elevation at the end of the tailings formation was not only used as a new attribute to the BM along with the point elevation of the stockpile boundary but also as a control point for the error of the BM’s estimates.
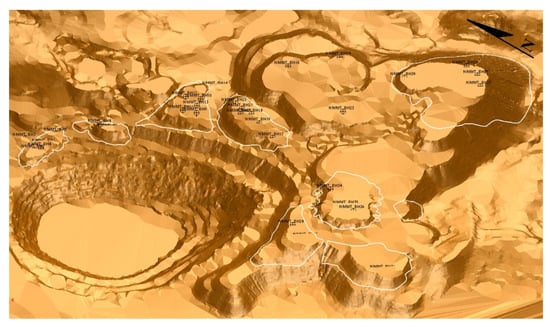
Figure 7.
Locations of 39 drillholes on Mathiatis area DTM in 3D preview.
3.4. Statistcal—Geostatistical Analysis
Histograms of 278-point elevations were constructed to check the data distributions and proceed to experimental semivariogram plots. The first attempt at raw data values presented a Gaussian distribution histogram plot (Figure 8a). However, the relative semivariogram plot (Figure 8b) presented a trend towards the greater values for the range, and a Gaussian mathematical model was calibrated on it. This trend can be observed in the experimental semivariogram shape (large sill values versus variance presented with a green line in Figure 8b). Several attempts in GEOVIA Surpac were made to check for an anisotropy on the data [42,43]. Due to the small number of data and since the software uses search ellipsoids that are cones with angle values less than 30°, their number became so small that it was impossible to build directional variograms.

Figure 8.
(a) Histogram and (b) experimental semivariogram of raw elevation data.
As evident from the semivariogram in Figure 8b, the data showed a trend due to the slope of the waste disposal, so the best-suited technique was using universal Kriging. As this option is not available in the training version of Surpac, our approach was to remove the trend from the data. The possible polynomial tendency depends on the old hillside shape, and based on point cloud data and borehole information is better defined by using the following second-degree polynomial (Table 1):
where x and y are the coordinates with respect to the position of drillhole P1, the new transformed value is used in the Surpac algorithm. The transformed elevation data spatial statistics are presented in Figure 9.

Table 1.
Polynomial trend constants.

Figure 9.
(a) Histogram and (b) experimental semivariogram of transformed elevation data.
The mathematical semivariogram parameters calibrated on both data cases’ are presented in Table 2. These parameters were used to estimate the BM’s variables, which are explained in the following subparagraph.

Table 2.
Block model geometrical parameters.
3.5. Block Model of the Study Area
BMs for each stockpile were constructed, covering a distance of 10–20 m around every boundary (Figure 10). The procedure was implemented exclusively on the stockpile STK1, based on the drillhole data availability. The “pseudo”-3D BM for STK1 (all centroids are on the same elevation, 0.5) consisted of 5400 blocks with extents of 120 m and 180 m in easting and northing, respectively (Table 3).

Table 3.
Block model geometrical parameters.
The location of the measurements plays an essential role in determining a random field, as spatial continuity requires that similar values are observed in neighbouring locations. The spatial continuity can be described by the variation of the dispersion in space which is given by the following theoretical relationship [44,45]:
E[ ] is the mean value of the expression in the bracket.
For the calculation of the experimental semivariogram, all pairs belonging to distance r and direction are used:
where: the position vector of the measurements of parameter z,
the distance and direction of calculation,
, pairs number
, unitary vector in direction .
The equations of ordinary Kriging are based on the semivariogram assuming unknown mean value but constant in the field of investigation and described by Equations (4)–(7) [45].
The unbiased condition is ensured by the following Equation (5):
The estimates of the Kriging variable and variance are given by:
3.6. Validation of Block Model Estimates
At this point, the BM’s attribute estimates needed to be validated before the final construction of the bottom tailings formation surface. Since all these estimates depended significantly on the variogram parameters, selecting the best mathematical model was essential. In this way, the validation of the Kriging model was evaluated through the validation of the semivariogram mathematical model. The selected validation method depended on the estimation errors measured on the control points. In this case, the elevation values of each drillhole point were normalised with Kriging’s variance as estimated into each BM’s centroid. This methodology is called the residuals (Q)—Test [17], and the normalised residual is estimated through the equation:
, is elevation of Kriging elevation estimation,
, is Kriging variance estimation and
actual elevation of the stockpile’s bottom from drillhole data in position
- value
Statistical value of is the mean of the normalised errors:
where is a random regionalised variable that follows the normal distribution ().
- value
Statistical value of is the mean of the squared normalised errors:
Again, making the assumption that all errors are following the normal distribution, then the square errors follow the “Chi-Square” distribution with a mean equal to 1. The “Chi-Square” is a non-symmetric distribution which is used in the case of a small number of data, n < 40, and holds for the present case (21 data). The region’s determination with a 95% confidence level is made from charts from the international literature [17]. In choosing the best semivariogram parameters, needs to be close to zero and close to 1, and, as mentioned before, errors follow a normal distribution.
3.7. Block Model Elevation and Variance Estimates
The Kriging algorithm was first executed using only the datum from the points of the boundary line (no drillhole data were used), and elevation estimates were carried out for all block centroids (Figure 10a). The estimates for each block in the vicinity of every drillhole were compared to the closest drillhole’s real value to calculate the relative errors. Next, data from one drillhole were inserted into the calculations, and the Kriging algorithm was executed again. This procedure continued until all drillholes were inserted into the calculations and all errors were estimated. The BM of the first scenario (raw elevation values) was validated, as will be described in Section 3.5. This first scenario was rejected since the Q2 residual statistic constraint was not met. A second Scenario II, was implemented to remove a polynomial trend (Equation (1)), as described in Section 3.4. In Scenario II, after the first estimation of Z transformed data into every block of the BM, data from drillhole NMMT_BH19 were inserted into the calculations, and the Kriging algorithm was executed again (Figure 10b). New estimates for elevation were carried out, and new errors were calculated. This procedure was continued until all drillhole data were inserted into calculations, and all errors were estimated for every step (Figure 10c–h). The drillhole data import sequence was NMMT_BH18, NMMT_BH19, NMMT_BH21, NMMT_BH22, NMMT_BH20, NMMT_BH17, as displayed in Figure 10b–h.
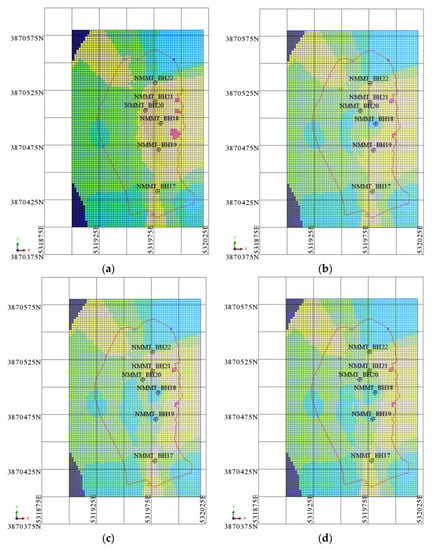
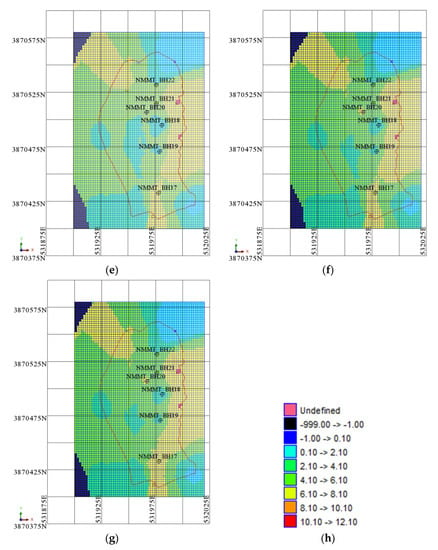
Figure 10.
BM plans presenting the elevation (transformed) distribution as data from drillholes are imported into the Kriging algorithm when (a) no drillholes are used, (b) NMMT_BH18 is added to (a,c) NMMT_BH19 is added to (b,d) NMMT_BH21 is added to (c,e) NMMT_BH22 is added to (d,f) NMMT_BH20 is added to (e,g) NMMT_BH17 is added to (f,h) colormap legend.
An area of high variance values can be identified in the west part of the STK1 stockpile. This increased uncertainty could be reduced by adding two extra drillholes near the red dot locations (see Figure 11).
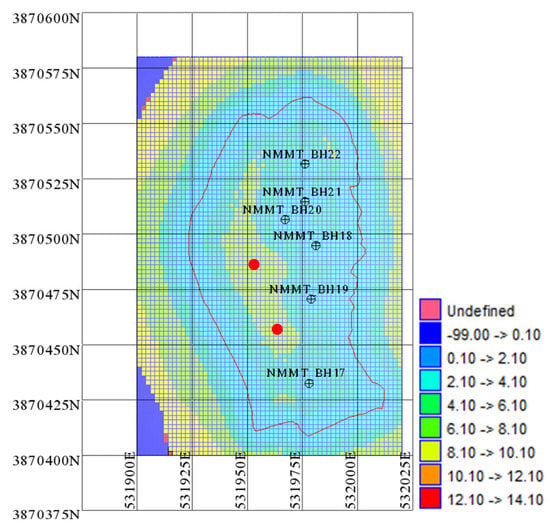
Figure 11.
Kriging variance of the final model estimates.
Estimations, errors, and Kriging variances from each step were used to define the block model’s validity again. Since both Q1 and Q2 constraints were met (Figure 12), the construction of the lower TF surface and the stockpile’s volume estimation was done. The Kriging variance of the final Z transformed values (Figure 10g) is presented below After the validation of Z predictions, the X, Y, and Z-predicted values of each BM’s centroid were now used as a point for the creation of the bottom stockpile’s surface. This means that the number of points that was used for the bottom stockpile’s surface is the same, with the number of the block shown in Figure 10 and Figure 11 (inside the red line).
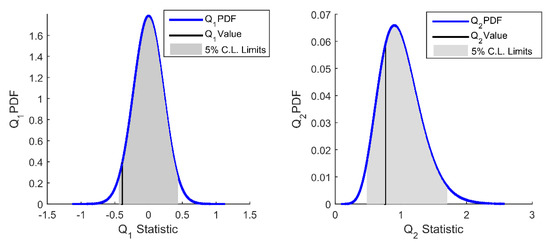
Figure 12.
and distribution probability density function.
From the above checks, the Kriging algorithm based on the parameters of Table 2 underestimates the elevation (Q1 < 0) and overestimates the error (Q2 < 1), which can be enhanced by further reducing the semivariogram sill value. It was noted that the residual statistics check, although far from the mean values of the respective statistics Q1 and Q2, were within the confidence level (CL) of 5%, so the selected semivariogram parameters cannot be rejected.
3.8. Stockpile Volume Estimation
After the validation of the final model, the estimated values were back-transformed into “real” elevations into each block’s centroid. Northing, easting, along with this elevation, were used to construct the bottom STK1 surface, as shown in Figure 13a. This surface also contains elevation values estimated from extrapolation data, which are high uncertainty values. These values are removed when cutting the surface with the boundary that was digitised from the point cloud UAV data (Figure 13b).
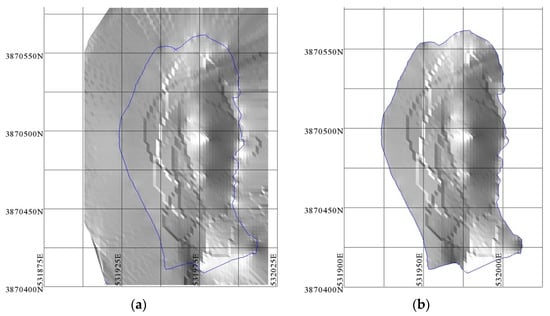
Figure 13.
Final stockpile STK1 bottom surface (a) before and (b) after digitising from UAV data (blue line) boundary is applied.
This surface, combined with the top surface of the STK1 (Figure 14) constructed as described in Section 3.2, was used to estimate the stockpile’s volume, which is equal to 56,000 m3. The two blue lines show the traces of two sections of STK1.
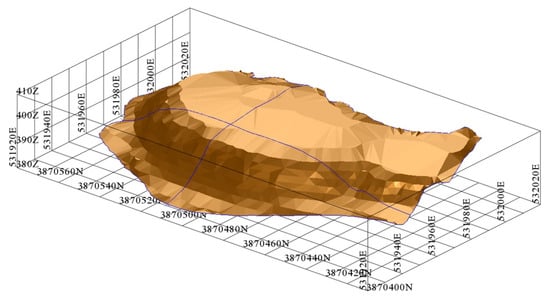
Figure 14.
Final stockpile STK1 of 56,000 m3 with the traces of two sections in NS and WE direction.
These two sections describe the present and past topography of the area, which is essential for accurate volume estimation. It is important to mention again that exploitation of the Mathiatis area started in the 1930s, along with the waste disposal, and that no topographical data were present (Figure 15).
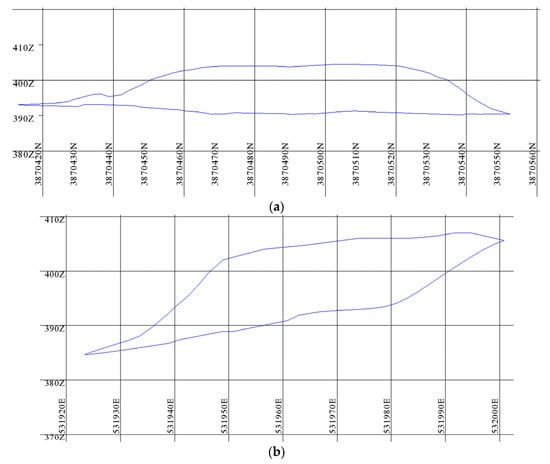
Figure 15.
Stockpile STK1 sections in the (a) north–south direction and (b) west–east direction.
4. Discussion
Since the construction of the top surface’s DTM is a common procedure using UAVs data (photogrammetry) with many available publications, the contribution of the current work is the combination of a UAV point cloud and drillhole data to estimate the underneath surface (not optically reached by UAV flights). Since, in the first stages of investigations, only a small number of drillholes is applied, the proposed methodology can produce fast and relatively accurate predictions of the stockpile’s volume. For this purpose, the linear interpolation Kriging technique was applied as a tool to predict areas that are not “visible”. The approach that was used is a pseudo-3D BM (actually, the BM has only one block in the Z direction—2D BM). In each BMs’ centroid, the z value of the stockpile–bedrock interface is estimated. After the validation of the Z predictions, X, Y, and Z-predicted values of each BM’s centroid were then used as a point for the creation of the bottom stockpile’s surface. Another technique used in cases such as these is indicator Kriging [18,46] but due to the lack of available data (few drillholes) the proposed technique was preferred. In this work, a commercial software commonly used in mining projects for 3D block estimations was used, instead of using an existing Kriging algorithm [47,48] or any other open access code. An adaptation was made in the Surpac software for a 2D Kriging application for the elevation of bottom stockpile by combining point cloud and drillhole data.
5. Conclusions
This paper proposed a new methodology for waste stockpile volume calculation with a small number of available drillholes by combining aerial photographs and drillhole data. This methodology can be applied in any old waste deposits combining a UAV point cloud which includes coordinates (X, Y, Z) and a colour data RGB (red, green, blue) and available drillhole data.
The drillholes were used to upgrade the first model based initially on the stockpile’s boundary defined from the point cloud dataset from aerial photogrammetry by finding the optimal parameters of the Kriging algorithm. In elevation data, there exists a second order drift due the old hillside shape. This drift is subtracted from the data and Kriging applied to the new elevation data. Since Kriging predictions depend on the semivariogram parameter selection. a validation technique of residual statistics Q1, Q2 was used for selection of exponential semivariogram with 41 m scale parameter, 6.8 sill and a small amount of nugget effect 0.06.
The volume of the deposits of the stockpile with the most available data was approximately estimated at 56,000 m3. The advantage of the Kriging method is that the uncertainty is also estimated. Based on the above methodology, new drillhole locations in areas of high Kriging variance can be proposed to minimise any uncertainty. It was noted that the most secure method would be to use topographic maps before placing the waste deposits, but this was not feasible due to time elapsed since the old open pit mine was abandoned.
The recovery of these piles is essential for the remediation of the Mathiatis area of Cyprus, where the acid rain phenomenon is intense, causing problems of contamination of the aquifer. At the same time, the remaining mineralisation combined with the existence of the umber deposits beneath the waste stockpiles has attracted the interest of many companies. It is only a matter of time before open pit mining in the broader area proceeds. Hence, the proposed model could be a valuable tool for the first stages of planning the exploitation.
In reducing the model prediction risk, more targeted drilling would be necessary to reduce the “dark” spots within the reservoir. For example, in the examined stockpile, the available drillholes were spaced at regular intervals in the centre of the pile. The exact number of drillholes would provide more information if they were scattered throughout the volume of the pile, reducing the unmeasured distances and, thus, the uncertainty.
The environmental restoration, the stockpile’s residual value, plus the fact that the existence of confirmed umbra deposits beneath the stockpiles will add a secondary profit for future exploitation. The proposed methodology can be used for more accurate volume estimation of all stockpiles (by suggesting the possible position of new drillholes), optimising the mining design and the selection of suitable mechanical equipment.
Author Contributions
Conceptualisation, G.S. and G.X.; methodology, G.S. and G.X.; software, G.S.; validation, G.X., G.E. and G.S.; formal analysis, G.X.; investigation, A.P. and G.S.; resources, A.P.; data curation, G.S., G.X. and A.P.; writing—original draft preparation, G.S., G.X. and I.L.; writing—review and editing, G.X., G.S., G.E. and I.L.; visualisation, G.S.; supervision, G.E. All authors have read and agreed to the published version of the manuscript.
Funding
This research received no external funding.
Data Availability Statement
Not applicable.
Acknowledgments
Harold Andrew Daniels, New Cyprus copper P.A. Ltd. for data provided (aerial photographs, drones scanning, topography, drilling drillholes geological description and chemical analysis).
Conflicts of Interest
The authors declare no conflict of interest.
References
- Galanopoulos, E.; Skarpelis, N.; Argyraki, A. Supergene Alteration, Environmental Impact and Laboratory Scale Acid Water Treatment of Cyprus-Type Ore Deposits: Case Study of Mathiatis and Sha Abandoned Mines. Geochem. Explor. Environ. Anal. 2018, 19, 299. [Google Scholar] [CrossRef]
- Stylianou, M.; Gavriel, I.; Vogiatzakis, I.N.; Zorpas, A.; Agapiou, A. Native Plants for the Remediation of Abandoned Sulphide Mines in Cyprus: A Preliminary Assessment. J. Environ. Manag. 2020, 274, 110531. [Google Scholar] [CrossRef]
- Hudson-Edwards, K.A.; Edwards, S.J. Mineralogical Controls on Storage of As, Cu, Pb and Zn at the Abandoned Mathiatis Massive Sulphide Mine, Cyprus. Miner. Mag. 2005, 69, 695–706. [Google Scholar] [CrossRef]
- Stylianou, M.; Tsiftes, K.; Gavriel, I.; Kostarelos, K.; Demetriou, C.; Papaioannou, A. Environmental Impacts of Abandoned Sulphide Mines—The Example of Mathiatis Mine in Cyprus. In Proceedings of the SYMBIOSIS International Conference, Athens, Greece, 19–21 June 2014; pp. 19–21. [Google Scholar]
- Dawei, Z.; Lizhuang, Q.; Demin, Z.; Baohui, Z.; Lianglin, G. Unmanned Aerial Vehicle (UaV) Photogrammetry Technology for Dynamic Mining Subsidence Monitoring and Parameter Inversion: A Case Study in China. IEEE Access 2020, 8, 16372–16386. [Google Scholar] [CrossRef]
- Ren, H.; Zhao, Y.; Xiao, W.; Hu, Z. A Review of UAV Monitoring in Mining Areas: Current Status and Future Perspectives. Int. J. Coal Sci. Technol. 2019, 6, 320–333. [Google Scholar] [CrossRef]
- Erenoglu, O. Uav for 3d Morphological Mapping Applications: A Case Study of Koru Mining Site, Canakkale, NW Turkey. Teh. Vjesn. 2021, 28, 1044–1050. [Google Scholar] [CrossRef]
- Barba, S.; Barbarella, M.; di Benedetto, A.; Fiani, M.; Gujski, L.; Limongiello, M. Accuracy Assessment of 3d Photogrammetric Models from an Unmanned Aerial Vehicle. Drones 2019, 3, 79. [Google Scholar] [CrossRef]
- Sanz-Ablanedo, E.; Chandler, J.H.; Rodríguez-Pérez, J.R.; Ordóñez, C. Accuracy of Unmanned Aerial Vehicle (UAV) and SfM Photogrammetry Survey as a Function of the Number and Location of Ground Control Points Used. Remote Sens. 2018, 10, 1606. [Google Scholar] [CrossRef]
- Jiménez-Jiménez, S.I.; Ojeda-Bustamante, W.; Marcial-Pablo, M.D.J.; Enciso, J. Digital Terrain Models Generated with Low-Cost UAV Photogrammetry: Methodology and Accuracy. ISPRS Int. J. Geoinf. 2021, 10, 285. [Google Scholar] [CrossRef]
- Yadav, S.K.; Borana, S.L. Monitoring and Temporal Study of Mining Area of Jodhpur City Using Remote Sensing and GIS. Int. Res. J. Eng. Technol. 2017, 4, 1732–1736. [Google Scholar]
- Lee, S.; Choi, Y. Reviews of Unmanned Aerial Vehicle (Drone) Technology Trends and Its Applications in the Mining Industry. Geosyst. Eng. 2016, 19, 197–204. [Google Scholar] [CrossRef]
- Yao, H.; Qin, R.; Chen, X. Unmanned Aerial Vehicle for Remote Sensing Applications—A Review. Remote Sens. 2019, 11, 1443. [Google Scholar] [CrossRef]
- Park, S.; Choi, Y. Applications of Unmanned Aerial Vehicles in Mining from Exploration to Reclamation: A Review. Minerals 2020, 10, 663. [Google Scholar] [CrossRef]
- Shahmoradi, J.; Talebi, E.; Roghanchi, P.; Hassanalian, M. A Comprehensive Review of Applications of Drone Technology in the Mining Industry. Drones 2020, 4, 34. [Google Scholar] [CrossRef]
- GEOVIA SurpacTM. Integrated Geology, Resource Modeling, Mine Planning and Production 2022; Dassault Systèmes GEOVIA Inc.: Vélizy-Villacoublay, France, 2022. [Google Scholar]
- Journel, A.G.; Huijbregts, C.J. Mining Geostatistics; Academic Press: London, UK, 1978. [Google Scholar]
- Kitanidis, P.K. Introduction to Geostatistics; Cambridge University Press: Cambridge, UK, 1997. [Google Scholar]
- Exadaktylos, G.; Saratsis, G. Methodology for the Estimation and Classification of White Marble Reserves. Min. Met. Explor. 2020, 37, 981–994. [Google Scholar] [CrossRef]
- Tao, Z.; Cui, X.; Sun, X.; Wang, J.; Liu, K.; Chen, H. Rock Mass Quality Prediction of Open-Pit Gold Mine Slope Based on the Kriging Interpolation Method. Geotech. Geol. Eng. 2020, 38, 5851–5865. [Google Scholar] [CrossRef]
- Nwaila, G.T.; Ghorbani, Y.; Zhang, S.E.; Tolmay, L.C.K.; Rose, D.H.; Nwaila, P.C.; Bourdeau, J.E.; Frimmel, H.E. Valorisation of Mine Waste—Part II: Resource Evaluation for Consolidated and Mineralised Mine Waste Using the Central African Copperbelt as an Example. J. Environ. Manag. 2021, 299, 113553. [Google Scholar] [CrossRef]
- Kasmaee, S.; Gholamnejad, J.; Yarahmadi, A.; Mojtahedzadeh, H. Reserve Estimation of the High Phosphorous Stockpile at the Choghart Iron Mine of Iran Using Geostatistical Modeling. Min. Sci. Technol. 2010, 20, 855–860. [Google Scholar] [CrossRef]
- Mallick, M.K.; Choudhary, B.S.; Budi, G. Geological Reserve Estimation of Limestone Deposit: A Comparative Study Between ISDW and OK. Model. Meas. Control C 2020, 81, 72–77. [Google Scholar] [CrossRef]
- Armijo, R.; Lyon-Caen, H.; Papanastassiou, D. East-West Extension and Holocene Normal-Fault Scarps in the Hellenic Arc. Geology 1992, 20, 491–494. [Google Scholar] [CrossRef]
- Armijo, R.; Meyer, B.; King, G.C.P.; Rigo, A.; Papanastassiou, D. Quaternary Evolution of the Corinth Rift and Its Implications for the Late Cenozoic Evolution of the Aegean. Geophys. J. Int. 1996, 126, 11–53. [Google Scholar] [CrossRef]
- Lazos, I.; Sboras, S.; Chousianitis, K.; Kondopoulou, D.; Pikridas, C.; Bitharis, S.; Pavlides, S. Temporal Evolution of Crustal Rotation in the Aegean Region Based on Primary Geodetically-Derived Results and Palaeomagnetism. Acta Geod. Geophys. 2022, 57, 317–334. [Google Scholar] [CrossRef]
- McKenzie, D. Active Tectonics of the Mediterranean Region. Geophys. J. R. Astron. Soc. 1972, 30, 109–185. [Google Scholar] [CrossRef]
- Pichon, X.L.; Angelier, J. The Hellenic Arc and Trench System: A Key to the Neotectonic Evolution of the Eastern Mediterranean Area. Tectonophysics 1979, 60, 1–42. [Google Scholar] [CrossRef]
- Reilinger, R.; McClusky, S. Nubia-Arabia-Eurasia Plate Motions and the Dynamics of Mediterranean and Middle East Tectonics. Geophys. J. Int. 2011, 186, 971–979. [Google Scholar] [CrossRef]
- Sengor, A.M.C.; Gorur, N.; Saroglu, F. Strike-Slip Faulting and Related Basin Formation in Zones of Tectonic Escape: Turkey as a Case Study. Strike-Slip Deform. Basin Form. Sediment. 1985. [Google Scholar] [CrossRef]
- Lazos, I.; Papanikolaou, I.; Sboras, S.; Foumelis, M.; Pikridas, C. Geodetic Upper Crust Deformation Based on Primary GNSS and INSAR Data in the Strymon Basin, Northern Greece—Correlation with Active Faults. Appl. Sci. 2022, 12, 9391. [Google Scholar] [CrossRef]
- Jolivet, L.; Menant, A.; Clerc, C.; Sternai, P.; Bellahsen, N.; Leroy, S.; Pik, R.; Stab, M.; Faccenna, C.; Gorini, C. Extensional Crustal Tectonics and Crust-Mantle Coupling, a View from the Geological Record. Earth Sci. Rev. 2018, 185, 1187–1209. [Google Scholar] [CrossRef]
- Brun, J.P.; Sokoutis, D. Core Complex Segmentation in North Aegean, A Dynamic View. Tectonics 2018, 37, 1797–1830. [Google Scholar] [CrossRef]
- Dewey, J.F.; Şengör, A.M.C. Aegean and Surrounding Regions: Complex Multiplate and Continuum Tectonics in a Convergent Zone. Bull. Geol. Soc. Am. 1979, 90, 84–92. [Google Scholar] [CrossRef]
- Mercier, J.L.; Sorel, D.; Vergely, P.; Simeakis, K. Extensional Tectonic Regimes in the Aegean Basins during the Cenozoic. Basin Res. 1989, 2, 49–71. [Google Scholar] [CrossRef]
- Robertson, A.H.F. Palaeozoic-Early Mesozoic Transition from Palaeotethys to Neotethys: Synthesis of Data and Interpretations from the Northern Periphery of Gondwana (Central and Western Anatolia, Aegean, Balkans and Sicily). Earth Sci. Rev. 2022, 230, 104000. [Google Scholar]
- Robertson, A.H.F.; Dixon, J.E. Introduction: Aspects of the Geological Evolution of the Eastern Mediterranean. Geol. Soc. Publ. 1984, 17, 1–74. [Google Scholar] [CrossRef]
- Ring, U.; Pantazides, H. The Uplift of the Troodos Massif, Cyprus. Tectonics 2019, 38, 3124–3139. [Google Scholar] [CrossRef]
- Hutchinson, R.W.; Searle, D.L. Stratabound Pyrite Deposits in Cyprus and Relations to Other Sulphide Ore. Soc. Min. Geol. Jpn. 1971, 70, 198–205. [Google Scholar]
- Randolph, A. Theory of Particulate Processes: Analysis and Techniques of Continuous Crystallization; Elsevier Science: Amsterdam, The Netherlands, 2012. [Google Scholar]
- Gibson, H.L.; Franklin, J.M.; Gibson, H.L.; Jonasson, I.R.; Galley, A.G. Volcanogenic Massive Sulfide Deposits. In Economic Geology 100th Anniversary Volume; Society of Economic Geologists: Littleton, CO, USA, 2005. [Google Scholar]
- Isaaks, E.H.; Srivastava, M.R. Applied Geostatistics; Oxford University Press: New York, NY, USA, 1989. [Google Scholar]
- Exadaktylos, G.; Manutsoglu, E.; Saratsis, G.; Spyridonos, E.; Mastoris, J. An Integrated Geological-Geostatistical Approach: Modeling of the Spatial Distribution of CaO/MgO Oxides in Kamari Limestone Quarry (Greece) for the Purpose of Defining the Optimum Exploration and Exploitation Strategies. In Proceedings of the 1st International Conference Advances in Mineral Resources Management and Environmental Geotechnology, Chania, Greece, 7–9 June 2004. [Google Scholar]
- Hristopoulos, D.T. Random Fields for Spatial Data Modeling; Springer: Amsterdam, The Netherlands, 2020. [Google Scholar]
- Cressie, N.A.C. Statistics for Spatial Data; John Wiley & Sons: New York, NY, USA, 1993. [Google Scholar]
- Houston, A.N.; Otten, W.; Baveye, P.C.; Hapca, S. Adaptive-Window Indicator Kriging: A Thresholding Method for Computed Tomography Images of Porous Media. Comput. Geosci. 2013, 54, 239–248. [Google Scholar] [CrossRef]
- Exadaktylos, G.; Stavropoulou, M.; Xiroudakis, G.; de Broissia, M.; Schwarz, H. A Spatial Estimation Model for Continuous Rock Mass Characterization from the Specific Energy of a TBM. Rock Mech. Rock Eng. 2008, 41, 797–834. [Google Scholar] [CrossRef]
- Stavropoulou, M.; Exadaktylos, G.; Saratsis, G. A Combined Three-Dimensional Geological-Geostatistical-Numerical Model of Underground Excavations in Rock. Rock Mech. Rock Eng. 2007, 40, 213–243. [Google Scholar] [CrossRef]
Disclaimer/Publisher’s Note: The statements, opinions and data contained in all publications are solely those of the individual author(s) and contributor(s) and not of MDPI and/or the editor(s). MDPI and/or the editor(s) disclaim responsibility for any injury to people or property resulting from any ideas, methods, instructions or products referred to in the content. |
© 2023 by the authors. Licensee MDPI, Basel, Switzerland. This article is an open access article distributed under the terms and conditions of the Creative Commons Attribution (CC BY) license (https://creativecommons.org/licenses/by/4.0/).