Abstract
TRIM4Post-Mining is a H2020/RFCS-funded project that brings together a consortium of European experts from industry and academia to develop an integrated information modelling system. This is designed to support decision making and planning during the transition from coal exploitation to a revitalized post-mining landscape, enabling infrastructure development for agricultural and industrial utilization, and contributing to the recovery of energy and materials from coal mining dumps. The smart system will be founded upon a high-resolution spatiotemporal database, utilizing state-of-the-art multi-scale and multi-sensor monitoring technologies that characterize dynamic processes in coal waste dumps related to timely, dependent deformation and geochemical processes. It will integrate efficient methods for operational and post-mining monitoring, comprehensive spatiotemporal data analytics, feature extraction, and predictive modelling; this will allow for the identification of potential contamination areas and the forecasting of geotechnical risks and ground conditions. For the interactive exploration of alternative land-use planning scenarios—in terms of residual risks, technical feasibility, environmental and social impact, and affordability—up-to-date data and models will be embedded in an interactive planning system based on Virtual Reality and Augmented Reality technology, forming a TRIM—a Transition Information Modelling System. This contribution presents the conceptual approach and main constituents, and describes the state-of-the-art and detailed anticipated methodological approach for each of the constituents. This is supported by the presentation of the first results and a discussion of future work. An anticipated second contribution will focus on the main findings, technology readiness and a discussion of future work.
1. Introduction
Socially and environmentally responsible management during the operational implementation, remediation and post-mining phase is the foremost task of any mining enterprise. Responsible mining aims to foster opportunities for after-mine land and resource use for future generations. Specifically, there is a responsibility to minimize disturbance, create stable non-polluting landforms, undertake progressive rehabilitation where practicable, and at closure, enable subsequent land use that benefits local and regional communities. The concepts of planned closure and sequential land use are not unique to mining, but are relatively recent developments and are assuming greater significance [,].
Member states of the European Union are pursuing strategies for the de-carbonization of industry and, specifically, of electric power generation. The majority of currently operating coal mines in Europe will transfer to the closing phase during the next two decades (e.g., []). The structural transformation of a region from an industrial mining area to an attractive landscape, allowing for future economic development and the creation of employment opportunities, is challenging. A crucial aspect is a good understanding of the risks and opportunities of the post-mining landscape, ensuring open communication and engaging all stakeholders to explore fruitful options for future land use. This particularly applies to the integration of local communities into decision-making processes.
TRIM4Post-Mining is a project funded by the Research Fund for Coal and Steel (RFCS) of the European Framework Programme H2020, which started in 2020 and focuses on the main legacies of coal mining, namely waste dumps. It aims to provide an interactive geo-portal-like information platform; this will enable a transparent and optimal transition and post-mining land use planning for coal mining operations in Europe, which is particularly applicable to lignite. Results are expected to also be transferable to hard coal.
Challenges in lignite waste dumps: The large-scale exploitation of lignite in open pit mines started in the early 20th century and has created thousands of square kilometers of rehabilitated landscapes across Europe, including external and in-pit waste-dump areas, as well as residual lakes. Due to the heterogeneous nature of waste dump-material composition, these areas are ranked as risky construction ground, e.g., for necessary logistic infrastructure to foster former coal regions’ economic growth. Currently, operating mines will still devastate a significant extent of land area until closure. On the other hand, remarkable achievements have been accomplished in the rehabilitation of these landscapes during the last decades. Impressive examples are the new lake landscapes in central Germany with 140 lakes, and the Lusatian lignite area with 39 end lakes, which are used today as recreation areas []. Despite this progress, there are still residual environmental and safety risks associated with post-mining landscapes in lignite, mainly due to geotechnical instability and contamination. Examples, such as the following can have detrimental effects on newly built infrastructure and land use:
- The unpredicted and fatal slope failure in Nachterstedt, Germany [],
- Currently ongoing ground movements due to groundwater management [],
- Long-term settlements inside waste dumps [,,]
- Settlement due to saturation [,,] and
- Liquefaction [,,].
They illustrate that there is still a significant degree of uncertainty with respect to risk analysis; hence, vast amounts of research are still necessary. In addition to the geotechnical aspect, there is potential for acidification in lignite waste dumps. Overburden layers containing pyrite cause problems such as groundwater acidification and the discharge of sulfate, iron, and trace metals []. This potential, especially in exposed material being placed on the dumping site, will influence geochemistry, groundwater contamination, and eventually, the environment.
Future Requirements: For creating low-risk, stable, and non-polluting post-mining landforms, it is necessary to improve our understanding of related time-dependent deformation and contamination processes in a geo-mechanically and geochemically very heterogeneous dump body. If this understanding can be further substantiated and related to decisions made prior to operation and rehabilitation, in terms of material management and mitigating measures, proactive actions can already be taken during operation to create improved opportunities for future generations; these include agricultural, industrial, recreational, and residential uses and their related infrastructure. While the aim of an improved understanding of the dynamics in waste dumps has not changed, the availability, quantity, and quality of monitoring data has significantly changed over the past decade, now allowing for analysis and modelling to occur in a much more detailed sense.
New Technology—Geo-Data-Science: Modern Geo-Data-Science consists of technology that supports monitoring, sensors, geo-data management, modeling, visualization (Virtual Reality/Augmented Reality (VR/AR)) and decision making, which offers new solutions for the challenge introduced.
Spatially and temporally, very dense data and information for both the geotechnical and geochemical attributes of coal waste dumps are available and can be effectively used. Examples include active and passive satellite sensors [,]; airborne and terrestrial LIDAR (data for areal information) [,]; geochemical and mineralogical point sensor data including Infrared (IR) spectroscopy [,]; classical surveying data; and self-sufficient deformation sensors for local information. Many operations already continuously scan the dump during construction using laser-scanning technology []. Additionally, recent research and technical developments have resulted in process simulators and material-tracking systems that allow the creation of a digital spatial dump model, capturing the spatial location of the material being placed inside the dump body at the time of dumping []. This enables the classification and location of dump areas with particular material characteristics and related heterogeneity as one major impact factor for time-related geodynamical processes. Last, but not least, data from standard hydrological and geotechnical monitoring and modeling, such as the monitoring of wells or Cone Penetrating Test (CPT) measurements, within the waste dumps provides related information. As a consequence, for improved and scientifically sound post-mine-use planning, the following questions can be addressed:
- How can modern and newly available multi-scale and multi-sensor monitoring technology be best utilized to characterize the geotechnical and geochemical behavior inside the heterogeneous waste-dump body, at an appropriate spatial and temporal resolution? (Post-mining monitoring)
- How can these monitoring data be translated into a better understanding, to model and predict these time-related processes on a suitable spatial and temporal scale? (Data-driven predictive modelling)
- Which operational and rehabilitation-activity-related factors influence these processes, how are these related to each other, and how can this knowledge be used for improved revitalization planning? (Revitalization planning)
- How can the relevant data, information, and models/knowledge available today, and those and being created over the complete time horizon, be conserved and made available to all stakeholders? (Stakeholder engagement)
TRIM4Post-Mining investigates possible solutions to these questions. Building on the aforementioned modern multi-scale and multi-sensor monitoring techniques and the available material stream and hydrological process models, TRIM4Post-Mining aims to make the best use of these data. Similar to state-of-the-art Building Information Modelling (BIM) systems [], an innovative integrated information and modeling system will be developed. The results aim to lead to a research and delivery foundation for revitalization stakeholders; this would allow communication and optimal decision making across all disciplines and stakeholders, to make the best use of post-mining landscapes.
This contribution first presents the conceptual approach of TRIM4Post-Mining, introducing the key constituents of the approach. Next, the state-of-the-art and anticipated progress are detailed for the key constituents of the project, in particular, for:
- Monitoring techniques for mining waste material characterization,
- Data analysis and data-driven prediction tools for dynamic geotechnical- and geochemical-related aspects,
- New sonic-based technologies for data gathering in waste dumps,
- Stakeholder engagement and rehabilitation planning, and
- Information system and visualization.
In a second contribution planned for 2023, the main finings, the achieved technology readiness and suggestions for future work will be presented.
2. Conceptual Approach of TRIM4Post-Mining
Figure 1 shows the overall approach of TRIM4Post-Mining and its key constituents. The central part of the information system is a waste-dump model of the post-mining landscape. This will include all data relevant to the different purposes of future planning and land utilization. A grid model represents the spatial distribution of properties within the dump. The model captures different geotechnical and geochemical material parameters. Geochemical components will be related to environmental and economic aspects, and include the relevant chemical compositions of the material represented by the grid nodes. With this information captured in the form of a library, analysis with respect to particular elements of interest will be possible, at later stages as well. The geotechnical components will be the water content, the shear parameters, the fracture and shear strength of the materials, grain-size distributions, rounding coefficients, etc. Particular data, which are not yet available, will be captured using newly tested sensing methods and entered via different applications. Some parameters are planned to be dynamically updated to reflect time-dependent settlement processes or water interaction with relevant minerals. The aim of data management and visualization is to develop a targeted solution to address the needs and expectations of different target groups, such as planning experts, authorities and landowners, or the general public.
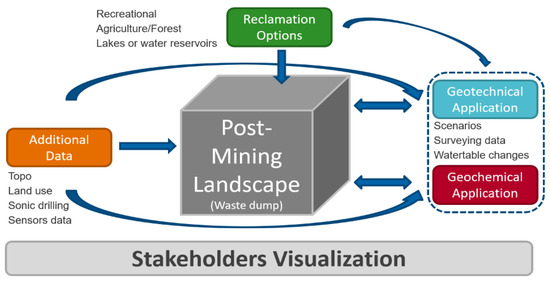
Figure 1.
Overall TRIM4Post-Mining approach.
Main Constituents: The constituent ‘Reclamation Options’ will serve as an interface to the decision-making process. Here the interaction between the previously described model, planning, and re-cultivation options will be handled. Possible reclamation options include recreational areas, such as beach areas or camping sites, agricultural or forestry areas for the dump areas and lakes, or water areas for the remaining residual openings or any constructions related to renewable energy. To quickly evaluate the feasibility, opportunities, and risks related to the planned options, this module will provide the interface to the planner. An evaluation of possible scenarios is achieved by querying the model and computing the relevant Key Performance Indicators (KPIs). The importance of this module is that politically, it is not clear yet; when it is, open pit operation will terminate. Thus, reclamation options have to be quickly evaluated based on the final cubage (waste-dump geometry) considering, for example, different levels of the water table of an end lake.
The constituent ‘Additional Data’ will allow the incorporation of information provided by later investigations, which are used to validate the model. These include, first and foremost, sensor data from post-mining monitoring (i.e., geochemistry and mineralogy sensors); however, they also include additional data such as results from sonic drilling, and current topography, water table, pH-Values, settlement measurements, or the locations of former villages.
The two engines to be developed, ‘Geotechnical Application’ and ‘Geochemical Application’, will exploit the full information content of the most current data and history captured. The results will be predictions of key impacting indicators, such as settlement, risk of liquefaction, predicted acidification potential, element concentrations, etc. This will be achieved by analyzing additional data on the water table within the dump, as the groundwater rising again will influence both the water level and the water chemistry. Furthermore, the measured data from geodetic monitoring, and different scenarios related to the cessation of the mine and its operational capacity, will be analyzed until then. Newly evaluated information on the state of the parameters within the dump will be fed back to the dump model so that it is dynamically updated. The geochemical app will also be able to display results of the spectral analysis related to queries about certain element abundances.
The last module, ‘Stakeholder Visualization’, aims to provide interpreted information to different stakeholders. This will include full access to the model for planners and reclamation executers, to a web-GIS (Geographic Information System) interface for authorities, and to a VR/AR interface for communities and others. The key aspect is that information provided to stakeholders should be pre-interpreted at a level that is appropriate to the technical background of the stakeholders and their involvement in the decision process.
The aim is to progress innovation in these areas from a current Technology Readiness Level (TRL) of 4/5, which is technology tested in the laboratory or in a relevant environment to TRL6, which is technology tested and validated in an industrial environment. To achieve this, the key constituents of TRIM4Post-Mining will be integrated and demonstrated in an application scenario around a large lignite waste-dump in central Germany.
3. Monitoring for Mining Waste Characterization
This part of TRIM4Post-Mining is dedicated to defining an integrated multi-scale and multi-sensor approach to characterizing and monitoring the spatiotemporal geochemical behavior of coal waste dumps. The aim is to develop a tool that detects pollutants such as acid-generating minerals (i.e., sulfides) and toxic heavy metals (e.g., As, Pb, Hg), and elements that may be exploited during waste-dump re-handling, such as rare earth elements (REE). Therefore, TRIM4Post-Mining uses a combination of space-borne and ground-based sensor technologies to detect the relevant geochemical and mineralogical attributes at different stages of the mining process. These technologies include Laser-Induced Breakdown Spectroscopy (LIBS) for geochemical data, Infrared Spectroscopy (IR) for point mineralogical characterization—both deployed as core and conveyor-belt scanners—and satellite images for remote and continuous surveying. The information retrieved from these sources will be integrated using machine learning techniques to upscale the usability of the data.
3.1. Sensor Technologies
Laser-Induced Breakdown Spectroscopy: LIBS is a sensing technique used to determine the chemical composition of a material. It is based on the measurement of light emissions from plasma generated on a material’s surface using a high-energy pulsed laser []. LIBS measurements can be performed within tens of microseconds and at rates of hundreds of measurements per second, which means that real-time sensor output is possible. The spot size of a measurement is generally <1 mm, and multiple LIBS measurements are needed to characterize heterogeneous materials, such as rocks and soils, properly. LIBS instruments currently available on the market mainly include benchtop and hand-held analyzers. However, LIBS has also been applied to specific applications in mining, such as conveyor-belt scanning [] and drill-core scanning [].
Infrared Spectroscopy: Infrared spectroscopy is a sensing technique for determining the mineralogical composition of rocks. The basis for mineral identification is the detection of their functional groups, as is the case of, for example, clay minerals (OH), carbonate minerals (CO3), and silicates (SiO4) []. The recent technological advances and the growing demand for IR spectroscopy have increased the affordability of IR instruments. Technological improvements are especially moving towards analyzing the sample “as is”, minimizing or avoiding any sample preparation and shortening the time required to record the spectra []. The enhanced sensitivity of modern spectrometers and the versatility of their sampling capabilities have facilitated the development of laboratory and field instruments, making it possible to link these environments []. As a consequence, IR is becoming established in the mining industry in applications such as mining monitoring [,], ore sorting [], and the characterization of slurries [].
Satellite-based Radar Interferometry—The remote sensing images used in the TRIM4Post-Mining project correspond to the Sentinel Mission of the Copernicus Earth Observation Program (ESA2021). The ground movements can be detected using Interferometric Synthetic Aperture Radar (InSAR) Sentinel-1 data. The Sentinel-1 mission comprises a constellation of two polar-orbiting satellites, performing C-band synthetic aperture radar imaging, enabling them to acquire imagery regardless of the weather. It works in a pre-programmed operation mode to avoid conflicts, and produces a consistent long-term data archive built for applications based on long time-series. Satellite-based radar interferometry provides extensive information on ground movements at short regular intervals (approximately 6 days). By evaluating several scenes, high-precision relative changes in height can be detected for clearly identifiable backscatters using the PSI (Persistent Scatterer Interferometry) method []. An evaluation of two satellite orbits allows the resolution of horizontal and vertical components of the movements. The application of this method in rural areas is only possible to a limited extent due to the types of use and the associated lack of backscatter. A comparatively new evaluation approach is the SqueeSAR method []. This extends the analysis of interferometric data stacks, to extract parameters not only from point-wise deterministic backscatters, but also from distributed scatterers. The application in non-urban environments, such as regions with rural land use, is therefore more likely. Due to the high interpretative component in the evaluation of satellite-based radar interferometry, combined with low verifiability, pure satellite-based monitoring is still viewed with skepticism in the professional world. Solutions can represent terrestrial reference stations in the form of corner reflectors, which are to be connected to terrestrial height measurements, e.g., leveling networks.
3.2. Conceptual Approach
In order to ascertain the most optimum combination of sensing technologies that can identify the key geological attributes of the selected case, a feasibility assessment was conducted. A later stage in the project involves the development of methodological approaches that combine data analysis, feature extraction, and modeling for each sensor technology separately. The main outcome of this part of the project will be an integrated multi-sensor approach based on data fusion algorithms for the LIBS and ground-based IR techniques.
A possible link between the ground-based data and satellite images might enable the remote characterization of the coal waste-dump sites. In this way, regularly acquired satellite data and information will be calibrated based on a learning rule defined for the correlation between the satellite images and ground-based data. This will enable the time-series satellite images to be used to understand and monitor the spatiotemporal behavior of the mine waste-dump sites online.
3.3. Feasibility of Using the Selected Sensor Technologies
For the feasibility study, the Tagebau Vereinigtes Schleenhain (United Schleenhain Opencast Mine, Neukieritzsch, Germany), which combines the Schleenhain and Peres mining fields near Leipzig (Germany) was selected. The aim of this study was to assess the suitability of using the selected sensor technologies for monitoring the waste dumps (this section) as well as the hydro-geochemistry methods for acid mine drainage (Section 5.2). A first exploratory characterization was performed on undisturbed material with known provenance in the coal deposit. The tests were performed on 36 samples of different lithological units, collected from the Peres and Schleenhain mining fields. Most of these samples consisted of several kilograms of unconsolidated material collected from the mining faces. Some consolidated drill-core samples were also included. The Schleenhain and Peres minefields can be roughly split into four lithological groups: coal, clay, sand, and silt.
Laser-Induced Breakdown Spectroscopy: The feasibility of using LIBS for material characterization in industrial applications strongly depends on the form and composition of the material, the concentration range of the elements of interest, and the process stream into which the sensor needs to be integrated. Because of this, feasibility testing is recommended to ensure that a LIBS sensor can be successfully implemented into a specific industrial process.
Laboratory testing was performed to investigate whether a LIBS sensor can be used to detect potentially toxic and acid-generating components within mining waste, as well as REE.
LIBS data were acquired (Spectral Industries, Delft, the Nethderlands) while moving the samples on a rotating stage to expose the sensor to a different part of the sample surface for each individual measurement. Around 2000 LIBS measurements were performed on each sample in order to capture some of the compositional variability that is expected to occur at a measurement spot size of around 100 µm. The LIBS setup consisted of a 20 Hz laser providing 120 mJ pulse energy at 4–7 ns pulse durations. Atomic emissions were recorded with an echelle-type spectrometer covering a wavelength range of 180–1200 nm.
Table 1 presents an overview of all the elements detected in the LIBS data acquired on the waste samples. Apart from the common rock-forming elements, potentially toxic heavy metals such as lead, manganese, chromium, and nickel were also detected. Furthermore, sulfur was identified, which could indicate acid-generating sulfides. Additionally, the detection of yttrium—a REE—was shown to be possible. This confirms that a LIBS analyzer can provide relevant information on the composition of mining waste materials and serve as an input for the information modeling system developed within the TRIM4Post-Mining project.

Table 1.
List of elements detected in the LIBS data of mining waste samples. Elements marked with an * could also originate from the measurement of the air surrounding the sample.
Infrared Spectroscopy: In order to assess the feasibility of using infrared sensors for the characterization of coal mine waste samples, a hand-held Fourier Transform Infrared (FTIR) spectrometer (Nicolet, TU Delft, Delft, the Netherlands) with Attenuated Total Reflectance (ATR) geometry [] was used. This small study aimed to determine the capability of the technique to differentiate the mineral phases present in the coal mine waste.
Based on legacy data, the Schleenhain and Peres mine fields can be roughly separated into four lithologies: coal, claystone, sandstone, and siltstone. The expected dominant minerals in these lithologies are lignite coal, quartz in the sand fraction, and kaolinite and muscovite in the clay and silt fractions. Using spectral libraries [] it was possible to determine the spectral bands and wavelengths of the minerals in the provided suite of samples. Every lithology was identified using the spectral features of their minerals and mineral mixtures (Figure 2).
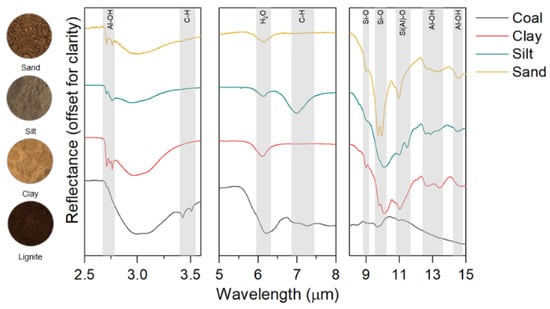
Figure 2.
ATR spectra of the most common lithologies in the sample suite: lignite coal (only coal features), clay (dominant features of kaolinite), silt (combination of features of clay minerals and quartz), sand (dominant quartz features combined with clay minerals).
These preliminary results confirm that infrared spectroscopy is a valuable tool for the mineralogical characterization of coal mine wastes. Furthermore, its potential integration with the LIBS technology can provide a comprehensive overview of the geochemical behavior of the mine waste material, becoming an integral part of the monitoring system of the TRIM4Post-Mining project.
Satellite-based Radar Interferometry: For the spatiotemporal monitoring of ground movements on top of a lignite waste dump, data from two satellite-based radar-sensors—Sentinel 1 and TerraSAR-X—were evaluated. The sensors are characterized by a spatial resolution of 20 m for Sentinel 1, and 1 to 30 m for TerraSAR-X. The PSI method requires typically good backscatters (i.e., strong reflections of the emitted waves from the surface). Due to the morphology of the lignite waste dump, this situation is not necessarily given at a low spatial resolution.
For the Sentinel 1 sensor, only a few backscatters with an acceptable coherence were identified. These corresponded to artificial objects such as the masts of a power line. Spatial coverage was not achieved.
Unlike the Sentinel 1 Sensor, the TerraSAR-X data resulted in good spatial coverage across the study area with approximately 57 back-scatterers per ha. Additionally, the precision of data was independently checked and was evaluated with a movement rate of approximately ±2 mm/a. An example of a resulting time series is provided in Figure 3.
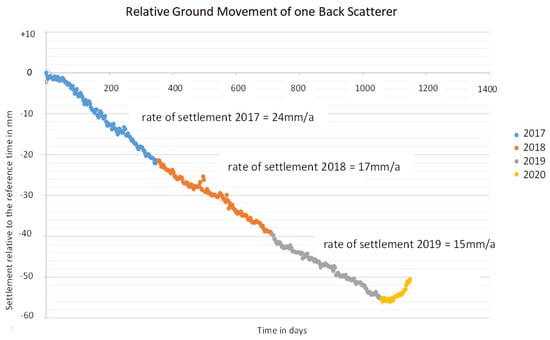
Figure 3.
Example of a time series characterizing ground movements on a waste dump from radar data.
With the achieved spatial density of ground movement data and the corresponding high precision, a detailed analysis of the ground movements of the dump surface will be possible, as discussed in Section 4.
3.4. Expected Results
Based on initial feasibility testing, a LIBS sensor can be used to provide relevant data to the information modeling system that is developed within the TRIM4Post-Mining project. This data includes information on the occurrence of potentially toxic and acid-generating components, as well as rare earth elements that it may be economic to extract during waste-dump re-handling. However, hardware modifications are still required to develop a more ruggedized LIBS analyzer that complies with TRL6, tested and validated in an industrial environment. These modifications are targeted at drill-core and conveyor-belt scanning applications. It is expected that the results obtained during the initial feasibility tests can at least be reproduced with a LIBS sensor system that is able to withstand the conditions associated with industrial environments.
Modern data analytics will make it possible to integrate the geochemical data provided by the LIBS technology with mineralogical data retrieved using IR spectroscopy. The information retrieved by combining these techniques can also be implemented into a multi-scale approach using drill-core and remotely sensed images. All this data will be used to develop relationships between observed features, waste material types, and hydrological conditions.
Additionally, TRIM4Post-Mining will generate time-series data for surface deformation using satellite-based radar interferometry data, where the changes in settlement and compaction can be identified.
4. Geotechnical Application
4.1. Geotechnical or Dynamic Processes within a Waste Dump
When creating a safe and sustainable post mining environment, the primary goal is to avoid deformations at the top of the surface, as well as unstable situations, as far as possible. The main processes causing deformation and stability problems are slumping, settling, and liquefaction.
Slumping: Slumping is a consequence of the change in groundwater level within the dump, which is controlled by operational requirements. The dumping material has a defined water content when it is spread. This water content provides capillary forces between the grains through the formation of liquid bridges, and thus, forms an apparent cohesion. When groundwater rises, these liquid bridges, and thus, the capillary tension are dissolved, and the apparent cohesion is lost. If the material is subjected to a shear stress that exceeds the frictional resistance of the grain framework, the framework may collapse, and surface deformation will occur. This damage mechanism is referred to as slumping. The effective stress in the grain structure can be additionally reduced by any flow forces and buoyancy effects of the grains [].
Settlements: Settlements are all the ground movements in a dump that do not occur during groundwater rise. Immediately after completion of the dumping process, the intrinsic settlements begin. Depending on the material in the dump body, it can take up to several years for these primary settlements to subside. Due to the large pore space and the instability within the dump massif, the prevailing stress state is changed when an initial is applied, e.g., by the input of shear stresses. This results in grain rearrangements and deformations, which become visible as settlements on the surface of the dump. The interaction of several such processes at different times, and at different depth ranges, is considered to be the main cause of intrinsic settlements. According to Förster [], the main cause of the impacting initial is the infiltration of precipitation water. Due to the great inhomogeneity and the associated water pathways in the form of channels and pipe systems, the precipitation water penetrates not only into the near-surface areas, but also into deeper layers. After the primary settlements have subsided, secondary settlements may occur. These are also referred to as load settlements or settlements due to dynamic influences. The time at which the load is applied is decisive. Within the first five years after intrinsic settlement has subsided, the secondary settlement will be approx. 0.2 to 0.5 times the primary settlement. After a lying period of 20–30 years, the settlement amounts can assume 0.5–1.0 times the primary settlement [].
Liquefaction: The term liquefaction refers to a mechanism in which a sandy soil suddenly loses its shear strength and behaves like a liquid. The structure of the water-saturated sand collapses and the pore water pressure temporarily increases []. The following boundary conditions are required for such behavior: water-saturated soil, loose density (porosity n > 40%), effective grain size d10 ≈ 0.1 mm, coefficient of uniformity Cu < 5, low adhesion between the grains, low cohesive bonding, poor drainage related to pore water and air, and round grain shape.
4.2. Prediction Methods
General prediction methods for slumping, settlement, or liquefaction behavior can be classified using empirical, analytical, and numerical approaches.
Empirical methods are understood to be laboratory or field tests in which the condition in the field is simulated as best as possible, or in situ tests in the field in which the assumed loading condition is simulated. Based on the results, some statistical relation is modelled. For example, Diener [], compiled a detailed list of laboratory tests in her 1996 dissertation to simulate the slumping behavior of open pit dumps. She was able to derive the above-mentioned preconditions that a soil must exhibit in order to be capable of slumping. In a further work, she [] also used oedometer tests to map the slumping behavior of water-saturated soils. Vogt et al. [] used oedometer tests in 2014 to verify their numerical calculations. Hamdan [] dealt with different field measurement techniques in 1996. For this purpose, an area was test-loaded in the field and the deformation of the soil was measured using a horizontal inclinometer, a rod extensometer, a magnetic settlement level, and geodetic measurements [].
In analytical soil mechanics, calculation methods are used to evaluate the stability according to a safety concept. The basis of most procedures is the Mohr–Coulomb fracture criterion (Equation (1)), which outputs the shear strength τf via a linear function of the shear parameters φ’ and c’ and via the effective stress σ’.
Weißbach [] describes the analytical stability calculation in waste dumps using the Fellenius rule according to the lamella method of Krey/Bishop. The analytical calculation can be performed without much computational effort, in which the body under consideration is divided into lamellae, and an equilibrium condition is set up for each lamella.
For the numerical considerations, little detailed literature is available because until now, hardly anyone has considered slumping and subsidence on open pit dumps numerically. The author of [] gives a short introduction of the general numerical calculation, but attributes this more to liquefaction. The authors of [] also dealt with numerical parameters, but derived their results from empirical tests.
A numerical calculation is performed using the finite element method (FEM), e.g., []. In this method, a continuum is decomposed into infinitesimally small regions and the equilibrium condition is determined for each region according to the Fellenius rule with the aid of a φ-c-reduction. This is achieved using a numerical calculation program, e.g., Plaxis []. The advantage of a numerical calculation is that the governing damage mechanism is found during the calculation itself and does not have to be determined in advance, as is the case with the analytical method. In this way, more complex geometric conditions can be calculated [].
4.3. Conceptual Approach within TRIM4Post-Mining
The data situation in today’s mining operations is far better than a decade ago. This is the main difference with the majority of documents in literature. TRIM4Post-Mining aims to unlock this data potential for the improved prediction of geotechnical processes within waste-dump sites. Figure 4 summarizes the overall approach.
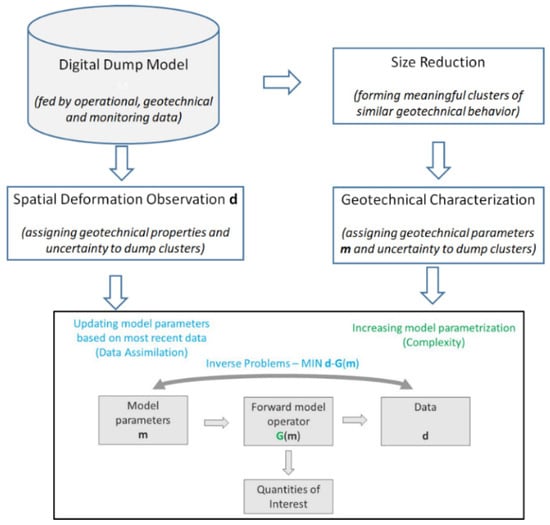
Figure 4.
Approach for geotechnical analysis and prediction of waste-dump behavior.
Next, these single steps will be further outlined:
- The digital dump model forms the basis, as it contains the spatial distribution of material characteristics and additional information from ground-movement monitoring.
- The effective use of the digital dump model requires a size reduction. A cluster algorithm will be developed that forms larger areas with similar geotechnical properties.
- Data from spatiotemporal dense ground deformation monitoring will be used for the characterization of ground deformations.
- Based on geotechnical principles, a forward operator will be developed to predict ground deformations based on geotechnical parameters from the clusters.
- A data assimilation approach will be developed and demonstrated that continuously updates model parameters based on the most current data
- The continuously updated model can then be used for risk assessment.
4.4. Waste-Dump Model and Clustering
The basis of geotechnical analysis is formed using a digital dump model. This is created through the interaction of various components, including the geological model of the excavation site, a material-tracking system that translates the position of material from the excavation site to the dump site, and real-time measurements on mining and dumping devices using laser scanning. Figure 5 shows the scheme for generating the dump-site model.
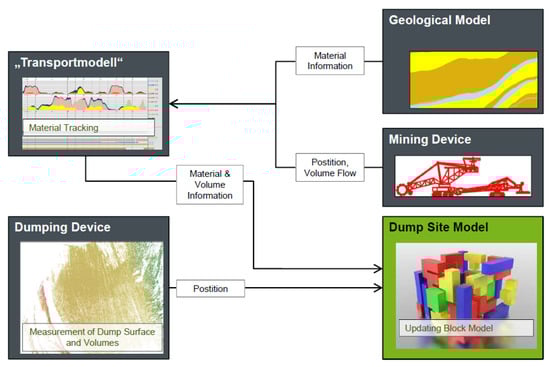
Figure 5.
Scheme for the generation of the dump-site model (reproduced from []).
The model contains information about the material composition within individual voxels/blocks with a size of 125 m3 (5 m × 5 m × 5 m) within the dump, and consists of about 830.000 voxels in total. The following attributes are linked to the voxels: the geometry (x, y, z) in local coordinates, the date and time of material interstratification into the dump, and attributes for 29 material classes corresponding to different geological units. Units typically contain different types of gravel, sand, silt, or clay.
To combine the individual voxels with geotechnically meaningful homogeneous areas, a clustering approach was applied. Based on the available attributes in the initial model, it is expected that a clustering approach should recognize groups or clusters of identical material mixtures in the dump model. For this application, the relatively simple k-means approach has been proven to be efficient []. For the optimal number of clusters, the elbow method, the silhouette score, and the Davies–Bouldin Index [] were investigated. All the criteria delivered the same result, namely that the choice of k = 7 clusters for the initial input model is optimal. Figure 6 shows an exemplary horizontal section through the clustered model (Scale approximately 2.5 by 2.5 km), and Table 2 provides the size of the individual clusters based on the total volume.
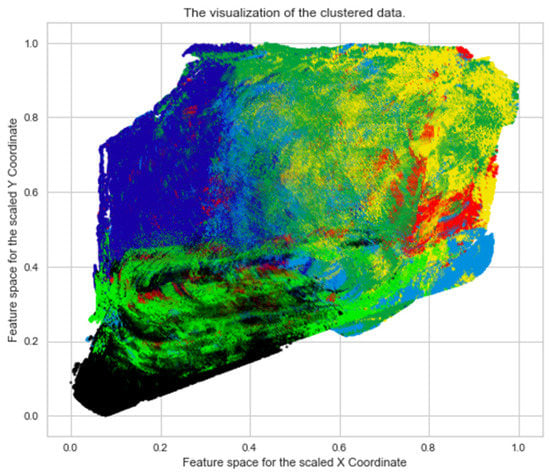
Figure 6.
Horizontal section through the clustered dump model (Cluster 0: black, Cluster 1: violet, Cluster 2: blue, Cluster 3: dark green, Cluster 4: light green, Cluster 5: yellow, Cluster 6: red).
Table 2.
Size of the individual clusters from k-means clustering.
4.5. Analysis of Geotechnical Parameters Related to Liquefaction and Settlement
In addition to the dump model, the geotechnical database consists of the results of soil mechanical testing for the different geologic units. The parameters include the break shear parameters ϕ’ and c’, coefficient of permeability kf-value, plastic and liquid limits (wL and wP), coefficient of uniformity U, curvature coefficient C, number of pores e, porosity n, density in the normal state ρ, grain density ρs, dry density ρd, density of water saturation ρr, buoyancy ρa, and others. In total, a database with about 1400 samples is available.
Processing of the data: A statistical evaluation of the samples resulted in a grain-size distribution of every soil class in every stratigraphic layer. Figure 7 shows an example of a light plastic clay (TL according to DIN 18196) of the stratigraphic layer B375, which is a banded clay or banded silt. The two lines show the minimum and maximum of the estimated grain-size distribution, i.e., the true grain-size distribution of that material is in between those two lines.
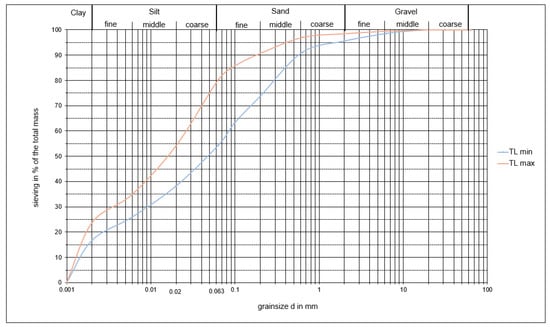
Figure 7.
Example of a grain-size distribution from the geological unit B375 (Weak plastic tone (TL).
Analysis of the data with respect to liquefaction: According to the dissertation of [] the main factor for liquefaction is the grain size of the material. There are areas in the graph of a grain-size distribution that is more susceptible to liquefaction than other areas (Figure 8).
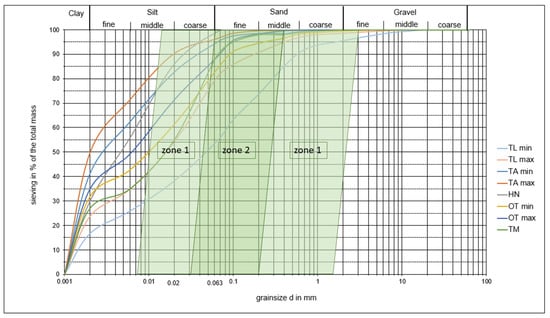
Figure 8.
Grain-size distribution of B375 reflecting the liquefaction potential (lines represent different soil groups—see Table 3).
The zones are attributed to KTA 2201.2 [] and show, where liquefaction is possible, that the potential in zone 2 is the highest. The estimation of the probability of liquefaction requires knowledge of the mass percentage of the grain-size distribution of each material. Table 3 summarizes this classification for the example of the B375 strata.
Table 3.
Mass percentage of material from B375 in zones of liquefaction potential.
According to [], KTA-only material, where the main portion is in those zones, is prone to liquefaction. For geological unit B375, this is not the case. TM is the most critical, but the percentage has to be at least 50%. The next step is to evaluate the clusters, which are combinations of mixtures of soil originating from different geological units.
4.6. Analysis of Ground Movement Data
The ground-movement-monitoring database consists of:
- Digital Terrain Models (DTM) based on airborne photogrammetric surveying on a monthly basis,
- Annual Airborne Laser Scanning (ALS) data, and
- Data from satellite-based radar interferometry, available every 6 days. The result is a database of spatially dense time series related to persistent scatterers distributed on the dump surface.
The uncertainty of elevation information in DTM and ALS data is approximately ±5 cm. In addition, the temporal resolution is substantially less compared to the satellite-based radar data. The latter are judged with an uncertainty of approximately a ±1 to 2 mm/a settlement rate. Thus, this analysis is mainly based on satellite-based radar data. Both of the other data sources are used for plausibility checks.
Figure 9 shows an example of ground movement data for a dump slice over a period of three years. The dump slice is discretized in voxels of 100 m by 100 m. This corresponds approximately to the range of a spreader in one particular set up. Each voxel contains 100 PSI data from radar data. This leads to time series (Figure 9, right) that can be analyzed with respect to ground movement rates. Particular average movement rates can, thus, be evaluated for each voxel and year. Table 4 summarizes these rates for some of the voxels shown in Figure 9.
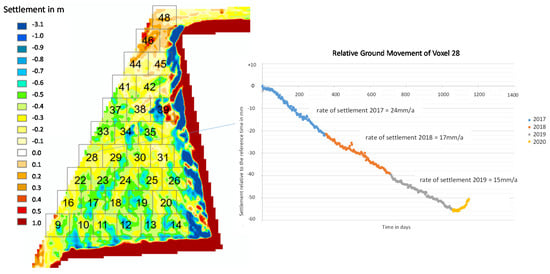
Figure 9.
Illustration of the analysis of ground movement data during the period 2017 to 2020 (© Airbus Defence and Space GmbH, Postdam, Germany). (left) spatial distribution of settlements and discretization in voxels (right) settlement rates for one partivular voxel.
Table 4.
Development of the settlement rate for blocks 28–31 from 2017 to 2020.
This table indicates the trend of the settlement rate that was explained before. Interestingly, in 2020, the movement changed its direction from settlement to rise.
4.7. Outlook
Ground movements will be analyzed for areas of the dump with different settlement times and different dumping technologies. The resulting comprehensive database will be linked to the formed clusters with its geotechnical parameters using a forward operator. Due to the uncertainty in the parameters themselves, this forward predictor will be developed using a stochastic framework. In particular, the suitability of the Monte-Carlo Simulation technique will be investigated to enable an uncertainty-based prediction of ground movements. The application of data assimilation techniques for inverse modelling (Figure 8), e.g., the Kalman filter [], will allow utilization of the comprehensive and continuously growing ground movement database to update the prediction models for settlements and liquefaction.
5. Geochemical Application
The main objective of the ‘geochemical application’ is to model potential risks of acidification and the possible adverse effects that mine wastes in lignite mines can have on the surrounding environments. The spatial compositional information of waste dumps has great importance in the study of geochemical alteration and its hydrogeological effects, as well as in the definition of the most suitable post-mining scenario. The potential for mine waste and drainage to have an adverse impact on aquatic ecosystems, on drinking-water supplies, and on human health, in principle, needs to be assessed based on mineralogy, chemical concentrations, acid generation, and the potential for metals to be leached from mine waste and soils. In this context, geochemical data from different mine constellations (major mine materials as well as those belonging to the waste dump) in combination with water conditions (ground and superficial) will be analyzed—in order to identify the main potential drivers of acidification, as well as the reaction paths that might occur in the mine dump—and feed the predictive modelling.
5.1. Acidification Potential of Mine Waste
Mining waste is quite heterogeneous compared with the waste of other industry sectors due to its quantity, mineralogical formation, and properties. It varies depending on the mineral preparation and enrichment process applied. Waste in mines is usually stored in dump sites and slurry ponds, while in some mineral sites, it is stored in the form of post-leaching ore piles. One of the most serious environmental problems that can occur in these waste sites, and if waste is superficially dumped, is the formation of acidic mine drainage, wherein iron sulfide in coal mines or sulfur in base-metal mines can be exposed to oxidation conditions []. Lottermoser [] defines acid mine drainage (AMD) as a process whereby low-pH mine water is formed from the oxidation of sulfide minerals. With the removal of ore from the ground, the exposure of sulfides to water and oxygen in the air takes place; in turn, the oxidation processes of pyrite FeS2, associated with iron, coal, and sulfur deposits, can produce an acidic environment. The sulfides exposed to these weathering conditions become chemically unstable, releasing iron, sulfate, and hydrogen (H+) ions [] (Equation (2)).
The oxidation of sulfide minerals does not only liberate H+ cations, but it also transfers metals into water and speeds up the leaching of other elements []. Relevant minerals of primary iron sulfides, apart from pyrite, include marcasite (FeS2), pyrrhotite (Fe1−xS), chalcopyrite (CuFeS2), and arsenopyrite (AsFeS) and the minerals associated with hard/brown coal deposits are: sphalerite (ZnS), galena (PbS), covellite (CuS), millerite (NiS), and pentlandite (Fe,Ni)9S8. Metal mine drainage generally overlaps with the composition of coal mine drainage, but can have more extreme values for pH, sulfate, and trace metal concentrations []. The wide range of chemical conditions associated with acid mine/rock drainage determines the solubility and, hence, the mobility of metals, trace metals, anionic metals, and metalloids []. The factors affecting AMD include the sulfur content, acidity, alkalinity, pH, distribution and mode of pyrite occurrence, and interactions between calcium carbonate and metallic elements []. The general components affecting the amount and rate of acid generation, which drives the leaching process and mobilization of metals are: (a) the type of primary sulfides present, (b) the type of buffering minerals present, (c) the mineral surface area, and (d) the available water and oxygen, and bacterial communities. The most important buffering minerals against the released H+ ions are carbonates, aluminosilicates/hydroxides and aluminosilicate buffers. The first stage of carbonate buffering plays an important role in controlling acid production (Equation (3)).
Hence, the identification of the mass ratio of geogenic carbonates and the capacity of acidification and buffering material is of vital importance, especially in coal and lignite mining. Only after the collapse of the buffer is there a decrease in the pH level and a release of iron and metal elements in the water []. Accurate compositional information on the mine waste-dump material and water is fundamental to understanding the reaction schemes associated with AMD production, and is needed for further predictive models. Either by identifying the primary sulfides prone to AMD or detecting secondary-iron sub-products afterwards, the weathering effects need to be analyzed in order to locate risk areas and provide adequate mitigation or prevention routines prior to selecting the best post-mining plan.
5.2. Conceptual Approach—Workflow
An acidification-potential risk assessment was conducted on the sample material, as described in Section 3.3. Geochemical and hydrogeological characterization had a focus on the identification of the main controlling factors of AMD (primary sulfides, buffering minerals (carbonates/silicates), mineralogy, available water, oxygen, and bacterial communities in the waste-dump material). The geochemical characterization and identification of the mineral phases at different stages of the waste-dump material was based on the available spectral analyses using FTIR and LIBS (Section 3.3) combined with infrared Hyperspectral Imaging (HSI). Further samples from the material to be disposed of in the mine dump is expected. The aim is to link the waste samples to the material source, and to target materials more prone to containing sulfides and/or heavy metals. Following these criteria, spectral data, as well as mineralogical and compositional data results, serve to identify and cluster the main mineralogical phases found in the dump site. In addition, a third batch of sample collection and a drilling campaign are planned on the tailing pond material and drainage water geochemistry, which will allow us to monitor the extent of the effect of weathering on the dump geochemistry and will contribute to the identification of AMD potential risk areas in a demonstration scenario. Both the acid-generating processes and the occurrence of potential buffering minerals need to be involved in the model database. Water data from different groundwater records and superficial drainage in the dump will be the basis for input and output data, to estimate the potential of sulfide oxidation.
5.3. Exploratory Data analysis and Expected Results
Waste-dump material: The spectral reflectance of the main materials from the Schleenhain dumps was measured using two hyperspectral sensors (FX10 and FX17 from the manufacturer Specim, Spectral Imaging Ltd., Oulu, Finland) in a wavelength range from 400 to 1700 nm (Figure 10); this is primarily affected by compositional variations due to clay minerals and organic matter. Some distinct bands are evident: the 1400 nm hydroxide (OH-bearing hydroxyls, i.e., kaolin, chlorite, mica, and amphibole) band and the bands near 1700 nm caused by organics. The reflectance spectra of materials with high organic carbon content show a rather concave curve shape in the Visible/Near IR (VNIR) range, which is due to electronic transitions in the complex organic molecules []. One of the distinct absorption features in the short-wavelength IR (SWIR) range, which is caused by vibrational processes involving bonds between C, H, and O, can be seen from 1650 to 1750 nm in the spectrum of the lignite coal sample (Figure 10).
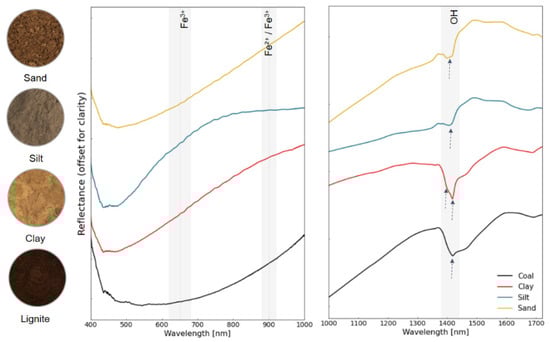
Figure 10.
Spectral curves for the main lithological classes in Schleenhain and Peres mining fields, indicating prominent absorption features of each.
Another two regions of interest in the VNIR region are those corresponding to the Fe abortions (gray-shaded areas in Figure 10). Most of the secondary iron-minerals and minerals have distinctive absorption features in the VNIR, including the charge transfer (ligand-to-metal charge transfer) transition and those transitions triggered by the crystal field-effects (transitions of electrons from lower to higher energy states) []. These absorption features were not found in the samples, which probably means that Fe content (detected by the LIBS analysis) is associated with small traces of pyrite that are not yet oxidized. In Figure 10, a doublet absorption feature near 1400 nm (OH) for the clay samples suggests that kaolinite is the controlling component. Sand and silt sample spectrums are similar, but the subtle absorption change of 700–1000 nm in the silt sample may suggest the presence of higher content of Fe in this kind of lithology. Further spectral analyses are planned on the following sampling stages of the mine dump materials, with a special focus on tailing pond sludge.
Mine water: For groundwater characterization, data records were available from a monitoring well in the Schleenhain mining field. The well provides data from the last 10 years about the main physicochemical parameters and elemental concentration of water. Using these resources, the groundwater conditions at the area of operation were analyzed to understand the reaction schemes occurring in the groundwater system; the results will serve as a comparison with further monitoring wells and drainage water from the tailing ponds in the dump area at a later stage of the project. The pH value, as an important milieu indicator, is slightly acidic (pH of 5.54–5.77), having been below the neutral value (pH 7) over the years. The EC value (electrical conductivity) indicates the mineralization of the dump water in this monitoring well. The EC value stays relatively constant, between 2.48–2.86 mS/cm. In general, the water temperature measurements are above the normal 10 °C for groundwater. The maximum reaches a value of 15.1 °C. This temperature condition probably responds to the ongoing (bio) geochemical processes (the oxidation of tertiary organic matter, reductive processes, and pyrite weathering). The Eh (mV) measurement was corrected for temperature and adjusted to a potential relative to that of the standard hydrogen electrode, so it can be expressed as a value of electron activity (pe) and provides a similar scale to the pH measurement. The increment in the rate of oxidation/reduction in the monitoring well (Figure 11a) might be attributed to a slight increase in weathering activity during this year, or to the decrement of anaerobic conditions in the water.
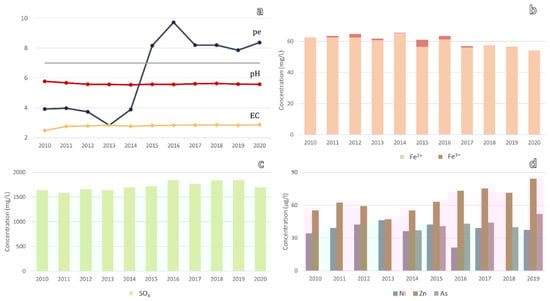
Figure 11.
Evolution of groundwater parameters in Schleenhein field: (a) pH, pe (redox corrected and expressed as electron activity) and EC (electro conductivity (mS/cm)); (b) total Fe (Fe2+ and Fe3+); (c) SO4 concentrations (mg/L); and (d) trace elements Ni, Zn, and As in (µg/L).
Regarding the Fe and SO4 concentration, as well as many of the major ions present in the tipping groundwater body, the variability percentage is low, meaning that there is no significant variance in the concentrations over the last few years. These waters present a sulfate concentration of 1590–1840 mg/L and an iron content mostly <60 mg/L. Apart from the Fe and the sulfate concentration, As, Ni, and Zn play important roles as relevant trace metals in groundwater systems. The evolution of these metals is reported in Figure 11b,d). The concentration presents a slight tendency to increase over the years; however the values remain below the maximum admissible value. For the rest of the trace elements evaluated (Hg, Pb, Cu, Cr, Cd, Ag, Al, PO4, P, NO2, and NO3), no elevated concentrations were found.
5.4. Outlook
Further compositional data will be included in the following stage of the TRIM4Post-Mining project, especially from the water drainage and tailing ponds located in the waste-dump area. The current pH and dissolved metal concentrations will be evaluated following different endmember mixing of waters, and the variation in conditions (simulating weathering) will be modelled using the geochemical program PHREEQC (Version 3.7.0.15749, USGS, Lakewood, CO, USA) [], with the aim of assessing the risks of acidification. The program is based on the equilibrium chemistry of aqueous solutions interacting with minerals, gases, and other components. Of the several available databases in PHREEQC, only the WATEQ4F database (3.7.0.15749, USGS, Lakewood, CO, USA) has the thermodynamic properties for colloidal minerals that typically precipitate from AMD, and therefore, in principle, it will be selected as the database. The database contains mainly thermodynamic data for aqueous species, gas, and mineral phases, and some kinetic data for rate-limiting steps (if mandatory) serving as a basis for the calculations. The hydro-geochemical modelling will assess the designation of saturation indices (SI) towards relevant mineral phases in AMD generation. The equilibrium state with respect to primary (i.e., geogenic) sulfide phases and secondary carbonate solid phases, as well as typical storage minerals formed secondarily (such as iron-sulfates and gypsum) in the dumps will be investigated. The SI indicates whether a solution is in equilibrium with a particular mineral phase (solid phase) []. Further stability diagrams for the graphical depiction of redox vs. pH for different mixtures of waters will be used to evaluate stable and meta-stable corrosion and oxidized sub-products under different conditions.
6. Sonic Drilling for Waste-Dump Sampling
To verify these spatiotemporal models describing geotechnical and geochemical processes inside a dump, a newly available non-destructive drilling technique (SONIC, Eijkelkamp SonicSampDrill, Giesbeek, the Netherlands) shows great potential. The ability to quickly extract an undisturbed core in partially wet soil and characterize it geochemically using the above-mentioned sensor technology, including CPT, seems very appealing.
Sonic drilling is a soil-penetration and sampling technique that strongly reduces friction on the drill string and drill bit due to liquefaction, inertia effects and a temporary reduction in the porosity of the soil. This combination makes penetrating a large range of soils easy for sonic rigs and tools. The oscillator within the drill head generates a high-frequency, resonant energy, which is directed down into the drill string. During drilling, the resonant energy is combined with rotational movement. This evenly distributes the energy, which impacts the drill bit and drill string of the tool. The drill operator can control the amount of sonic vibration the drill head generates to match the force needed to optimally penetrate the soil and bedrock formations. The liquefaction and inertia effects enable the user to collect continuous and highly representative samples. Due to the vertical high-frequency movement, the drill string stays extremely straight with very little deviation.
Cone Penetration Tests (CPT) are executed to obtain information on the behavior of the soil. The parameters, measured by a standard CPT cone, are the cone tip resistance and the sleeve friction, which can be correlated to geotechnical soil properties. Additional parameters can be obtained using extended CPT cones, for example, pore pressure, conductivity, and video. With SonicCPT, two technologies are combined to create the ultimate geotechnical testing method for overburden formations: sonic vibrations with Cone Penetration Testing. With SonicCPT it is possible to add sonic vibrations to the CPT process when refusal occurs. Abandoning job sites due to refusal is a thing of the past in many cases.
As part of the TRIM4Post-Mining project, the state-of-the-art Measurement While Drilling (MWD) sensor system will be extended. Currently, the system is mainly focused on the logging of the input performance of the drill rig. The new extended version of the MWD system will also be able to log the interaction with the soil through high frequency vibration sensors up to 2.5 kHz, measuring with a 25 kHz acquisition frequency. This will make it possible to optimize the drilling settings beyond the state of the art and, therewith, ensure the representativity of the drill-core samples to a new level. In general, the data set combining drill rig performance data, drill/soil interaction data and geotechnical lab data will be extended during the case study drilling campaign. With this data, the bèta AI algorithm for the computation of geotechnical parameters—for example, the shear strength—will be improved.
Regarding the CPT technology, its development will focus on image analysis of the footage from the existing video cone. The available algorithms will be reviewed to develop a bèta (close to), real-time, in situ grain-size analysis tool. Furthermore, the correlation data-set between conventional CPT loggings and SonicCPT loggings will be extended during the case study, to extend the accurate applicability of the resulting algorithm.
These developments, together with the chemical analysis developments of the project partners, will make faster and even more accurate in-field geotechnical and geochemical dump-site exploration possible as part of the TRIM4Post-Mining dump methodology.
7. Stakeholder Engagement and Performance Indicators for Land Rehabilitation
This building block of TRIM4Post-Mining aims to identify the potential stakeholder groups in post-mining landscape projects and their engagement in the land rehabilitation planning process. Furthermore, merging the identified stakeholders with the objectives of mine site rehabilitation—and, thus, defining a set of performance indicators to support the decision-making process for reclamation options—will allow efficient and transparent communication about the planning options and associated risks and opportunities between stakeholders.
7.1. Approach for Stakeholder Identification and Defining Performance Indicators
Stakeholder Identification: It is important to define who can act as or be a stakeholder for the project. According to the project management institute [] stakeholders are individuals and organizations who are actively involved in the project, or whose interest may be positively or negatively affected as a result of the project’s execution or successful completion. To identify stakeholders for TRIM4Post-Mining, a combination of recognized guidelines, such as the PMBOK of the Project Management Institute [], and the Community Development Toolkit of the International Council on Mining and Metals [], was used. The approach covered aspects such as:
- The identification of potential stakeholders starting from three main groups (communities, authorities, and experts),
- The development of a qualitative assessment of each potential stakeholder for impact, influence, and opinion,
- Designing a matrix to categorize the stakeholders and develop consultation/engagement strategies,
- Mapping each stakeholder for their influence, interest, and impact on post-mining landscapes, and
- Generating a prioritization plan to support engagement activities and achieve their expectations.
Defining Performance Indicators: To support decision making for post-mining areas, a pivotal element is the assessment of the chemical/physical conditions of the waste dump, and its behavior and interaction with the surrounding areas. Indicators should define an attribute, a sign, or a signal that shows how criteria can be evaluated, to outline whether they have been achieved or if more work needs to be conducted []. The indicators can have a spatial and temporal domain. Additionally, an indicator can be a milestone, a trend, or performance that can be measured on entire landforms or specific polygons. The approach applied in TRIM4Post-Mining is the predictive modelling of geotechnical/geochemical conditions, as well as open communication with stakeholders. Therefore, the adaptation of performance indicators must include the goal, objectives, and targets of the project from the early stages of the project.
The selected method was to create relations between three elements—the goal, objective, and criteria—for the TRIM4Post-Mining project (Figure 12), and the last stage was the definition of key performance indicators to assess post-mining areas.
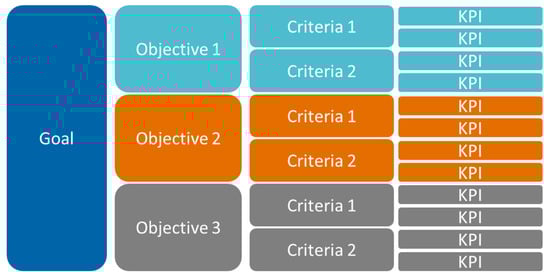
Figure 12.
Representation of working flow to identify performance indicators.
7.2. Application of the Proposed Approach
Stakeholder Identification: The application of the proposed methodology led to three main stakeholder groups: communities, authorities, and experts. Each of these groups was underpinned, leading to a total of 36 classes of stakeholders. Each of them was assessed based on their impact and influence, as well as on their opinion (negative or positive). This allowed us to categorize and prioritize the stakeholders classes and define strategies to gather their expectations and engagement level. Figure 13 shows the corresponding representation of the stakeholders classes.
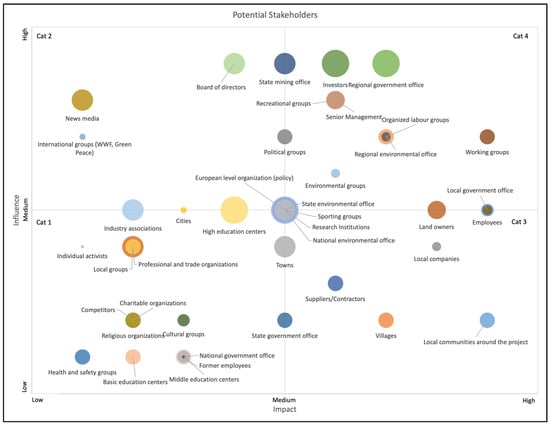
Figure 13.
Matrix of assessment and categorization of potential stakeholders.
With the matrix, it is possible to define four categories that can be related to engagement strategies in the next stage of the project, or in the management of post-mining landscapes.
The categories are associated with the impact/influence of stakeholders, and the opinion qualification can be linked to how much effort or dedication will be required to include and gain the support of a stakeholder. Considering that a big size bubble is a high/positive opinion, it will require less effort in comparison to a small size bubble; the latter represents a low/negative opinion, which requires more effort to change toward supportive engagement. The engagement strategies related to the categories include:
- Category 1—Low impact/low influence: interviews, public meetings (if necessary), periodic engagement, and providing information via general communication media;
- Category 2—Low impact/high influence: regular consultation, public meetings, expectations, and interest surveys, increasing the level of interest;
- Category 3—High impact/low influence: regular consultation through key members, fostering opportunities for partnerships, the formation of specific working groups, and involvement in low-risk areas; and
- Category 4—High impact/high influence: regular targeted consultation, involvement in the planning process, fostering opportunities for partnerships, participation in monitoring activities, and the development of workshops.
The last step in this process was the collection of requirements, expectations, and engagement thoughts of the stakeholders, using a questionnaire. This type of activity allows the consolidation of the main elements to be included in subsequent activities of the project, to develop a transparent communication system. The results of the questionnaire will improve the scope of the project and support the engagement activities of the stakeholders.
Performance Indicators: The applied methodology allowed the interconnection of the goal of the TRIM4Post-Mining project with the definition of performance indicators for two different stages of a post-mining landscape: (1) during the construction of the waste dump, with indicators to identify risk zoning and physical/geochemical behavior (medium-term); and (2) for rehabilitated mining areas, with indicators to monitor the performance of the waste-dump conditions (long-term). In order of evaluation, to ensure the alignment of the project and its outcome, the following elements can be seen:
Goal of the project: post-mining landscapes are capable of complying and integrating the three elements of sustainability, providing ecological, social, and economic benefits.
Objectives of the project:
- (1)
- Long-term stability and sustainability of the landforms, soils and hydrology of the mining area and waste dumps.
- (2)
- Partial or full repair of ecosystem capacity to provide habitat biota and other services for people.
- (3)
- Prevention of pollution or disturbance of the surrounding environment.
Criteria (which are the standard for judging or deciding how objectives are assessed):
(1.1) The post-mining landscapes are integrated with their surroundings,
(1.2) The post-mining landscapes are geotechnically stable,
(1.3) The reclaimed materials are well distributed in the post-mining landscape,
(2.1) The post-mining landscapes have suitable water quality,
(2.2) The post-mining landscapes provide ground conditions to sustain further uses,
(3.1) The post-mining landscapes are continuously monitored for established measures, and
(3.2) The utilization of the post-mining landscapes includes management programs for defined uses.
For the two different stages of the evolution of a coal-mine waste-dump, a set of performance indicators was identified that are linked to the monitoring and modelling/prediction activities described in Section 3, Section 4, Section 5 and Section 6 (Figure 14).
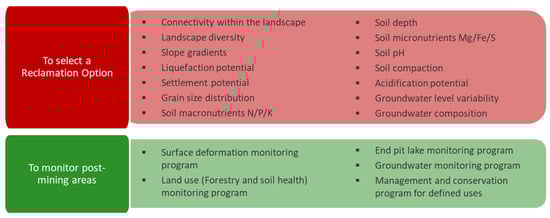
Figure 14.
Set of performance indicators for the TRIM4Post-Mining project.
7.3. Expected Results
Based on stakeholder identification, expectations, and requirements, engagement activities can be included in the scope of the TRIM4Post-Mining project; this will ensure transparent communication between all interest groups, generating spaces for the support of and commitment to the sustainable development of post-mining landscapes.
Furthermore, the results of the expectations questionnaire will allow the adaptation of project visualization tools, with the data requirements and specifics of the stakeholders tailored according to their level of interest (see next chapter).
The selection of suitable performance indicators and their alignment with project objectives will allow a straightforward assessment of the risk conditions in waste dumps which, in the future, will become areas with diverse uses and services for their communities. The performance indicators will make up part of the integrated information modelling system, permitting the agile and assertive assessment of geotechnical/geochemical conditions and their interactions with the surrounding landscapes, seeking improved land rehabilitation.
8. Integrated VR/AR Information Modelling and Communication Platform
8.1. Objective
This key component of TRIM4Post-Mining aims to bring together all the inputs in two main ways: The first objective deals with the integration of all the information sources and formats in a main database on which all the subsequent steps are based. As an example, geochemical information is to be stored in the database for every point in space of the waste dump, which allows for its subsequent use for the prediction tools; the results of these will, again, be stored in the named database. In order to do so, appropriate links between the information are required. By doing so, the querying and posting of data for the whole post-mining area, as well as individual cubes, will be possible. Consequently, any changes in reality can be rapidly updated for any part of the area of interest. Additionally, a superior user-access level (e.g., administrative credentials) will permit control of the data, which means any standard user will not have database access.
The second objective focuses on the appropriate respective visualization of the relevant stored information in order to allow better informed decisions from stakeholders. In order to give value to the compilation of the different measured and calculated characteristics, a proper display must be provided to ensure understanding and straightforward interpretation by stakeholders. Therefore, the aim is to present an easy-to-use central-communication web application that is accessible to stakeholders, based on and linked to the central database; it can be displayed either directly in the field or visualized in any room, with the added benefit of a 3D perspective with user interaction (e.g., model rotation, zoom in/out, etc.). Additionally, in addition to the above-mentioned advantages, information in the central database will be updated continuously to reflect the current status of the analyzed reclamation area, in order to indicate the most recent conditions encountered. This up-to-date status grants reliability to any analysis, irrespective of the time accessed; moreover, it will serve as a tool for the stakeholders in decision making regarding, for example, the water table or the stability of the terrain for the purpose of designating the land use.
8.2. Conceptual Approach
The development of applications for the organization and visualization of data stored in databases requires a framework that aids in the programing of required functionalities. For this project, the Laravel framework is used since it includes several libraries, such as Vue, that permit straightforward coding to produce elegant results, while combining HTML, CSS and JavaScript. Additionally, the framework comes with an implemented compatibility, with php permitting easy connection with a central database, ideal for this project. To facilitate installation, a docker file allows the compilation and serving of the final application in any computer, while indicating the required dependencies and respective versions (e.g., PostgreSQL).
In addition to the aforementioned scaffolding, a relational database is required and created in PostgreSQL (open source, version 14.2, PostgreSQL Global Development Group). PostgreSQL was selected as the database system since it is open source and is constantly updated and maintained. Additionally, it includes the option to configure an additional extension called PostGIS, which permits the querying, in spatial terms, of geographic objects; this is useful for the location of a specific position within a dump model, or the surficial location of an object for subsequent display or value retrieval. By relying on a relational database, elements from a table can be directly linked as dependencies, allowing organized and optimal querying for both obtaining data and posting it in the database.
For visualization purposes, the two main methods to be used in this project are desktop applications and Augmented Reality (AR). Virtual Reality (VR) and Mixed Reality (MR) are two other available options not considered within the scope of the project, since their reach does not fall within the expected functionality of the solution according to the expected user interaction. AR means that the reality that the human eye perceives is augmented, with additional information in the form of digitally created content through the use of external devices. This type of enhancement gives the user an interactive experience through different sensory modalities, that of interest being the visual sense []. To achieve this, devices such as tablets and smartphones are used, allowing the user to maintain their perception of the real world. There are several examples in use, such as applications that overlay directions to a defined point of interest in a video gathered by a smartphone. Esri is one service provider that permits the integration of digitalized information—for example, features built in ArcGIS with rendered real-world features within a smartphone or tablet, while using georeferenced data stored in a file’s metadata. However, there is no interaction between the graphics and the real-world. Due to the advances and packages available from Esri, this will remain the main development focus of the project, since the stakeholder interaction is expected to be on site. One expected functionality is the display of the derived dump models either on site (within the land reclamation area) or on the office table of a responsible decision-making agency.
8.3. Intended Workflow
The general conceptual workflow can be seen in Figure 15. There are two parallel functionalities: the green indicates the flow of information for the stakeholders, whereas the blue arrows indicate the success rights the administrative user will have (aside from the obvious control over the application features and scaffolding). The general functionalities will be explained in the following sections with the use of images.
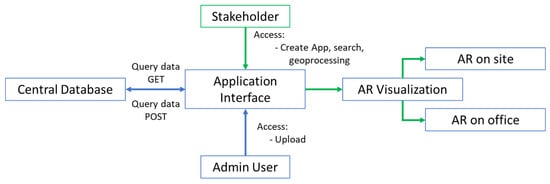
Figure 15.
General workflow of the web application.
8.4. Illustrative Examples
The application is constructed with an authentication filter that all users will see when they try to access the url address. This is shown in Figure 16, where either the user is required to log in with their credentials (first window shown) or they are given the option of registering. This will allow the application to review the rights of the accessing individual, in order to differentiate between administrative rights and simple rights. All credentials are to be saved in the main database created for the application. Further inbuilt characteristics allow the recovery and changing of the password. On the other hand, if authentication fails, access to the information will be denied.

Figure 16.
Example of interface of the login and registration windows for access authentication in the application.
Once the user is authenticated and granted entry to the application, the browser window will display the contents. Depending on the access rights of the user, different contents will be available, including the main tabs: “Dashboard”, “Search”, “Upload” and “Create App”. The first will display the main information and description regarding the accessing account, while the “Search” option allows the user to search entries depending on the required necessities/interests, plus the additional option of applying filters. Besides this, the third option (“Upload”), permits the uploading of files to the database and will only permit certain extensions and sizes to be selected. These files may be, for instance, information required for model calculation, new measurements taken in the field, etc. Once the user confirms the selection, metadata will be extracted and displayed before the file is sent to the database. Finally, the option “Create App” creates a new connection with ArcGIS services [] to display the current information within the database; this can include maps, the location of drill holes, and models, among others. The display of such information is to be performed with 3D capabilities, and will allow the models to be checked before dispatching anything to the AR applications.
Further down the line, once the visualization results in the browser are agreed upon, models and information can be rendered on the AR side of the project. The two main approaches for the named visualization are displayed in Figure 17. The first case shows the possibility of displaying shapes (such as polygons and lines) in any space with the possibility of including a base map for reference (in the case of the examples, an aerial base map is used). This allows the direct analysis of information, within an office, of any desired characteristic that attains the reclamation zone. Further features can be superimposed, such as territorial planning or street planning, to aid in the decision of required changes or prevention works. A simple interface will be developed to aim for direct interaction with information, letting the users utilize actions—for instance zooming or rotating the displayed data.
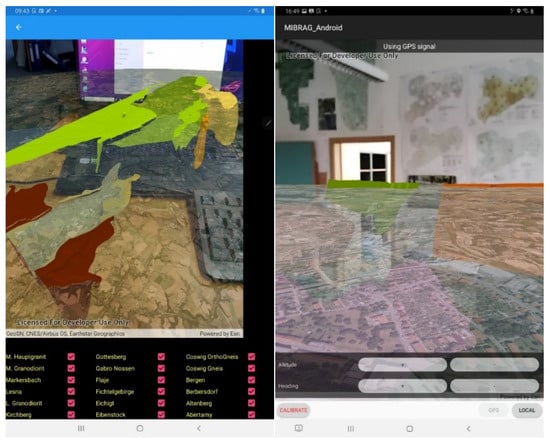
Figure 17.
Example of an AR application installed on a tablet, showing ArcGIS digitalized polygons rendered on top of an office table. Note that the user can interact with the artificially created environment by zooming in or out, or even rotating the existing features. Here, no georeferencing is necessary. Screenshots taken at the office of Beak Consultants GmbH (Freiberg, Germany).
An additional option for the visualization of existing models of the dump site is the display of the information on site (see example in Figure 18). This means that the user can go directly to the location of the waste dump and overlay the model of interest on the area through the use of the georeferencing description stored within the metadata of the file. The image above serves as an example on the display of a service line within the rendered reality, allowing the identification of where a certain feature is in real time. In relation to the use case, a controlling environment agency may locate the extent of the effect of acid mine drainage and order the closure of the space to public access. This, in turn, will help to plan the required prevention or correction steps.
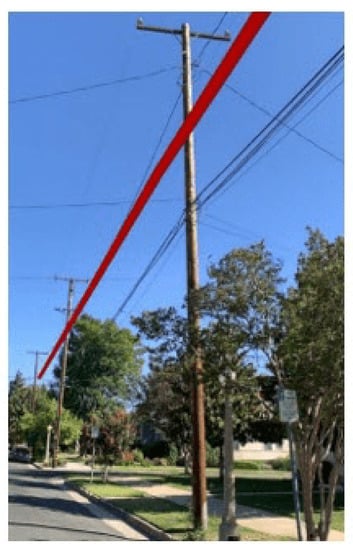
Figure 18.
Example of AR scene with the location of a service line superimposed. Here, georeferencing is important to overlay the features on top of the real features. This will be implemented for displaying the derived models on the reclamation site. Taken from ArcGIS Developer: display scenes in Augmented Reality (AR).
9. Discussion and Conclusions
Mining operations today produce a vast amount of data and information. A large part of this information might be lost after termination. In addition, the stakeholders’ interest in a transparent process of the renaturation of former mining landscapes is vital for the successful implementation of the anticipated energy transition across Europe.
TRIM4Post-Mining develops an integrated framework that allows for a quick assessment of the risks related to future land-use planning options, applied to the legacies of lignite mining interior waste dumps. The project is based on a large database, recorded during operational monitoring in today’s modern operations, and supported by monitoring data related to ground movements and geochemistry. For the latter, the use of new sensor technology is investigated and will be combined with a large-scale post-mining monitoring concept. Applying the techniques of predictive modelling, both geotechnical and geochemical processes are captured and continuously updated as new monitoring data become available. In this way, an up-to-date large-scale risk-mapping tool is available that allows for a preliminary investigation of rehabilitation options. Using the results, it will be possible to identify local areas where further investigation is required for certain land-use options. The whole system is supported by a central database, a stakeholder-customized user interface, and a visualization option for the best exploitation of the information. Finally, a geoportal for coal regions in transition will be available that allows techno-economical communication between all stakeholders for the best land use after operations have terminated.
Currently, the investigation within TRIM4PostMining allows us to choose promising technologies for future evaluation. This, in particular, will be the focus of the second part of the project, which will be implemented during the period of 2022 to 2023. Part of this investigation will be a maturation of the methods and technologies presented within this paper and a dedicated demonstration in a mine. Apart from the technological development, the acceptance criterion of all the stakeholders will play a key role in the success of the transformation processes of former mining regions. Therefore, the translation of scientific results to interpreted indicators, dedicated to different stakeholder groups with different backgrounds, interests and opinions, is vital. This shall be a main focus of future work.
Author Contributions
Conceptualization, J.B.; Methodology, J.B., D.A.R., A.G.-G., M.D., H.F., L.A.P.W. and A.J.; Software, S.S. and A.J.; Validation, H.N. and M.K.; Formal analysis, N.M., A.J., M.D., B.d.W. and H.F.; Investigation, N.M. and A.G.-G.; Data curation, M.K.; Writing—original draft preparation, J.B.; A.G.-G., N.M., H.N., L.A.P.W. and D.A.R.; Writing—review and editing, S.M. and M.K.; Visualization, L.A.P.W. and S.S.; Supervision, J.B., M.B., S.M. and A.K.; Project administration, D.A.R.; Funding acquisition, J.B. and S.M. All authors have read and agreed to the published version of the manuscript.
Funding
This project has received funding from the Research Fund for Coal and Steel under Grant Agreement No 899278.
Data Availability Statement
Presented data are currently for consortium intern use only.
Conflicts of Interest
The authors declare no conflict of interest.
References
- Knoche, D.; Rademacher, A.; Schlepphorst, R. Best Practice Report on Environmental Protection and Post-Mining Land Reclamation. Published Report of H2020 Project TRACER-Transition in Coal Intensive Regions. 2019. Available online: https://tracer-h2020.eu/wp-content/uploads/2019/12/TRACER_D-2.5_Best_practice_environmental_protection_FIB-2.pdf (accessed on 14 December 2021).
- Sloss, L. Coal Mine Site Reclamation; IEA Clean Coal Centre: Paris, France, 2013. [Google Scholar] [CrossRef]
- German Coal-Fired Power Generation Termination Act from 8 August 2020 (BGBl. I S. 1818). Available online: https://climate-laws.org/geographies/germany/laws/law-on-the-reduction-and-termination-of-coal-fired-power-generation-and-the-amendment-of-further-laws-kohleausstiegsgesetzLink (accessed on 21 January 2022).
- Krümmelbein, J.; Bens, O.; Raab, T.; Naeth, M.A. A history of lignite coal mining and reclamation practices in Lusatia, eastern Germany. Can. J. Soil Sci. 2012, 92, 53–66. [Google Scholar] [CrossRef] [Green Version]
- Moraiti, E.; Christaras, B.; Brauer, R. Landslide in Nachterstedt of Germany. Bull. Geol. Soc. Greece 2010, 43, 1267–1271. [Google Scholar] [CrossRef] [Green Version]
- Bednarczyk, Z. Geotechnical Investigations of Mine-Induced Ground Movements in Polish Opencast Mines. In IAEG/AEG Annual Meeting Proceedings, San Francisco, California, 2018—Volume 3; Shakoor, A., Cato, K., Eds.; Springer: Cham, Switzerland, 2019. [Google Scholar] [CrossRef]
- Geller, W.; Klapper, H.; Salomons, W. Acidic Mining Lakes: Acid Mine Drainage, Limnology and Reclamation; Springer Science & Business Media: Cham, Switzerland, 2012. [Google Scholar]
- John, A. Monitoring of Ground Movements Due to Mine Water Rise Using Satellite-Based Radar Interferometry—A Comprehensive Case Study for Low Movement Rates in the German Mining Area Lugau/Oelsnitz. Mining 2021, 1, 35–58. [Google Scholar] [CrossRef]
- Haupt, T. Contamination Monitoring from Mining Residues. Ph.D. Thesis, TU Bergakademie Freiberg, Freiberg, Germany, 2019. Unpublished (In German). [Google Scholar]
- Schröder, D.; Zimmermann, K.; Bock, S.; Klonowski, J. i²MON: Development of an integrated monitoring system for the detection of ground and surface displacements caused by coal mining. In Slope Stability 2020: Proceedings of the 2020 International Symposium on Slope Stability in Open Pit Mining and Civil Engineering; Australian Centre for Geomechanics: Perth, Australia, 2020; ISBN 978-0-9876389-7-7. [Google Scholar]
- Gunke, A.; Jany, S. Derivation of Mine from correlates ALS, TLS and RGB Data. In 19. Geokinematischer Tag; TU Bergakademie Freiberg, Department of Mine Surveying and Geodesy: Freiberg, Germany, 2018; pp. 79–86. [Google Scholar]
- Desta, F.; Buxton, M.; Jansen, J. Fusion of Mid-Wave Infrared and Long-Wave Infrared Reflectance Spectra for Quantitative Analysis of Minerals. Sensors 2020, 20, 1472. [Google Scholar] [CrossRef] [Green Version]
- Guatame-Garcia, A. Detection of Factors that Determine the Quality of Industrial Minerals: An Infrared Sensor-Based Approach for Mining and Process Control. Ph.D. Thesis, TU Delft, Delft, The Netherlands, 2019; 205p. [Google Scholar]
- Kressner, M.; Lohsträter, O. The Utilization of Satellite based Mining Equipment Monitoring and Support System for Real-Time Mine Mapping. In Umwelt, Energie und Rohstoffe 2021; TU Bergakademie Freiberg, Department of Mine Surveying and Geodesy: Freiberg, Germany, 2021; p. S83. (In German) [Google Scholar]
- Shishvan, M.S.; Benndorf, J. Simulation-based optimization approach for material dispatching in continuous mining systems. Eur. J. Oper. Res. 2018, 275, 1108–1125. [Google Scholar] [CrossRef]
- Eastman, C.M.; Eastman, C.; Teicholz, P.; Sacks, R.; Liston, K. BIM Handbook: A Guide to Building Information Modeling for Owners, Managers, Designers, Engineers and Contractors; John Wiley & Sons: New York, NY, USA, 2011. [Google Scholar]
- Cremers, D.A.; Radziemski, L.J. Handbook of Laser-Induced Breakdown Spectroscopy; John Wiley & Sons Ltd.: New York, NY, USA, 2006. [Google Scholar]
- Gaft, M.; Sapir-Sofer, I.; Modiano, H.; Stana, R. Laser induced breakdown spectroscopy for bulk minerals online analyses. Spectrochim. Acta Part B At. Spectrosc. 2007, 62, 1496–1503. [Google Scholar] [CrossRef]
- Dalm, M.; Sandtke, M. Geochemical mapping of drill core samples using a combined LIBS and XRF core scanning system. In Proceedings of the Real-Time Mining Conference, Freiberg, Germany, 26–27 March 2019. [Google Scholar]
- Farmer, V.C. Mineralogical Society Monograph. In The Infrared Spectra of Minerals; Mineralogical Society of Great Britain and Ireland: London, UK, 1974; Volume 4. [Google Scholar]
- Chryssikos, G.D.; Gates, W.P. Spectral manipulation and introduction to multivariate analysis. In Infrared and Raman Spectroscopies of ClayMinerals; Gates, W.P., Kloprogge, J.T., Madejová, J., Bergaya, F., Eds.; Developments in Clay Science, Elsevier: Amsterdam, The Netherlands, 2017; Volume 8, pp. 64–106. [Google Scholar]
- Madejová, J.; Balan, E.; Petit, S. Application of vibrational spectroscopy to the characterization of phyllosilicates and other industrial minerals. In Advances in the Characterization of Industrial Minerals; Christidis, G.E., Ed.; Mineralogical Society of Great Britain and Ireland: London, UK, 2011; pp. 171–226. [Google Scholar]
- Kirsch, M.; Lorenz, S.; Zimmermann, R.; Tusa, L.; Möckel, R.; Hödl, P.; Booysen, R.; Khodadadzadeh, M.; Gloaguen, R. Integration of Terrestrial and Drone-Borne Hyperspectral and Photogrammetric Sensing Methods for Exploration Mapping and Mining Monitoring. Remote Sens. 2018, 10, 1366. [Google Scholar] [CrossRef] [Green Version]
- Guatame-Garcia, A.; Buxton, M. Framework for Monitoring and Control of the Production of Calcined Kaolin. Minerals 2020, 10, 403. [Google Scholar] [CrossRef]
- Dalm, M.; Buxton, M.W.N.; Van Ruitenbeek, F.J.A. Discriminating ore and waste in a porphyry copper deposit using short-wavelength infrared (SWIR) hyperspectral imagery. Miner. Eng. 2017, 105, 10–18. [Google Scholar] [CrossRef]
- Haavisto, O.; Hyötyniemi, H. Reflectance spectroscopy in the analysis of mineral flotation slurries. J. Process Control 2011, 21, 246–253. [Google Scholar] [CrossRef]
- Hanssen, R.F. Radar Interferometry: Data Interpretation and Error Analysis; Springer Science & Business Media: New York, NY, USA, 2001; Volume 2. [Google Scholar]
- Ferretti, A.; Fumagalli, A.; Novali, F.; Prati, C.; Rocca, F.; Rucci, A. A New Algorithm for Processing Interferometric Data-Stacks: SqueeSAR. IEEE Trans. Geosci. Remote Sens. 2011, 49, 3460–3470. [Google Scholar] [CrossRef]
- King, P.L.; Ramsey, M.S.; McMillan, P.F.; Swayze, G.A. Laboratory Fourier Transform Infrared Spectroscopy methods for geologic samples. In Infrared Spectroscopy in Geochemistry, Exploration Geochemistry and Remote Sensing; King, P.L., Ramsey, M.S., Swayze, G.A., Eds.; Short Course Series; Chapter 3; Mineralogical Association of Canada: Nepean, ON, Canada, 2004; Volume 33, pp. 57–92. [Google Scholar]
- Kokaly Raymond, F.; Clark Roger, N.; Swayze Gregg, A.; Livo, K.E.; Hoefen, T.M.; Pearson Neil, C.; Wise Richard, A.; Benzel, W.M.; Lowers Heather, A.; Driscoll Rhonda, L.; et al. USGS Spectral Library Version 7. 2017. Available online: https://speclab.cr.usgs.gov/spectral-lib.html (accessed on 22 September 2021).
- Diener, U. Settlement Prediction for Lignite Waste Dumps-Slumping. Ph.D. Thesis, TU Bergakademie Freiberg, Freiberg, Germany, 1996. Unpublished (In German). [Google Scholar]
- Förster, W. Soil Mechancics. In Teubner Studienbücher Bauwesen; Springer: Berlin/Heidelberg, Germany, 1998. (In German) [Google Scholar]
- Schreyer, A. Settlement Prediction for Lignite Waste Dumps-Investigation of Ground Movement Observations on Lignite Waste Dumps; Internal Report; TU Bergakademie Freiberg: Freiberg, Germany, 1996. (In German) [Google Scholar]
- Weißbach, J. Risk Evaluation with Respect to Soil Liquefaction for Inpit-Waste Dumps in the Lusatian Mining Region. Ph.D. Thesis, TU Bergakademie Freiberg, Freiberg, Germany, 2020. (In German). [Google Scholar]
- Grimmer, S. Slumping in natural Soils due to Ground Water Rise. Ph.D. Thesis, Martin Luther University, Halle (Saale), Germany, 2006. Available online: https://d-nb.info/984744223/34 (accessed on 14 March 2022). (In German).
- Vogt, E.; Birle, E.; Vinzelberg, G. Time-Dependent Settlements and Sand and FE-Simulation of Mining Waste Dumps. In Bundesanstalt für Wasserbau (Hg.); Aktuelle Themen der Geotechnik: Karlsruhe, Germany, 2014; pp. 93–108. (In German) [Google Scholar]
- Hamdan, A. Settlement Prediction for Lignite Waste Dumps-Modelling of Lignite Waste Dumps; Internal Report; TU Bergakademie Freiberg: Freiberg, Germany, 1996. (In German) [Google Scholar]
- Popa, H.; Batali, L. Using Finite Element Method in geotechnical design. Comparison between soil constitutive laws and case study. Strain 2010, 3, 1. [Google Scholar]
- Burd, H.J. The history of Plaxis. In Beyond 2000 in Computational Geotechnics; Routledge: London, UK, 2019; pp. 35–43. [Google Scholar]
- Pham, D.T.; Dimov, S.S.; Nguyen, C.D. Selection of K in K-means clustering. Proc. Inst. Mech. Eng. Part C J. Mech. Eng. Sci. 2005, 219, 103–119. [Google Scholar] [CrossRef] [Green Version]
- Davies, D.L.; Bouldin, D.W. A Cluster Separation Measure. IEEE Trans. Pattern Anal. Mach. Intell. 1979, 1, 224–227. [Google Scholar] [CrossRef]
- Henkel, F.O.; Schalk, M. Design of plant components of nuclear power plants against earthquakes—Status and trends. ATW-Int. Z. Fur Kernenerg. 2009, 19, 760. (In German) [Google Scholar]
- Benndorf, J. Geomonitoring and Mine Surveying as Integrative Part of Environmental Management in the Mineral Resource and Energy Industry—Future Challenges. AVN 2021, 128, 5. [Google Scholar]
- Dold, B. Acid rock drainage prediction: A critical review. J. Geochem. Explor. 2017, 172, 120–132. [Google Scholar] [CrossRef]
- Lottermoser, B. Mine Water. In Mine Wastes; Springer: Berlin/Heidelberg, Germany, 2003. [Google Scholar] [CrossRef]
- Skousen, J.; Rose, A.; Geidel, G.; Foreman, J.; Evans, R.; Hellier, W. Handbook of Technologies for Avoidance and Remediation; West Virginia University: Morgantown, WV, USA, 1998; pp. 1–6. [Google Scholar]
- Nordstrom, D.K. Hydrogeochemical processes governing the origin, transport and fate of major and trace elements from mine wastes and mineralized rock to surface waters. Appl. Geochem. 2011, 26, 1777–1791. [Google Scholar] [CrossRef]
- Nordstrom, D.K.; Blowes, D.W.; Ptacek, C.J. Hydrogeochemistry and microbiology of mine drainage: An update. Appl. Geochem. 2015, 57, 3–16. [Google Scholar] [CrossRef]
- Acharya, B.S.; Kharel, G. Acid mine drainage from coal mining in the United States—An overview. J. Hydrol. 2020, 588, 125061. [Google Scholar] [CrossRef]
- Drebenstedt, C. Responsible mining approach for sustainable development–research concept and solutions. J. Eng. Sci. Innov. 2019, 4, 197–218. [Google Scholar]
- Krüger, G.; Erzinger, J.; Kaufmann, H. Laboratory and airborne reflectance spectroscopic analyses of lignite overburden dumps. J. Geochem. Explor. 1998, 64, 47–65. [Google Scholar] [CrossRef]
- Flores, H.; Lorenz, S.; Jackisch, R.; Tusa, L.; Contreras, I.C.; Zimmermann, R.; Gloaguen, R. UAS-Based Hyperspectral Environmental Monitoring of Acid Mine Drainage Affected Waters. Minerals 2021, 11, 182. [Google Scholar] [CrossRef]
- Parkhurst, D.L.; Appelo, C.A.J. Description of Input and Examples for PHREEQC Version 3: A Computer Program for Speciation, Batch-Reaction, One-Dimensional Transport, and Inverse Geochemical Calculations (No. 6-A43); US Geological Survey: Reston, VA, USA, 2013.
- Appelo, C.; Postma, D. Geochemistry, Groundwater and Pollution; Appelo, C., Postma, D., Eds.; CRC Press: Boca Raton, FL, USA, 2004. [Google Scholar] [CrossRef]
- Project Management Institute. A Guide to the Project Management Body of Knowledge (PMBOK Guide), 6th ed.; Project Management Institute: Newtown Square, PA, USA, 2017. [Google Scholar]
- International Council on Mining & Metals. Community Development Toolkit; International Council on Mining & Metals (ICMM): London, UK, 2012. [Google Scholar]
- Alberta Environment and Sustainable Resource Development. Criteria and Indicators Framework for Oil Sands Mine Reclamation Certification; Cumulative Environmental Management Association: Hinton, AB, Canada, 2013. [Google Scholar]
- Unity3D, What Is AR, VR, MR, XR, 360? 2020. Available online: https://unity3d.com/what-is-xr-glossary (accessed on 10 September 2021).
- ArcGIS Developer. Display Scenes in Augmented Reality (AR). 2021. Available online: https://developers.arcgis.com/net/scenes-3d/display-scenes-in-augmented-reality/ (accessed on 15 September 2021).
Publisher’s Note: MDPI stays neutral with regard to jurisdictional claims in published maps and institutional affiliations. |
© 2022 by the authors. Licensee MDPI, Basel, Switzerland. This article is an open access article distributed under the terms and conditions of the Creative Commons Attribution (CC BY) license (https://creativecommons.org/licenses/by/4.0/).