Article

Hybrid Fuzzy-Analytic Hierarchy Process (AHP) Model for Porphyry Copper Prospecting in Simorgh Area, Eastern Lut Block of Iran

1
Department of Soil Science and Soil Protection, Faculty of Agrobiology, Food and Natural Resources, Czech University of Life Sciences Prague, Kamycka 129, 16500 Prague, Czech Republic
2
Faculty of Mining Engineering, Amirkabir University of Technology, Tehran 159163-431, Iran
3
Institute of Oceanography and Environment (INOS), Universiti Malaysia Terengganu (UMT), Kuala Nerus 21030, Terengganu, Malaysia
*
Author to whom correspondence should be addressed.
Mining 2022, 2(1), 1-12; https://doi.org/10.3390/mining2010001
Submission received: 31 October 2021 / Revised: 11 December 2021 / Accepted: 13 December 2021 / Published: 21 December 2021

Abstract

:
The eastern Lut block of Iran has a high potential for porphyry copper mineralization due to the subduction tectonic regime. It is located in an inaccessible region and has harsh arid conditions for traditional mineral exploration campaigns. The objective of this study is to use Advanced Spaceborne Thermal Emission and Reflection Radiometer (ASTER) remote sensing data for porphyry copper exploration in Simorgh Area, eastern Lut block of Iran. Hydrothermal alteration zones such as argillic, phyllic and propylitic zones associated with porphyry copper systems in the study were identified using false color composition (FCC), band ratio (BR), principal component analysis (PCA) and minimal noise fraction (MNF). The thematic alteration layers extracted from FCC, BR, PCA and MNF were integrated using hybrid Fuzzy-AHP model to generate a porphyry copper potential map for the study area. Four high potential zones were identified in the central, western, eastern and northeastern of the study area. Fieldwork was used to validate the approach used in this study. This investigation exhibits that the use of hybrid Fuzzy-AHP model for the identification of hydrothermal alteration zones associated with porphyry copper systems that is typically applicable to ASTER data and can be used for porphyry copper potential mapping in many analogous metallogenic provinces.

1. Introduction

Remote sensing is a suitable tool to explore mineralization potential points [1] in the early stages of mineral exploration [2,3]. Hydrothermal fluids react with host rocks and change their mineralogical and chemical composition to form mineral deposits such as porphyry copper deposits [4,5]. These changes give rise to altered minerals in rocks while giving them unique spectral characteristics [4,6]. Geologists are used images from various satellites to detect the altered rocks associated with ore mineralization [7]. Integrating the results of image processing techniques can be used to increase the accuracy of the outputs and generate accurate potential map for reconnaissance stage of mineral exploration [3,8,9].
Analytic Hierarchy Process (AHP) is a way to help make decisions and emphasizes the importance of a decision maker as well as the value of comparing alternative options in the decision process [10]. This method is one of the popular methods in determining potential areas by combining information layers in mineral exploration [11,12]. One of its advantages is prioritizing each layer and weighting them. These weights can provide a map after applied to fuzzy layers. Given that the probability of mineralization in the whole region varies from 0 to 100, this method is called Fuzzy-AHP. Fuzzy maps show mineral anomalies based on the probability of mineralization. This means that in a region, the probability of mineralization is drawn from zero to one hundred percent. In fact, this is an advantage in mineral exploration, because the fuzzy anomalous areas are marked with a degree of probability. Due to the presence of porphyry copper ores, alterations and mineral indices, these layers can be used to make high-precision decisions [9].
Due to subduction tectonic regime documented in the eastern Lut block of Iran [13,14] (Figure 1a), the presence of porphyry copper systems can be anticipated. Numerous evidences have shown the occurrences of extensive alteration zones related to porphyry copper systems in this region [15], which unfortunately have not received much attention so far for porphyry copper exploration. Additionally, this zone is remote and has harsh arid conditions for field mineral exploration campaigns. Simorgh region is located between the two metallogenic provinces of Zahedan-Saravan and Birjand-Mirjaveh. In Simorgh region (Figure 1b), volcanic units include andesite and dacite and andesitic units are the most widespread in the region. Also, Hypabyssal intrusions interspersed with porphyry textures and penetrated volcanic rocks. This area has potential for copper mineralization as well as hydrothermal alteration zones related to porphyry copper mineralization can be identified and mapped using remote sensing techniques.
The purpose of this study is to use Advanced Spaceborne Thermal Emission and Reflection Radiometer (ASTER) remote sensing data for porphyry copper prospecting in Simorgh area, eastern Lut block of Iran. The specific objectives of this study are: (i) to identify hydrothermal alteration zones such as argillic, phyllic and propylitic zones associated with porphyry copper systems in the study area using false color composition (FCC), band ratio (BR), principal component analysis (PCA) and minimal noise fraction (MNF); (ii) to integrate the thematic layers extracted from FCC, BR, PCA and MNF using hybrid Fuzzy-AHP model; (iii) to generate porphyry copper potential map for the study area.

2. Geology of the Study Area

The Simorgh Area is approximately 40 square kilometers and located 110 km southwest of Nehbandan city and 24 km southwest of Dehsalm village in the southern part of South Khorasan province in east of Iran (Figure 1a,b). The Simorgh area is located in Dehsalm 1:100,000 geological map published by the Geological Survey of Iran (GSI), between the geographical coordinates of 59°11′00′′ to 59°15′56′′ East and 30°58′43′′ to 31°01′37.5″ north. It is placed in the central part of the Lut block and affected by igneous and metamorphic processes. The study area is dry and warm with a very low annual average of precipitation. From the geomorphology point of view, the study area is characterized by several low altitude mountain hills separated by alluvial plains and dry water ways”
According to the geological map, the rock units can be divided into five groups as follows [16]: (1) Pyroclastic and volcanic units including green and brown tuffs, volcanic breccia, hornblende andesite and hornblende quartz latite; (2) Semi-deep masses with porphyry texture, most of which are porphyry monzonite to porphyry diorite; (3) White dykes with a combination of porphyry granodiorite to porphyry syenite and general northeast-southwest trend; (4) Rhyolite volcanic units with sulfide mineralization; (5) Single-source and multi-source hydrothermal breccia with an area of about 550 × 450 square meters in the central part of the outcrop (Figure 1b).

3. Data and Methodology

3.1. Remote Sensing Data Characteristics

ASTER was launched into orbit by the US National Aeronautics and Space Administration (NASA) in December 1999. The sensor is providing multispectral imaging of radiant and reflective electromagnetic energy from the Earth’s surface and atmosphere in 14 bands. Spectral bands include: three bands in the visible and near infrared range (VNIR) with a spatial resolution of 15 m, 6 bands in the short-wave infrared (SWIR) with a spatial resolution of 30 m and finally 5 bands in the thermal infrared (TIR) range with a spatial resolution of 90 m [17] (Table 1). Due to their spectral capabilities and free accessibility, ASTER images, have found numerous applications in exploration of the mineral resources in last three decades [18,19]. Among them, studies on the ability of SWIR bands to identify hydrothermal alteration minerals such as alunite, kaolinite, calcite, dolomite, chlorite, and muscovite are noteworthy [20,21]. In addition, VNIR and TIR data can identify vegetation and iron oxides in topsoil and carbonates and silicates, respectively [22]. Given that the spatial resolution within the TIR range is 90 m, it is possible to identify rocks that are highly siliceous and have outcrops of 90 m or larger [23].

3.2. Preprocessing

In this study, the ASTER image (cloud free), level 1B, acquired on 15 May 2001, was used. After geo-referencing and geometric corrections of the image, a subset scene covering the study area was selected, cropped and pre-processed using crosstalk and Fast Line of sight Atmospheric Analysis of Spectral Hypercubes (FLAASH) methods. Crosstalk correction was performed to eliminate the effects of energy seepage from band 4 to bands 5 and 9, and FLAASH was performed to correct atmospheric effects [5].

3.3. Image Processing Techniques

All image processing tasks in this study have been done using ENVI® Image Processing & Analysis Software version 5.1. (L3Harris Geospashtial, Boulder, Colorado, USA) After performing the necessary preprocessing steps, some widely used standard image processing methods were implemented including band composition, band ratio, principal component analysis (PCA) and minimal noise fraction (MNF). Due to interactions of different wavelengths with different rock units and also the higher sensitivity of the human eye to changes in color images compared to tone changes in black and white ones, different band combinations are used to highlight different phenomena. Assigning one of the three primary colors red, green, and blue to each wavelength creates a color combination, the most important of which is the false color composite (FCC) [24]. In the band ratio method, the ratio of same location pixels’ values is calculated for two desired bands. By band ratio, some factors and parameters with adverse effects (such as topography) are removed, this method can be used to detect changes which cannot be recognized in single band images [3,25].
Principal component analysis (PCA) is a multivariate statistical method by which data are converted into new components that are least interdependent [26,27]. In this sense, spectral data is compressed into a new coordinate system, redundant data is removed, and finally new components with information from all spectral bands are created, and are used instead of the original data. This method has been used extensively by geoscientists to map lithologies as well as alterations [1,28,29]. In this study, VNIR + SWIR bands of ASTER were used. Table 2 shows statistical results derived from PCA analysis. The minimum noise fraction (MNF) method is used to determine the intrinsic dimensions of the image, to separate noise from the data, and help to reduce the amount of computational processing [30]. The MNF conversion consists of two steps: the first is noise removal, in which the principal components of the noise covariance matrix are calculated, and the second, in which the main components of noise-free data are extracted. Next, the results are divided into two groups, the group with high eigenvalues and the other group with eigenvalues close to one. The use of data with high eigenvalues causes noise separation from the data and improves spectral results. In this study, SWIR bands of ASTER were used to detect hydrothermal alterations from within igneous rocks. Table 3 shows statistical results derived from MNF analysis.

3.4. Fuzzy-AHP Model

In order to generate mineral potential map of the study area, information layers derived from FCC, BR, PCA and MNF were combined using Fuzzy-AHP model. The basis of this method is the weighting of each layer. In such a way that after fuzzification of layers, in the matrix, two-by-two weight comparisons are performed. And then using the AHP model, the maps are combined [31]. This model includes 4 steps as following:
(1)
Determining criteria and sub-criteria for using in the model.
(2)
Determining the weight of criteria and sub-criteria using AHP model.
(3)
Fuzzification of information layers using fuzzy logic.
(4)
Integration of fuzzified layers, using the weights calculated in step 2.
All the layers used in this study were integrated by the Fuzzy-AHP method, as well as the steps of this method are presented in Figure 2. This figure shows the main criteria and methods used to obtain each of the information layers.

4. Results and Discussion

4.1. False Color Combination (FCC)

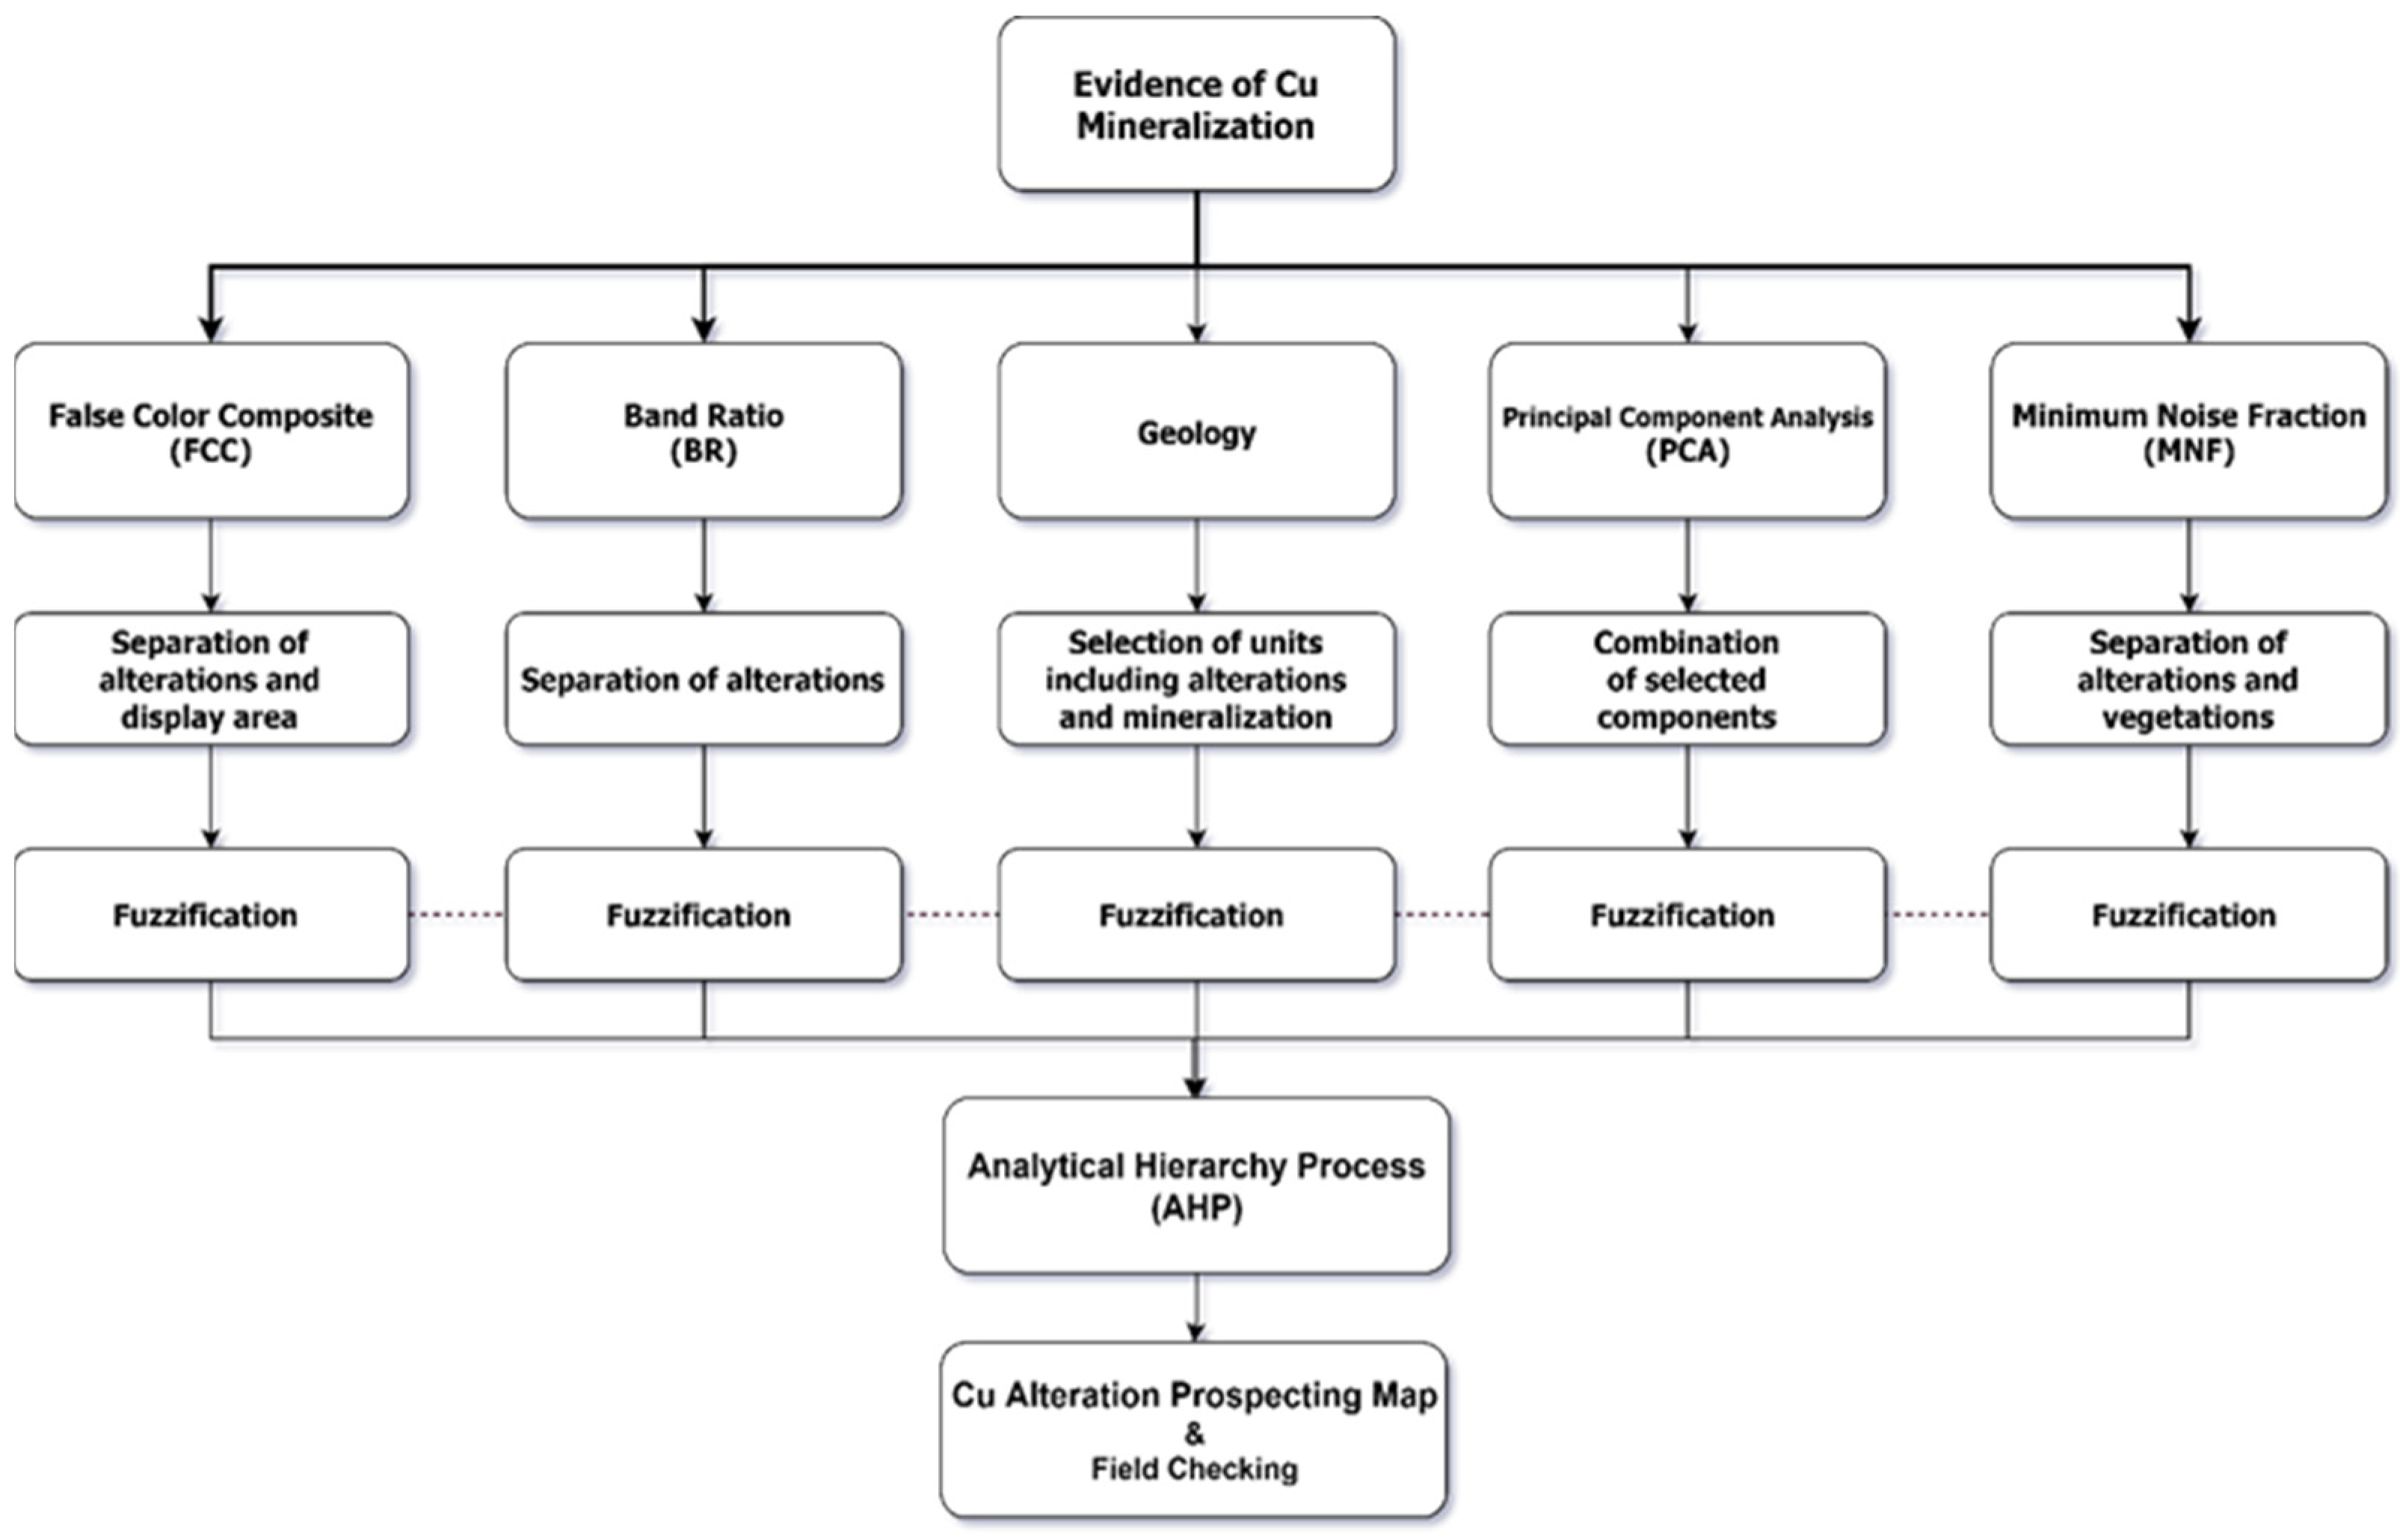
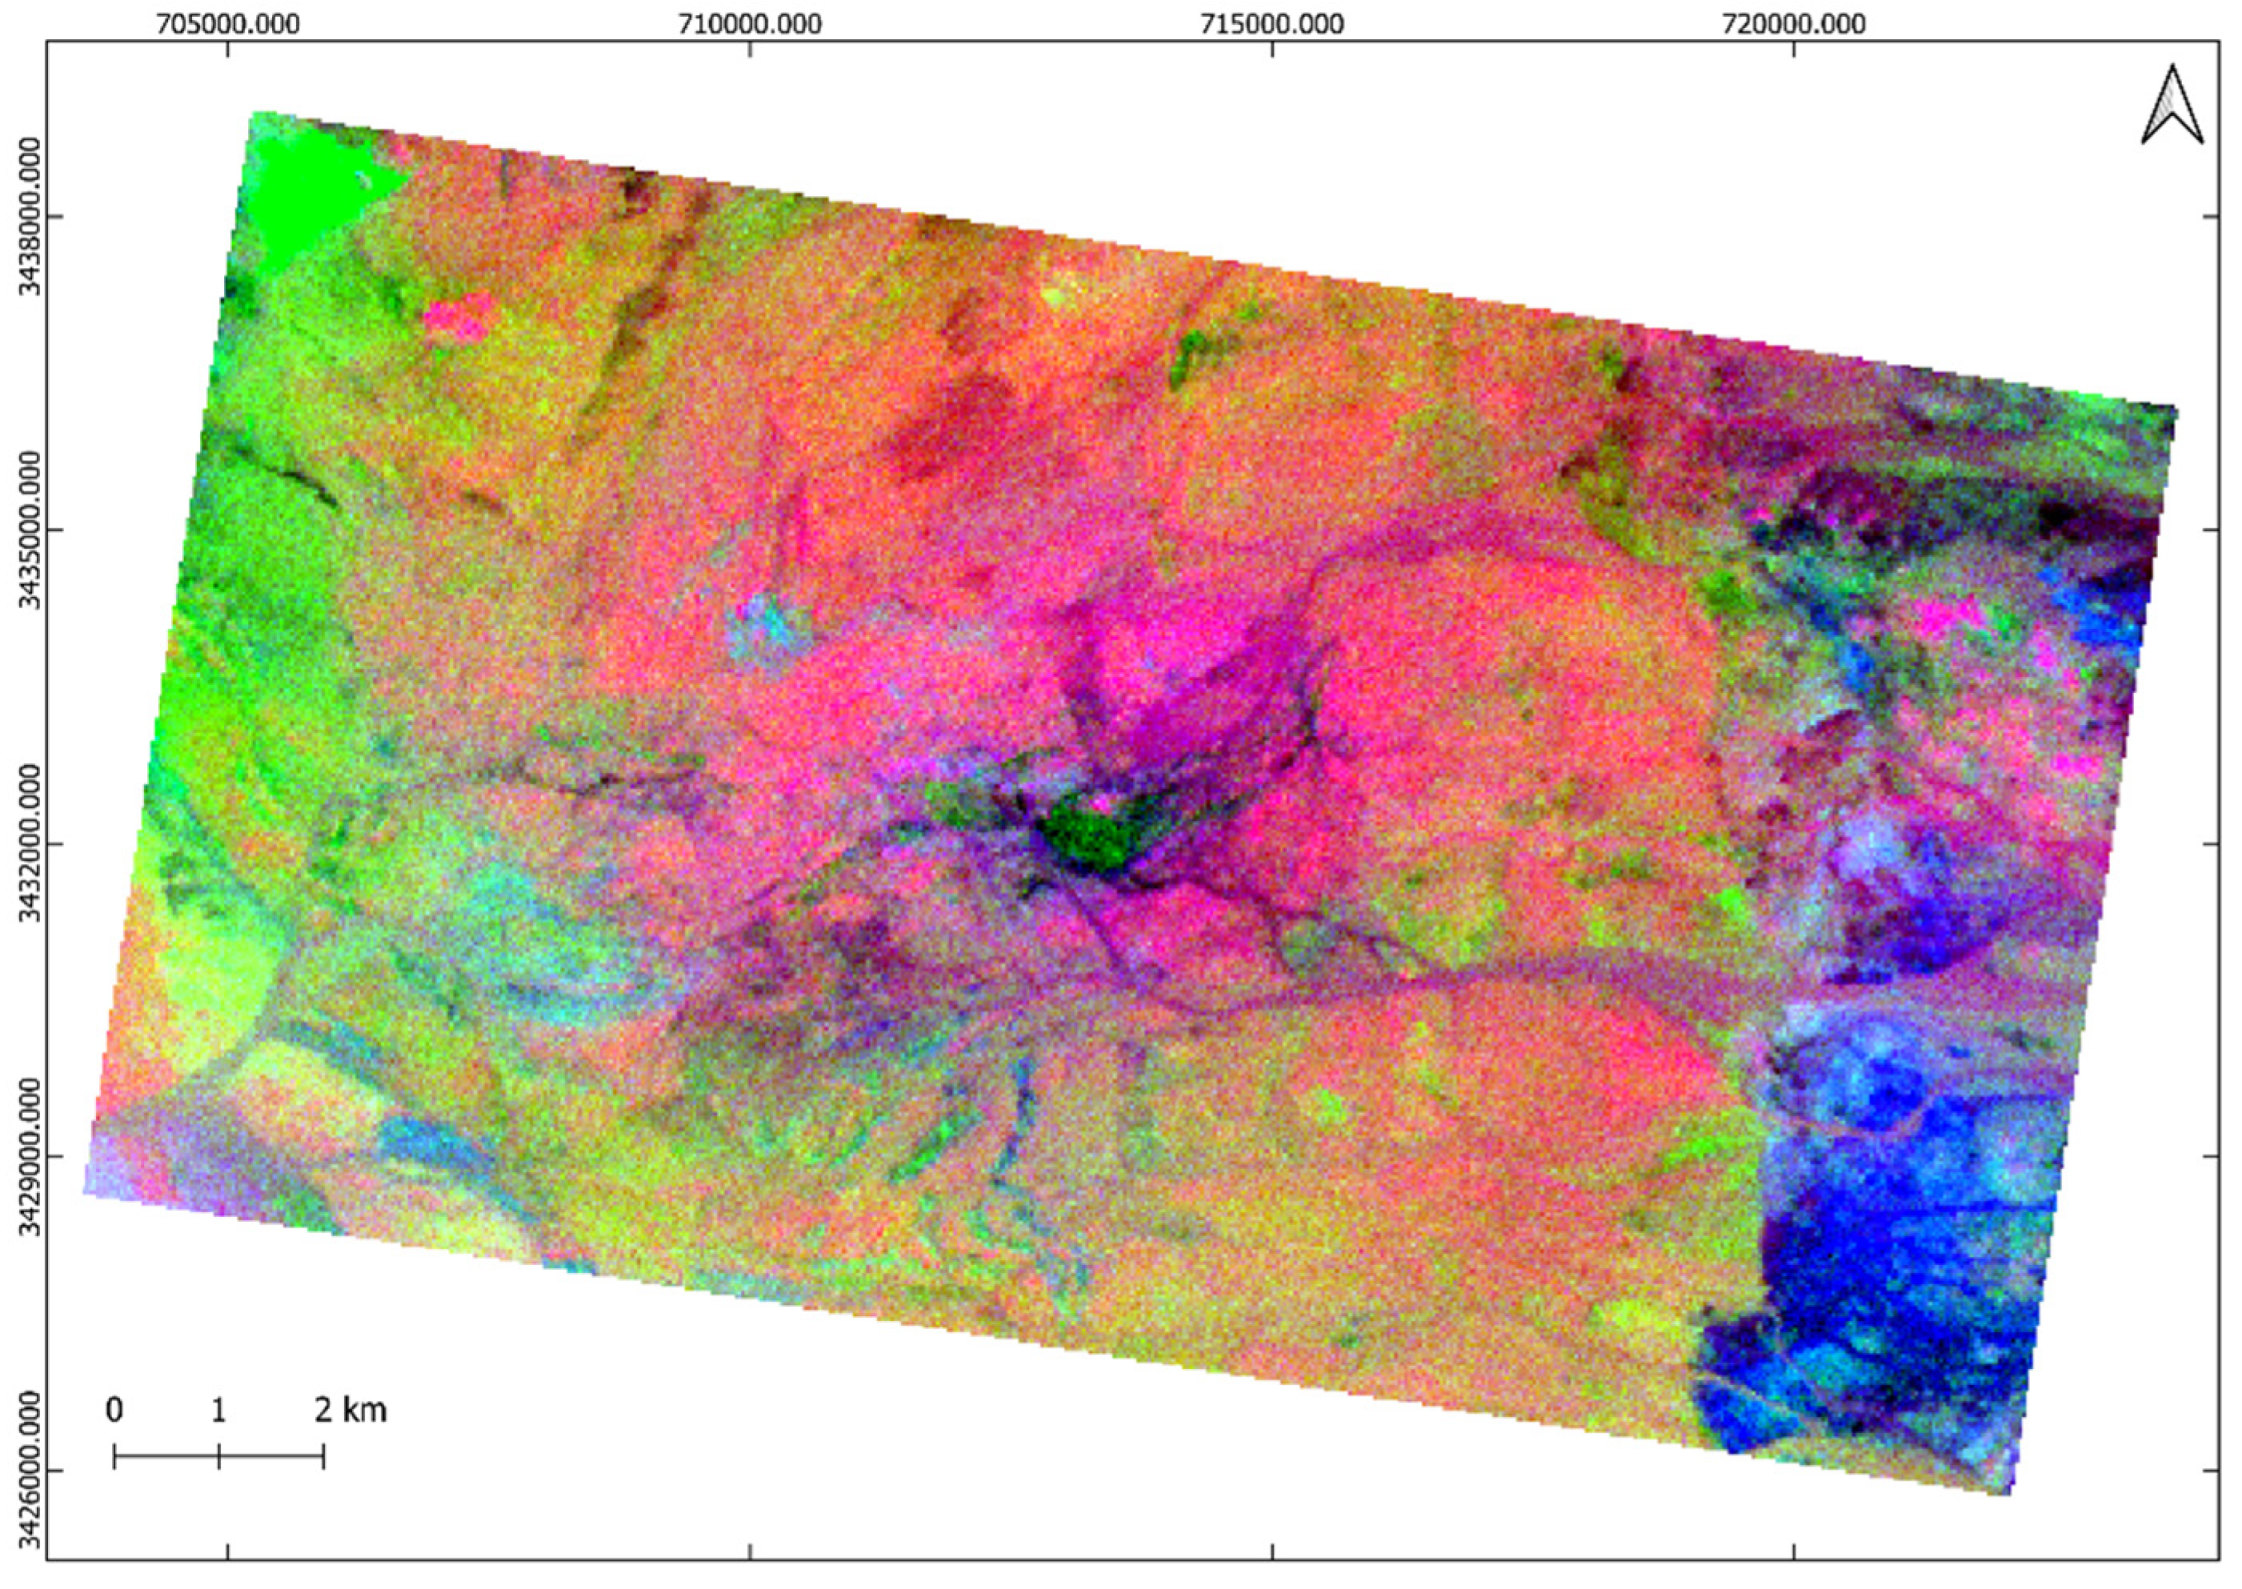
In order to detect propylitic and phyllic alteration zones in the study area, bands 4, 6 and 8 were used to produce Red (4), Green (6) and Blue (8) color combinations, respectively (Figure 3). In the image-map, propylitic alteration zone (with high amounts of minerals containing Fe, Mg-OH) is observed in green color and phyllic alteration zone (with high amounts of minerals containing Al-OH) is observed in pink to yellow color. This is due to the greater reflection of Al-OH minerals (alunite, kaolinite and muscovite) in the range of band 4 compared to bands 6 and 8 [29]. Many parts of recent alluvium are appeared as white color due to high amount of clay minerals (Figure 3). On the other hand, mafic to intermediate lithologies such as pyroxene diorite porphyry, syenite and diorite porphyry are manifested in green to black color due to high amount of mafic minerals (chlorite and epidote) in their content (Figure 3).
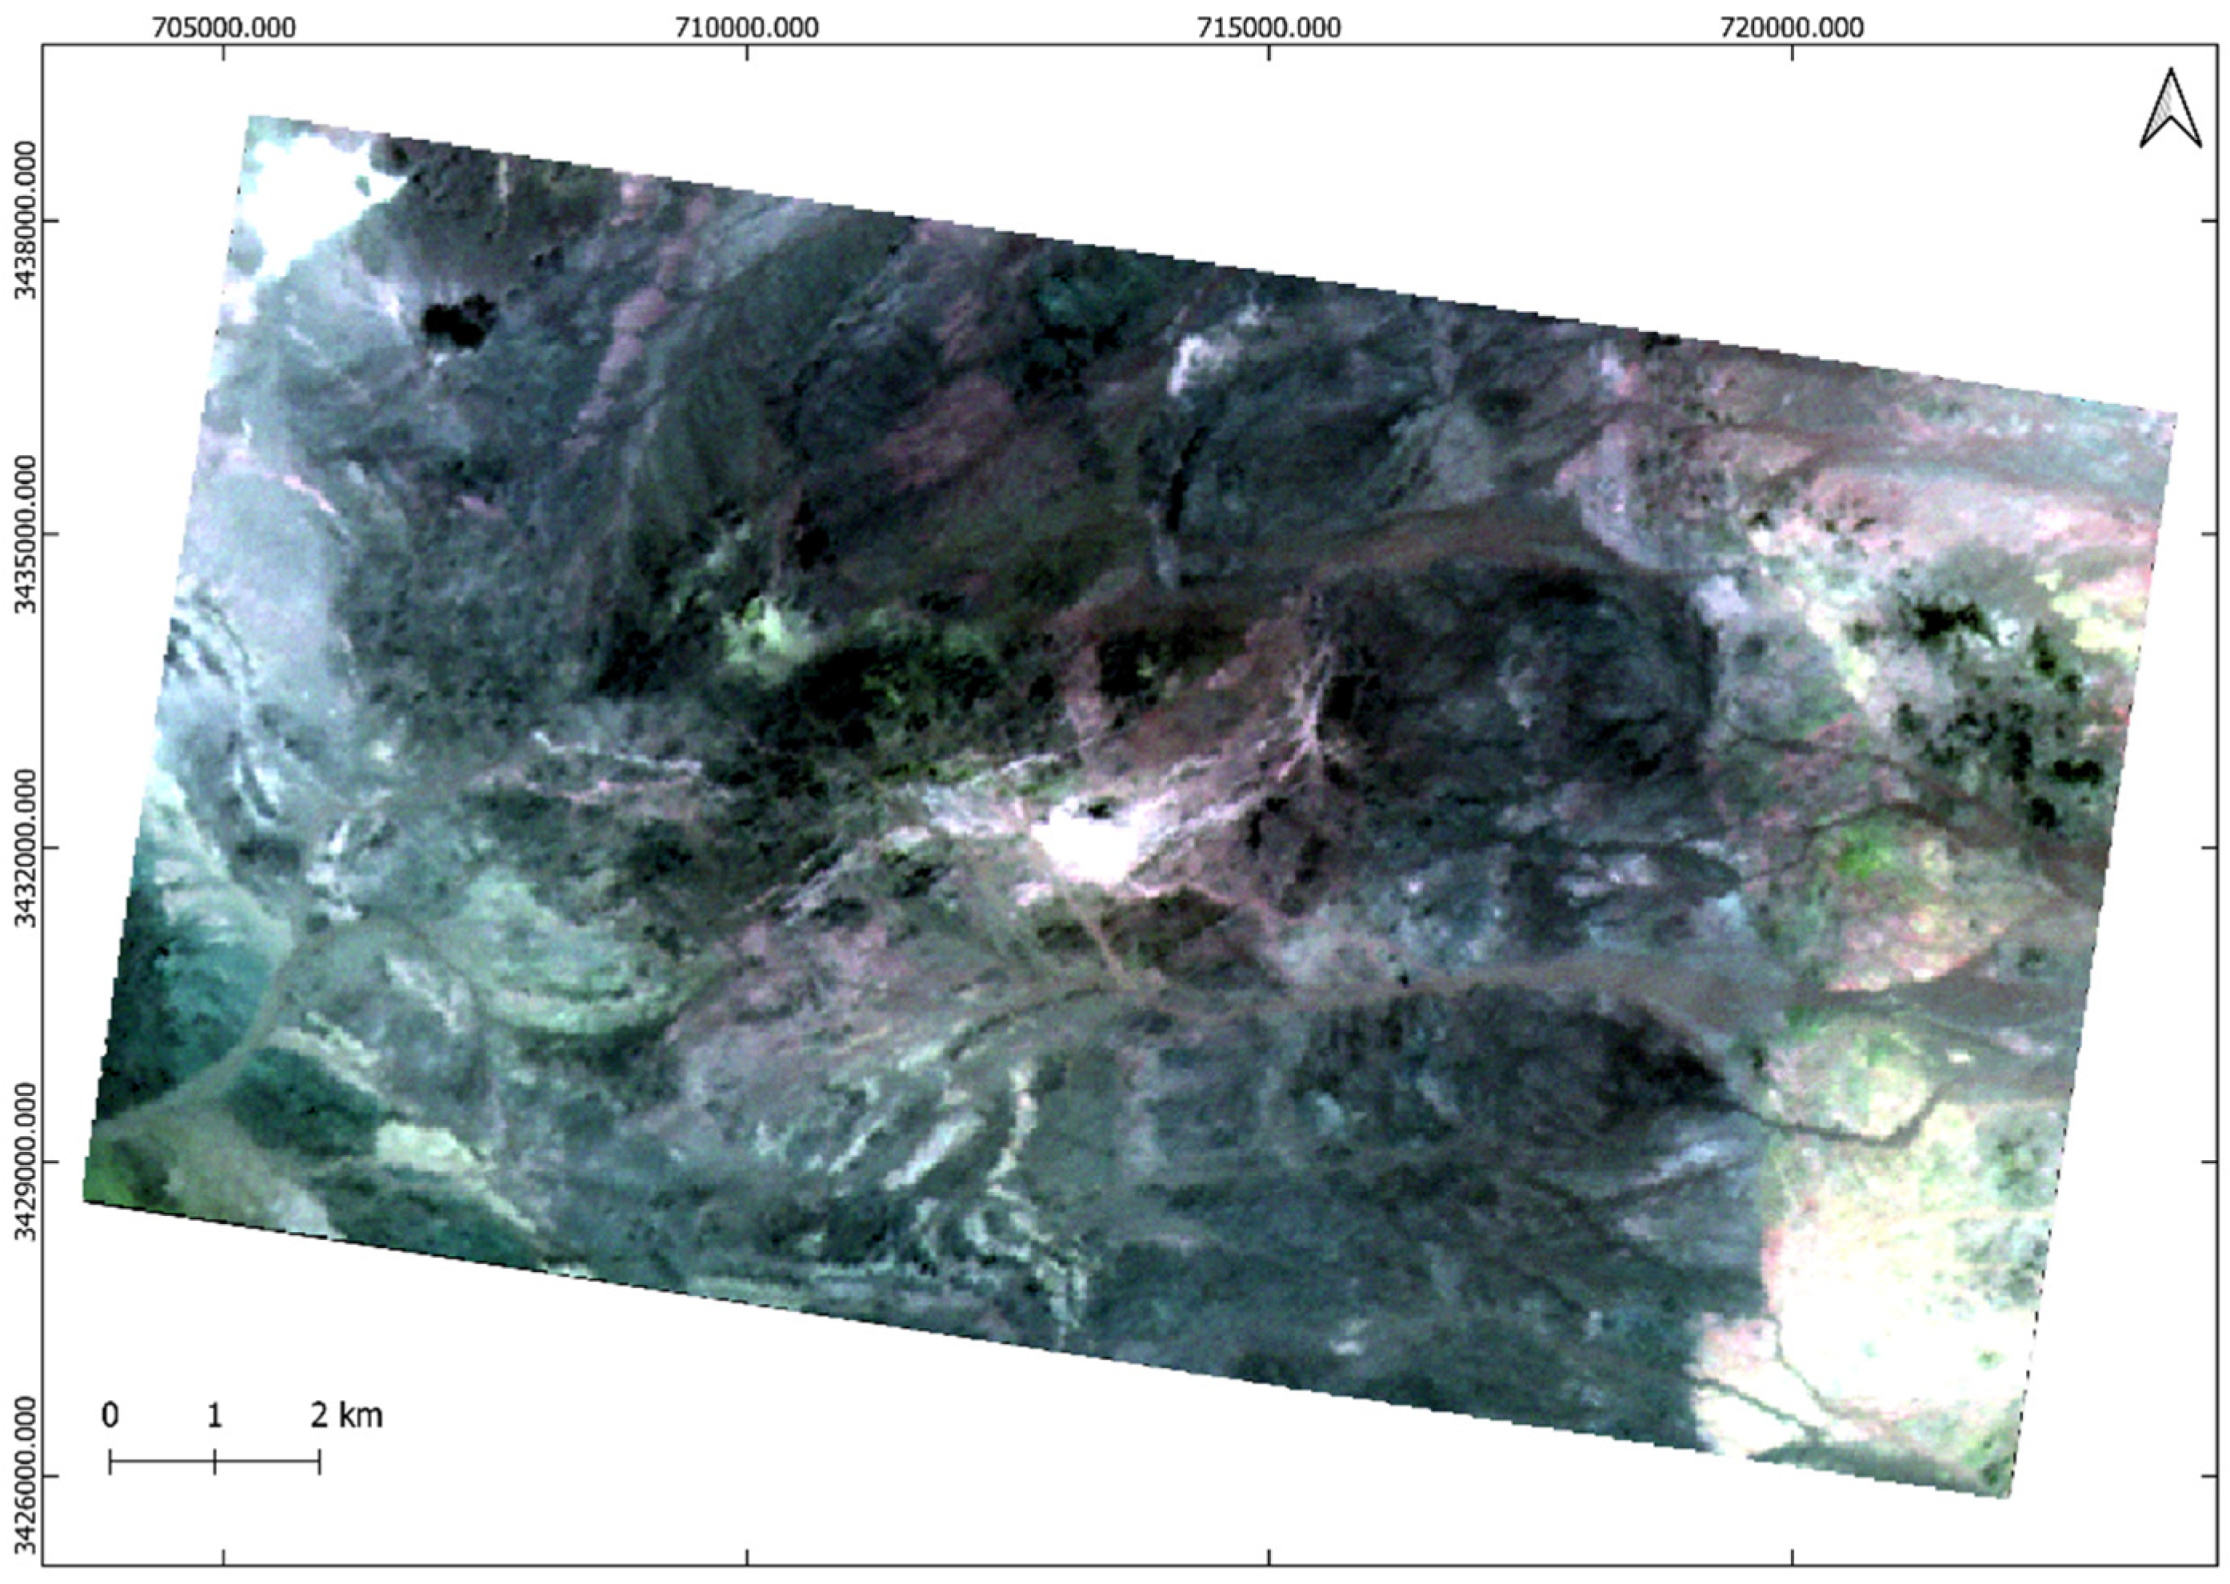
Band ratios of 5/6 and 8/9 have great capability to detect minerals with Al–Si–(OH) composition such as kaolinite (argillic zone), and Mg–Si–(OH) such as chlorite and epidote (propylitic zone), respectively [30]. Band ratio of 7/6 has high potential to identify muscovite-rich zone [31]. Muscovite mineralization can be considered as indicator of phyllic alteration zone, which is high potential zone of economical porphyry copper mineralization [32]. A RGB color combination of 7/6, 5/6 and 8/9 (R: 7/6, G: 5/6, B: 8/9) was developed to map phyllic, argillic and propylitic zones in the study area. The phyllic zone (with high economic potential) is represented in yellow to reddish yellow, the argillic zone is depicted as green and the propylitic zone is typically appeared in blue around other alteration zones (Figure 4). Band ratio technique identified the alteration zones specifically compared to FCC method.

4.2. Principal Component Analysis (PCA)

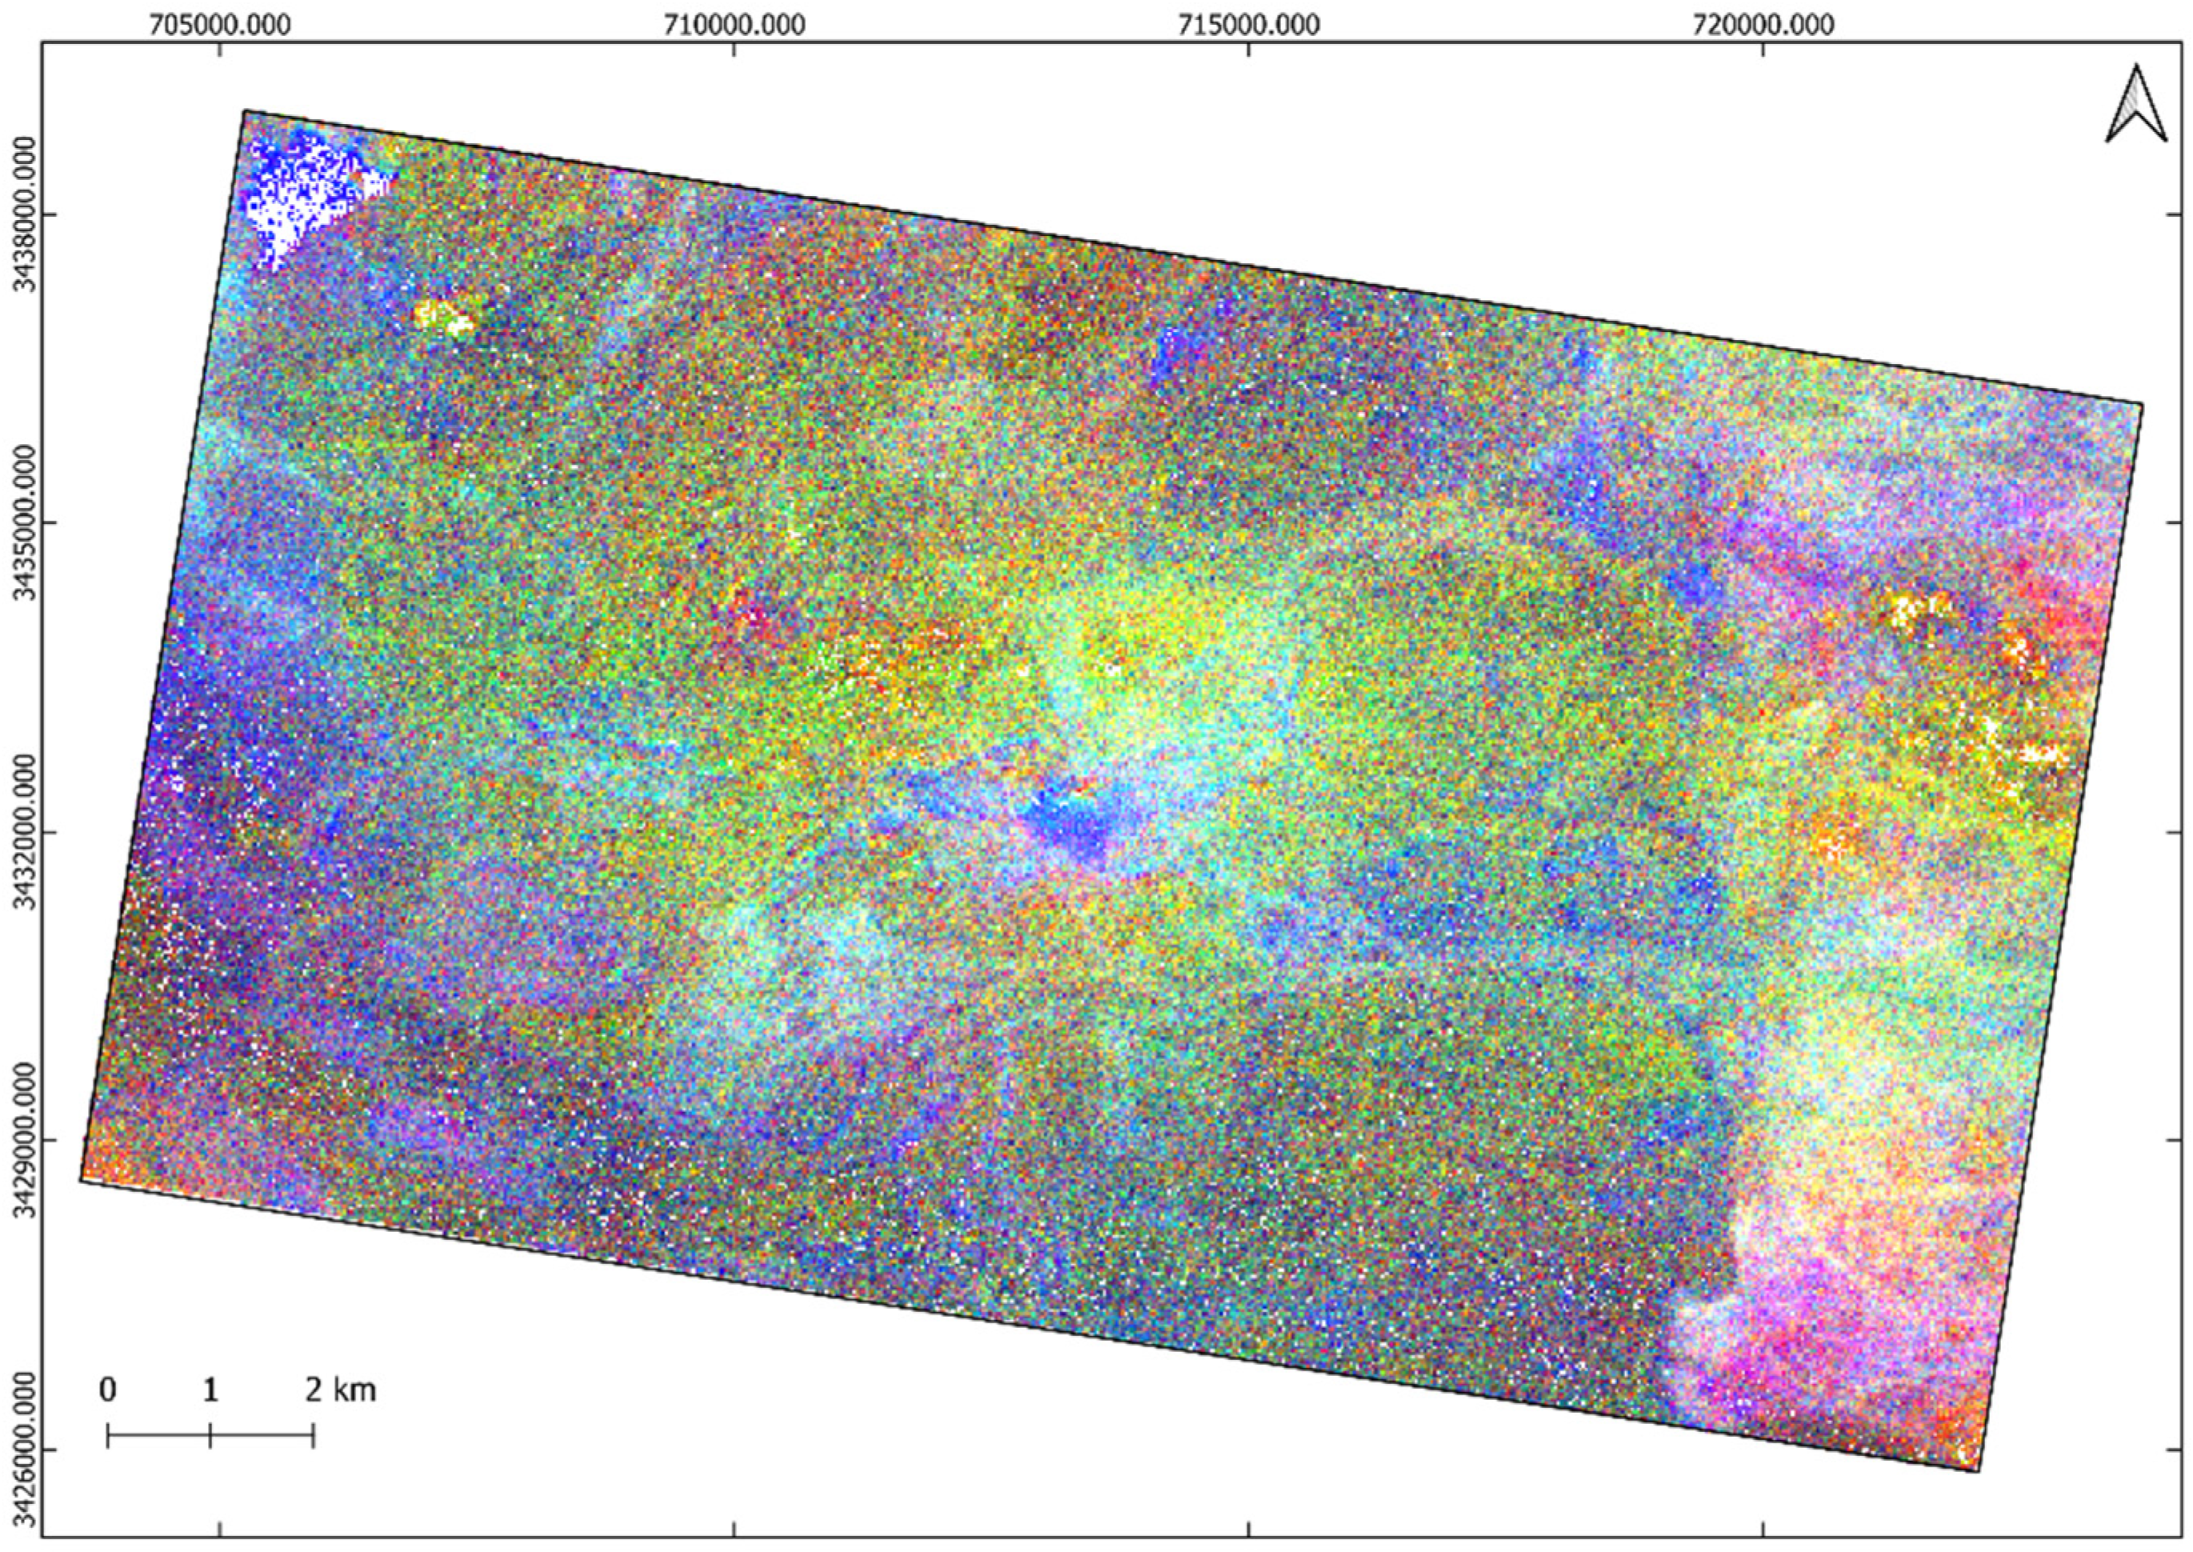
Principal component analysis was performed using a covariance matrix on nine bands of ASTER image covering the study area. The resulting eigenvector matrix is shown in Table 2. the PC that contains the target spectral information shows the highest eigenvector loadings from the ASTER bands, coinciding with the target’s most diagnostic features, but with opposite signs (+ or −). Component 1 (PC1) contains positive coefficients of all nine VNIR and SWIR bands and, due to its specific value, covers 91.6% of the total variance of the image. The overall brightness of the image creates a strong correlation among the bands. In the present analysis, this overall brightness is fully found in the first component (PC1). Vegetation has high reflectance and absorption in bands 3 and 2 of ASTER, respectively. The largest loading difference among the mentioned bands is observed in the PC4, and therefore the vegetation is found in PC4 (Figure 5a). The low percentage of variability of this component (0.94) indicates the dispersion of vegetation in the study area.
Iron oxides have the highest absorption in bands 1 and 2 of ASTER, while they show the high reflection in band 4 [2]. In PC4, the eigenvectors related to bands 2 and 4 have moderate to high loadings with the opposite sign. The eigenvectors of bands 2, and 4 in the PC4 are −0.415 and 0.610, respectively. Iron oxides are shown as black pixels in Figure 5a.
Minerals containing Al (OH) (kaolinite, illite, muscovite and alunite) have very high absorption in band 6 of ASTER. Also, minerals containing Fe, Mg (OH) such as chlorite, epidote as well as carbonates such as calcite and dolomite have specific absorption in bands 8 of ASTER [1,3,33]. Considering the amount and sign of loadings obtained for bands 4 and 6 in the PC5, it can be concluded that this PC is suitable for showing argillic and phyllic alterations (Figure 5b). Also, considering the characteristics of bands 8 and 9 for the PC8, it can be said that this PC represents propylitic alteration (Figure 5c). Finally, RGB color combination of PC4, PC5 and PC8 (R: PC4, G: PC5, B: PC8) was created for a better display of the iron oxides and alterations in the study area. In Figure 5d, iron oxides, phyllic and argillic alterations are shown with light red, green to yellow, and blue, respectively. These alterations are well observed around the target areas.

4.3. Minimum Noise Fraction (MNF)

MNF conversion was performed on SWIR bands of the ASTER image. The statistical results of this conversion are shown in Table 3. The eigenvalues of each converted MNF band represent the amount of information that the target band contains from the original image. So that the bands that contain the greatest noise have eigenvalues close to 1. Accordingly, bands with low eigenvalues will have very limited spatial integrity, which indicates the predominance of noise in those bands. By increasing the MNF principal number, the image quality decreases.
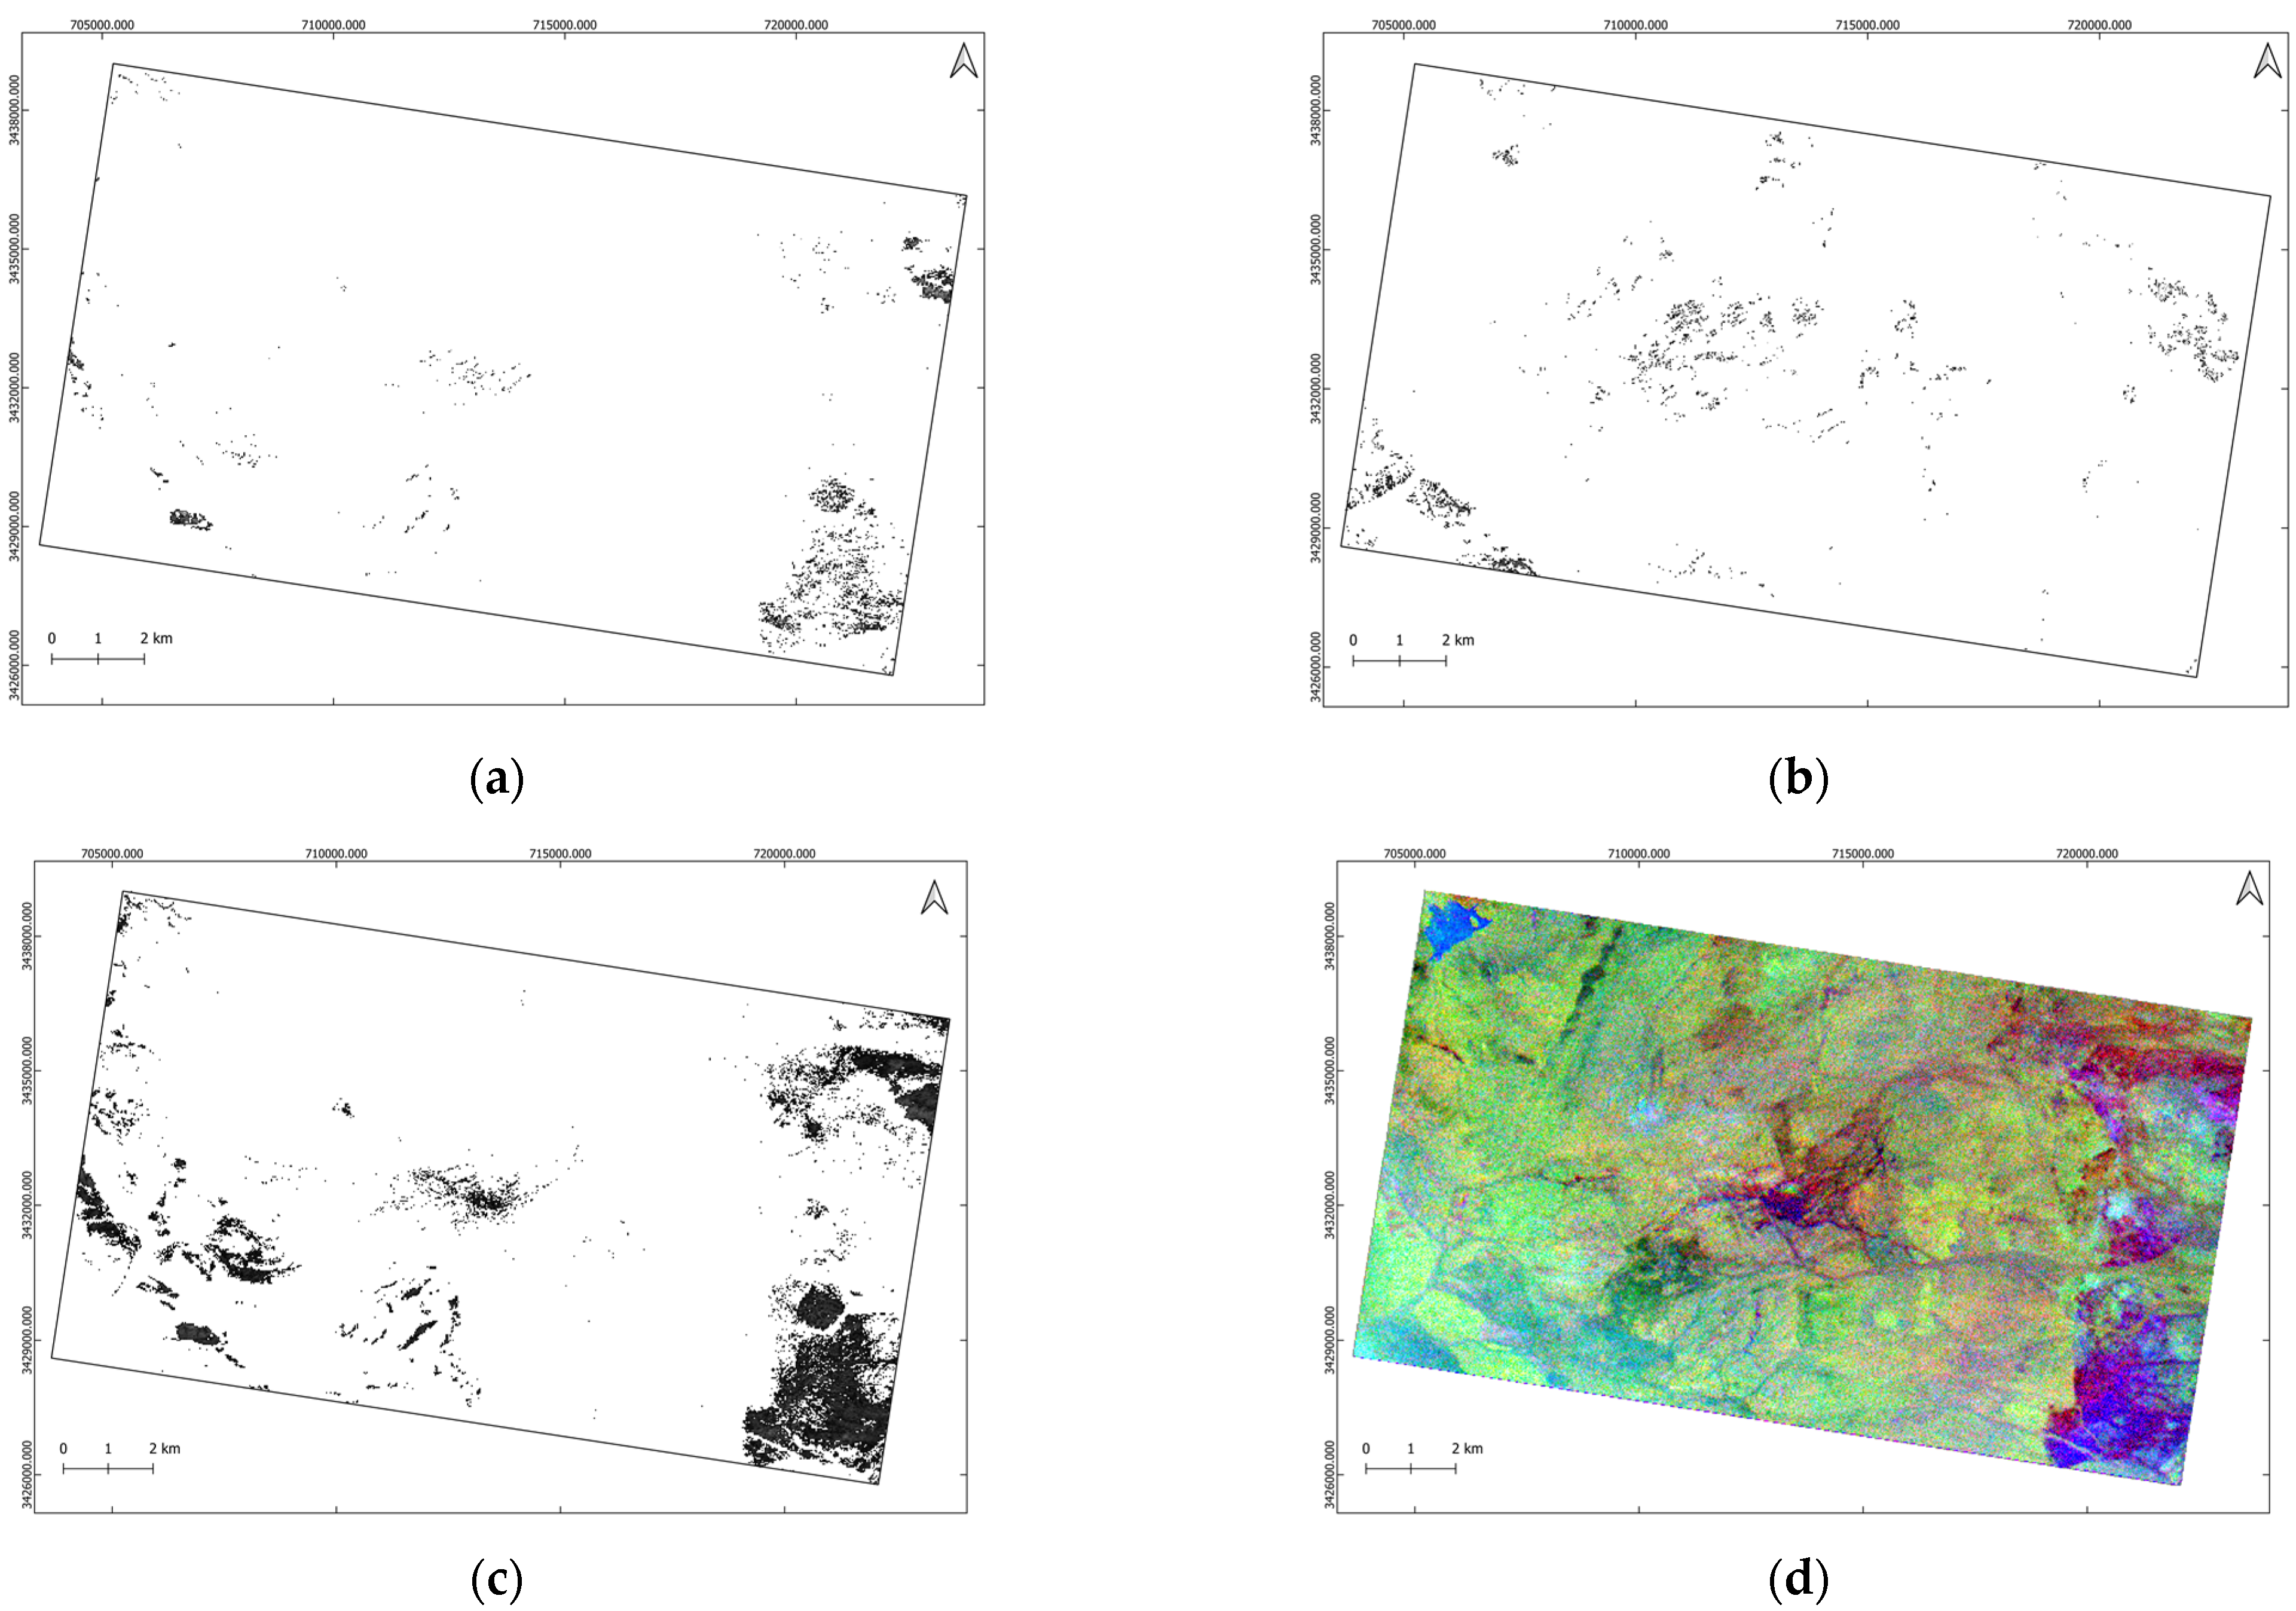
According to the Table 3, bands 4–6 are not suitable for performing RGB color combinations due to their eigenvalues close to 1. Therefore, only MNF bands with an eigenvalue percentage greater than 1 such as bands 1–3 were considered to produce the RGB color combination in this study. Figure 6 shows the RGB color combination of MNF bands 1–3 for the study area. According to this image, the areas that have undergone hydrothermal alteration are yellowish-brown in color, and most of the lithological boundaries are typically visible, which is in good agreement with the geological map of the area (Figure 1). There is also a promising area in the central part of the image.

4.4. Integration of Geological and Alteration Layers

Using Fuzzy-AHP model, all of alteration layers resulted from FCC, BR, PCA and MNF were integrated. In order to increase the accuracy of the integration of information layers, a geological layer containing intrusive masses was also added. Then, according to the experts of mineral exploration, each of the criteria was weighed. The matrix of two-by-two criteria weighting is presented in Table 4. The final rank of the importance of each layer as well as the percentage of their impact in the combination is presented in Table 5.
In order to compare binary and preferential criteria, which are: 1-Geology 2-PCA 3-MNF 4-FCC 5-BR, based on the opinion of mineral exploration experts as well as data processing, a comparison was made. The aim of this study was to investigate the alterations associated with porphyry copper mineralization [31,32,33,34].
Based on the available information layers, the lithology of the region was recognized as the main factor in creating and controlling hydrothermal alterations in the region. Therefore, in binary comparison, it is preferable to all information layers and criteria [1]. In the case of methods PCA, MNF, FCC and BR, which have all been done to identify hydrothermal alterations in the region by analyzing ASTER satellite images, a binary comparison was made based on the validity and accuracy of the methods [35,36,37,38,39,40]. Finally, based on the AHP method, the final rank of each of these criteria was calculated in Table 5.
As can be seen in Table 5, the layers of information, in order of importance high to low, are geology, PCA, MNF, BR and FCC respectively. Each of the information layers was fuzzified and then combined by the AHP method. Based on the results of weighting and determining the degree of importance of each information layer, a combined map of hydrothermal alterations and geological units affecting porphyry copper mineralization was presented in Figure 7. Four high potential zones were identified in the central, western, eastern and northeastern of the study area.

4.5. Field Verification

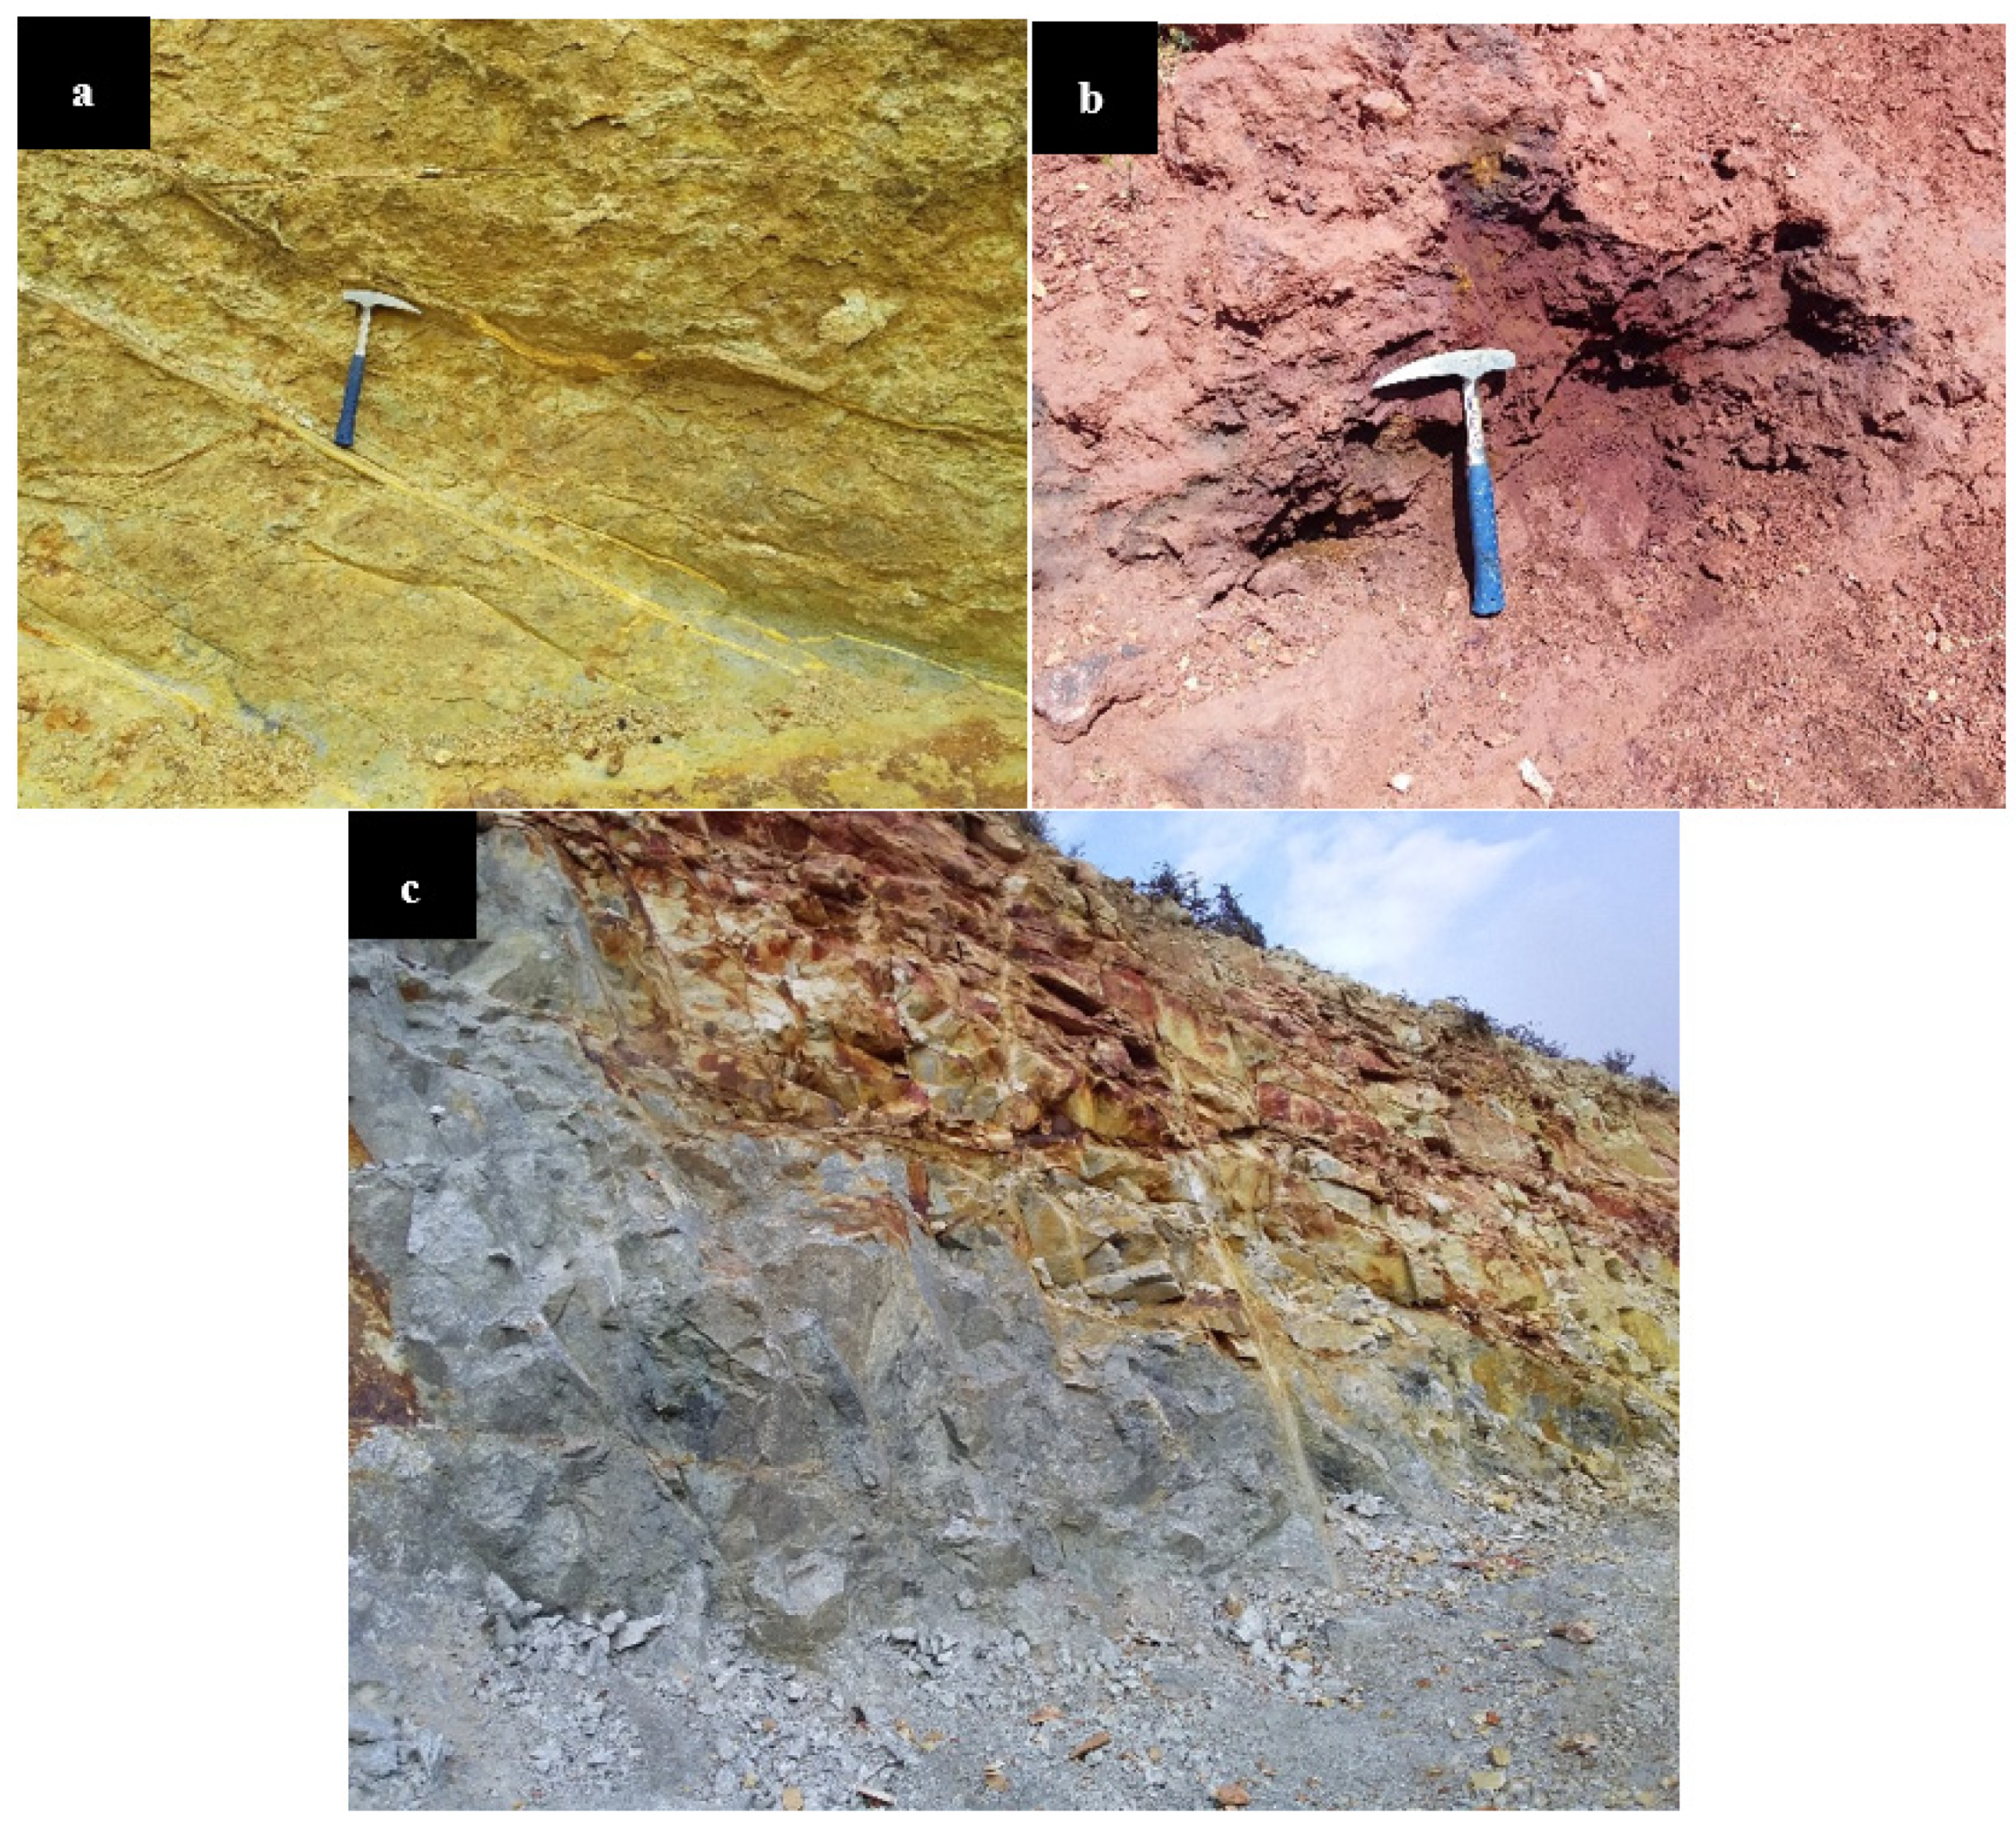
Based on the potential map obtained from the Fuzzy-AHP model, three points of high potential zones were selected for ground control. Argillic alteration was observed at the first control point (Figure 8a). Iron oxide alteration was observed at the second control point (Figure 8b). At the third control point, there was a significant extent of Phyllic alteration (Figure 8c). The locations of all mentioned controlling points are shown in Figure 7. They have clear expansion at the surface with 500 to 1000 m length outcrop. According to the mineralogical studies conducted on samples taken from the target areas, illite/kaolinite, muscovite, goethite, and epidote/ carbonate were the prevalent minerals representing the argillic, phyllic, Fe-Oxide and propylitic alterations, respectively, concluding the compatibility of the field works with results obtained via remote sensing.

5. Conclusions

In this study, a Hybrid Fuzzy-AHP model was developed for porphyry copper prospecting in Simorgh Area, Eastern Lut block of Iran. FCC, band ratio, PCA and MNF techniques were used to identify alteration areas such as phyllic, argillic and propylitic zones associated with copper mineralization. Alteration thematic layers derived from the techniques were weighted and fused to produce a potential map for the study area. Consequently, a potential map for the study area was generated showing four main high potential zones in the central, western, eastern and northeastern sectors of the study area. The approach used in this investigation can be applied to other regions of Eastern Lut block of Iran for porphyry copper prospecting.

Author Contributions

Conceptualization and software, V.K.; methodology and writing, A.S. (Aref Shirazi) and A.S. (Adel Shirazy); supervision, A.H.; writing—review and editing, A.B.P. All authors have read and agreed to the published version of the manuscript.

Funding

This research received no external funding.

Data Availability Statement

Data used in this research in free on USGS website.

Conflicts of Interest

The authors declare no conflict of interest.

References

  1. Beygi, S.; Talovina, I.V.; Tadayon, M.; Pour, A.B. Alteration and structural features mapping in Kacho-Mesqal zone, Central Iran using ASTER remote sensing data for porphyry copper exploration. Int. J. Image Data Fusion 2021, 12, 155–175. [Google Scholar] [CrossRef]
  2. Rowan, L.C.; Hook, S.J.; Abrams, M.J.; Mars, J.C. Mapping hydrothermally altered rocks at Cuprite, Nevada, using the Advanced Spaceborne Thermal Emission and Reflection Radiometer (ASTER), a new satellite-imaging system. Econ. Geol. 2003, 98, 1019–1027. [Google Scholar] [CrossRef]
  3. Shirazi, A.; Shirazy, A.; Karami, J. Remote sensing to identify copper alterations and promising regions, Sarbishe, South Khorasan, Iran. Int. J. Geol. Earth Sci. 2018, 4, 36–52. [Google Scholar]
  4. Mbianya, G.N.; Ngnotue, T.; Wambo, J.D.T.; Ganno, S.; Pour, A.B.; Kenne, P.A.; Fossi, D.H.; Wolf, I.D. Remote sensing satellite-based structural/alteration mapping for gold exploration in the Ketté goldfield, Eastern Cameroon. J. Afr. Earth Sci. 2021, 184, 104386. [Google Scholar] [CrossRef]
  5. Pour, A.B.; Hashim, M. The application of ASTER remote sensing data to porphyry copper and epithermal gold deposits. Ore Geol. Rev. 2012, 44, 1–9. [Google Scholar] [CrossRef] [Green Version]
  6. Moradpour, H.; Paydar, G.R.; Feizizadeh, B.; Blaschke, T.; Pour, A.B.; Kamran, K.V.; Muslim, A.M.; Hossain, M.S. Fusion of ASTER satellite imagery, geochemical and geology data for gold prospecting in the Astaneh granite intrusive, West Central Iran. Int. J. Image Data Fusion 2021, 1–24. [Google Scholar] [CrossRef]
  7. Hunt, G.R.; Ashley, R.P. Spectra of altered rocks in the visible and near infrared. Econ. Geol. 1979, 74, 1613–1629. [Google Scholar] [CrossRef]
  8. Shirazy, A.; Shirazi, A.; Ferdossi, M.H.; Ziaii, M. Geochemical and Geostatistical Studies for Estimating Gold Grade in Tarq Prospect Area by K-Means Clustering Method. Open J. Geol. 2019, 09, 306–326. [Google Scholar] [CrossRef] [Green Version]
  9. Alahgholi, S.; Shirazy, A.; Shirazi, A. Geostatistical Studies and Anomalous Elements Detection, Bardaskan Area, Iran. Open J. Geol. 2018, 8, 697–710. [Google Scholar] [CrossRef] [Green Version]
  10. Zhang, N.; Zhou, K.; Du, X. Application of fuzzy logic and fuzzy AHP to mineral prospectivity mapping of porphyry and hydrothermal vein copper deposits in the Dananhu-Tousuquan island arc, Xinjiang, NW China. J. Afr. Earth Sci. 2017, 128, 84–96. [Google Scholar] [CrossRef]
  11. Ghezelbash, R.; Maghsoudi, A.; Daviran, M. Implementation of Fuzzy-AHP and Fuzzy-GAMMA approaches for discovering the prospectivity areas of Au mineralization in Takhte-Soleyman district. Res. Earth Sci. 2019, 10, 143–162. [Google Scholar] [CrossRef]
  12. Khalifani, F.; Bahroudi, A.; Barak, S.; Abedi, M. An integrated Fuzzy AHP-VIKOR method for Gold Potential Mapping in Saqez prospecting zone, Iran. Earth Obs. Geomat. Eng. 2019, 3, 21–33. [Google Scholar]
  13. Berberian, M.; King, G.C.P. Towards a paleogeography and tectonic evolution of Iran. Can. J. Earth Sci. 1981, 18, 210–265. [Google Scholar] [CrossRef]
  14. Ghorbani, M. Geological Setting and Crustal Structure of Iran. In The Geology of Iran: Tectonic, Magmatism and Metamorphism; Springer: Berlin/Heidelberg, Germany, 2021; pp. 1–22. [Google Scholar] [CrossRef]
  15. Borabadi, R.; Mazaheri, S.; Karimpour, M. Geology, alteration, mineralization and geochemical exploration in Simorgh prospective area, southwest of Nehbandan, South Khorasan. Iran. J. Crystallogr. Mineral. 2015, 4, 625–638. [Google Scholar]
  16. Karjoo. Report on the End of the Semi-Detailed Exploration Phase (Deh-Salm Region); GSI: South Khorasan, Iran, 2014; p. 140. [Google Scholar]
  17. Ahmadi, H.; Kalkan, K. Mapping of Ophiolitic Complex in Logar and Surrounding Areas (SE Afghanistan) With ASTER Data. J. Indian Soc. Remote Sens. 2021, 49, 1271–1284. [Google Scholar] [CrossRef]
  18. Shirazy, A.; Shirazi, A.; Laki, S.H.; Ziaii, M. Exploratory Remote Sensing Studies to Determine the Mineralization Zones around the Zarshuran Gold Mine. Int. J. Sci. Eng. Appl. 2018, 7, 274–279. [Google Scholar] [CrossRef]
  19. Ahmadi, H.; Rahmani, A.B. Study on The Mineral Anomalies Of Muqur-Chaman Fault And Its Comparison With Harirud (Herat) Fault (Afghanistan) Using Geophysical And Remote Sensing (Aster-Hymap) Data. Геoлoгия И Охрана Недр 2018, 1, 28–38. [Google Scholar]
  20. Crosta, A.; Filho, C.R.S.; Azevedo, F.; Brodie, C. Targeting key alteration minerals in epithermal deposits in Patagonia, Argentina, using ASTER imagery and principal component analysis. Int. J. Remote Sens. 2003, 24, 4233–4240. [Google Scholar] [CrossRef]
  21. Di Tommaso, I.; Rubinstein, N. Hydrothermal alteration mapping using ASTER data in the Infiernillo porphyry deposit, Argentina. Ore Geol. Rev. 2007, 32, 275–290. [Google Scholar] [CrossRef]
  22. Shirazi, A.; Hezarkhani, A.; Shirazy, A. Remote Sensing Studies for Mapping of Iron Oxide Regions, South of Kerman, Iran. Int. J. Sci. Eng. Appl. 2018, 7, 045–051. [Google Scholar] [CrossRef]
  23. Shirazy, A.; Ziaii, M.; Hezarkhani, A.; Timkin, T. Geostatistical and Remote Sensing Studies to Identify High Metallogenic Potential Regions in the Kivi Area of Iran. Minerals 2020, 10, 869. [Google Scholar] [CrossRef]
  24. Hamimi, Z.; Hagag, W.; Kamh, S.; El-Araby, A. Application of remote-sensing techniques in geological and structural mapping of Atalla Shear Zone and Environs, Central Eastern Desert, Egypt. Arab. J. Geosci. 2020, 13, 1–27. [Google Scholar] [CrossRef]
  25. Guha, A.; Ghosh, U.K.; Sinha, J.; Pour, A.B.; Bhaisal, R.; Chatterjee, S.; Baranval, N.K.; Rani, N.; Kumar, K.V.; Rao, P.V.N. Potentials of Airborne Hyperspectral AVIRIS-NG Data in the Exploration of Base Metal Deposit—A Study in the Parts of Bhilwara, Rajasthan. Remote Sens. 2021, 13, 2101. [Google Scholar] [CrossRef]
  26. Shirazi, A.; Hezarkhani, A.; Shirazy, A. Exploration Geochemistry Data-Application for Cu Anomaly Separation Based On Classical and Modern Statistical Methods in South Khorasan, Iran. Int. J. Sci. Eng. Appl. 2018, 7, 039–044. [Google Scholar] [CrossRef]
  27. Uddin, M.P.; Mamun, M.A.; Hossain, M.A. PCA-based feature reduction for hyperspectral remote sensing image classification. IETE Tech. Rev. 2021, 38, 377–396. [Google Scholar] [CrossRef]
  28. Ghrefat, H.; Kahal, A.Y.; Abdelrahman, K.; Alfaifi, H.J.; Qaysi, S. Utilization of multispectral landsat-8 remote sensing data for lithological mapping of southwestern Saudi Arabia. J. King Saud Univ.-Sci. 2021, 33, 101414. [Google Scholar] [CrossRef]
  29. Abdelkareem, M.; Hamimi, Z.; El-Bialy, M.Z.; Khamis, H.; Wahed, S.A.A. Integration of remote-sensing data for mapping lithological and structural features in the Esh El-Mallaha area, west Gulf of Suez, Egypt. Arab. J. Geosci. 2021, 14, 1–14. [Google Scholar] [CrossRef]
  30. Guha, A.; Kumar, K.V.; Rao, E.N.D.; Parveen, R. An image processing approach for converging ASTER-derived spectral maps for mapping Kolhan limestone, Jharkhand, India. Curr. Sci. 2014, 40–49. Available online: https://www.jstor.org/stable/24099861 (accessed on 10 October 2021).
  31. Chang, D.-Y. Applications of the extent analysis method on fuzzy AHP. Eur. J. Oper. Res. 1996, 95, 649–655. [Google Scholar] [CrossRef]
  32. Azizi, H.; Tarverdi, M.; Akbarpour, A. Extraction of hydrothermal alterations from ASTER SWIR data from east Zanjan, northern Iran. Adv. Space Res. 2010, 46, 99–109. [Google Scholar] [CrossRef]
  33. Mars, J.C.; Rowan, L.C. Spectral assessment of new ASTER SWIR surface reflectance data products for spectroscopic mapping of rocks and minerals. Remote Sens. Environ. 2010, 114, 2011–2025. [Google Scholar] [CrossRef]
  34. Rajan Girija, R.; Mayappan, S. Mapping of mineral resources and lithological units: A review of remote sensing techniques. Int. J. Image Data Fusion 2019, 10, 79–106. [Google Scholar] [CrossRef]
  35. Shirazy, A.; Hezarkhani, A.; Timkin, T.; Shirazi, A. Investigation of Magneto-/Radio-Metric Behavior in Order to Identify an Estimator Model Using K-Means Clustering and Artificial Neural Network (ANN) (Iron Ore Deposit, Yazd, IRAN). Minerals 2021, 11, 1304. [Google Scholar] [CrossRef]
  36. Shirazy, A.; Shirazi, A.; Hezarkhani, A. Predicting gold grade in Tarq 1: 100000 geochemical map using the behavior of gold, Arsenic and Antimony by K-means method. J. Miner. Resour. Eng. 2018, 2, 11–23. [Google Scholar]
  37. Doodran, R.J.; Khakmardan, S.; Shirazi, A.; Shirazy, A. Minimalization of Ash from Iranian Gilsonite by Froth Flotation. J. Miner. Mater. Charact. Eng. 2020, 9, 1–13. [Google Scholar] [CrossRef]
  38. Khayer, K.; Shirazy, A.; Shirazi, A. Permeability Estimation from Stoneley Waves in Carbonate Reservoirs. Türkiye Jeol. Bülteni 2022, 65, 1–8. [Google Scholar] [CrossRef]
  39. Shirazi, A.; Shirazy, A.; Nazerian, H.; Khakmardan, S. Geochemical and Behavioral Modeling of Phosphorus and Sulfur as Deleterious Elements of Iron Ore to Be Used in Geometallurgical Studies, Sheytoor Iron Ore, Iran. Open J. Geol. 2021, 11, 596–620. [Google Scholar] [CrossRef]
  40. Shirazy, A.; Shirazi, A.; Nazerian, H. Application of Remote Sensing in Earth Sciences–A Review. Int. J. Sci. Eng. Appl. 2021, 10, 45–51. [Google Scholar]
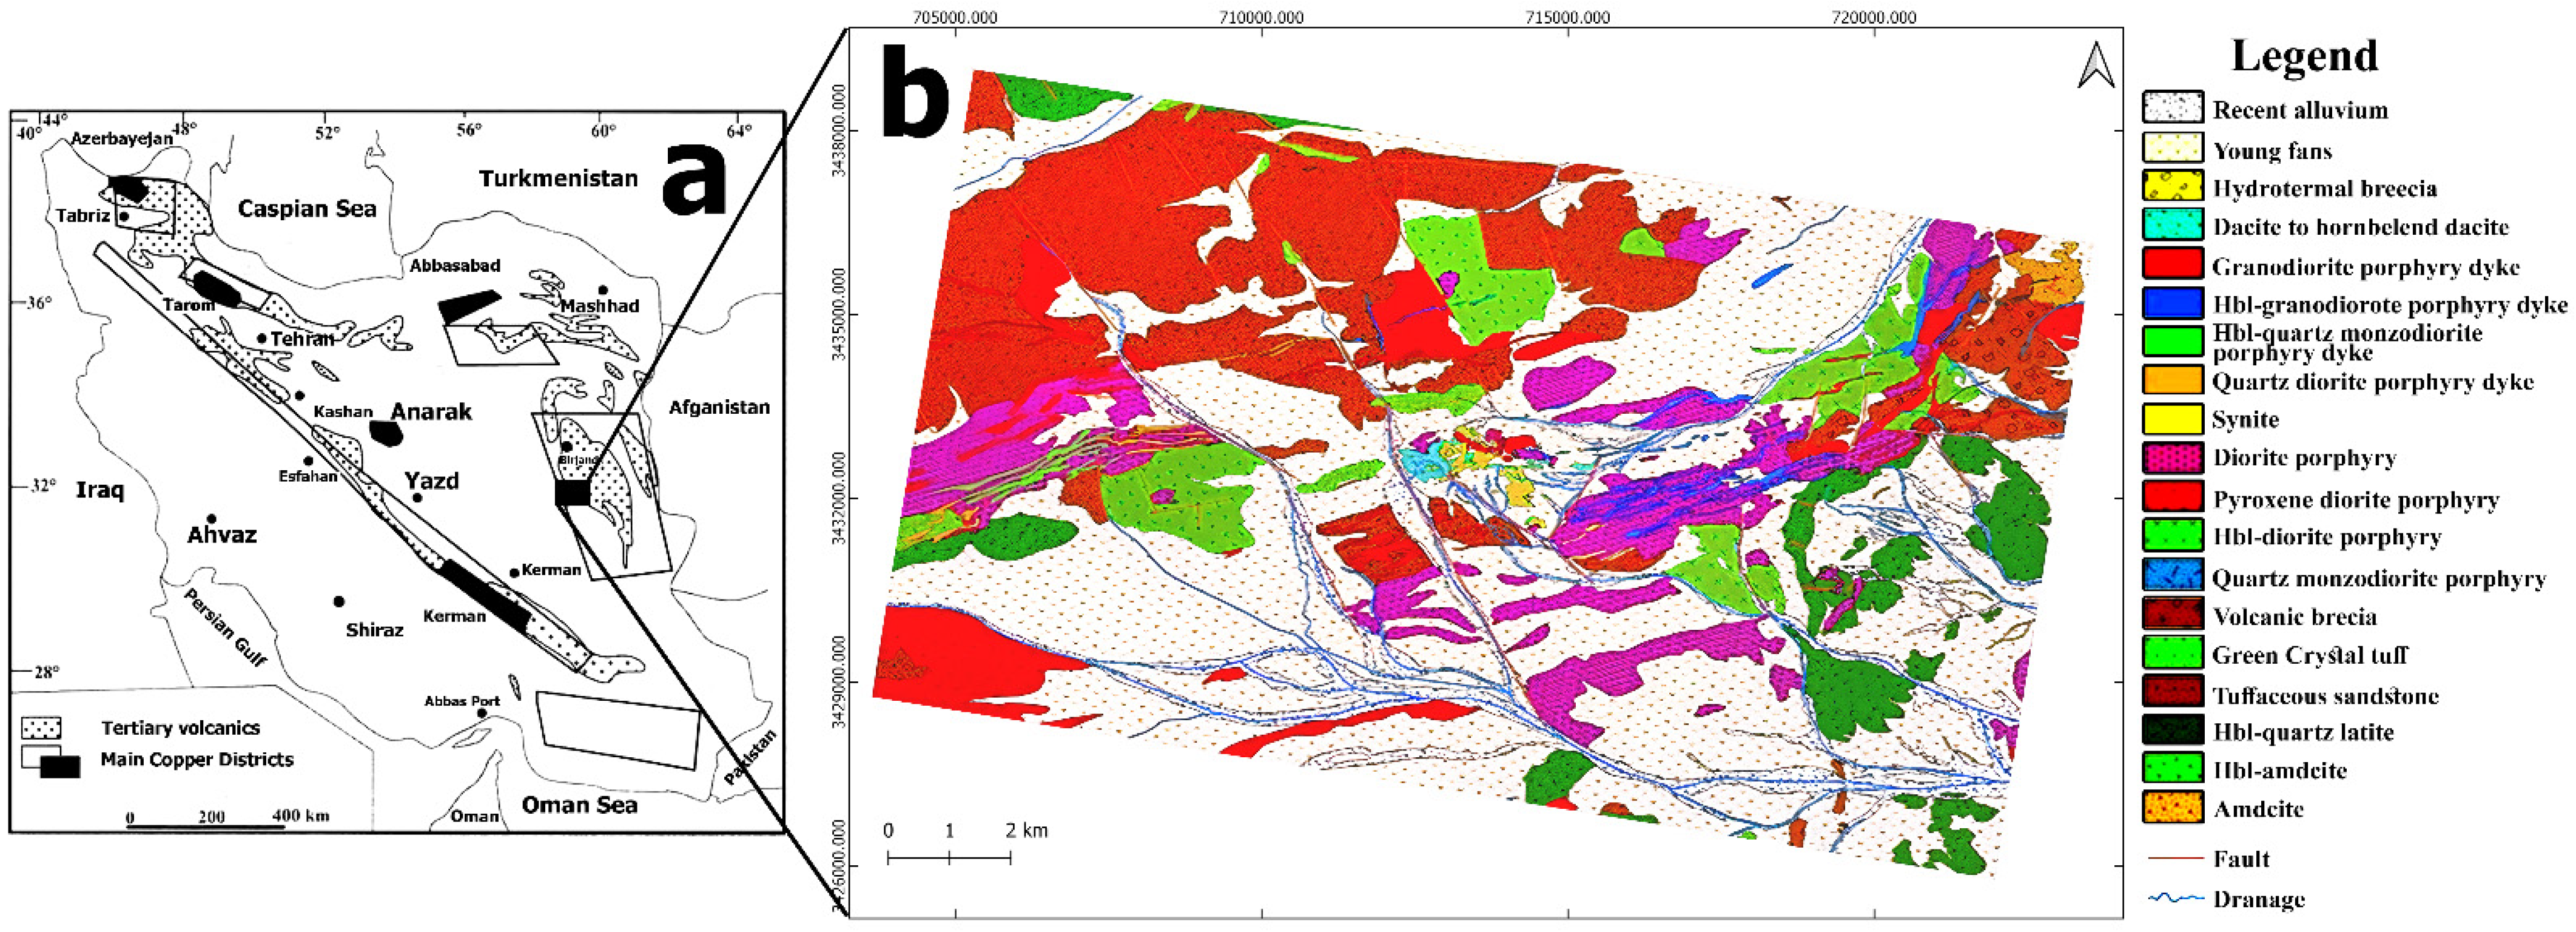
Figure 1. (a) Geographical location of Simorgh area in Iran; (b) Geological map of Simorgh area (World Geodetic System 1984 (WGS 84), UTM zone 40 N) [15].
Mining 02 00001 g001
Figure 2. Hierarchical structure for modeling copper mineralization potential in Simorgh region.
Mining 02 00001 g002
Figure 3. RGB color combination of bands 4, 6 and 8 to detect propylitic and phyllic alterations. Propylitic alteration zone appears in green color, while phyllic alteration is depicted in pink to yellow. 4.2. Band Ratio (BR).
Mining 02 00001 g003
Figure 4. RGB color combination of 7/6, 5/6 and 8/9 (R: 7/6, G: 5/6, B: 8/9) image-map of the study area.
Mining 02 00001 g004
Figure 5. (a) PC4 image, (b) PC5 image, (c) PC7 image (target areas are represented by black pixels), (d) RGB color combination of PC4, PC5, PC7 (The threshold values were set to 0.28, 0.33 and 0.42 for PC4, PC5 and PC7, respectively).
Mining 02 00001 g005
Figure 6. Color combination of MNF bands 1–3 for the study area (Thresholds: >0.43, 0.41, 0.37 for bands 1–3, respectively).
Mining 02 00001 g006
Figure 7. Potential map of the study area generated from Fuzzy-AHP model. (+80% is acceptable). The inserted cubs (a, b and c) are field checkpoints.
Mining 02 00001 g007
Figure 8. Field photographs of control points. (a) argillic alteration, (b) iron oxide alteration (c) Phyllic alteration.
Mining 02 00001 g008
Table 1. Aster spectral bands.
BandReflected Range (µm)Spatial Resolution (m)BandReflected Range (µm)Spatial Resolution (m)
10.52–0.6015 m82.295–2.36530 m
20.63–0.6915 m92.360–2.43030 m
3N0.78–0.8615 m108.125–8.47590 m
3B0.78–0.8615 m118.475–8.82590 m
41.600–1.70030 m128.925–9.27590 m
52.145–2.18530 m1310.25–10.9590 m
62.185–2.22530 m1410.95–11.6590 m
72.235–2.28530 m
Table 2. Statistical results obtained from principal component analysis.
PCs1st Band2nd Band3rd Band4th Band5th Band6th Band7th Band8th Band9th BandEigenvalue (%)
PC10.3310.3340.3350.3320.330.3380.3390.3330.33791.6
PC20.3210.260.2640.2150.1950.143−0.457−0.472−0.4705.6
PC3−0.764−0.0360.1040.059−0.2510.5630.020.1290.0311.1
PC40.108−0.4150.4920.610.283−0.3480.015−0.6720.2050.94
PC5−0.170−0.3050.2650.519−0.283−0.1010.1190.040.3190.42
PC60.024−0.5410.064−0.1620.230.159−0.205−0.224−0.4070.19
PC70.2680.0270.1620.641−0.3810.101−0.219−0.0470.0130.09
PC8−0.041−0.2610.2070.30.06−0.2910.262−0.6700.4350.04
PC90.292−0.026−0.076−0.1630.2580.3170.152−0.3200.1680.02
Table 3. Statistical results obtained from MNF conversion.
MNF BandEigenvalueVariance (%)
182.381.7
28.548.48
35.415.37
41.661.65
51.511.5
61.311.3
Table 4. The matrix of two-by-two criteria weighting.
GeologyPCAMNFBRFCC
Geology15332
PCA0.21322
MNF0.330.33142
BR0.330.50.2511
FCC0.50.50.511
Table 5. Percentage and importance of information layers.
PriorityRank
Geology43.40%1
PCA20.90%2
MNF16.60%3
FCC10.60%4
BR8.60%5
Publisher’s Note: MDPI stays neutral with regard to jurisdictional claims in published maps and institutional affiliations.