Article

Required Plug Strength for Continuously Poured Cemented Paste Backfill in Longhole Stopes

1
Department of Civil & Mineral Engineering, Faculty of Applied Science and Engineering, University of Toronto, Toronto, ON M5S 1A4, Canada
2
Bawden Engineering, Toronto, ON M4S 3H7, Canada
3
Mine Backfill Geomechanics Inc., London, ON N6A 2X1, Canada
*
Author to whom correspondence should be addressed.
Mining 2021, 1(1), 80-99; https://doi.org/10.3390/mining1010006
Submission received: 19 March 2021 / Revised: 9 April 2021 / Accepted: 12 April 2021 / Published: 15 April 2021

Abstract

:
Continuously poured paste backfill dramatically improves underground mining efficiency through reduced stope cycle time and simplified logistics. For longhole stopes, a backfill “plug” is poured to a few meters above the undercut brow and must gain sufficient strength to prevent failure through the plug when the “main” pour begins. A novel, rational engineering design approach that determines the required plug strength is developed. The potential failure mechanism during continuous pouring is identified and the theoretical solution and its numerical validation/calibration are discussed. Four field case histories are then used, three of them involving continuous pours, to demonstrate the theoretical solution’s validity in back-analysis. These case studies are unique in the extent and quality of total stress and water pressure measurements made throughout backfilling. Additionally, comprehensive laboratory data are available to characterize strength development during binder hydration in the first few days, which are critical to the back-analyses. Results indicate that continuous backfilling is feasible with reasonably attainable backfill strengths at most mines. However, mines must undertake comprehensive early strength laboratory testing, and must carry out field measurements during the pour to ensure the placed backfill behaviour is consistent with the analysis assumptions.

1. Introduction

Ongoing underground mining and progressive orebody extraction can generate dangerous stress concentrations leading to rockbursts, especially in deep orebodies. Backfill provides global support to the host rock and as such it is integral to mining strategies that mitigate rockburst hazard. Cemented paste backfill (CPB) is increasingly favored over other backfilling methods (rock fill and hydraulic fill) due to shortest filling time, uniform as-placed engineered properties, and tight filling potential of the excavated volume. For longhole stopes, a CPB containment structure (usually a shotcrete barricade or rammerjam rock berm) is constructed in the undercut and then a CPB “plug” is poured to a few meters above the undercut brow. This CPB plug must develop sufficient strength to protect the containment structure from the further effects of the “main” pour in the remainder of the stope’s volume. Ideally, the required CPB plug strength will be realized during the plug pour so that once the CPB reaches the desired plug height the backfill plant can change to the main pour mix design (assuming this is different from the plug pour mix design) and continuously deliver CPB until the entire stope is filled.
No rational process exists to determine required CPB plug strength before starting the main pour (including for the most desirable scenario, a continuous pour). Some mines continuously pour CPB using empirically developed procedures [1], but these do not provide insight into the factors controlling CPB plug stability and cannot be universally applied. One well-cited industry handbook suggests the CPB should attain a “strength” (presumably unconfined compressive strength, U C S ) 150 kPa [2], but no explanation or substantiating case histories are provided. Whether mines use U C S = 150 kPa or some other target strength, there are trade-offs to how such strength is achieved. Some mines use higher binder content in the CPB plug to realize higher early strength, while others use a “cure period” after the plug pour (in some cases, several days) prior to backfilling the remainder of the stope. Regardless, if the target CPB strength is higher than necessary, either too much binder is being consumed or the stope cycle time is unnecessarily long, respectively.
The implications of insufficient CPB plug strength leading to barricade failure include fatality, damaged plant, and production delays. Four CPB failures reported by [3] and five by [4] highlight various potential contributing factors, but in all cases the failure mechanism through the CPB plug is washed out once the barricade is breached, making it impossible to identify progressive failure details. There is, therefore, urgent need to develop rational engineering design procedures (laboratory test methods, analysis methods, and field monitoring methods) to continuously pour CPB safely and economically.
The problem just described falls into the “data-limited, understanding-limit” class considered by [5], where numerical modeling should be used to explore potential failure mechanisms, understand the impact of different material behaviour assumptions, and identify the data and understanding further needed to better analyze the problem. An important step in this process is making appropriate simplifying assumptions: Start with the simplest model that seems to capture essential system behaviour, and only add complexity as needed. Therefore, field data that motivates the developed system idealization, and which facilitates analytical and numerical solutions is initially considered. Subsequently the solution is applied to four case histories where sufficient field monitoring and laboratory testing data exists to reasonably assess the predictive solution’s validity. Steps that other mines can take towards rationally engineering continuously poured CPB are then discussed.

2. Predictive Model Development, Validation, and Calibration

The simplifying assumptions used in developing the analytic solution are considered first. These motivate an analytic solution based in part on the Prandtl solution for footing bearing capacity in undrained clay. Numerical analysis is then used to validate and calibrate the analytic solution. Finally, a design procedure based on the solution is proposed.

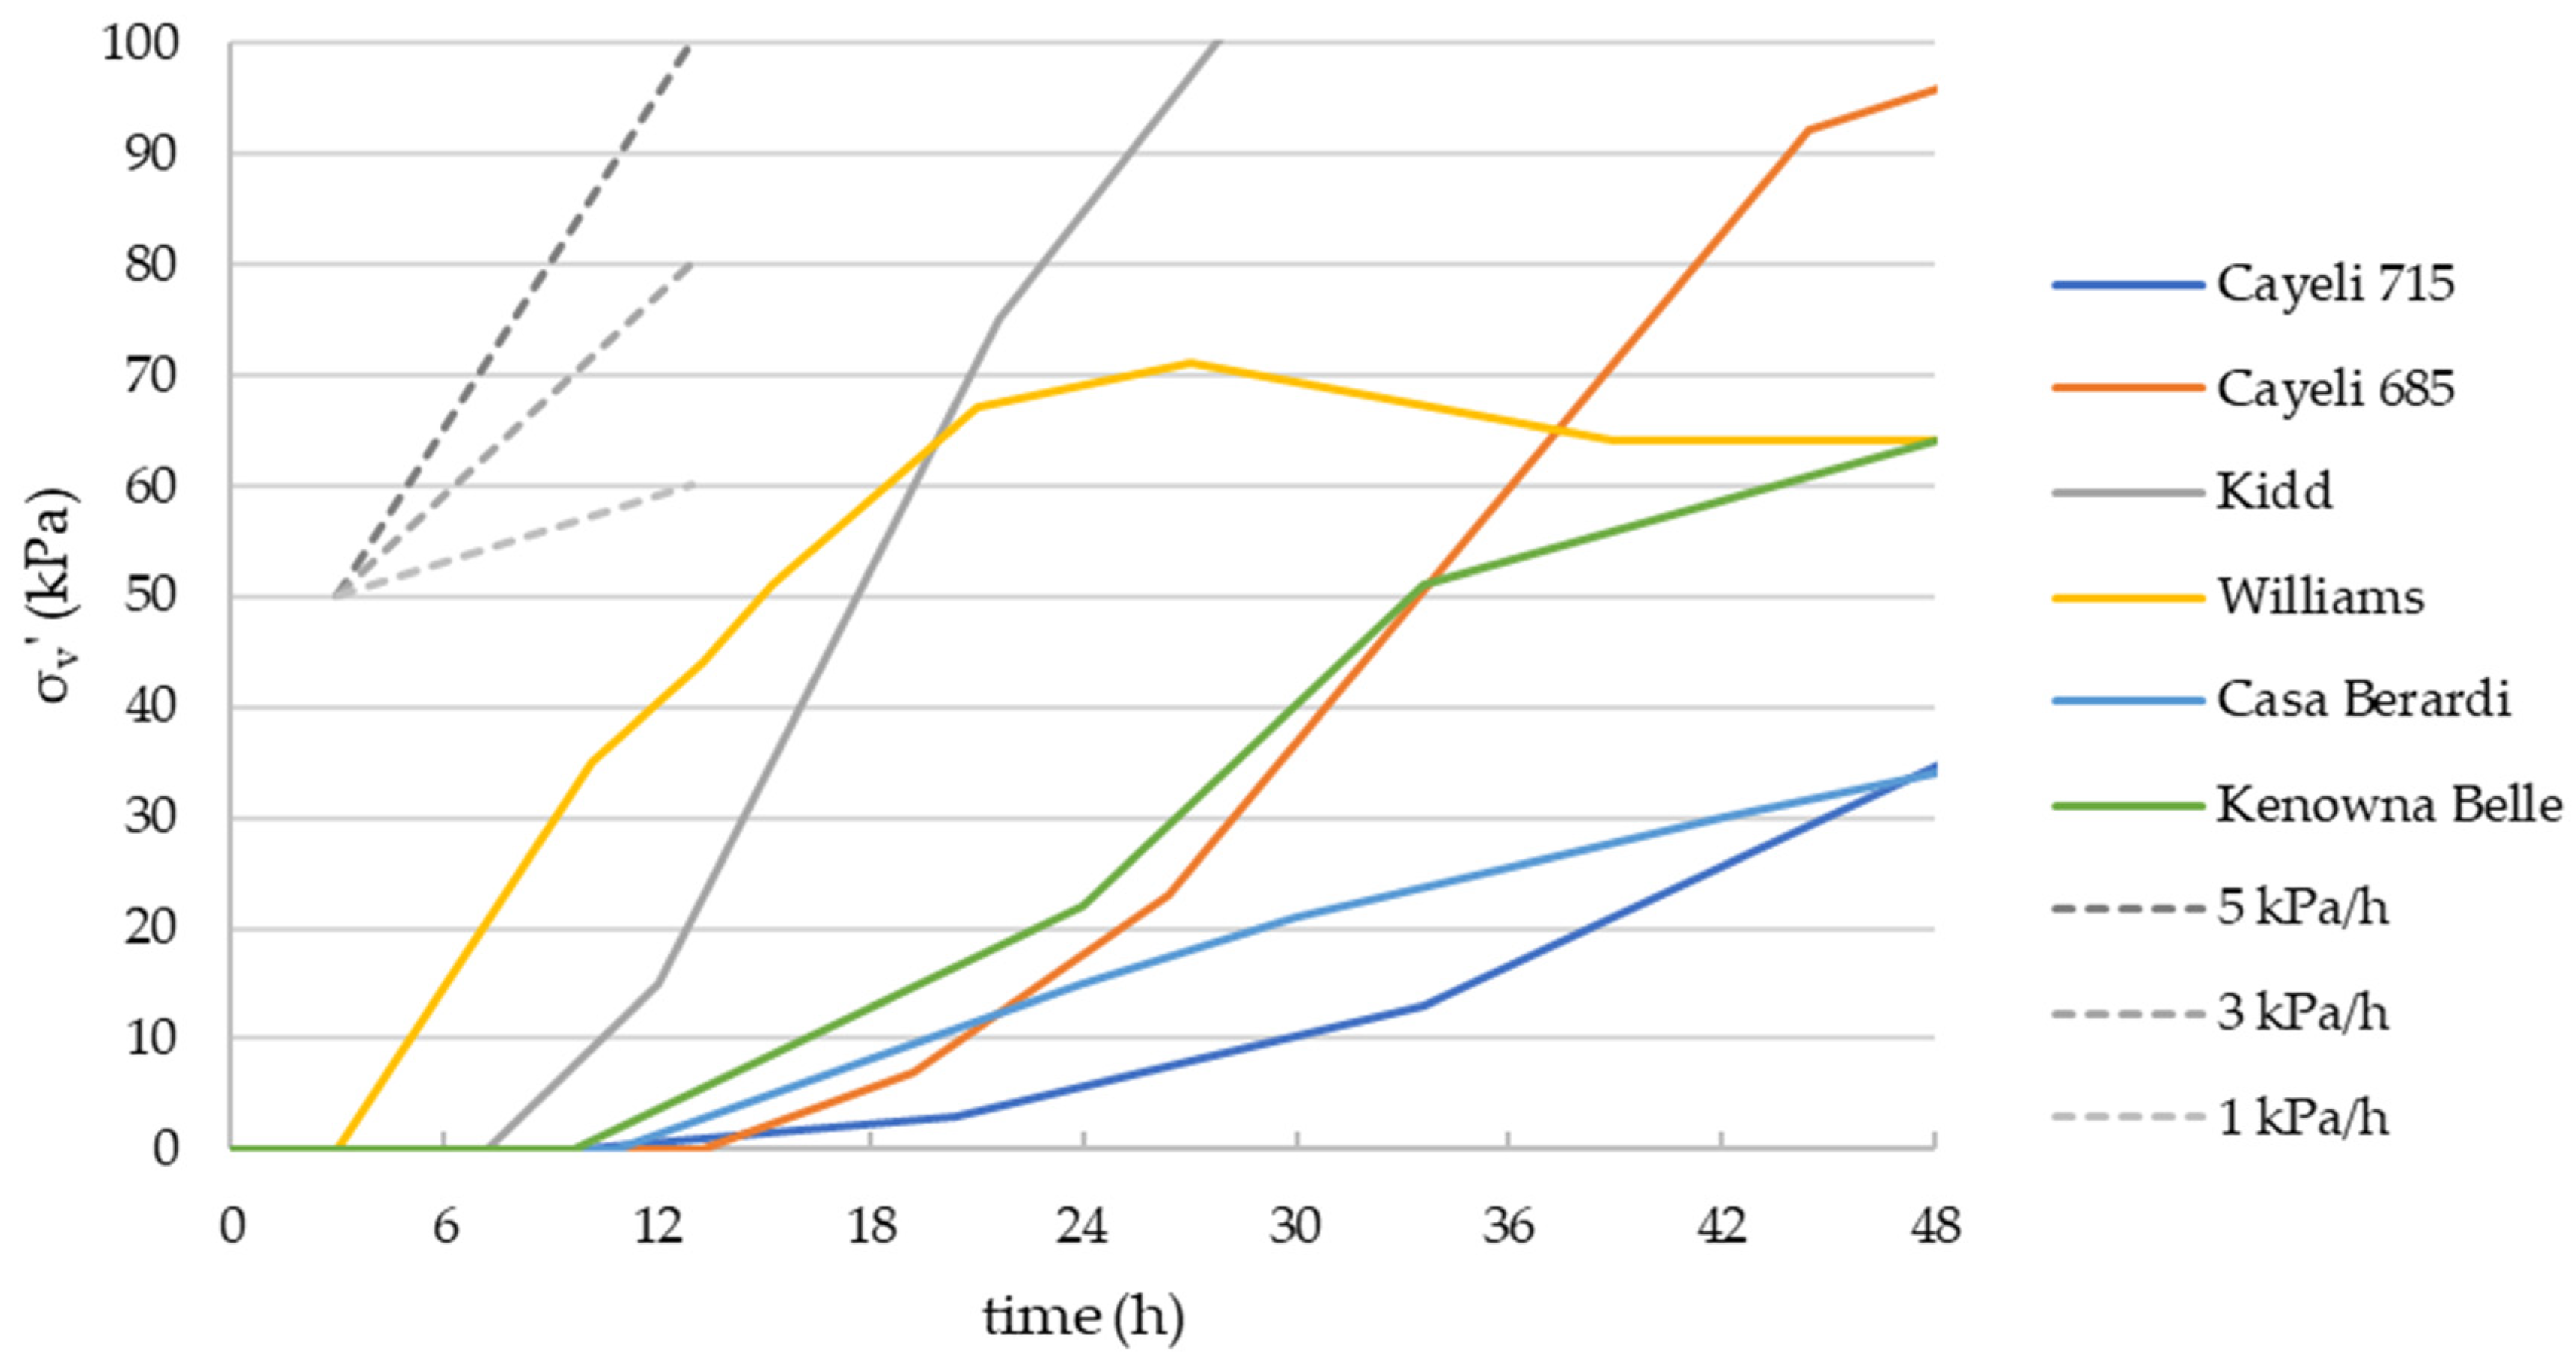
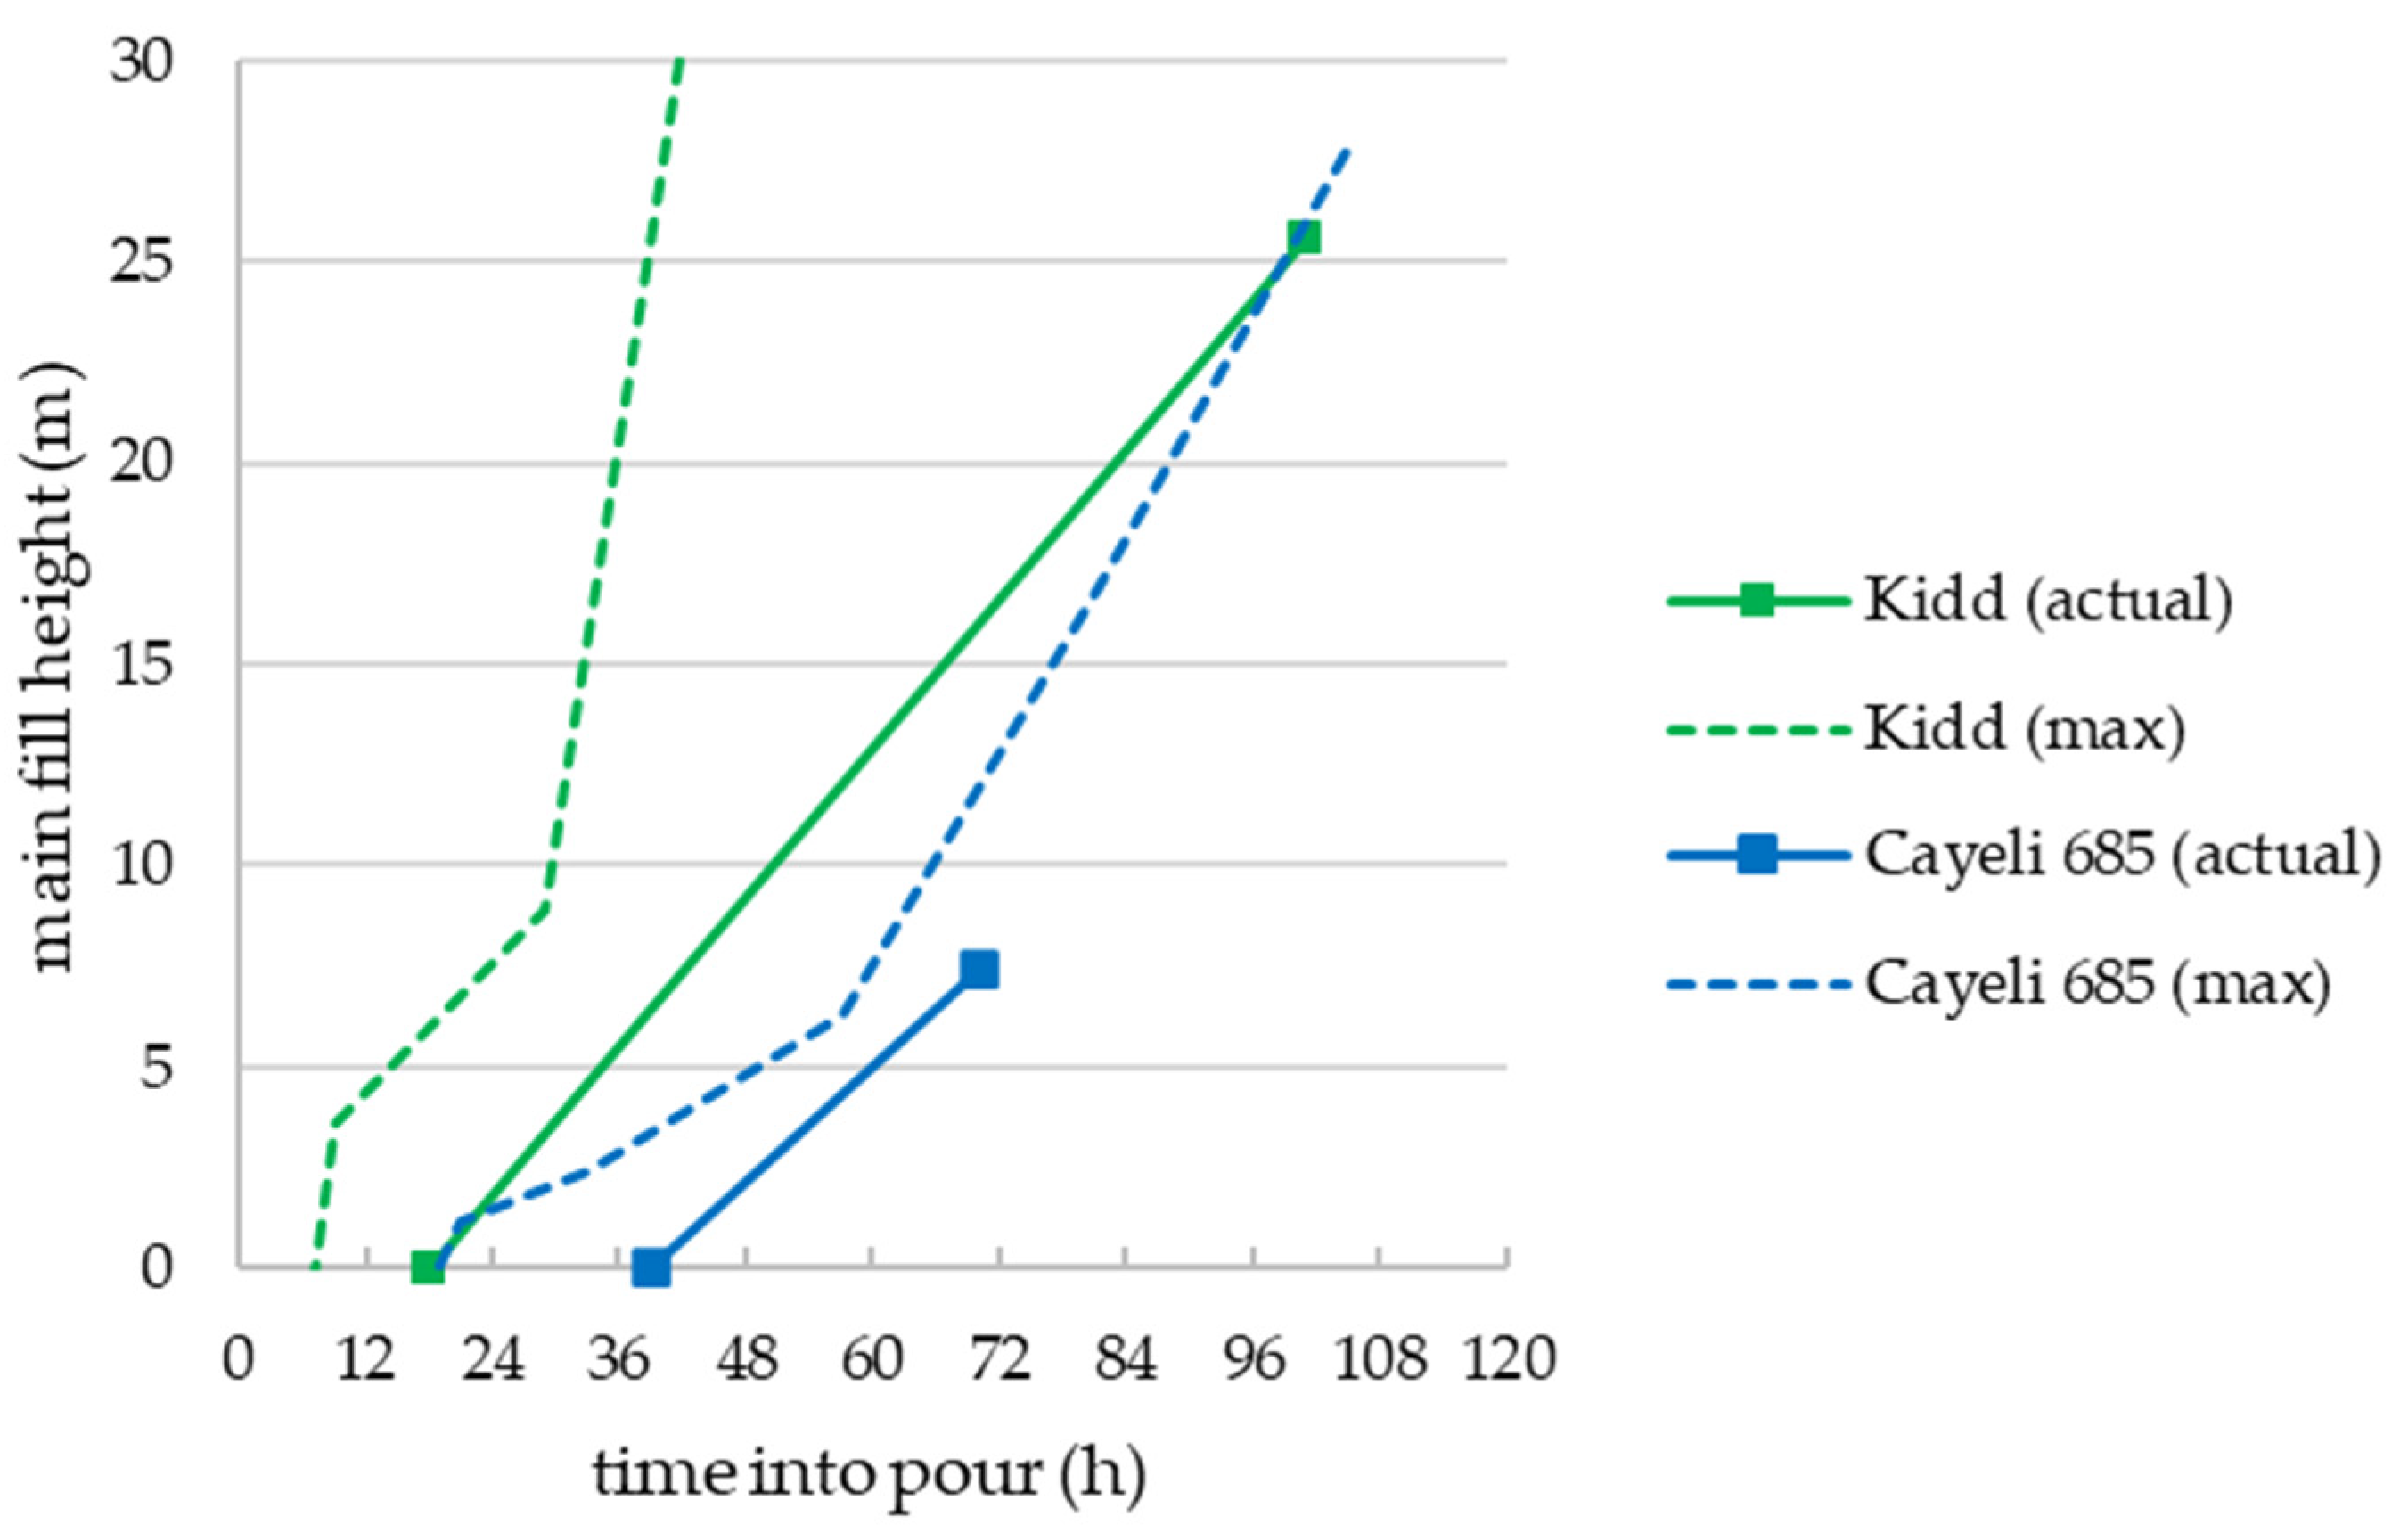
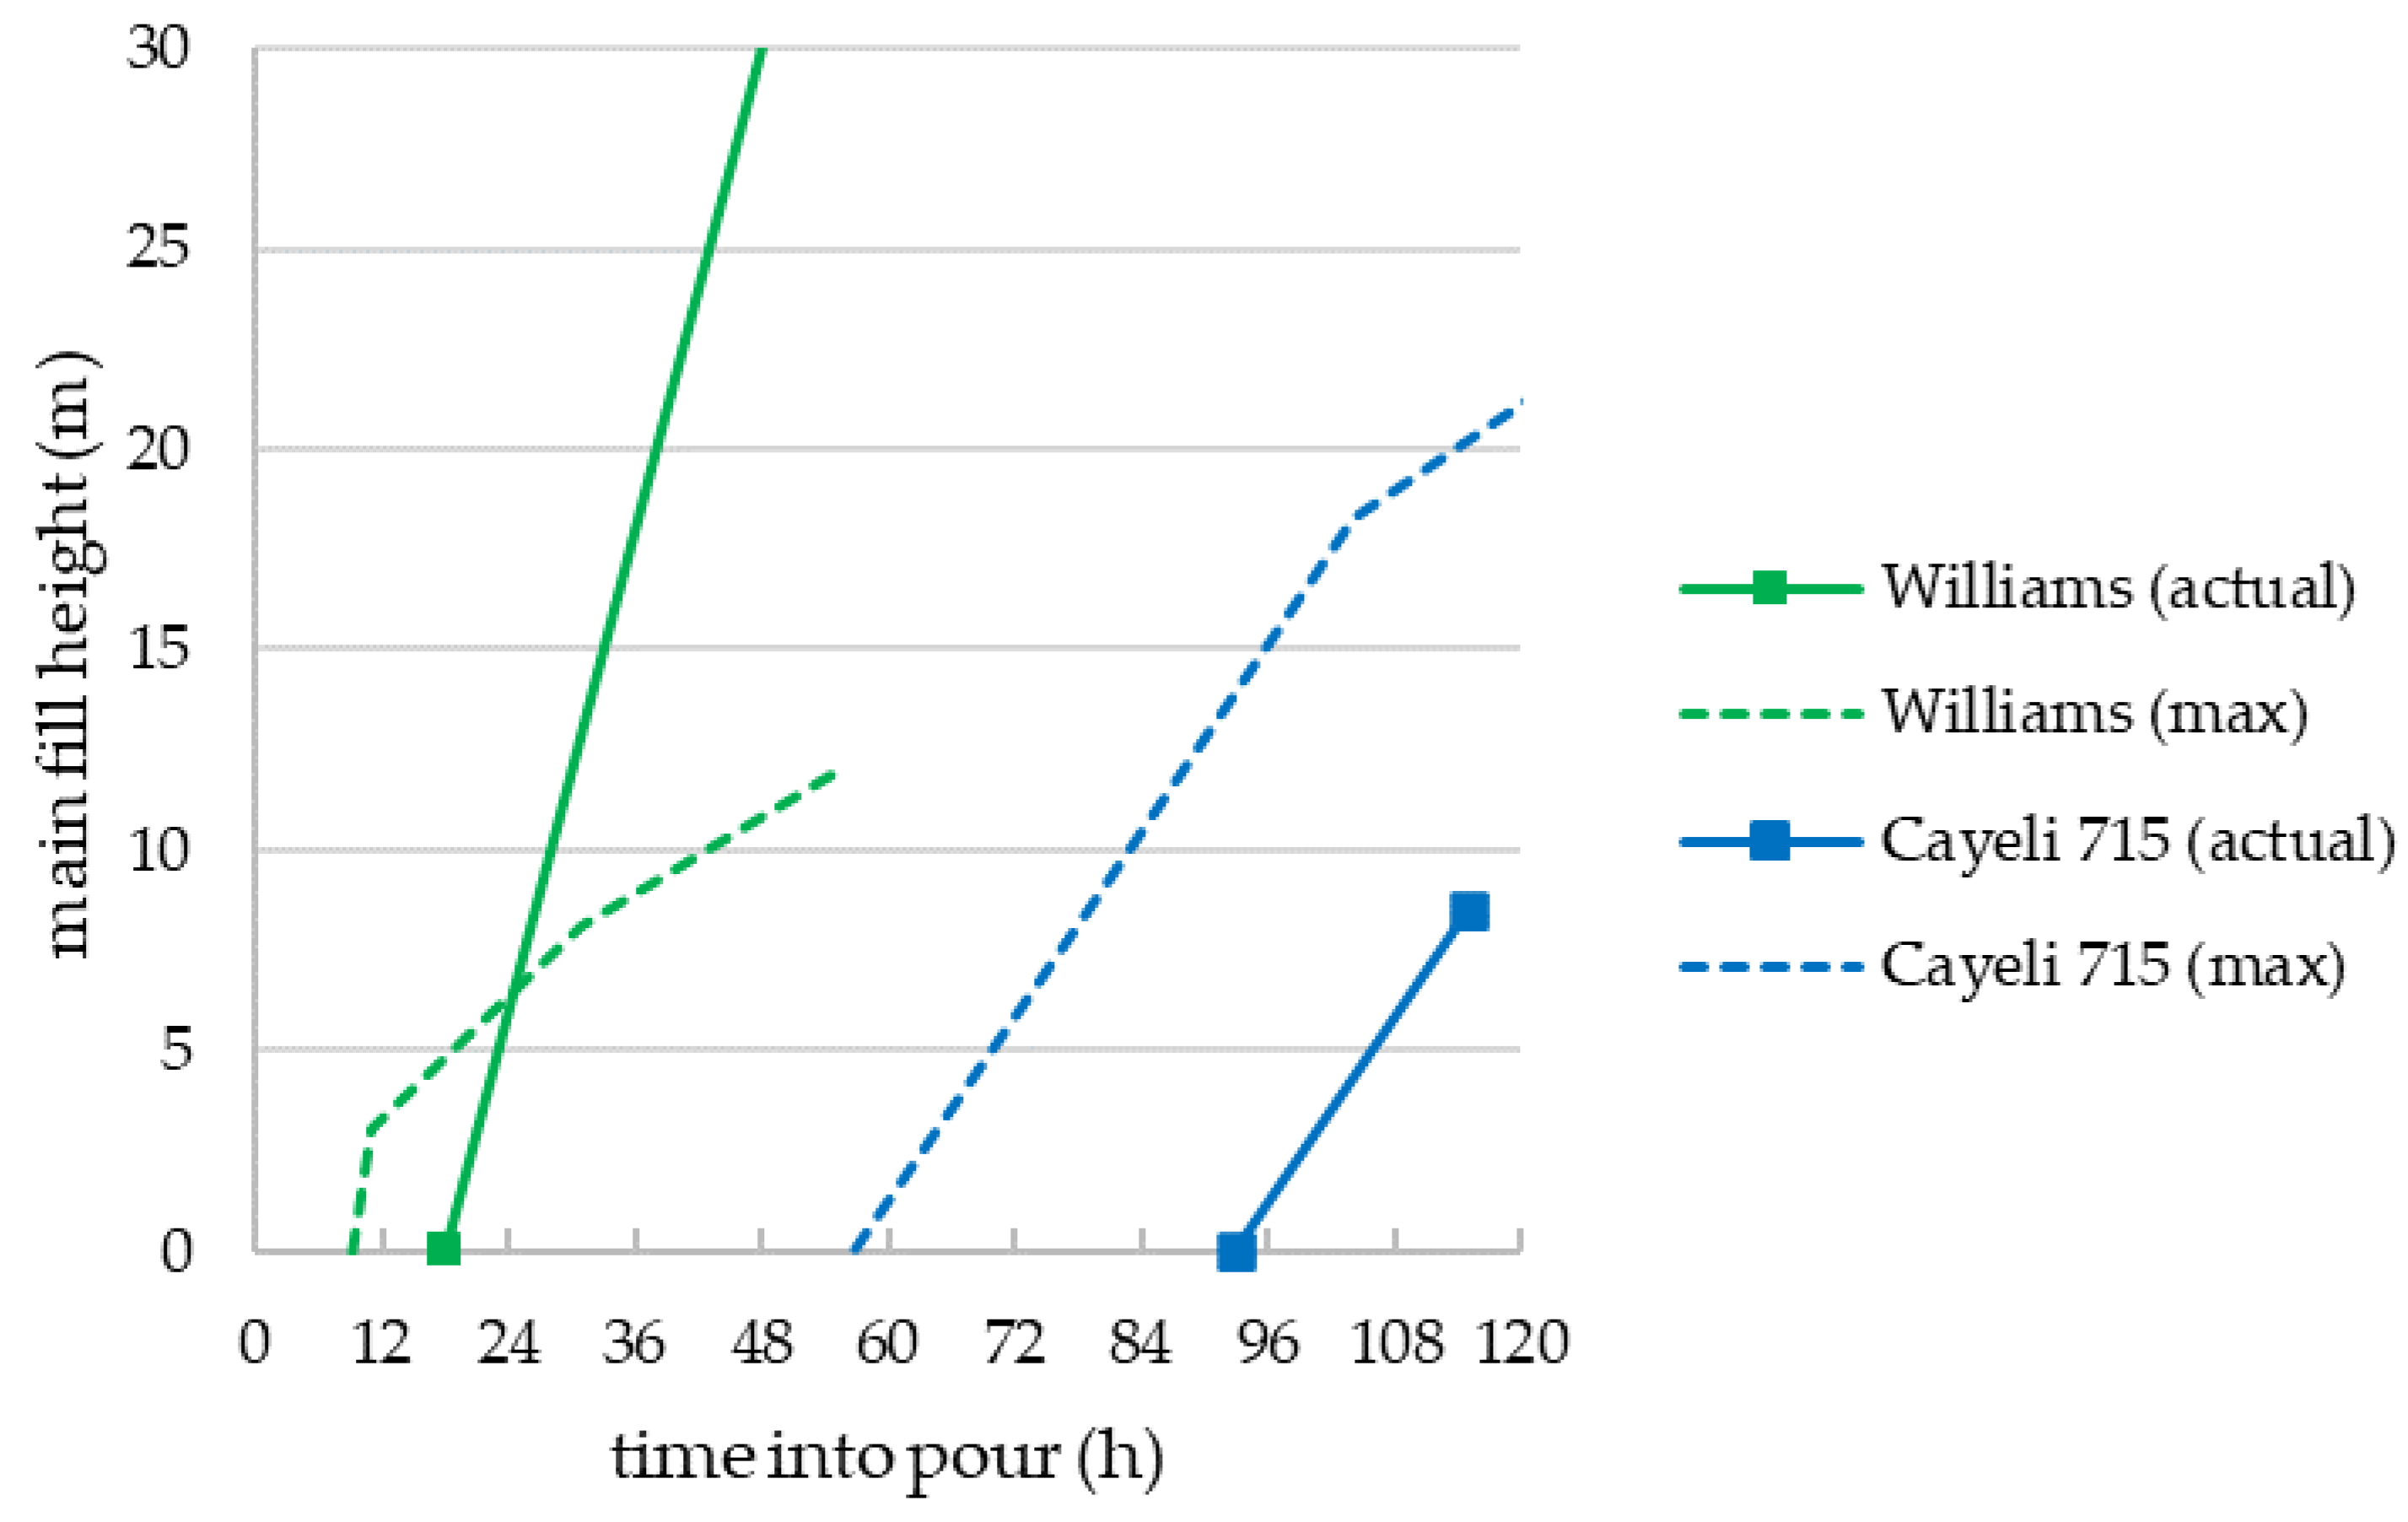
2.1. Effective Stress Development during Field Pours

The CPB literature typically cites several examples of field monitoring, but most [6,7,8,9,10] do not collect data frequently enough, do not combine total stress and pore water pressure measurements, or do not have instrumentation in the appropriate backfill plug location to be relevant to the continuous CPB pour analyses considered here. The field monitoring studies undertaken by the authors at Williams, Kidd, and Cayeli mines [11,12] involved deploying up to five instrumentation clusters throughout the stope (two in the undercut and three throughout the height), with each cluster containing a minimum three orthogonal total earth pressure cells (TEPCs), a pore water pressure transducer (PWP, or piezometer), and a thermistor (TEMP) and electrical conductivity (EC) transducers. Figure 1 shows an example instrumentation cluster and deployment at Kidd mine. The TEMP and EC transducers help identify onset of significant binder (Portland cement and cement extenders, including fly ash and granulated ground blast furnace slag) hydration reactions. Additional TEPC and PWP transducers were installed on the barricade. Data was logged every five minutes throughout pouring, and every 15 minutes after pour completion.
Ref. [13] describe a similar approach at Casa Berardi mine, but using two clusters with TEPCs and PWPs. [14] give results from Kanowna Bell mine using one TEPC oriented for vertical total stress, and one PWP.
Published field monitoring results from the above mines were digitized in approximating linear segments (estimated precision generally ±0.5 h (hour) and ±5 kPa) for the instrument clusters closest to the stope’s middle base, in the CPB plug. As will be shown later, this is the critical location for formation of a potential failure surface through the plug, which could then lead to barricade failure. Figure 2 shows field test results in terms of vertical effective stress development with respect to time after the CPB covers the transducers, for up to the subsequent 48 h (two days), which is generally sufficient time to complete the plug pour. Initial zero effective stress periods in which the CPB remains in an essentially fluid state ( σ v = σ h = P W P ) ranges between ~3 h (i.e., for Williams) and ~14 h. Horizontal effective stresses for the same mines and time periods remain below 25 kPa (see the previously cited studies for full monitoring results). Typical CPB rise rates range from 0.25 m/h to 0.40 m/h, so a ~5 m high undercut would fill in 12–20 h. For most of the mines shown in Figure 2, very little effective stress develops in either vertical or horizontal directions during this initial CPB plug pour period.
In these field studies the main CPB pours featured higher rise rates or lower binder contents, and the monitoring results indicated zero effective stress over much longer time periods, typically to the end of backfilling (see previously cited studies). For example, Figure 2 shows at Kidd the zero effective stress period within the CPB plug persisted for ~7 h, while in the main pour (which had half the binder concentration compared to the plug) the zero effective stress period existed for greater than 48 hours after the transducers in the main CPB pour were covered [11].

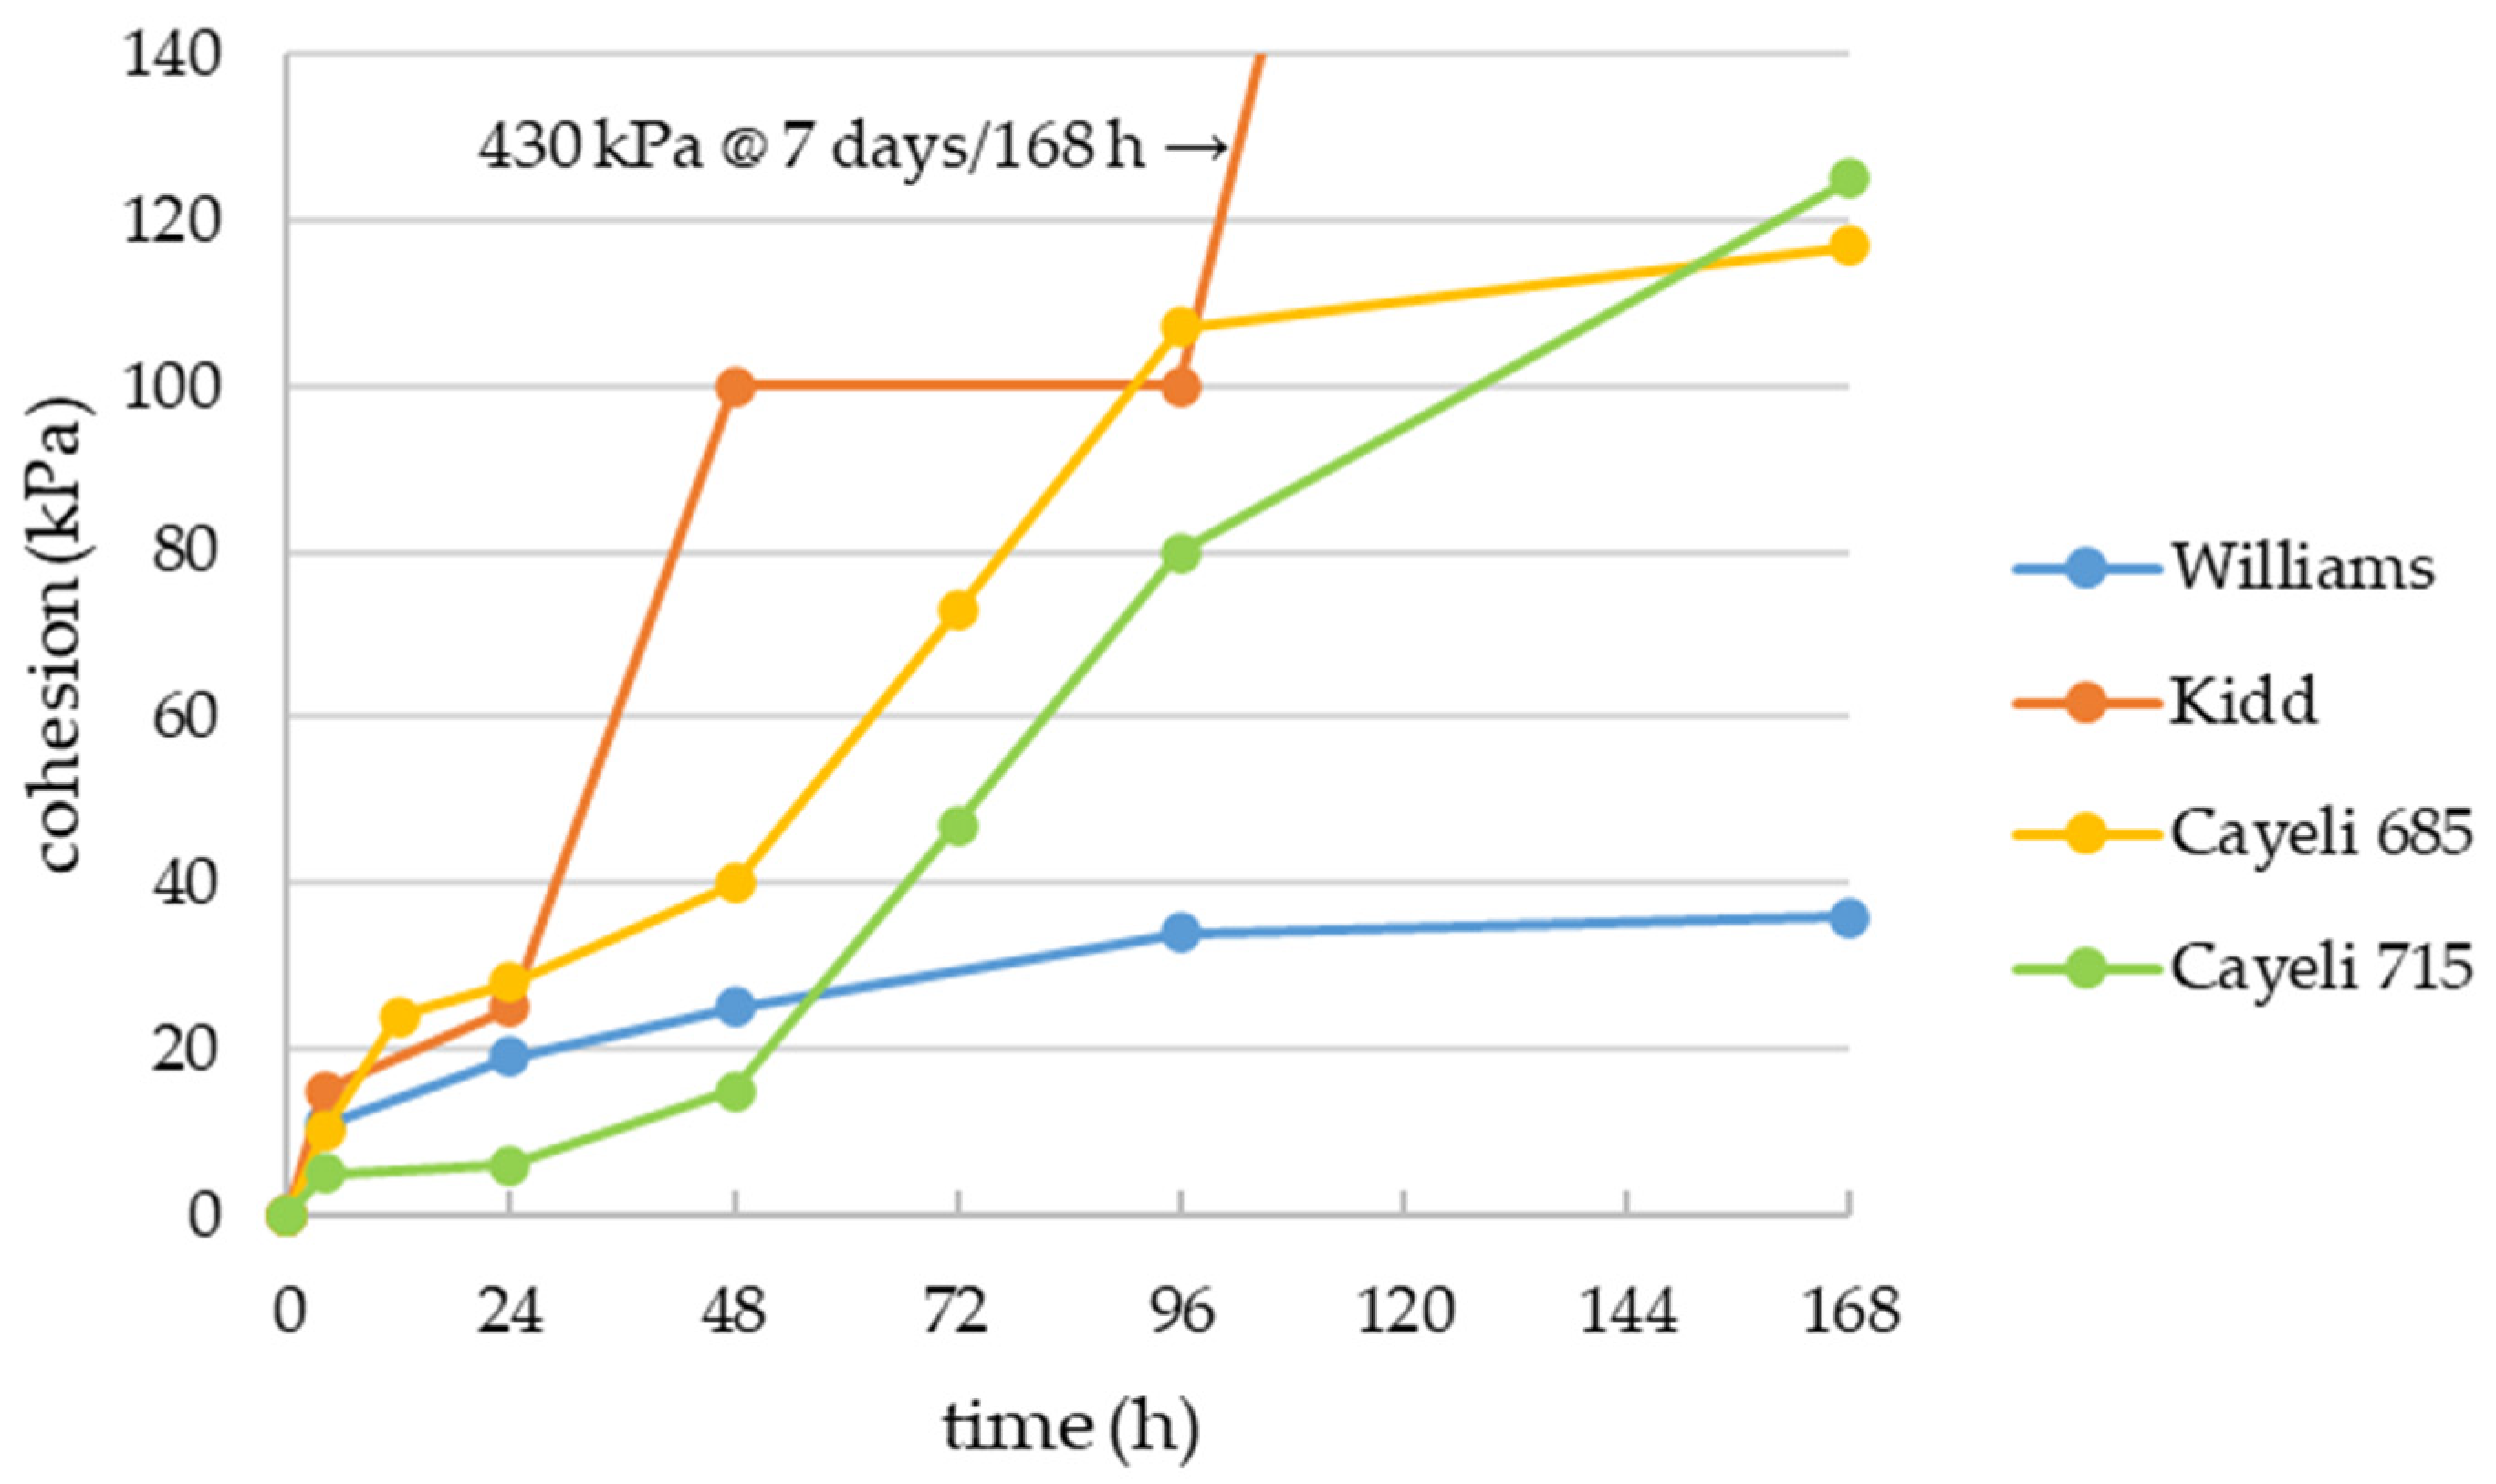
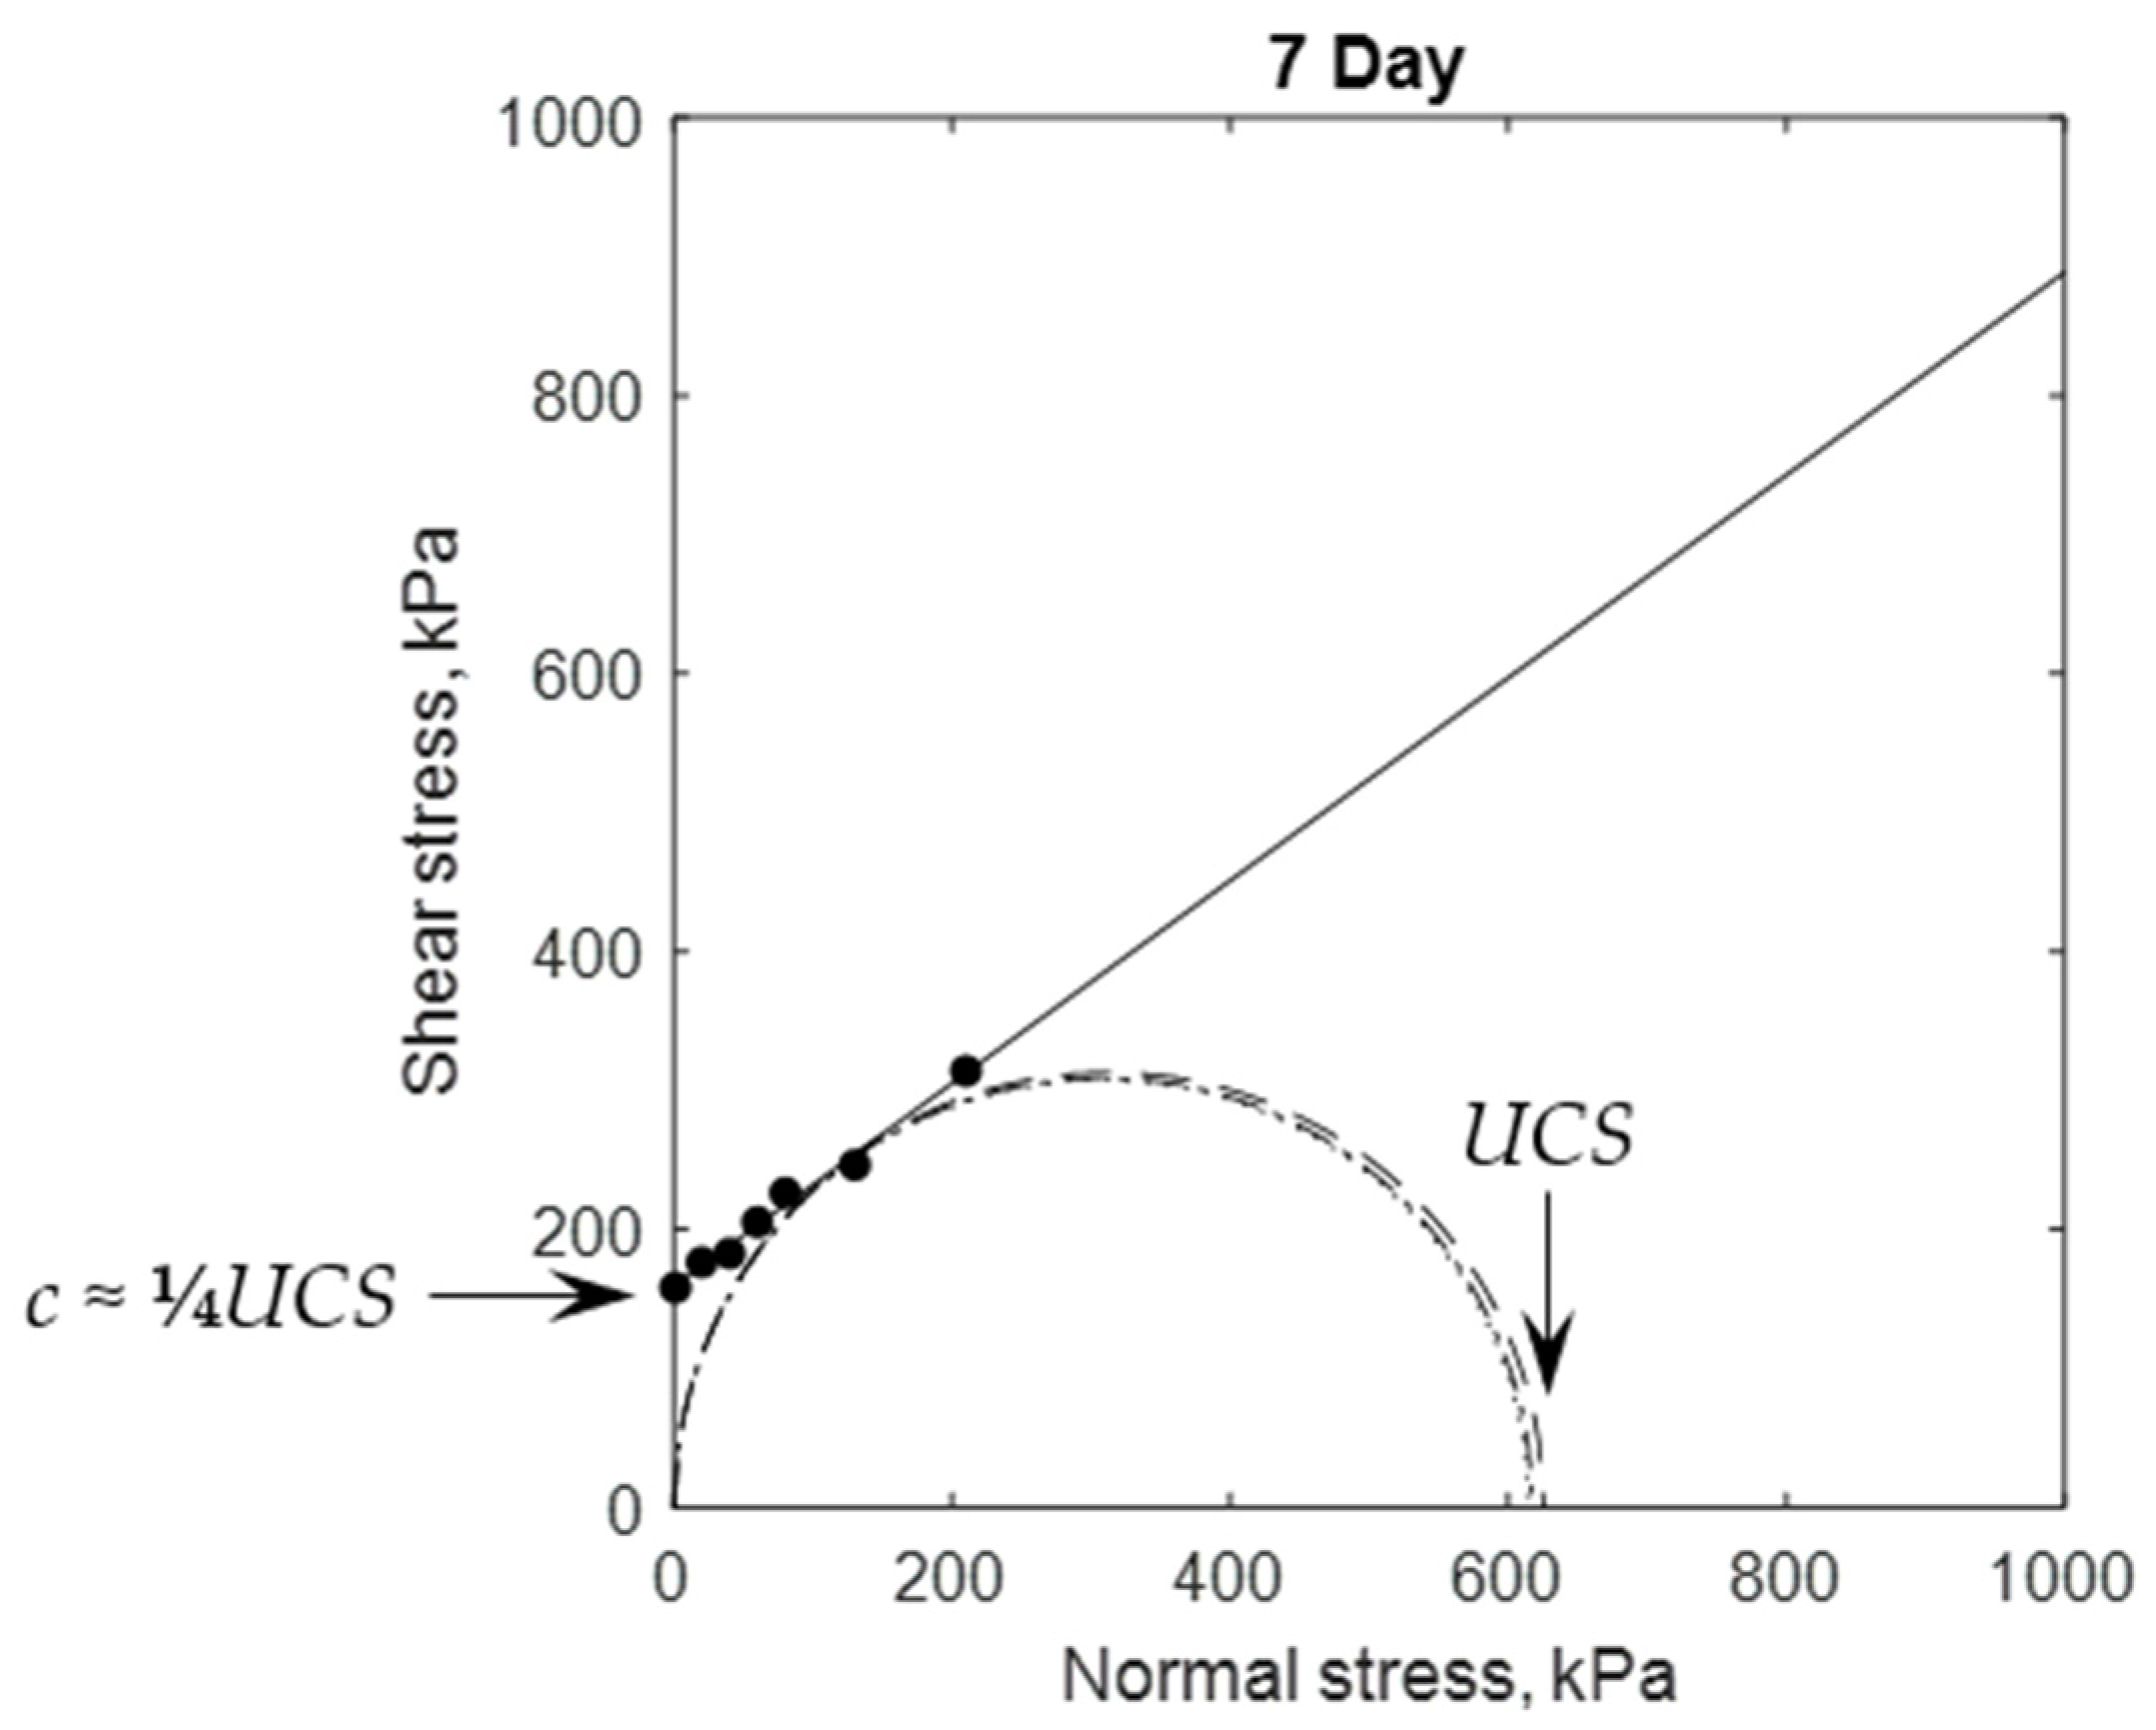
2.2. Strength Development during Field Pours

The field monitoring results reported by [11,12] show increasing TEMP measurements during the zero effective stress periods, which indicate binder hydration is occurring and so the CPB plug is gaining strength. [15] used direct shear tests to determine strengths at 4 h and at 1, 2, 4, 7 days and beyond. The CPB plug pours often take less than 24 h and occur under essentially zero effective stress which means material friction cannot contribute to backfill strength. Therefore, only material cohesion data is considered (Figure 3).
The Williams binder is a blend of 50 wt% Portland Type I (GU) cement and 50 wt% Type C fly ash and shows relatively continuous cohesion development with cure time. In contrast, the Kidd binder is a blend of 10 wt% cement and 90 wt% ground blast furnace slag, and the Cayeli binder is CEM V from a Turkish manufacturer which is equivalent to 60 wt% cement and 40 wt% extenders. These binders show cohesion developing in stages, with significant increases after one day and again after four days for Kidd, and after two days for Cayeli. These stages probably correspond to the secondary reactions of the slag and other extenders, although this was not investigated in detail.
Although others have considered CPB strength increases due to self-weight consolidation during deposition [16,17,18,19,20], the slow start to effective stress development (Figure 2) compared to material cohesion development (Figure 3) suggests minimum potential for self-weight consolidation and associated strength gain at the studied mines. Indeed, [21,22] show that the as-placed bulk properties at Williams, Kidd, and Cayeli mines are the same as the as-mixed properties, except that occluded air was mixed into the paste during deposition which had the effect of slightly increasing void ratio and decreasing degree of saturation. Similar results are reported by [13] at Casa Berardi where cores from the CPB plug had void ratios similar to the as-mixed design. Therefore, the strengths shown in Figure 3 should be considered indicative of CPB curing under field conditions.

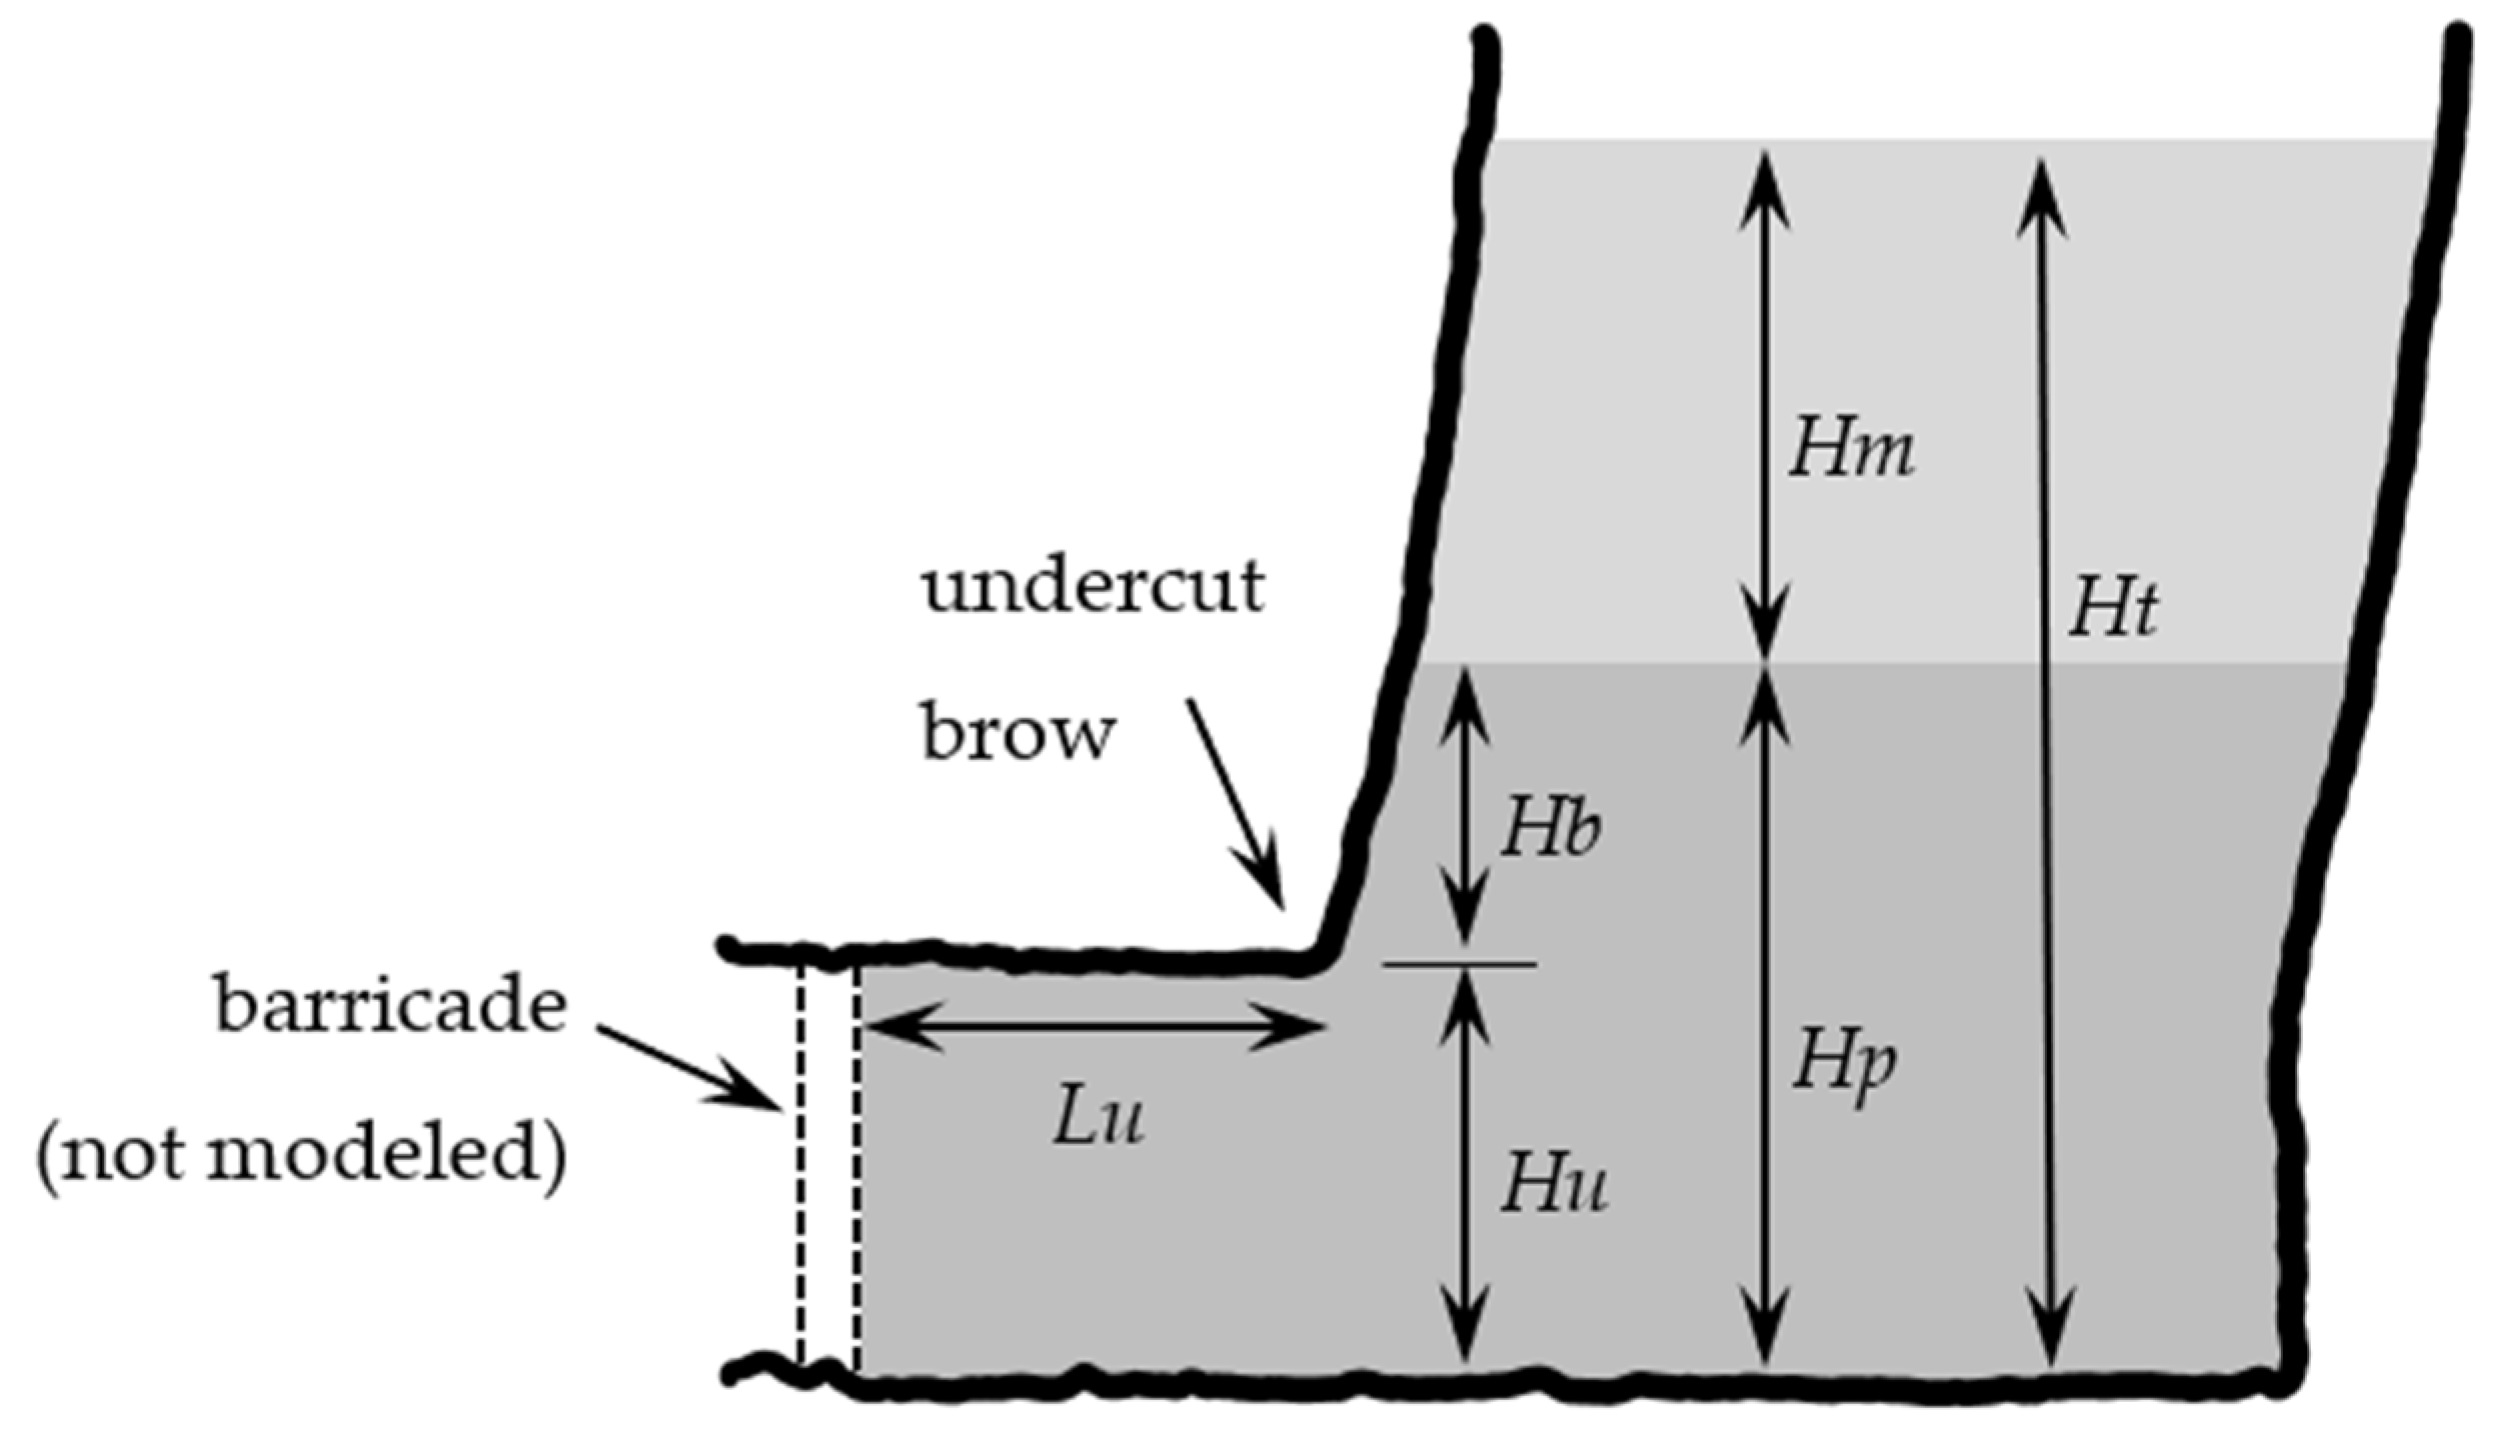
2.3. Preliminary Analytical Model for CPB Plug Strength

A vertical cross section through a typical stope and undercut are illustrated in Figure 4, with indicated dimensions that will be used in formulating the analytical model. With reference to this figure, the following simplifying assumptions are made:
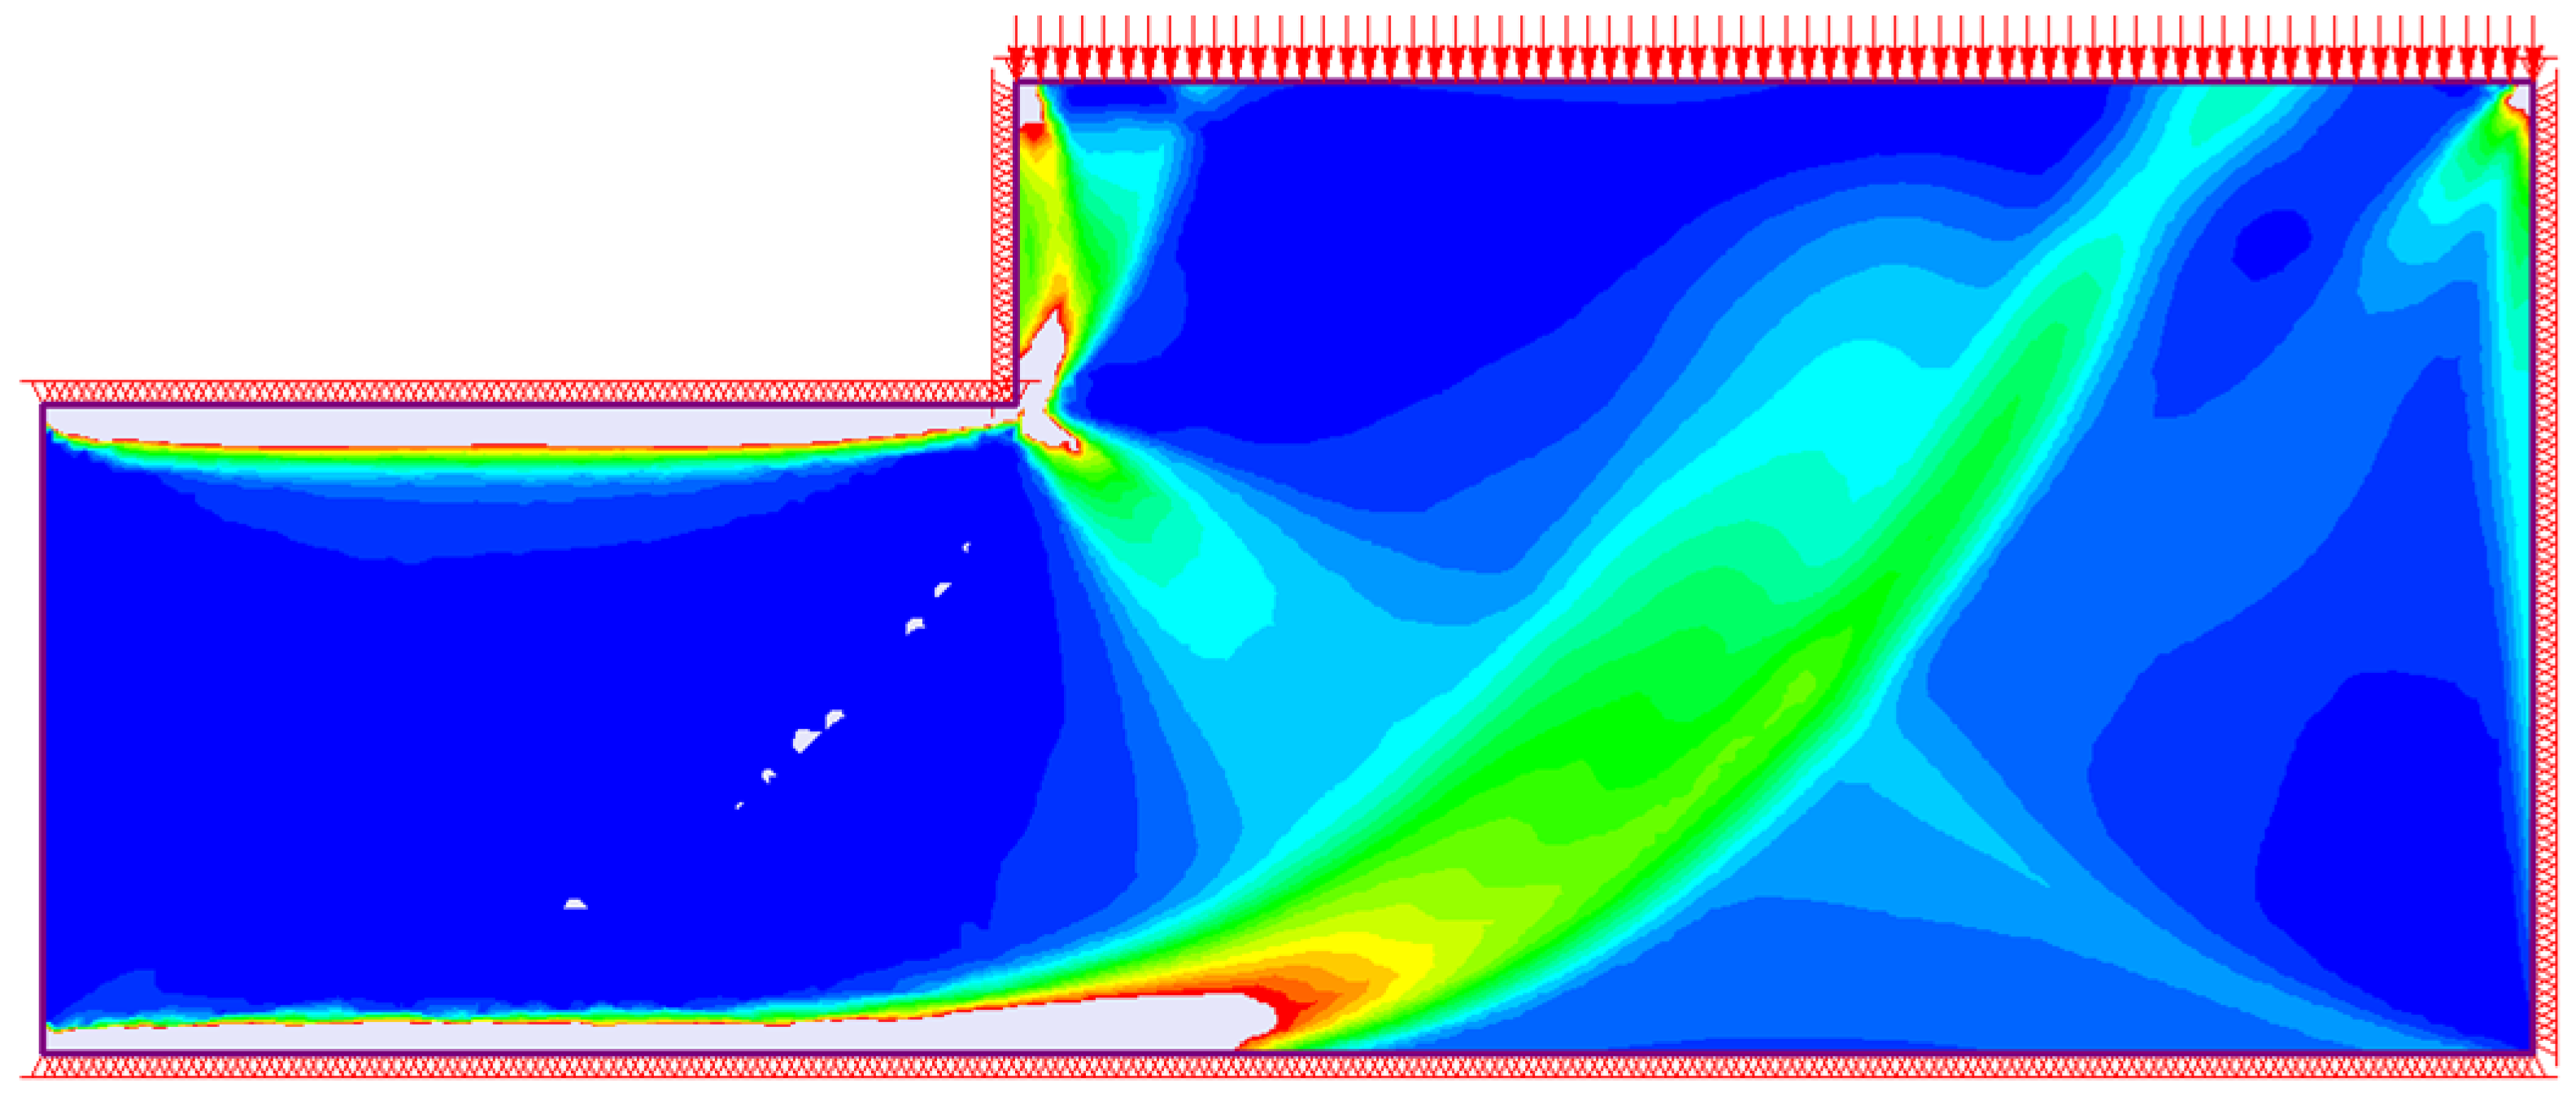
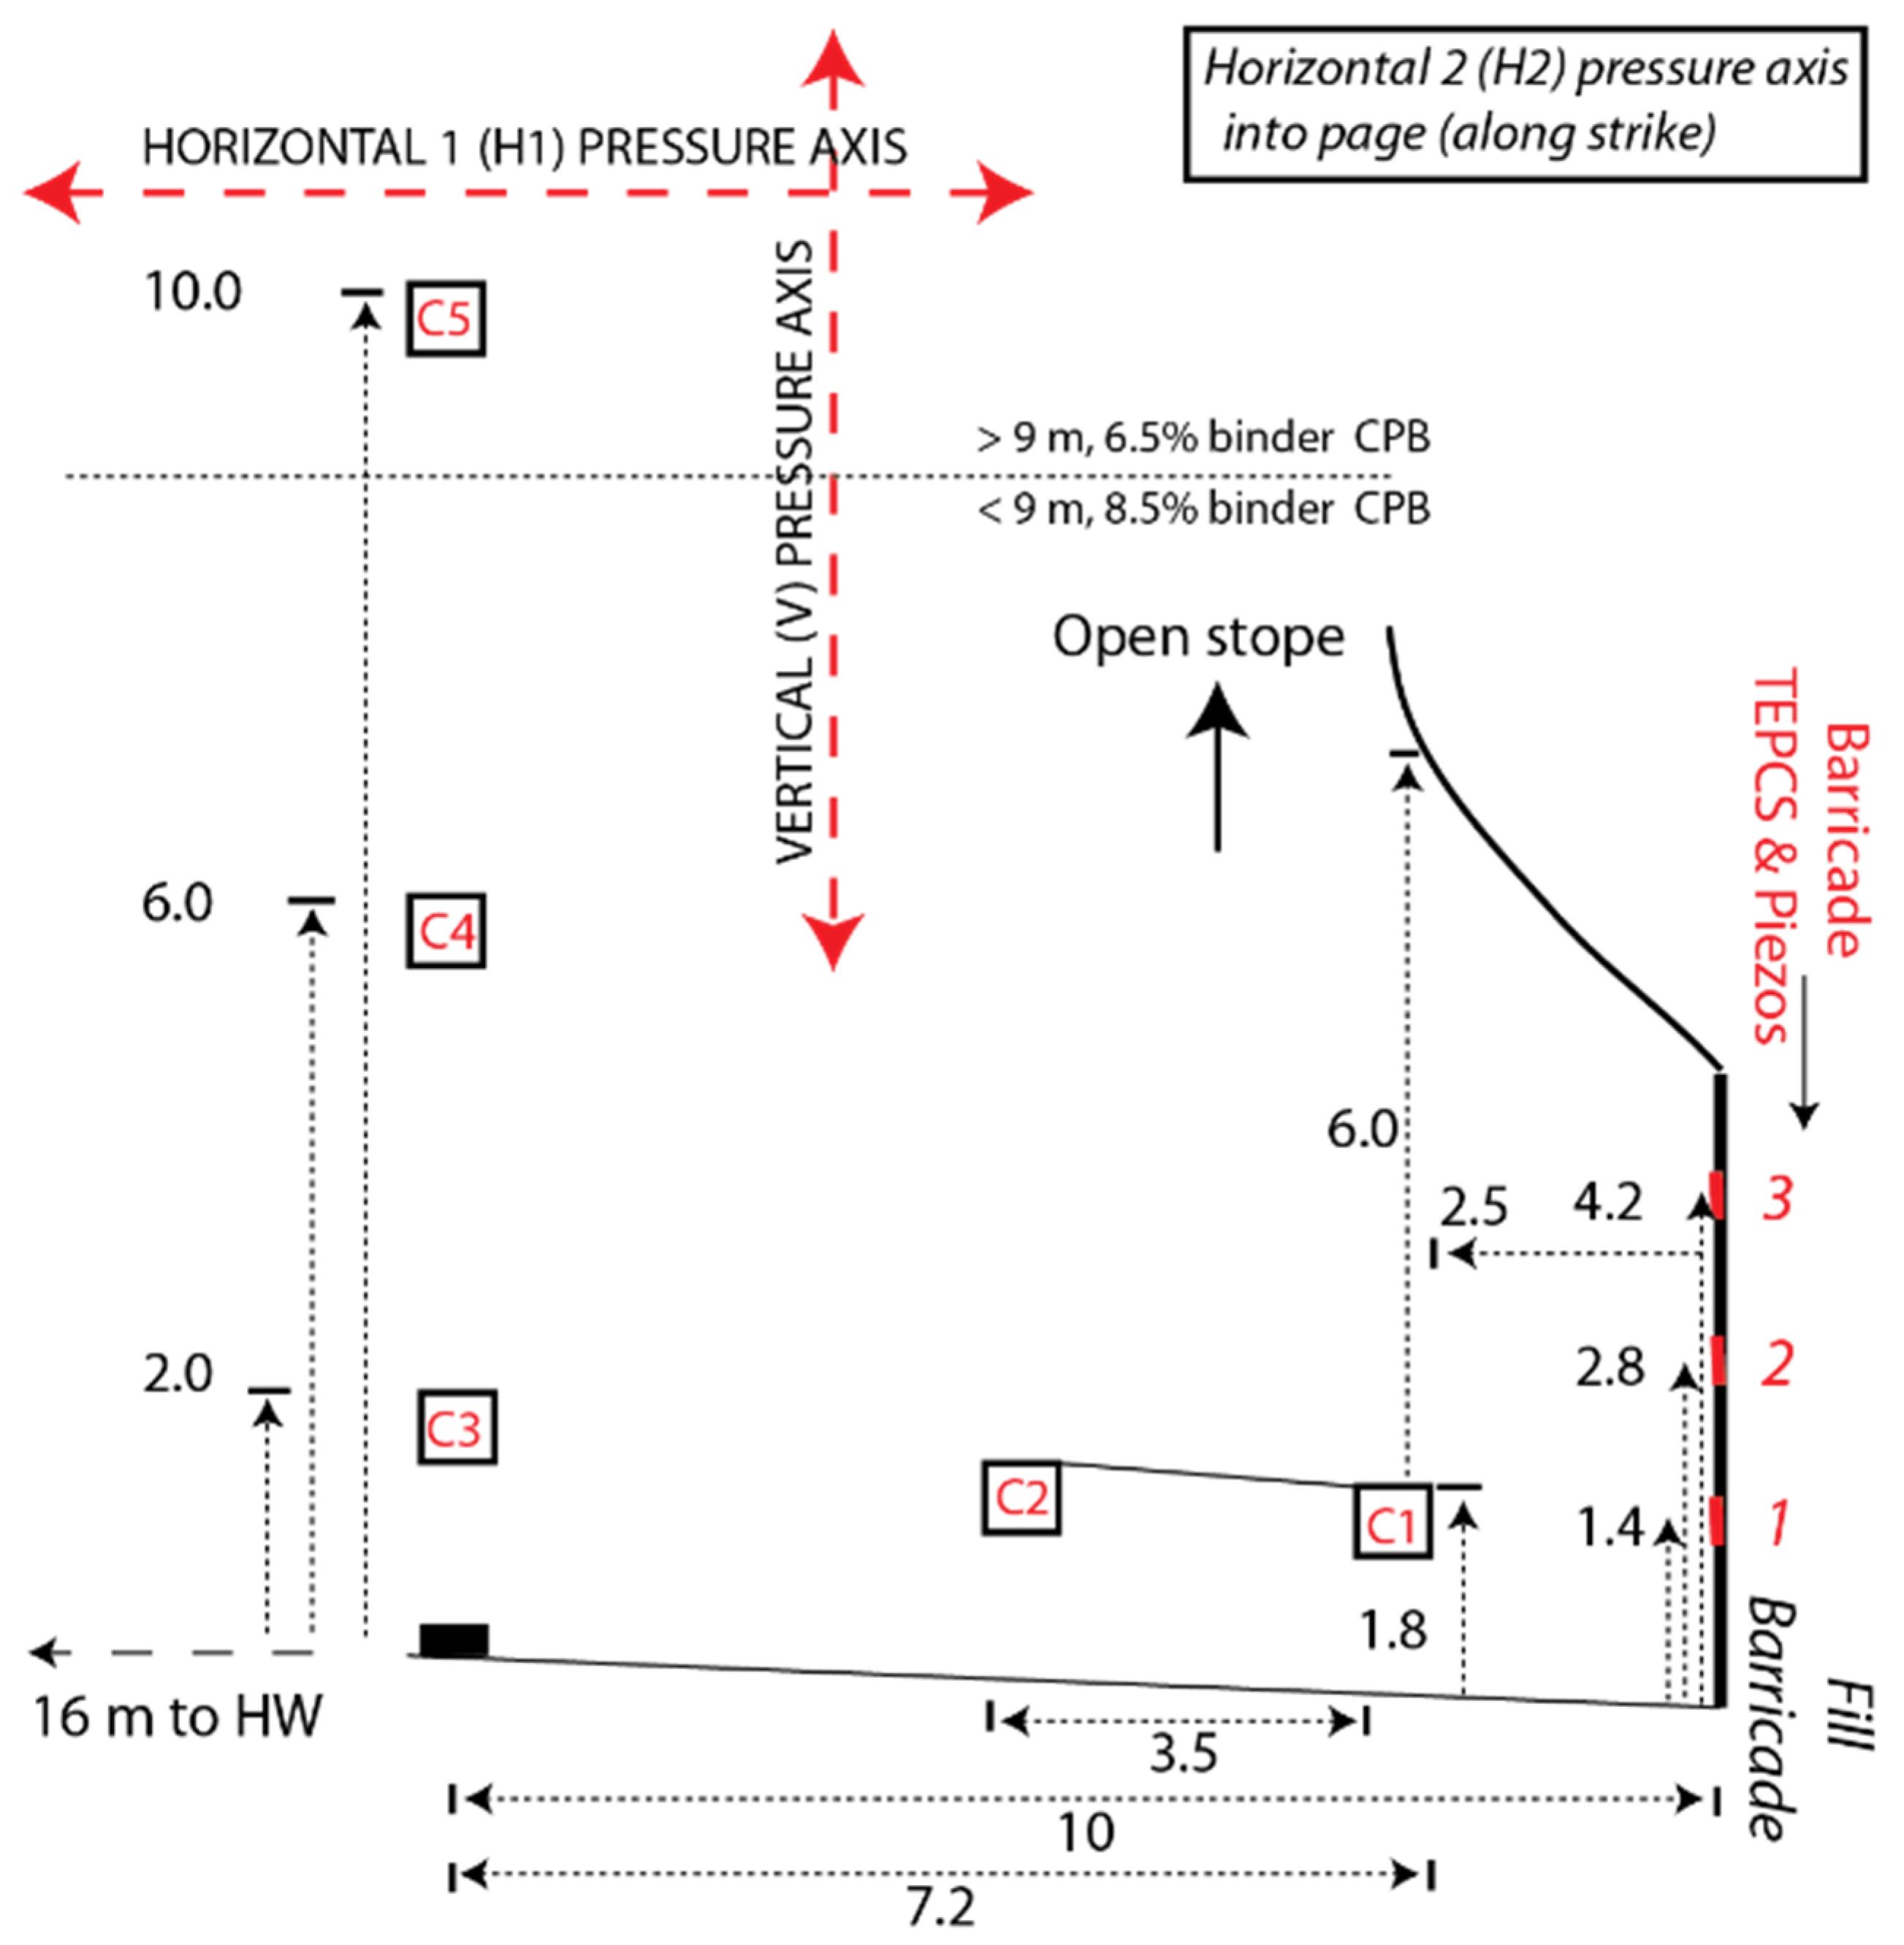
  • The undercut has square cross section with height H u , and the distance between the backfill barricade and the undercut brow is L u ;
  • The undercut walls are rough so that shear occurs through the CPB across asperities, rather than along the CPB-rock interface;
  • The CPB plug has height H p with height above the undercut brow H b ;
  • The height of main pour at any given time is H m above the plug, and the main pour exerts fluid-like pressure on the plug γ H m where γ is the backfill’s unit weight;
  • The total backfill height at any time is H t = H p + H m ;
  • The average CPB plug undrained cohesion c at the end of the plug pour must be sufficient to create a “self-supporting” condition, such that the CPB plug no longer relies on the barricade for stability; and
  • The average CPB plug undrained cohesion c must continue to increase sufficiently during the main pour to support the surcharge γ H m and prevent failure through the CPB plug which would otherwise then exert further pressure on the barricade and potentially fail it.
In terms of barricade design, a worse-case loading scenario assumes the binder does not hydrate during the plug pour, in which case the barricade must safely resist the full slurry pressure head (i.e., γ H b at the top of the barricade, increasing linearly to γ H p at the base of the barricade). If this happens, or if the self-supporting strength has not yet developed, then the pouring must stop upon plug completion and a cure period be used to allow for CPB plug strength gain before starting the main pour. Pressure monitoring at the barricade and within the CPB plug are therefore essential requirements for making informed decisions to ensure pouring continuously can be performed safely.
The idealization of the CPB plug shown in Figure 5 incorporates these assumptions and shows the postulated failure mechanism through the plug, induced by the main pour. The out-of-plane extent of the failure mechanism is limited by the undercut width (assumed same as undercut height, H u , although this could be generalized). Therefore, the failure zone above the brow (Zone 1 in Figure 5) has plan dimensions H u × 2 H u .
Note that if the distance from the undercut brow to the opposing stope wall is less than 2 H u , then the postulated failure mechanism cannot be fully developed. This would imply an increased plug stability, although the issue is not further investigated here. Zones 2 and 3 can be considered a ½-Prandtl mechanism as used in analyzing shallow foundation bearing capacity for footings in undrained clay, for which the analysis when the out-of-plane footing dimension is finite follows Skempton’s method [23].
Table 1 shows each zone’s contribution to driving and resisting effects, with approximations noted (~). The ½-Prandtl mechanism’s self-weight driving effect assumes moment equilibrium about its rotation center, the brow. The ½-Prandtl mechanism’s resistance arises from Skempton’s simplifications regarding theoretical bearing capacity factor ( 2 + π ) 5 and out-of-plane shape factor 1.2; thus, the bearing capacity factor becomes 6, and for a ½-mechanism is 3.
Equation (1) expresses the above in limiting form: driving effects = resisting effects:
γ ( H m + H b + 0.65 H u ) = c ( 4 H b H u + 3 + 4 L u H u )

2.4. Numerical Validation/Calibration

Three-dimensional (3D) nonlinear analyses were carried out using Rocscience finite element software (RS3) to validate the postulated failure mechanism, and to calibrate the coefficients in Equation (1). Additional calibration details are given in [24]. Figure 6 shows a sample result on a cross section through mid-undercut, and the emerging ½-Prandtl mechanism can be identified in the zones of high plastic shear strain. Note that a barricade is not included in the model, as previously explained. The critical pressure on the plug’s top surface was evaluated by incrementally increasing this pressure and monitoring (i) the out-of-balance force; (ii) the displacement at mid-point on the free face of the material in the undercut; and (iii) the evolution of plastic shear strain. The result shown in Figure 6 is very close to the ultimate applied pressure, and on the next pressure increment the plastic strain fully develops in the ½-Prandtl zones and instability ensues. This result implies there will be very little warning prior to an actual failure in an underground mine, which is consistent with observations from previous failures [3,4]. The 3D models also confirmed that the failure mechanism is limited in the out-of-plane direction by the lateral extents (i.e., width) of the undercut.
The coefficients in Equation (1) were tested using parametric studies to ensure agreement between numerical results and the predictive equation’s results. For example, a model with no material above the brow, H b = 0 , was used with varying distances L u , thereby determining that the ½-Prandtl zone’s self-weight effect should be 0.55 (not 0.65). Note that this self-weight term is irrelevant in the footing analysis for a full Prandtl mechanism, considered by Skempton, due to the mechanism’s symmetry about the rotation point, i.e., the footing’s edge which is analogous to the brow in the undercut. Also note that the mechanism in the material above the brow shown in Figure 6 is not entirely vertical as assumed in Figure 5, however, this did not significantly affect the coefficients used in Table 1. The remaining coefficients were deemed appropriate. Therefore, Equation (2) shows the calibrated design equation that will be used (in modified forms) for subsequent back-analyses of field data:
γ ( H m + H b + 0.55 H u ) = c ( 4 H b H u + 3 + 4 L u H u )

2.5. Non-Uniform Strength Effects

At the completion of the CPB plug pour, the backfill at the plug’s top surface will still be fluid while layers deeper into the plug have had longer to cure and should have increasing strength with depth. This was tested using a model like that shown in Figure 6, except that the cohesion varied linearly from 1 kPa at the plug’s top surface to a maximum value at the plug’s bottom surface. The cohesion at height ½ H u was then used in a uniform strength model, with similar ultimate capacity predicted. Therefore, the reference cohesion value used in Equation (2) should be based on cohesion developed at ½ H u . The implication of this is that the “cure time” (Figure 3) needs to be referenced with respect to the time when the backfill reached ½ H u , and not with respect to when pouring started.

2.6. Recommended Analysis Procedure

The first analysis step determines if there is sufficient cohesion at elevation ½ H u at the end of the CPB plug pour to make the plug self-supporting, i.e., as if the barricade could be removed and the CPB plug would not fail (although any mining operation would be imprudent to venture removing the barricade at this point). Under these circumstances H m = 0 and Equation (2) can be rearranged to obtain Equation (3) for the limiting self-supporting cohesion, c s s , normalized as follows:
c s s γ H u = 0.55 + H b H u 3 + 4 H b H u + 4 L u H u
When the main pour starts and as it continues, the CPB plug’s strength must continue to increase to support the additional load on the plug’s top surface arising from the main pour’s pressure. The second analysis stage therefore considers evolving CPB plug strength and imposed plug surcharges. The analysis procedure involves computing the maximum main pour height H m , m a x supportable for the available cohesion developed at ½ H u . This can then be compared to the planned H m , or actual H m if used in a back-analysis. Rather than defining a conventional Strength Factor (e.g., available-cohesion/required-cohesion) it is recommended instead to use an “excess fill height capacity”, H m , m a x H m , because techniques exist to determine H m during the main pour. The time variable t is referenced with respect to start of plug pour. The CPB plug’s cure time is ( t t r e f ) where t r e f is when the plug pour reaches ½ H u . The time-varying quantities of interest during the main pour are cohesion c ( t t r e f ) , maximum supportable main pour height H m , m a x ( t ) , and actual main pour height H m ( t ) . H m , m a x ( t ) depends on cohesion developed greater than c s s . Therefore, Equation (4) shows Equation (3) rearranged to incorporate this increasing strength effect.
H m , m a x ( t ) = 1 γ ( c ( t t r e f ) c s s ) ( 3 + 4 H b H u + 4 L u H u )
The maximum total backfill height with time is then simply H t , m a x ( t ) = H p + H m , m a x ( t ) . The next section uses Equation (3) in the case study back-analyses to determine each CPB plug’s self-supporting condition, and then uses Equation (4) to assess ongoing CPB plug stability during the main pours.

3. Back-Analyses of Field Case Histories

The distinction between plug and main pours depends on the mine, with variations including (i) use a cure period after plug pour to allow for plug strength gain before main pour, and (ii) use higher binder content in the plug to achieve higher early strength and enable continuous pouring. It must be noted that each case study involved multiple measurement locations within the backfill and at the barricade, and the pressures were monitored in real time to ensure continuous pouring was safe.

3.1. Case History Analysis Parameters

Deciding appropriate H u ,   H b ,   L u values requires judgment, since real mine geometries are never exactly as assumed in the preceding analysis. When in doubt, parametric studies are needed to determine the computed H m , m a x ( t ) sensitivity to assumed parameter values. [11,12] provide fuller information related to each case study, but Figure 7 illustrates the most problematic geometry of these, Cayeli Stope 685. This involved a continuous pour with binder transition at H p = 9.0 m. By choosing L u = 1.8 m and determining the overlying brow location (which is an approximation made from a cavity monitoring survey) it is estimated H u = 5.5 m and H b = 3.5 m for a combined H p = 9.0 m. Table 2 gives the geometric parameters for all case studies.
The distinctions between the plug and main pours in the case studies are as follows: Cayeli 685, Kidd 67-SL1, and Williams L70-5 use higher binder content in the CPB plug and a continuous pour; Cayeli 715 uses the same binder throughout and featured a cure period after the CPB plug pour.
The analysis also requires backfill unit weight, backfill rise rate in the plug pour r r p l u g , time t r e f when the backfill reaches height ½ H u , time t p l u g when the plug pour finishes, time t m a i n when the main pour starts (= t p l u g if a continuous pour), backfill rise rate in the main pour r r m a i n , and time t f i n a l when the stope is filled. Table 3 gives values for these parameters. The times referenced are based on field recorded filling data and are actual times, and the rise rates represent averages in the plug and main pours. According to the idealized geometry used, t r e f = 1 2 H u / r r p l u g , although this is an approximation because the actual undercut geometry varies from the idealization.

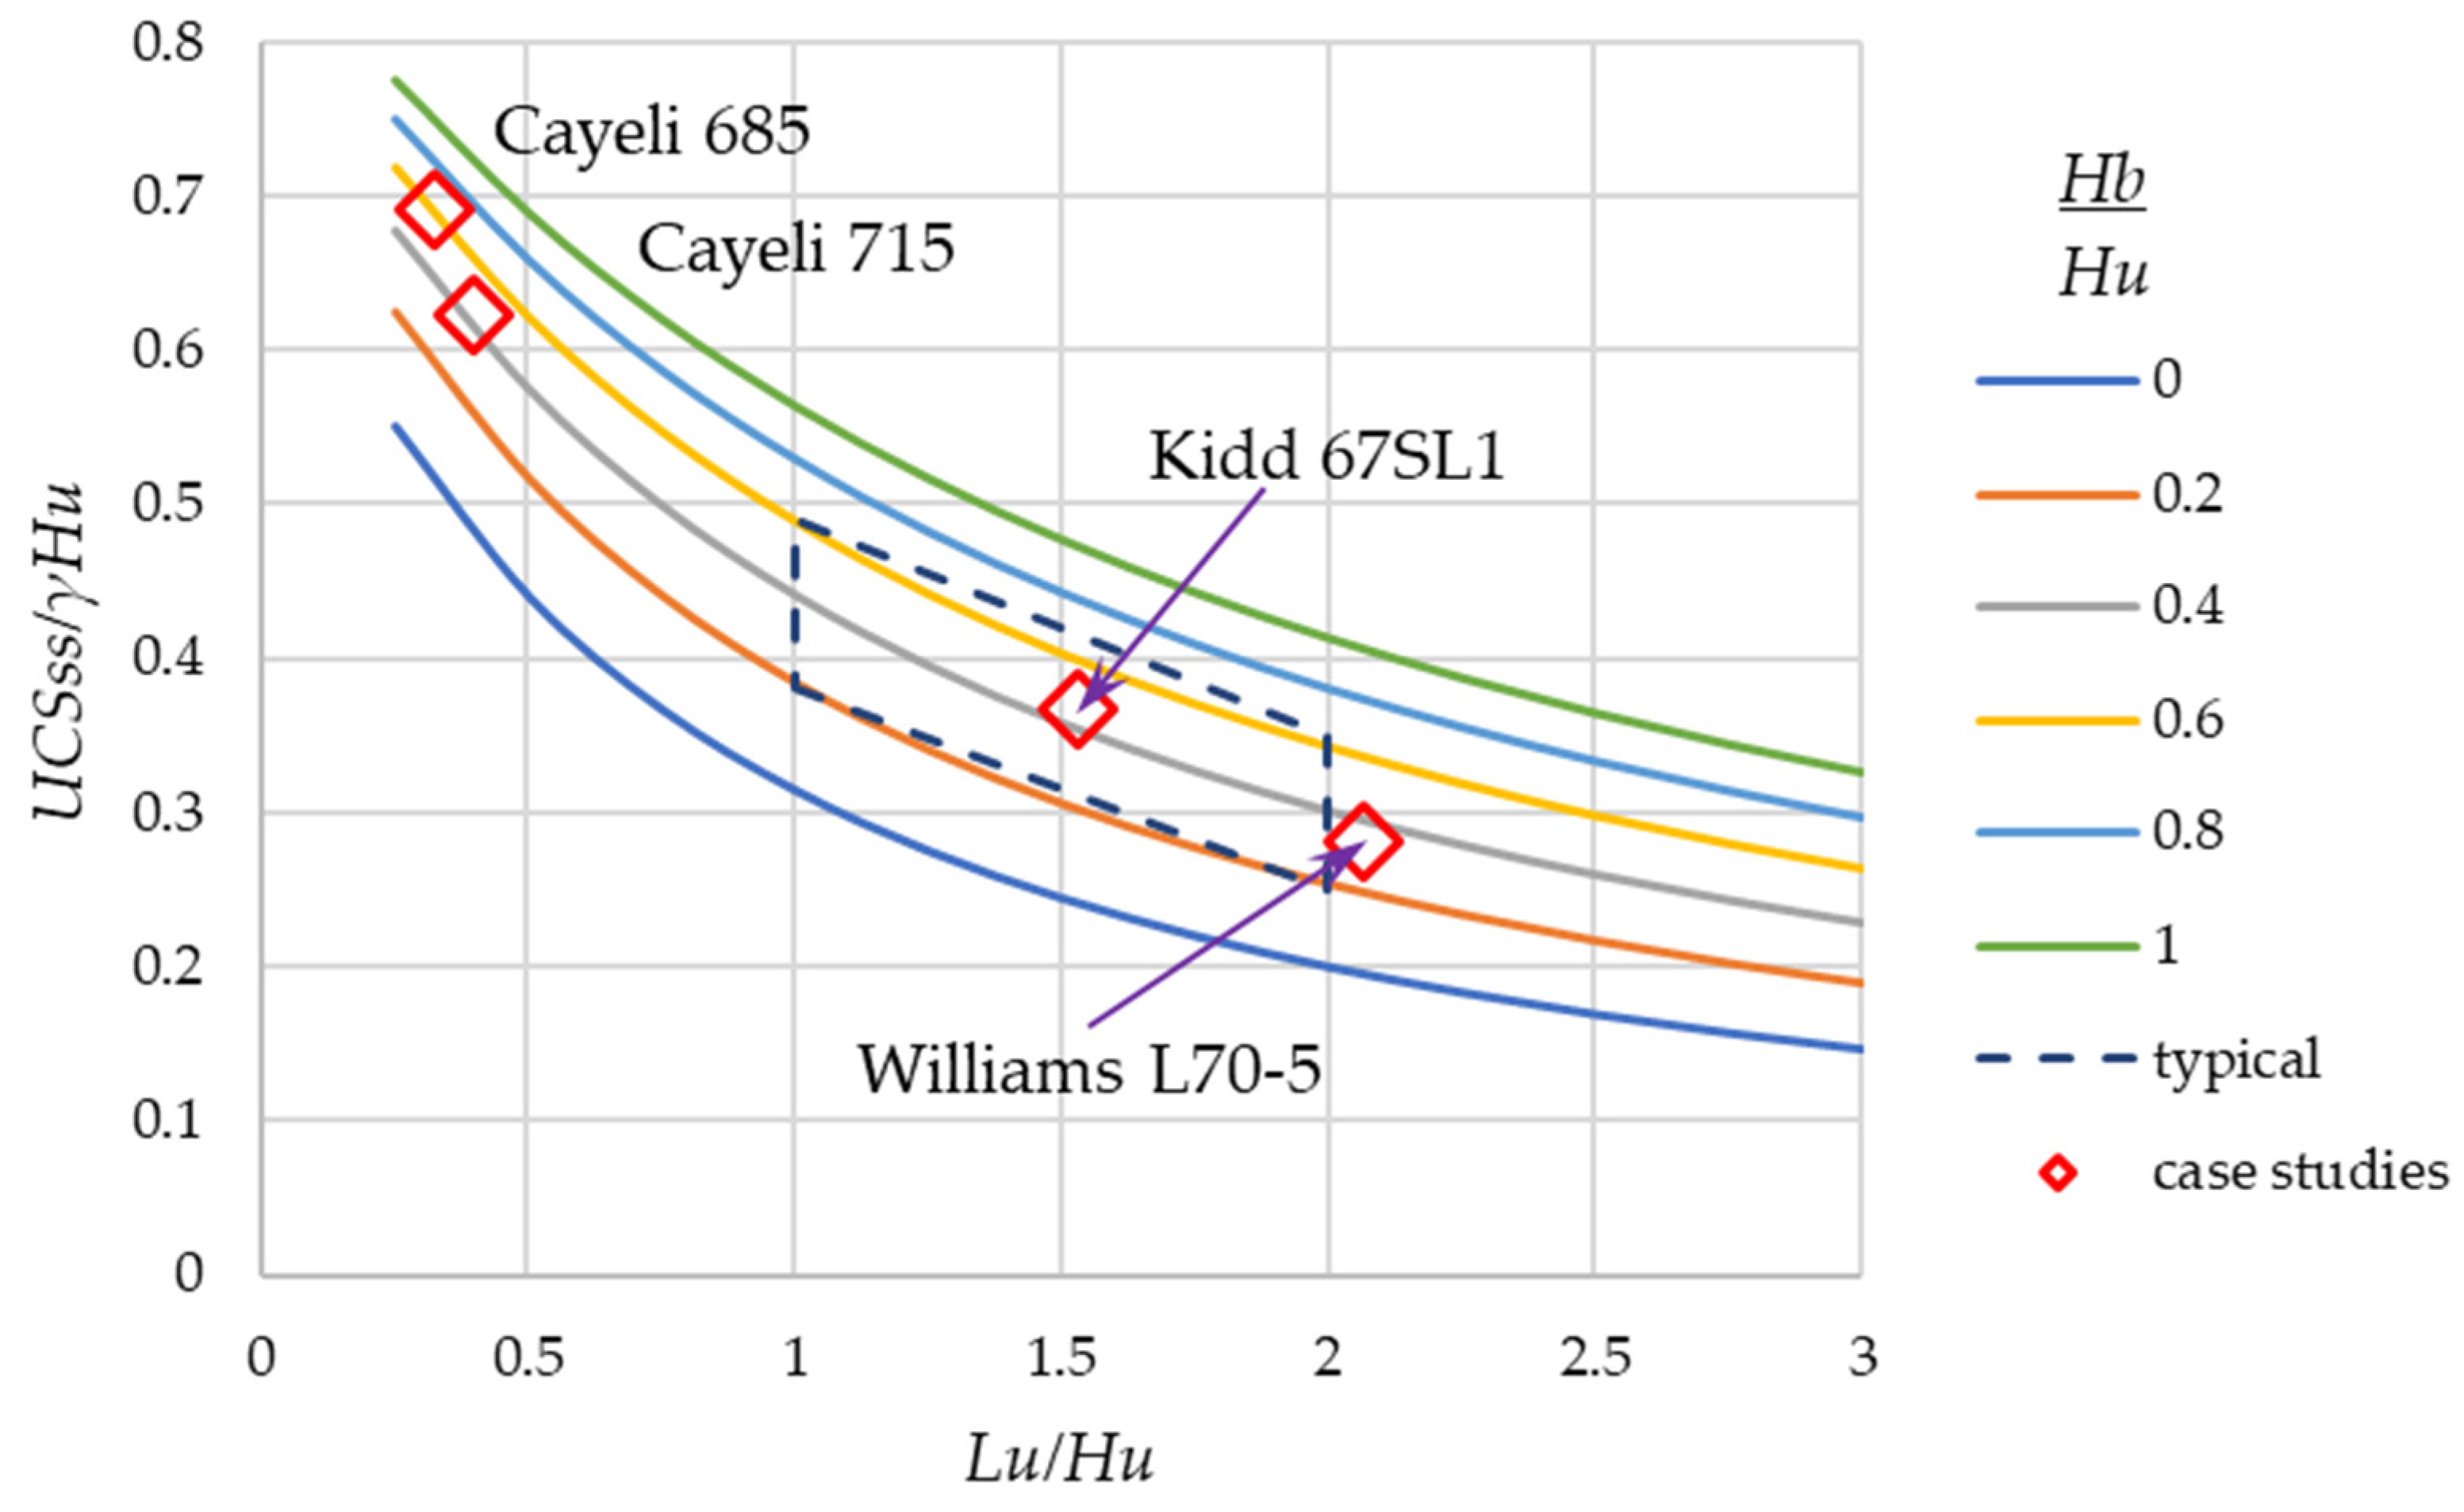
3.2. Self-Supporting CPB Plug Strength Requirements

In terms of material strength, only undrained cohesion can be relied upon under zero effective stress conditions. An assumption used in some backfill design methods is that the material’s cohesion equals one-half the unconfined compressive strength, c = 1 2 U C S . However, this assumption can be confused with the undrained shear strength of unstructured clay which may be written s u = 1 2 U C S , with the corresponding undrained friction angle ϕ u = 0 . While unstructured clays do not dilate when sheared, CPB (which is predominantly silt) does dilate and so the ϕ u = 0 assumption is invalid for CPB; the failure envelopes in the drained and undrained states are virtually identical for CPB. This has important implications that are considered in the Discussion section, and an appropriate relationship between U C S ,   c ,   and   ϕ is considered in this section. For the remainder of the article the terms cohesion ( c ) and friction ( ϕ ) are used with the understanding that the values for these parameters could be determined from drained tests, or from undrained tests with pore water pressure measurements, with identical results.
Mines inevitably assess strength using U C S , which is a strength parameter that depends on both cohesion and friction. [15] determined that for curing times up to 48 h, which is longer than all the plug pour times in Table 3, the friction angle ϕ varied between 35° and 37°. Equation (5) expresses the relation between these parameters, and for the given range of ϕ a reasonable approximation is U C S = 4 c , as shown in Figure 8 for tests on Williams CPB. This provides a straightforward basis to convert the self-supporting cohesion from Equation (3) to a self-supporting unconfined compressive strength, U C S s s .
U C S = 2 c   cos ϕ 1 sin ϕ
The dimensionless parameters in Equation (3) facilitate general consideration of CPB plug strength requirement for a range of undercut geometries, shown graphically in Figure 9. Note that this is the equation for limiting strength (Strength Factor = 1.0) for a self-supporting plug, and the strength must continue to increase to support the main pour as considered in subsequent analysis. Figure 9 considers the plausible extreme range of H b / H u and L u / H u and indicates the more usual design range for these parameters. The four case histories are also shown.
Table 4 shows available cohesion (interpolated from Figure 3) and the required self-supporting cohesion and corresponding U C S s s . When comparing the available cohesion to the required self-supporting cohesion, only Cayeli 715 did not meet the indicated strength requirement at the end of the plug pour. However, as shown in Table 2 this was the only case study not involving a continuous pour. The difference between Cayeli 685 and 715 backfill performance is apparently due to differences in tailings mineralogy (Cayeli separates the tailings into “clastic” and “non-clastic” streams that are processed separately to maximize recovery). The delayed binder hydration reaction is reflected in the slow cohesion development shown in Figure 3. For sake of comparison, Table 4 also shows the Strength Factor at the end of the plug pours, defined as the ratio of available cohesion to that required for the self-supporting condition, S F = c ( t p l u g t r e f ) / c s s . For the successful continuous pours, the required plug U C S ranges from 24 kPa (Williams) to 80 kPa (Cayeli 685). The implications of these strength requirements are considered in the Discussion section.

3.3. Main Pour Back Analyses to Determine Continuous Pour Viability

Figure 10 shows maximum main pour heights computed using Equation (4) and actual main pour heights from the field monitoring data for Kidd and Cayeli 685 stopes; and Figure 11 shows the same for Williams and Cayeli 715 stopes. To use Equation (4) in calculating the supportable main pour heights, cohesion development with time data shown in Figure 3 was moved forward in time by t r e f (Table 3) to reflect the representative cohesion developed at ½ H u with respect to pour time. The linearization in the H m , m a x ( t ) curves reflect the frequency of cohesion measurements (see Figure 3); more frequent cohesion determinations would be desirable. The calculation sequence can start at t = 0 , but results H m , m a x ( t ) < 0 mean the plug has yet to achieve self-supporting strength.
Figure 10 shows the successful continuous pours at Kidd and Cayeli 685 stopes. At Kidd, the as-placed main pour height was always less than the maximum supportable height by at least 5 m. The sudden increase in capacity at 29 h is due to the cohesion increase seen in Figure 3 at 24 h (the time difference being t r e f to reflect cohesion acting at ½ H u ). In contrast, the analysis for Cayeli 685 suggests at 57 h there was only ~1.5 m extra main fill capacity, however by this time, close to the end of pour, effective stresses developed within the CPB plug (see Figure 2 for vertical effective stress; full stress results are given in (Thompson, et al., 2012)). These effective stresses mobilize the frictional strength components which contribute significantly to CPB plug stability.
Figure 11 shows the Cayeli 715 main fill height analysis with the actual fill height reflecting the three-day CPB plug cure period routinely used at the mine for this backfill type. However, the analysis in Figure 11 indicates the main pour could have safely started at least one shift (12 h) earlier based on the limiting strength having been reached before 60 h. Figure 10 also shows the Williams pour and the analysis indicates that CPB plug instability should be expected ~6 h after the start of the main pour (~t = 24 h). However, there are two factors mitigating potential failure. Firstly, the undercut’s height was 4.5 m and the distance from its brow to the opposite stope wall was about 6 m (see [12] for detailed geometry). Compared to the mechanism shown in Figure 5 and Figure 6, the proximity of the opposite wall could interfere with development of the assumed failure mechanism. The other cases studied had significantly larger distances to opposing stope walls. Secondly, and likely more significantly, Williams CPB was the fastest of the cases studied to develop effective stresses, which started ~3 h after CPB reached the transducers in the CPB plug location (which was about 3 h into the pour (not shown)), and Figure 2 shows that at 21 h (24 h into the pour) there was about 68 kPa vertical effective stress. At 24 h pour time, or 17 h cure time with respect to the reference location, there was already ~16 kPa cohesion, equivalent to U C S = 64 kPa, and even greater vertical effective stress could have been supported by the CPB plug with the developing effective horizontal stresses. Therefore, CPB plug strength was developing fast enough to withstand the effective stresses applied to the plug backfill. To understand backfill pour stability with fast effective stress development requires much more sophisticated analyses, such as the techniques demonstrated in [9,14,15,26,27,28,29,30]. These sophisticated analysis techniques are not warranted for routine designs.

3.4. Final CPB Plug Strength Requirement

The analysis presented herein can also be applied to calculate the final CPB plug strength required at the completion of backfilling, U C S f i n a l . To determine U C S f i n a l for a final main fill height H m f i n a l the corresponding required cohesion is found by rearranging Equation (2) to obtain:
c f i n a l = γ ( H m f i n a l + H b + 0.55 H u ) 4 H b H u + 3 + 4 L u H u
Finding the corresponding U C S at these later cure times may need to account for a changing friction angle. For Williams CPB [15] found that the friction angle remained ~37° throughout curing up to 28 days, and so U C S = 4 c . However, the Cayeli 715 CPB had a progressively reducing friction angle to ~28° by 7 days, the Cayeli 685 CPB’s friction angle progressively decreased to about ~27° by four days, and the Kidd CPB’s friction angle started decreasing after 4 days and fell to ~26° by seven days. From Equation (5), U C S = 3.25 c when the friction angle is ~27°. Therefore, for these other mines the equivalent U C S f i n a l is between 3.25 c f i n a l and 4 c f i n a l . Table 5 shows the ranges of these required strengths along with the equivalent cure time at which these strengths would have to be achieved.
Note that the strengths shown in Table 5 assume no effective stress development in the CPB plug, but this assumption is increasingly tenuous with longer cure times (see Figure 2) and so these unfactored strength estimates are conservative from a safety perspective. This is particularly the case for Williams, as discussed in the previous section, and the assessed strength 333 kPa is unrealistically high for that operation. Field monitoring in the CPB plug is required to demonstrate when, and the extent to which effective stresses develop for a given mining operation. For mines embarking on stress measurement campaigns with the view to achieving continuous pours, a starting point for consideration (assuming site specific assessment) would require the CPB plug to achieve an appropriately factored U C S f i n a l before starting the main pour (i.e., to ensure stability throughout the main pour), and the mine could then work towards achieving a plug strength U C S s s with a reasonable strength factor to facilitate continuous pouring.

4. Discussion: Application at Other Mine Sites

Notwithstanding the apparent agreement between the proposed analysis methods and results from the four cases studied, the potential consequences of a plug failure mean that future applications of the presented framework must be approached cautiously. This section discusses some requirements in applied design.
Many mines collect U C S data at 3, 7, 14, 28 days (sometimes less frequently, and sometimes for longer cure periods if cement extenders such as slag and fly ash are used, or if there is concern about long-term strength deterioration due to sulfate attack, for example). However, the cases studied demonstrate that the critical time for continuous pour analysis is before three days. Furthermore, cohesion cannot be determined from U C S unless ϕ is also known (or assumed). Therefore, mines interested in performing rational continuous pour analysis must consider alternate strength testing programs.
Figure 9 shows that a single empirically derived CPB plug strength is not universally applicable. More importantly, it demonstrates the sensitivity of required strength to (i) the setback from the undercut’s brow to the barricade, L u ; and (ii) to the height of plug backfill above the brow H b . It also shows how the relationships between these parameters scale with the undercut’s absolute height, H u . Of particular note, the required strength is sensitive to L u : many operations want to minimize L u so that they do not have to subsequently mine out the paste in the undercut when developing the adjacent stope, but this has consequences for increasing binder content (and strength development with time) if a continuous pour is to be achieved.
No empirically derived CPB plug strength is widely accepted, but one well-cited design handbook recommends the following:
“In bulk mining stopes, the paste fill should be placed approximately 1 m above the draw point brow and permitted to cure to approximately 150 kPa strength before filling the remainder of the stope.”
([2], p.92)
Note that this recommendation does not indicate where in the plug this strength should be achieved, nor does it account for the effects of the main pour height, or different main pour rise-rates on the CPB plug. Given that the 150 kPa strength is a general recommendation, it is presumably empirically validated under normal operating conditions and deemed to be safely conservative, although to an unknown extent. As an aside, note that the suggested 1 m height above the brow is significantly less than the corresponding H b values shown in Table 2.
For comparison with the design approach for U C S s s suggested here, consider the U C S = 150 kPa heuristic in the context of Figure 9. If a reasonably conservative Strength Factor = 2.0 is assumed so that the limiting U C S s s is 75 kPa, and assuming a large H u = 7.5 m and a typical γ = 20 kN/m3, then U C S s s / γ H u = 0.5 and this corresponds to a range of L u / H u from 0.4 to 1.3 (see Figure 9), which many operations would consider unsafely close to the brow. (For reference, note that Kidd’s L u / H u = 1.5 is achieved using a frame that remotely pushes the barricade framework into place prior to shotcreting.) Most operations have more conservative operating parameters (smaller H u , larger L u / H u ) and so would have Strength Factors > 2.0 if they strictly adhered to the recommended heuristic. On the other hand, in comparison with the U C S f i n a l values shown in Table 5, the recommended U C S = 150 kPa strength before starting the main pour falls within the range of calculated U C S f i n a l values.
As mentioned, mines wishing to use the analysis approach described in this work need to carry out backfill strength testing at frequent intervals in the first few days representing the duration of CPB plug pour and start of main pour. These tests must focus on determining cohesion, either using direct shear tests combined with U C S as shown in Figure 8 (the preferred method), or by combining U C S and confined triaxial tests with confining stresses up to 1 2   U C S .
In addition, mines should determine typical effective stress development rates by carrying out field stress measurements prior to attempting continuous pours. This instrumentation should include PWP and vertical TEPC transducers at minimum, but preferably two orthogonal horizontal TEPCs as well, since this combination provides more reliable interpretation of effective stress development [11,12]. The instrumentation cage shown in Figure 1 is robust and straightforward for underground construction crews to install, as demonstrated by [13]. The transducers have internal thermistors to capture TEMP data that is helpful to ascertain when binder hydration becomes significant at the measurement point. The mid-point at the base of the stope, ~1.5 m off the stope floor is an ideal measurement point since this is where a potential failure mechanism would be expected to form (Figure 6). If potential rock fall prior to stope filling is a concern, then the cage can also be placed at the undercut’s brow although its proximity to blasted host rock provides better drainage potential and so the PWPs may be lower than at mid-stope and, therefore, the interpreted effective stresses higher, which could lead to unsafe estimates of plug stability. When continuous pouring attempts begin, the same field monitoring strategies can be used to verify that the backfill behaviour corresponds to the analysis assumptions. While not strictly part of the CPB plug design, barricade monitoring is also strongly recommended to ensure safe barricade loading limits are adhered to throughout the pour. It should be cautioned that barricade pressure measurements of effective stress likely are not representative of the effective stress state within the plug; [11] reported that effective stress at the barricade developed significantly more quickly than at the brow (C1 location, Figure 7). As such, barricade pressure measurements alone are not recommended for verifying the conditions of this analysis.
The approach considered here only addresses plug stability under pressures arising from the main pour. Other design considerations may also need to be addressed. One of these is liquefaction resistance, for which an often-referred to heuristic is U C S = 100 kPa [31]. However, [32] found that after 12 h the Golden Giant CPB (similar to Williams CPB, because both operations mine the same orebody) could not be liquefied using the highest cyclic loading possible from the available MTS load frame. Similar results have been found by [33] for Kidd tailings after 7 h binder cure time. As mentioned, the barricade should be designed to withstand the full slurried CPB pressure during the plug pour, and in 12 h only the top 3 m would be prone to liquefaction (assuming deposition rate 0.33 m/h), so the liquefaction concern is overstated in this specific design case.
Finally, the strength assumption stated in Section 3.2 requires discussion in the context of the proposed plug strength analysis method. The common undrained strength assumption, that ϕ = 0 and therefore the undrained cohesion is 1 2 U C S , only applies to materials that do not dilate during shearing (i.e., unstructured clays). [34] used miniature tensiometers installed in the base platen of a triaxial cell to monitor a CPB’s pore water pressure and suction changes during U C S tests, as well as in non-backpressure saturated consolidated-undrained (CU) tests. The test results showed how dilation potential during shear induced more than 60 kPa incremental suction and therefore increased the effective stress, leading to measured shear resistance larger than for the assumed confining stress level. [35] showed the same effects in conventional backpressure saturated undrained (CU) and drained (CD) tests on Williams materials, results for which are shown in Figure 12. Further, [35] demonstrated that the failure envelopes determined from drained and undrained testing were virtually identical (angles within about 1°) for unamended tailings (shown in Figure 12) as well as for the mine’s CPB. Similar results were obtained by [33] for tests on Kidd mine materials including (i) mine tailings alone, (ii) tailings blended with esker sand, and (iii) the mine’s CPB (tailings, sand, and binder).
Some authors [36,37,38] have tested CPB under undrained, but non-backpressure saturated conditions and without using pore water pressure measurements. In these cases, the induced suction during shearing at low confining stress levels leads to increases in effective confining pressure (to an unmeasured degree) and, therefore, artificially high interpretations of mobilized shear resistance, as shown in [34]. Studies on Kidd tailings [33] and Williams tailings [35] found backpressures of at least 400 kPa were required for saturation. Therefore, tests by [36,37,38] at higher confining pressure levels would result in closer to saturated conditions. However, as shown in Figure 12, the mobilized shear resistance in undrained testing is not as high as in drained testing. The combined result of over-interpreted shear resistance at low confining stresses and under-interpreted shear resistance at high confining stresses leads to lower estimates of friction angle and higher estimates of cohesion, potentially resulting in the interpreted friction angle being zero and undrained cohesion being 1 2 U C S . An extreme example is shown by some of the test results using Kidd CPB in [38] where stress deviator decreases with increasing confining stress, implying a negative friction angle in total stress space. This result is inconsistent with results of [33] which used backpressure saturation and pore water pressure measurements when testing the same Kidd CPB. The authors in [36] note that results from tests without backpressure saturation and pore water pressure measurements must be used carefully in design and could lead to overestimating backfill strength in some cases. Estimating plug strength requirements is such a case, where using c = 1 2 U C S would reduce the calculated strength ( U C S ) requirement by a factor of two. If the recently placed backfill remains close to saturated, as was determined from field tests by [21,22], then c = 1 4 U C S must be used. It is therefore recommended that the assumption c = 1 4 U C S continue to be used until it can be demonstrated that greater estimates of cohesion are warranted.

5. Conclusions

The proposed CPB plug stability assessment method is the first attempt to provide a framework for rational engineering analysis of CPB strength required for continuous pouring. The case studies used to compare against the developed approach’s predictions are unique in terms of (i) the extent and quality of field monitoring data available, and (ii) the frequency and type of laboratory strength testing carried out as part of a larger previous research program at these mine sites. However, mines have the capacity to carry out field instrumentation of the kind illustrated in the case studies, albeit in a focused way at select stope locations. Consulting companies should generally have the equipment for the needed strength testing procedures, and with further research some improvement and simplification of these test methods may result in equipment that also can be used routinely at mine sites along with slump/viscometer testing, U C S testing, etc.
The proposed analysis method correctly assessed the continuous pour potential for Kidd and Cayeli 685 stopes. It also correctly assessed that the Cayeli 715 stope required a cure period after completing the CPB plug pour, and the results indicated that the CPB plug cure duration used by the mine was likely conservative and could have been shortened by at least one shift (12 h). For Williams mine the analysis results correctly indicated the potential for continuous pour, but then incorrectly indicated that the CPB plug strength was insufficient ~6 h into the main pour. However, in this case the narrow stope geometry relative to the undercut height, and the quickly developing CPB strength relative to the developing effective stress imposed by self-weight helped to mitigate against failure, and a continuous pour was successful. It will be important in future to determine similar mining scenarios where the CPB plug strength analysis is overly-conservative from a strength perspective.
The self-supporting CPB plug strength assessment (Equation (3), Figure 9) suggests that the recommended U C S = 150 kPa heuristic likely over-estimates required CPB self-supporting plug strength (in the context of a continuous pour) for most backfilling cases, even if a reasonable Strength Factor is applied to the analysis. The backfilling cases studied indicate that if the self-supporting strength has been achieved then the remainder of the pour is likely to be successful, although this cannot be assured, and Equation (4) should still be used as a check. The final case study, Williams, shows the limitations of the analysis approach when the stope geometry infringes on development of the potential failure surface, or when effective stress development occurs. Even in these cases, however, the initial CPB plug strength assessment (Equation (3), Figure 9) will give a reasonable upper-bound strength estimate that in many cases will be lower than U C S = 150 kPa.
If the suggested analysis and design approach is used at other mines that are willing to share their experience, the rational engineering approach recommended here can be improved and confidence will increase in carrying out continuous pours of cemented paste backfill under properly controlled conditions.

Author Contributions

All authors contributed to the iterative refinement of postulated failure mechanism and to recommended design procedures for other mines. M.G. developed the analytic solution and oversaw numerical calibration. W.B. contributed to contextualization of results in an operating mine environment. B.T. oversaw the original field instrumentation at Williams, Kidd, and Cayeli mines and contributed to field data processing and interpretation. M.G. provided first manuscript draft and colleagues contributed to reviewing and editing. All authors have read and agreed to the published version of the manuscript.

Funding

This original work received no external funding, however it arose out of a multi-year research project originated by the authors at the University of Toronto involving partnership with Williams, Kidd, and Cayeli mines (and their parent companies at the time, Barrick, Xstrata, and Inmet) and the Natural Sciences and Engineering Research Council (NSERC) Canada.

Institutional Review Board Statement

Not applicable.

Informed Consent Statement

Not applicable.

Data Availability Statement

All data supporting reported results has been included.

Acknowledgments

A preliminary version of this work appears as a conference paper at Minefill 2020 (postponed to the last week of May 2021). Flac3D models presented in that work were carried out by Jeff Oke while at Mine Design Engineering (MDE) in Kingston, Ontario, under supervision of the first author. Compared to the conference paper, the work here provides additional case studies and a more practical recommended analysis and design approach.

Conflicts of Interest

The authors declare no conflict of interest.

References

  1. Li, J.; Ferreira, J.; Le Lievre, T. Transition from discontinuous to continuous paste filling at Cannington Mine. In Proceedings of the 11th International Symposium on Mining with Backfill, Perth, Australia, 20–22 May 2014; Australian Center for Geomechanics: Perth, Australia, 2014. [Google Scholar]
  2. Potvin, Y.; Thomas, E.; Fourie, A. Handbook on Mine Fill; Australian Centre for Geomechanics: Perth, Australia, 2005; ISBN 0-9756756-2-1. [Google Scholar]
  3. Yumlu, M.; Guresci, M. Paste backfill bulkhead failures and pressure monitoring at Cayeli mine. CIM Bull. 2007, 100, 1001–1010. [Google Scholar]
  4. Revell, M.; Sainsbury, D. Paste bulkhead failures. In Proceedings of the 9th International Symposium on Mining with Backfill, Montreal, QC, Canada, 29 April–2 May 2007; Canadian Institute of Mining: Montreal, QC, Canada, 2007; p. 10. [Google Scholar]
  5. Starfield, A.; Cundall, P. Towards a methodology for rock mechanics modelling. Int. J. Rock Mech. Min. Sci. Geomecahnics Abstr. 1988, 25, 99–106. [Google Scholar] [CrossRef]
  6. Hassani, F.; Fotoohi, K.; Doucet, C. Instrumentation and backfill performance in a narrow vein gold mine. Int. J. Rock Mech. Min. Sci. 1998, 35, 106. [Google Scholar] [CrossRef]
  7. Hassani, F.; Ouellet, J.; Servant, S. In situ measurements in a paste backfill: Backfill and rock mass response in the context of rockbursts. In Proceedings of the 17th International Mining Congress and Exhibition of Turkey, IMCET 2001, Ankara, Turkey, 19–22 June 2001; Chamber of Mining Engineers of Turkey: Ankara, Turkey, 2001. [Google Scholar]
  8. Belem, T.; Harvey, A.; Simon, R.; Aubertin, M. Measurement and prediction of internal stresses in an underground opening during its filling with cemented fill. In Proceedings of the 5th International Symposium on Ground Support in Mining and Underground Construction, Perth, Australia, 28–30 September 2004; Taylor & Francis Group: London, UK, 2004; pp. 619–630. [Google Scholar]
  9. Doherty, J.; Hasan, A.; Suazo, G.; Fourie, A. Investigation of some controllable factors that impact the stress state in cemented paste backfill. Can. Geotech. J. 2015, 52, 1901–1912. [Google Scholar] [CrossRef]
  10. Seymour, J.B.; Raffaldi, M.J.; Abraham, H.; Johnson, J.C.; Zahl, E.G. Monitoring the in situ performance of cemented paste backfill at the Lucky Friday mine. In Proceedings of the 12th International Symposium on Mining with Backfill, Minefill 2017, Denver, CO, USA, 19–22 February 2017; Society for Mining, Metallurgy, and Exploration, Inc.: Englewood, CO, USA, 2017; pp. 19–22. [Google Scholar]
  11. Thompson, B.; Bawden, W.F.; Grabinsky, M. In situ measurements of cemented paste backfill at the Cayeli Mine. Can. Geotech. J. 2012, 49, 755–772. [Google Scholar] [CrossRef]
  12. Thompson, B.; Grabinsky, M.; Bawden, W. In situ monitoring of cemented paste backfill pressure to increase backfilling efficiency. CIM J. 2011, 2, 199–209. [Google Scholar]
  13. Alcott, J.; Dallaire, D.; Belem, T. Pastefill optimization at Hecla Quebec’s Casa Berardi mine. In Proceedings of the 53rd US Rock Mechanics/Geomechanics Symposium, New York, NY, USA, 23–26 June 2019. [Google Scholar]
  14. Helinski, M.; Fahey, M.; Fourie, A. Numerical modeling of cemented mine backfill deposition. J. Geotech. Geoenviron. Eng. 2007, 133, 1308–1319. [Google Scholar] [CrossRef] [Green Version]
  15. Veenstra, R.L. A Design Procedure for Determining the In Situ Stresses of Early Age Cemented Paste Backfill. Ph.D. Thesis, University of Toronto, Toronto, ON, Canada, 2013. Available online: http://hdl.handle.net/1807/36027 (accessed on 19 December 2018).
  16. Yilmaz, E.; Belem, T.; Benzaazoua, M. Effects of curing and stress conditions on hydromechanical, geotechnical and geochemical properties of cemented paste backfill. Eng. Geol. 2014, 168, 23–37. [Google Scholar] [CrossRef]
  17. Yilmaz, E.; Benzaazoua, M.; Belem, T.; Bussière, B. Effect of curing under pressure on compressive strength development of cemented paste backfill. Miner. Eng. 2009, 22, 772–785. [Google Scholar] [CrossRef]
  18. Fahey, M.; Helinski, M.; Fourie, A. Development of specimen curing procedures that account for the influence of effective stress during curing on the strength of cemented mine backfill. Geotech. Geol. Eng. 2011, 29, 709–723. [Google Scholar] [CrossRef]
  19. Walske, M.; McWilliam, H.; Doherty, J.; Fourie, A. Influence of curing temperature and stress conditions on mechanical properties of cementing paste backfill. Can. Geotech. J. 2015, 53, 148–161. [Google Scholar] [CrossRef]
  20. Cui, L.; Fall, M. Mechanical and thermal properties of cemented tailings materials at early ages: Influence of initial temperature, curing stress and drainage conditions. Constr. Build. Mater. 2016, 125, 553–563. [Google Scholar] [CrossRef]
  21. Grabinsky, M.; Bawden, W.F.; Simon, D.; Thompson, B.T.; Veenstra, R.L. In situ properties of Cemented Paste Backfill from three mines. In Proceedings of the 66th Canadian Geotechnical Conference, GeoMontreal 2013, Montreal, QC, Canada, 29 September–3 October 2013; p. 8. [Google Scholar]
  22. Grabinsky, M.; Simon, D.; Thompson, B.D.; Bawden, W.F.; Veenstra, R.L. Interpretation of as-placed cemented paste backfill properties from three mines. In Proceedings of the Mine Fill 2014, Perth, Australia, 20–22 May 2014; Australian Centre for Geomechanics: Perth, Australia, 2014. Available online: https://papers.acg.uwa.edu.au/p/1404_28_Grabinsky/ (accessed on 20 March 2020).
  23. Skempton, A.W. The bearing capacity of clays. In Proceedings of the Building Research Congress, London, UK, 11–20 September 1951; Institution of Civil Engineers: London, UK, 1951; pp. 180–189. [Google Scholar] [CrossRef]
  24. Grabinsky, M.; Thompson, B.; Bawden, W. Evaluating Cemented Paste Backfill Plug Strength and the Potential for Continuous Pouring; Minefill 2020–2021; Taylor & Francis OA: Katowice, Poland, 2021. [Google Scholar]
  25. Pan, A. Mechanical Properties of Cemented Paste Backfill under Low Confining Stress. Master’s Thesis, University of Toronto, Toronto, ON, Canada, 2019. Available online: http://hdl.handle.net/1807/98310 (accessed on 9 April 2021).
  26. Helinski, M.; Fahey, M.; Fourie, A. Behavior of cemented paste backfill in two mine stopes: Measurements and modeling. J. Geotech. Geoenviron. Eng. 2010, 137, 171–182. [Google Scholar] [CrossRef]
  27. El Mkadmi, N.; Aubertin, M.; Li, L. Effect of drainage and sequential filling on the behavior of backfill in mine stopes. Can. Geotech. J. 2013, 51, 1–15. [Google Scholar] [CrossRef]
  28. Cui, L.; Fall, M. Multiphysics modeling of arching effects in fill mass. Comput. Geotech. 2017, 83, 114–131. [Google Scholar] [CrossRef]
  29. Witteman, M.; Simms, P. Unsaturated flow in hydrating porous media with application to cemented mine backfill. Can. Geotech. J. 2017, 54, 835–845. [Google Scholar] [CrossRef] [Green Version]
  30. Shahsavari Goughari, M. Effects of Transient Hydro-mechanical Cemented Paste Tailings Properties on One-dimensional Deposition Behaviour. Ph.D. Thesis, University of Toronto, Toronto, ON, Canada, 2020. Available online: http://hdl.handle.net/1807/103748 (accessed on 9 April 2021).
  31. Le Roux, K.; Bawden, W.; Grabinsky, M. Liquefaction analysis of early age Cemented Paste Backfill. In Proceedings of the Eighth International Symposia on Mining with Backfill, Minefill 2004, Beijing, China, 19–21 September 2004; The Nonferrous Metals Society of China: Beijing, China, 2004; pp. 233–241. [Google Scholar]
  32. Le Roux, K. In Situ Properties and Liquefaction Potential of Cemented Paste Backfill. Ph.D. Thesis, University of Toronto, Toronto, ON, Canada, 2004. [Google Scholar]
  33. Abdelaal, A.G. Early Age Mechanical Behavior and Stiffness Development of Cemented Paste Backfill with Sand. Ph.D. Thesis, University of Toronto, Toronto, ON, Canada, 2011. Available online: http://hdl.handle.net/1807/31668 (accessed on 9 April 2021).
  34. Simms, P.; Grabinsky, M. Direct measurement of matric suction in triaxial tests on early-age cemented paste backfill. Can. Geotech. J. 2009, 46, 93–101. [Google Scholar] [CrossRef]
  35. Saebimoghaddam, A. Liquefaction of early age cemented paste backfill. Ph.D. Thesis, University of Toronto, Toronto, ON, Canada, 2010. Available online: http://hdl.handle.net/1807/24868 (accessed on 13 March 2020).
  36. Belem, T.; Fourie, A.B.; Fahey, M. Time-dependent failure criterion for cemented paste backfills. In Proceedings of the 13th International Seminar on Paste and Thickened Tailings, Paste 2010, Toronto, ON, Canada, 3–6 May 2010; Australian Center for Geomechanics: Perth, Australia, 2010; pp. 147–162. [Google Scholar] [CrossRef] [Green Version]
  37. Rankine, R.M.; Sivakugan, N. Geotechnical properties of cemented paste backfill from Cannington Mine, Australia. Geotech. Geol. Eng. 2007, 25, 383–393. [Google Scholar] [CrossRef]
  38. De Araujo, E.E.B.; Simon, D.; de Franca, F.A.N.; de Freitas Neto, O.; dos Santos Junior, O.F. Shear strength of a Cemented Paste Backfill submitted to high confining pressure. Appl. Mech. Mater. 2017, 858, 219–224. [Google Scholar] [CrossRef]
Figure 1. University of Toronto fieldwork instrumentation: (a) cluster with TEPCs and PWP (photo credit: Ben Thompson while a Research Associate with University of Toronto); (b) clusters deployed in stope at Kidd mine (photo credit: Ryan Veenstra while a PhD candidate at the University of Toronto).
Mining 01 00006 g001
Figure 2. Vertical effective stress development at the indicated mines (referenced with respect to time when backfill covers the TEPC and PWP transducers). Adapted from data presented in [11,12,13,14].
Mining 01 00006 g002
Figure 3. Cohesion development with curing time for Williams, Kidd, and Cayeli mines. Adapted from data presented in [15].
Mining 01 00006 g003
Figure 4. Idealized plug and main pour geometry and dimensions for developing an analytic solution.
Mining 01 00006 g004
Figure 5. Simplified geometry and postulated plug failure mechanism defined as four discrete zones.
Mining 01 00006 g005
Figure 6. Sample failure mechanism from numerical analysis (plastic shear strain contours, dark blue being elastic, with increasing plastic strain magnitude to the red and white zones).
Mining 01 00006 g006
Figure 7. Undercut geometry at Cayeli Stope 685; dimensions in meters. From [11].
Mining 01 00006 g007
Figure 8. Relationship between cohesion, friction angle, and UCS, shown in Mohr’s stress space. Dashed circles are from UCS tests, solid dot markers are from direct shear tests [25].
Mining 01 00006 g008
Figure 9. Self-supporting plug strength UCSss based on plug geometry and assuming UCS = 4c (∅ ≈ 37°). Contours based on Equation (3), mine’s values from Table 2.
Mining 01 00006 g009
Figure 10. Main pour analysis for Kidd and Cayeli 685 stopes. Hm, max(t) values determined using Equation (4).
Mining 01 00006 g010
Figure 11. Main pour analysis for Williams and Cayeli 715 stopes. Hm, max(t) values determined using Equation (4).
Mining 01 00006 g011
Figure 12. Triaxial test effective stress paths for Williams Mine Tailings in undrained (CU) testing (MTCUn, curved stress paths) and drained (CD) testing (MTCDn, linear stress paths). FL is failure line for drained tests. CSRL is constant stress ratio line for undrained tests (interpreted as FL in the undrained condition). PTL is the phase transition line for undrained tests (PT, phase transition, is the point in undrained testing where incremental pore water pressure changes from positive to negative and corresponds to the onset of dilation in drained tests). Figure from [35].
Mining 01 00006 g012
Table 1. Driving and resisting effects for zones in Figure 5. Geometric parameters are defined in Figure 4.
ZoneDriving EffectResisting Effect
plug’s top surface γ H m n/a
above brow, Zone 1 γ H b ~4 c   H b / H u
½-Prandtl, Zones 2 and 3~0.65 γ H u ~3 c
undercut, Zone 4n/a4 c   L u / H u
Some quantities approximated; see text.
Table 2. Geometric parameters for all case studies (all dimensions in m, see Figure 4).
Mine/Stope L u H u H b H p H m f i n a l H t f i n a l
Cayeli 6851.85.53.59.07.416.4
Cayeli 7151.84.52.0 6.58.515.0
Kidd 67-SL16.754.42.0 6.425.632.0
Williams L70-59.34.51.5 6.049.055.0
Table 3. Fill analysis parameters for all case studies, with values determined from [11,12].
Mine/Stope γ r r p l u g t r e f t p l u g t m a i n r r m a i n t f i n a l
(kN/m3)(m/h)(h)(h)(h)(m/h)(h)
Cayeli 68521.40.23939390.2470
Cayeli 71522.40.33820 930.39115
Kidd 67-SL120.60.36518 180.31101
Williams L70-519.80.33718 181.0067
Table 4. Developed cohesion at elevation ½ H u at end of plug pours versus self-supporting strength requirements (cohesion and   U C S ). The Cayeli 715 case is italicized as the only considered non-continuous pour. c s s values determined using Equation (3).
Mine/Stope t p l u g t r e f c ( t p l u g t r e f ) c s s SF U C S s s
(h)(kPa)(kPa) (kPa ϕ = 36°)
Cayeli 6853031201.680
Cayeli 715125160.364
Kidd 67-SL11320 82.532
Williams L70-51114 62.324
Table 5. CPB plug strength requirements at end of backfilling (Strength Factor = 1). The equivalent curing time ( t f i n a l t r e f ) for Cayeli 715 includes the plug cure period and would be about 36 h less if the pour had been continuous. c f i n a l values determined using Equation (6).
Mine/Stope H m f i n a l c f i n a l U C S f i n a l U C S f i n a l t f i n a l t r e f
(m)(kPa)(kPa, ϕ = 27°)(kPa, ϕ = 36°)(h)
Cayeli 6857.443.514117461
Cayeli 7158.545.6 148182107
Kidd 67-SL125.656.5 18422696
Williams L70-549.083.2 n/a33360
Publisher’s Note: MDPI stays neutral with regard to jurisdictional claims in published maps and institutional affiliations.

