Abstract
Mobile Health (mHealth) technologies are transforming healthcare by making it more accessible, efficient, and patient-centric. This study investigates the factors influencing Millennial’s mobile health adoption intention (mHAI). We propose a research model based on the integrated model of the Unified Theory of Acceptance and Use of Technology—UTAUT and the health belief model—HBM. A cross-sectional study was carried out employing purposive sampling to enlist Generation Y (born between 1981 and 1996) and 220 valid questionnaires were collected. We employed structure equation modeling partial least square (SEM-PLS) along with artificial neural network (ANN) and importance–performance map analysis (IPMA) to analyze our model. The research findings revealed that performance expectancy is the most influential factor, while effort expectancy showed no significant association with mHAI. Theoretical and managerial implications are offered to expand the literature on digital healthcare studies, indicating how healthcare providers in developing countries can attract their potential users.
1. Introduction
Modern healthcare has undergone significant advancements over the past few decades, leading to remarkable improvements in patient care, disease management, and overall public health. Within the domain of eHealth, mobile health (mHealth) has developed due to the growing use of mobile technology and its connectivity, enabling access to health-related information. Recent findings stated that mHealth can be advantageous and serve as an alternative to address the challenges faced in healthcare [1]. The global mHealth app market was worth approximately USD 8.0 billion in 2018, and it is expected to grow to USD 111.1 billion by 2025 [2]. Recently, mHealth has become more popular in developing countries. Many governments in these regions have acknowledged its potential benefits and integrated it into their plans to meet health system targets in line with Sustainable Development Goal 3 (SDG 3: Good Health and Well-being) [3]. However, many potential users in developing countries may have limited experience with digital technologies, making it difficult for them to navigate and use health apps effectively [4]. Additionally, integrating mobile health apps into the existing healthcare systems can be challenging, especially as many healthcare service providers are under-resourced and may lack the capacity to support new digital tools. Furthermore, the statistics report by the International Telecommunication Union—ITU [5] showed that about 28% of the population in developing countries had access to the internet compared to 87% in developed countries. In addition, inadequate healthcare infrastructure, including unreliable electricity and poor internet connectivity, can prevent the effective use of mobile health apps [6].
Bangladesh is a rapidly developing South Asian country known for its fast-growing economy and technological advancements [7]. With its large population and increasing internet penetration, it is emerging as a key player in various sectors, including digital health services [8]. Government initiatives, such as the ‘Digital Bangladesh’ vision, have further accelerated the adoption of digital health solutions, bridging the gap between healthcare providers and patients [9]. However, this country faces severe challenges in delivering affordable and accessible healthcare due to limited resources and a high population. Despite offering free medical services through 607 government hospitals and numerous community-level facilities, the country suffers from a critical shortage of healthcare workers (below 1.26 per 1000 people) and hospital beds (4 per 10,000) [10]. Poor infrastructure and high population density further hinder adequate healthcare provision, resulting in lower service consumption compared to other developing nations. In addition to that, 35% of its population lies in Generation Y, and ensuring their mental and physical well-being poses a great threat. This generation includes individuals born between 1981 and 1996 [11]. They feel intense pressure due to the overlapping responsibilities of career advancement, financial pressures, delayed life milestones, parenting, and cultural commitments [12], which often makes them reluctant to take the traditional healthcare system. Furthermore, time constraints, distance, cost, and infrastructure of the existing healthcare system often lead them not to take healthcare services quite often. Such negligent behavior may cause serious health issues in the present or near future. Although quite a large number of healthcare apps have already been launched by the government and non-government organizations, the outcomes of these initiatives are not well understood, as the adoption of mHealth technology failed to reach a satisfactory level [13]. Therefore, there is an urgent need to explore the crucial factors that influence mHealth adoption intention (mHAI) in emerging countries.
Previous research on mobile health studies has often relied on a single theory, such as the Technology Acceptance Model (TAM) and UTAUT. Although these theories are well-suited for IS adoption studies, they may not be sufficient to fully explain health-related research models alone. Therefore, integrating multiple theories is necessary to gain deeper insight into the study. Furthermore, empirical studies related to mobile health studies are mostly conducted in Western regions, such as Slovenia [14], Ethiopia [13], and Ireland [15], and developing nations like China [16], Indonesia [17], and the Philippines [18]. However, their findings may not be applicable in developing countries’ contexts due to socio-economic differences. Therefore, in developing countries, it is a great challenge for policy makers to comprehend which factors influence the adoption intention of mHealth.
In addition, many researchers have tested their models using multiple statistical methods, primarily relying on linear approaches. However, applying a non-linear approach and cross-examining it with a linear method remains rare in mobile health studies, particularly in the context of developing countries. Thus, these mentioned gap leads to answering the following research question: RQ1—What critical factors influence the intention to adopt mobile health applications among Generation Y in Bangladesh? RQ2—Which factors are relatively more important to predict the intention to adopt mobile health applications among Generation Y?
This study offers several key contributions to the field of digital health research. It contributes to mobile health app research in developing countries by exploring pre-adoption behavior, filling a key gap in the literature. Second, this study integrates UTAUT and HBM together to provide a comprehensive understanding of mHealth adoption intention among Generation Y. Third, this study employs a hybrid analytical approach of SEM-ANN-IPMA, ensuring the model is tested in both linear and non-linear ways. Overall, this study enhances the understanding of the adoption intention of mHealth and offers valuable insights for researchers, government, and policy makers within the setting of emerging countries and beyond.
2. Literature Review
2.1. Unified Theory of Acceptance and Use of Technology-UTAUT
The UTAUT model was established by Venkatesh et al. [19] after conducting a comprehensive evaluation of eight prominent models. Performance expectancy, effort expectancy, social influence, and facilitating conditions comprise the four key factors of this model. According to performance expectance, individuals are more inclined to adopt and embrace new technology when they perceive it as beneficial and capable of enhancing their daily lives [6]. Effort expectancy denotes the level of user-friendliness perceived in relation to technology [20]. Users commonly consider the effort involved before choosing to use the system. The study by Kim et al. [21] revealed that the behavioral intentions of individuals regarding the acceptance of mobile devices, such as smartphones and wireless devices, are affected by their social influence. The study in [22] found that facilitating conditions enhance the flexibility of an individual to adopt new technology. Moreover, the UTAUT framework has proven to be more effective in enhancing behavioral intention and usage behavior. Several scholars have employed UTAUT across different technology adoption disciplines, such as internet banking [23] and health information technology [20]; biometric technology [24]; m-banking [22]; augmented reality [25]; e-learning [26]; e-pharmacy [27]; and e-procurement [28]. In the context of the healthcare domain, UTAUT has gained much popularity in terms of explaining good exploratory results. Authors such as Aranha et al. [15], have employed the UTAUT model to measure older patients’ mhealth using intention. Their results showed that all UTAUT constructs significantly predict intention except the additional constructs such as education, age, and privacy. In a similar study in the Chinese context, Zhu et al., [29], examined UTAUT constructs, and their model could adequately predict mHealth using intention. Based on the effectiveness of the UTAUT model, the current study employs the UTAUT base theory to predict mHAI.
2.2. Health Belief Model (HBM)
HBM helps to understand the motivations behind individuals’ choices to implement preventive measures or strategies for dealing with health-related concerns and illnesses [23]. The theory suggests that individuals are likely to take action to overcome barriers if the expected benefits reduce their perceived susceptibility to a serious illness [30]. According to HBM, the development of health behavior among the affected population is promoted by the perceived threat of disease, which is measured by perceived susceptibility and perceived severity, as well as perceived benefits, perceived barriers, and perceived self-efficacy [31]. Contemporary health-related studies have employed HBM in different patterns of human behavior such as contact tracing apps adoption [32]; intention to adopt proper food handling [33]; telehealth adoption among Singaporean citizens [23]; mobile health apps adoption intention during lockdown [34]; and vaccine acceptance during pandemics [35]. The current study is going to measure mHAI. Since this technology adoption is health-related; therefore, employing the HBM in this context is much more appropriate. Thereby, we integrated HBM with the UTAUT model to obtain broader insights into the mHealth adoption intention.
2.3. The Integrated Model
According to Han [36], an integrated model may improve model fit, increase the capacity to forecast behavioral intention, and provide a solid theoretical foundation for comprehending decision-making. Similarly, Jackson et al., [37], mentioned that an integrated perspective model offers a more thorough understanding of the causal mechanisms underlying the correlations and deep insights that cannot be achieved with a single theory-driven model. Therefore, the current study integrates both UTAUT and HBM together to measure mHAI. The integration of the UTAUT and the HBM offers a robust theoretical framework to understand mHealth adoption among Generation Y. While UTAUT primarily focuses on the technological and social determinants of adoption [19], HBM provides insights into the health-related motivational aspects that drive users’ intention to adopt mHealth applications [32,33].
2.4. Prior mHealth Related Studies
The World Health Organization defines mHealth as the use of mobile devices for medical and public health practice [34]. mHealth can significantly improve health outcomes by promoting healthy lifestyles and supporting medical care. mHealth also enhances patient engagement and empowerment by providing individuals with access to their health data, educational resources, and self-management tools. Patients can track their fitness, diet, and medication adherence, leading to more informed and healthier lifestyle choices [35]. Moreover, mHealth reduces the need for in-person visits, lowering travel and healthcare costs for patients.
The adoption of mHealth technologies is witnessing substantial growth worldwide, influenced by several factors such as the increasing prevalence of chronic diseases, the widespread use of smartphones, and advancements in mobile connectivity [36]. A variety of healthcare apps have been introduced on mobile phones, such as telemedicine, fitness apps, doctor appointments, etc. Although the healthcare business’s initial success is dependent on the user’s higher adoption rate, potential challenges may arise from individual’s different perceptions. Thus, determining the crucial antecedents behind the intention to adopt mHealth is a popular arena of research. The topic of mHealth adoption has been extensively studied in the past. Those studies have explored the factors that affect user behavior towards different types of mHealth apps. Investigations are aimed at explaining the determinants from a range of theoretical perspectives (see Table 1), such as Pai and Alathur, Ref. [37] who employed the TAM and health belief model to assess the factors impacting individual’s intentions to adopt mHealth in the Indian market, and their research highlighted perceived usefulness as the most influential antecedents. Wu et al. [38] examined the extended UTAUT2 model in the context of a mobile health application in China and added additional constructs such as altruism, cognitive trust, and online rating. Similarly, Hassan et al., [39], measured Bangladeshi patients’ intention to adopt mHealth apps by extending the UTAUT model. In their model, they included personal innovativeness and perceived trust. In a similar country context, Rahman et al., [3], modified the UTAUT2 model to include lifestyle and attitude as additional constructs to determine female users’ actual usage of wearable health-monitoring technology. Using the expectation confirmation theory (ECT), Lu et al., [40], examined how perceived usefulness to satisfaction has a direct influence on continuance intention to use telemedicine apps in the Indonesian context. In another study, Aranha et al., [15], examined exclusively older adults’ mobile health adoption, and they employed the UTAUT model by adding constructs such as self-efficacy, cognitive and physical changes in age, education subjective health status, privacy, existing degree of satisfaction, and age.

Table 1.
Summary of mHealth empirical studies.
The existing literature is insufficient to explore the intention to adopt mHealth in the least developed country context. However, the present research differs from previous studies because it integrates the theory of UTAUT and HBM, enlarging the range of most influential factors on the adoption intention of mHealth among Generation Y, whereas in Table 1, most of the mHealth studies are employed using a single theory, unable to draw a comprehensive representation of research framework in the context of least developing countries.
2.5. Hypotheses Development
2.5.1. Performance Expectancy (PE)
Performance expectancy is the measure of an individual’s confidence in the ability of a particular technology to enhance their performance [19]. In this study, performance expectancy will improve an individual’s intention to adopt mHealth. Numerous studies have shown that performance expectancy can strongly influence users’ intention to use different technologies, such as mobile apps for healthy living by Yan et al., [44]; patients’ m-health using intention [41]; and electronic health record systems [45]. Therefore, from past studies, it is evident that greater usefulness in technology may lead to greater intention to adopt healthcare applications on smart phones. Moreover, Wu et al., [38], studied further how PE influences physicians’ intention to adopt mobile health apps. Similarly, Gumasing et al., [18], examined the significant relationship between PE and smartwatch adoption intention in the health domain. Hence, we propose the following hypothesis for this study:
H1:
Performance expectancy positively influences mHAI.
2.5.2. Effort Expectancy (EE)
Effort expectancy, in this study defined as the amount of effort required for a person to accomplish a task using mHealth. Effort expectancy comprises three dimensions: ease of use, ease of learning, and ease of skill acquisition [46]. The concept of effort expectancy as outlined in UTAUT has the capacity to examine the intention to continue using a technology, as indicated by Venkatesh et al. [47]. The prior IS literature has shown that users tend to have a positive attitude toward adopting various technologies when they find them easy to use, such as health information systems [48]; e-health records [49]; wearable health monitoring gadgets [3]; and virtual reality adoption in the healthcare sector [50]. Moreover, the importance of the associations between EE and users’ continuous intention through satisfaction has been reported in a mHealth study by Yan et al., [42]. Finally, the simpler the product is to use, the more operative and the more likely people will adopt it. Thus, the following hypothesis is proposed for this study:
H2:
Effort expectancy positively influences mHAI.
2.5.3. Social Influence (SI)
The term social influence, or subjective norm, denotes the influence exerted by an individual’s selected social referents to encourage a specific behavior [51]. The prospective users will appreciate the viewpoints of those individuals as valuable insights and give due regard to their recommendations. The theory of social influence suggests that the approval of important others can facilitate the integration of a specific technology by individuals [52]. In this study’s context, people may be influenced by different social groups, thus receiving recommendations to understand the benefits of using mHealth. The more the individuals accept suggestions, the more likely it is that they will decide to use digital healthcare platforms. Prior technology adoption studies have shown the significant influence of social influence on behavioral intention, such as wearable health monitoring technology [3] and mobile health acceptance [17]. Moreover, Cao et al. [53] have found in their study that SI has a significant association with young adult’s mHealth adoption intention. So, it can be said that social influence can be a strong predictor of measuring mHAI. Therefore, we have proposed the following:
H3:
Social influence positively influences mHAI.
2.5.4. Facilitating Conditions (FC)
Facilitating conditions refer to the extent to which individuals perceive that the resources and technological infrastructure are supportive of the system’s implementation [19]. The availability of smartphones, internet access, and suitable healthcare apps for both Android and iOS users can boost users’ willingness to use mHealth [47]. Moreover, previous research has shown that an individual’s intention to use wearable technology for health information is significantly influenced by the level of facilitating conditions [13]. The higher the level of healthcare service provider’s support, the more favorable the mHealth app usage is among users [3]. Previous studies have identified significant relationships between facilitating conditions and physicians’ intentions to adopt mHealth [16]. Thus, it is assumed that there is a positive link between FC and the behavioral intentions to adopt mHealth. Therefore, we propose the following hypothesis:
H4:
Facilitating condition positively influences mHAI.
2.5.5. Perceived Susceptibility (PSU)
Perceived susceptibility concerns an individual’s belief regarding the probability of encountering a health problem [54]. Given the assumption of HBM, people are more likely to use healthcare apps on their mobile phones when they perceive themselves as vulnerable to health and mental issues and view these conditions as serious. Perceived susceptibility influences mHealth adoption by increasing awareness and concern about potential health risks, thereby motivating individuals to seek out and use technological solutions that can help them manage their health [55]. High perceived susceptibility can serve as a strong motivator for individuals to adopt mHealth technologies. For example, if a person believes they are at high risk for diabetes, they may be more inclined to use a mobile app that tracks their blood sugar levels, diet, and physical activity. Several health-related studies have proven the significant relationship between perceived susceptibility and mHealth adoption intention, such as mHealth service [56,57] and telemedicine apps [58]. Therefore, the following hypothesis is proposed for the current study.
H5:
Perceived susceptibility positively influences mHAI.
2.5.6. Perceived Severity (PS)
Perceived severity refers to an individual’s belief about the seriousness or severity of a potential health issue or condition [59]. In the context of health behavior, perceived severity is a key factor in shaping an individual’s motivation to engage in preventive health behaviors or seek medical interventions [34]. If a person believes that a health condition is severe, they may be more likely to take preventive actions, such as adopting healthier lifestyles, getting vaccinated, or using health monitoring technologies like mHealth applications [60]. Therefore, it can be stated that the higher perceived severity of potential health issues positively influences the intention to adopt mHealth applications. Prior many studies have found the correlation between perceived severity and mHAI. Shao et al., [61], have examined perceived severity in telemedicine intention studies and found perceived severity as significant factor. Based on the preceding discussion, we propose the following hypotheses:
H6:
Perceived severity positively influences mHAI.
2.5.7. Health Benefit (HB)
In the health belief model (HBM), health benefits refer to an individual’s belief in the effectiveness of taking a recommended health action to reduce the risk or seriousness of a disease or condition [62]. If individuals believe that a particular health behavior will help them avoid illness or improve their health, they are more likely to engage in that behavior. Researchers have revealed health benefits as a significant antecedent of mHealth adoption intention [63]. A recent study by Yang et al., [17], has validated the relationship between health benefits and mHAI. In this study’s context, individuals who are more convinced of the mHealth benefits would be more willing to use mobile health apps. Therefore, we can propose the following hypothesis:
H7:
Health benefit positively influences mHAI.
2.5.8. Health Motivation (HM)
Health motivation is the desire to engage in behaviors and make choices that promote physical, mental, and emotional well-being [17]. It encompasses the intrinsic and extrinsic factors that encourage individuals to adopt mHealth. Health apps that align with an individual’s intrinsic motivation for health improvement can enhance their intention to adopt mHealth [64]. Extrinsic motivation, as a component of health motivation, is driven by the desire to earn rewards or avoid punishments from outside sources such as friends, family, doctors, and peers [65,66]. Several empirical studies have found a positive association between health motivation and mHAI [44]. Therefore, it can be expected that high health motivation can increase the perceived importance of using mHealth to manage health, thus strengthening the intention to adopt mHealth. Therefore, we propose the following hypothesis for this study:
H8:
Health motivation positively influences mHAI.
In summary, the model constructed in this paper is shown in Figure 1.
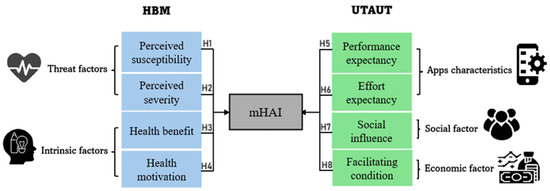
Figure 1.
Research framework.
3. Research Method
3.1. The Measures
All the constructs in our model were measured on a 7-point scale (1 = “strongly disagree”, 7 = “strongly agree”) adapted from multiple sources as depicted in Table 2. In addition, all the questionnaire items were chosen based on their reflective construct nature. Then, the respondents were asked to provide their socio-demographic information such as year of birth, gender, educational level, and frequency of internet usage, which are summarized in later section.
Table 2.
Instrumentation source.
3.2. Pre-Test
To verify the face and content validity of the questionnaire, we conducted a pre-test involving three healthcare industry experts, two academics, and three IT specialists. This pre-test aimed to ensure that the content was valid, clear, meaningful, and easily comprehensible. Based on their feedback, several modifications were made to the final questionnaire. After incorporating their suggestions and making the necessary revisions, the finalized questionnaire was established. Following this, a pilot test was conducted with 30 randomly selected mobile phone users, which demonstrated satisfactory results for the credibility and validity of the dataset.
3.3. The Study Settings, Target Population, and Sampling
The current study collected survey data from Dhaka, the capital of Bangladesh. As a cosmopolitan hub, Dhaka experiences significant population movement from various regions of the country and serves as a key connecting point [69]. Twelve major hospitals were selected for questionnaire distribution due to their strong reputation and nationwide patient visits.
The survey in this study was directed toward participants who are categorized as Millennials or Generation Y, born between (1981–1996), because they represent 35% of the total population of Bangladesh, and their health directly affects the overall public health status of the nation [70]. Many researchers discovered that Generation Y exhibits worse physical health; engages in more unhealthy behaviors such as stress, poor diet, lack of physical activity, alcohol use, and smoking; and experiences higher levels of depression and anxiety compared to earlier generations [8,11]. In addition, these people are more technology-prone and heavy users of technological devices in their daily life activities [71].
Since we are measuring individuals’ mHealth adoption intention, thereby it is required to collect data from the appropriate respondents. In this context, the study employs a purposive sampling method, adhering to the questionnaire design guidelines outlined by Lee and Chen [72]. According to that, we first introduced a few screening questions (Yes or No) that asked the respondents whether they had a preliminary understanding of mHealth? Were they born in between (1981–1996)? Only the respondents who responded “Yes” were allowed to proceed with the questionnaire. Furthermore, to eliminate the response bias, we excluded the actual users of mHealth by providing options to tick users/nonusers.
The current study’s sample size was determined by a G-power analysis because the sample frame of the population is unknown. The study requires a minimum sample size of 160 participants, considering a G-power statistic with an effect size of 0.15, a significance level (α) of 0.05, and a power (1-β) of 0.95, along with eight predictors.
3.4. Data Collection Procedure
For the distribution of the questionnaire, we were required to obtain permission from the hospital authority. Afterwards, the questionnaire was administered to patients and visitors in the hospital’s outpatient departments and waiting areas. Data collection procedures have been conducted from September 2024 to November 2024 by distributing printed questionnaires. To achieve a minimum of 160 data points, we have distributed 500 questionnaires considering the lowest response rate of 48% among similar studies in the Bangladeshi context. Finally, we received 244 responses, out of which 24 were rejected for not meeting the purposive sampling criteria, resulting in 220 valid responses for the final data analysis.
3.5. Common Method Bias (CMB)
The presence of common method variance poses a significant challenge in behavioral research [73]. The data collected with a single respondent questionnaire may be subject to common-method bias, which, therefore, manipulates the statistical findings [74]. Consequently, the current study uses Harman’s one-factor test to address and reduce the potential impact of common method bias and determine if a single latent factor adequately captures all of the theoretical constructs [75]. The result validated that there are no concerns regarding common method variance in this study, although it explained 22% variance for a single factor. This study also assessed CMV (common method variance) in accordance with Kock’s [76] recommendation, which involved examining the complete collinearity among all the constructs, as displayed in Table 3. The VIF values greater than 5 [77] and 3.3 show a potential collinearity problem in the dataset. However, our results show the absence of any single-source data bias.
Table 3.
Full Collinearity Test with VIF values.
3.6. Data Analysis
3.6.1. Linear Analysis (SEM-PLS-IPMA)
This study uses the hybrid analytical linear approach of SEM-IMPA to evaluate an individual’s intention to adopt mHealth. PLS-SEM is a second-generation statistical approach that enables researchers to examine complicated multivariate correlations between observed and latent variables by approaching its linear mechanism [78]. Moreover, because the data in this study do not follow a normal distribution, PLS was selected due to its lack of reliance on normality assumptions [77]. In addition to that, this study employs importance–performance map analysis (IPMA) to provide practical and managerial insights by identifying which factors have the highest impact on an outcome and assessing their current performance levels. Unlike PLS-SEM, which focuses on path coefficients and significance testing, IPMA extends the analysis by mapping the importance (effect size) of independent variables against their performance (average construct values).
3.6.2. Non-Linear Analysis (ANN—Artificial Neural Network)
The artificial neural network is structured similarly to the human brain, comprising neurons, synapses, and axons. It possesses the ability to expand knowledge through its adaptive learning capabilities [79]. One of the main benefits of implementing neural networks is their proficiency in analyzing both complex linear and non-linear relationships between predictors and the acceptance decision, which allows for the ranking of factors according to their importance [80]. The fundamental processing elements of ANN are known as neurons or nodes. The information acquired from the environment is encoded in the weights of the interconnected neurons, commonly referred to as synaptic weights [8]. In this empirical study, the prevalent feed-forward back-propagation (FFBP) model, utilizing a multi-layer perceptron architecture, was employed during both the training and testing phases. Generally, the FFBP model is structured with three sequential layers: input, hidden, and output. All layers’ neurons are interconnected through synaptic weights. In the FFBP framework, the input layer neurons receive and process data, which is then forwarded to the output layer neurons via the hidden layer neurons. This forward flow results in the generation of errors, which are subsequently fed back to the input layer neurons during the training process [81]. To enhance the model’s predictive accuracy, it is crucial to minimize these errors through continuous training. Moreover, neural networks are recognized for their robustness and superior predictive capabilities when compared to standard regression models [80,82,83].
4. Empirical Results
4.1. Demographic Results
Descriptive statistics were used to analyze the demographic samples, and the demographic characteristics of the participants are shown in Table 4. It represents the statistics of the participants across four profiles: year born, academic qualification, and frequency of internet usage. The analysis shows that among the respondents born between 1981 and 1996, 42.8% (n = 94) were male, while 57.2% (n = 126) were female, indicating a higher representation of participants in the sample. Academic qualifications show that 51.8% hold a Bachelor’s/Honors degree, followed by 28.6% with a master’s degree, and smaller percentages for other levels. Regarding internet usage, 45.9% use the internet moderately (3–6 h/day), 30.1% heavily (6+ h/day), 19.6% lightly (1–3 h/day), and 4.21% seldom or not at all.
Table 4.
Representation of demographic statistics.
4.2. Measurement Model Evaluation
The assessment of the constructs’ reliability and validity is depicted in Table 5. For reliability testing, using Cronbach’s Alpha (CA), this study demonstrated values exceeding 0.7, signifying the reliability of all the variables. Dijkstra–Hensele’s rho (rho-A) and composite reliability (CR) were utilized to measure internal consistency reliability, with a required threshold exceeding 0.7103. Upon assessing internal composite reliability (CR), the findings indicated that all the variables exhibited CR values exceeding 0.857, ensuring the high reliability of the items. Average Variance Extracted (AVE) values were employed to quantitatively represent the extent to which latent variables accounted for the total variances observed in the measured variables, while also considering the influence of measurement errors [84]. Moreover, Fornell and Larcker [85] recommend an AVE threshold above 0.50 for evaluating convergent validity. After the data analysis, the current study’s dataset revealed that all the items had AVE values ranging between 0.638 and 0.895, exceeding the recommended minimum threshold of 0.50. Discriminant validity is required to assess whether the measures of different factors, which could potentially have some degree of overlap, are indeed distinct and not highly correlated with each other [86]. To increase the depth of our comprehension and ensure that discriminant validity was met, this study utilized approaches like the Fornell–Larcker criterion and the Heterotrait–Monotrait Ratio (HTMT) (as shown in Table 6). Since all the correlations are represented below the square root of the (AVE), it is reasonable to conclude that the conceptual model exhibits strong discriminant validity [85].
Table 5.
Measurement model evaluation.
Table 6.
Analysis of discriminant validity.
4.3. Structural Model Analysis
Based on the SEM-PLS analysis, the inner model evaluation results (see Table 7 and Figure 2) revealed all the HBM antecedents, perceived susceptibility (H1), perceived severity (H2), health benefits (H3), and health motivation (H4) significantly affected mHAI (respectively, β = 0.147, p < 0.001; β = 0.110, p < 0.006; β = 0.184, p < 0.001; and β = 0.173, p < 0.001). Moreover, all the UTAUT model constructs, performance expectancy (H5-β = 0.240, p < 0.000), social influence (H7- β = 0.179, p < 0.001), and facilitating condition (H8-β = 0.162, p < 0.002) were found supported, except effort expectancy (H6-β = 0.067), which was found non-supported. The empirical model explained 71% of the variance in addressing mHAI. The table also depicted the f2 value or the effect size. Furthermore, the model’s predictive relevance was assessed by utilizing the predictive sample reuse technique (Q2) [87]. The models exhibited predictive significance as indicated by the Q2 value (0.380), which exceeds zero for all the endogenous variables within the model.
Table 7.
Structural model evaluation.
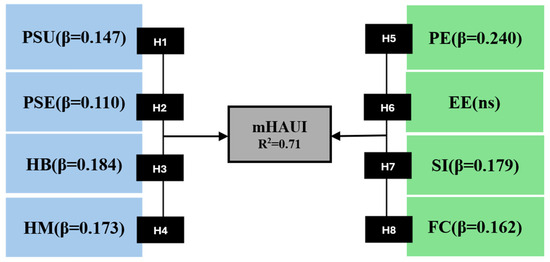
Figure 2.
Structural model.
4.4. IPMA Findings
According to Ringle and Sarstedt [88], “The IPMA gives researchers the opportunity to enrich their PLS-SEM analysis and, thereby, gain additional results and findings. More specifically, instead of only analysing the path coefficients (i.e., the importance dimension), the IPMA also considers the average value of the latent variables and their indicators (i.e., performance dimension)”. Our study utilized IPMA by using the PLS-3.0 software, focusing on mHAI as the target variable. The performance–importance chart, illustrated in Figure 3, exemplifies the distribution of these indices. Regarding the contribution to mHAI, performance expectancy is by far the most important construct (total effect = 0.240). The population also displays (see Table 8) positive PE towards mHAI, as shown by its performance of 78%. HB ranks second in importance (0.184), followed by SI (0.179), HM (0.173), FC (0.162), PS (0.147), and PSE (0.110), while effort expectancy, being a non-supported construct, demonstrated a negligible impact, underscored at 0.067. PE, SI, and HM are all positioned in the quadrant of high importance and performance, indicating that adequate resources have been dedicated to policies addressing essential latent constructs. Even though effort expectancy and perceived severity are less important, their high performance indicates that too many resources have been allocated to them. Overall, the successful efforts of previous policies in targeting PE, SI, and HM should be maintained, while some attention from effort expectancy and perceived severity can be redirected to other antecedents, such as FC, PS, and HM, which lie in the quadrant of medium importance and high performance in the IMPA graph.
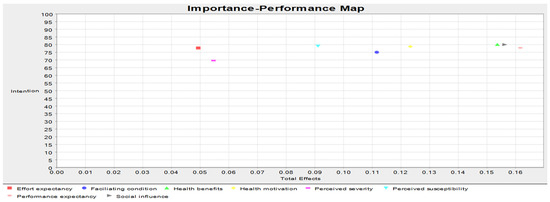
Figure 3.
IMPA for the target construct of mHAI.
Table 8.
Constructs importance and performance value derived from IPMA.
4.5. Neural Network Results
The primary aim of this neural network analysis is to evaluate the predictive accuracy, which is determined by utilizing specific sections of training and testing data. Moreover, the RMSE values for both the training and testing data (shown in Figure 4) illustrate the relative precision of the predictions [81]. This method utilizes a single hidden layer (see Figure 5) because it is sufficient to adequately represent a continuous function. To address the overfitting problem, a ten-fold cross-validation technique was applied. In this study, the data were divided into two sets: 70% of the data were allocated for training the neural network model, and the remaining 30% were used to assess the predictive accuracy of the trained model.
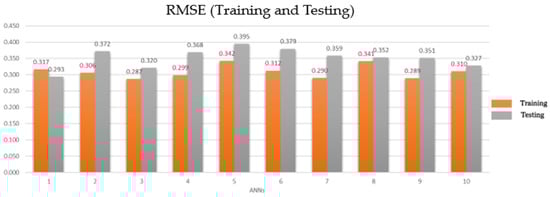
Figure 4.
RMSE (training and testing data).
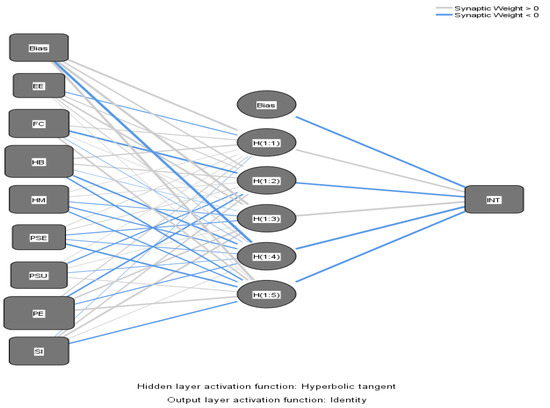
Figure 5.
ANN model.
The RMSE values in this study were documented to fall within the range of 0.287 to 0.342 for the training dataset and 0.293 to 0.395 for the testing dataset. These results reveal the study model’s high accuracy and strong predictive capacity, as evidenced by the closely clustered and small magnitude of the values. The sensitivity analysis is used to measure the impact of exogenous on endogenous constructs [89]. The results as depicted in Table 9 have substantiated that the most important variable of mHAI was PE, followed by HB, HM, FC, PSU, PSE, and SI.
Table 9.
Sensitivity analysis of mHAI.
4.6. Ranking and Comparison Between SEM and ANN
Table 10 compares the importance of various constructs as ranked by SEM-PLS and ANN. The rankings indicate how each construct is prioritized by each method. Both analysis shows that “performance expectancy” and “health benefits”, are ranked first and second, respectively. However, there are notable differences in rankings for other constructs. For instance, “Social Influence” is ranked third in SEM-PLS but seventh in ANN, indicating a disparity in its perceived importance. Similarly, “effort expectancy” is consistently ranked eighth by both methods, while constructs like “health motivation” and “perceived severity” show varying rankings, suggesting that the two methods prioritize certain factors differently. Overall, this comparison highlights the different emphases each analytical approach places on the constructs.
Table 10.
Comparison between SEM-PLS and ANN.
5. Discussion
The current study path analysis results found effort expectancy is non-supported, although prior mobile payment studies showed the same results [90]. However, the result contradicts the findings of the original UTAUT study by Venkatesh [19]. The non-supported results could be due to users not being particularly concerned about the ease of use of mHealth, likely because the Millennials grew during the rise in the internet and smartphones, making them comfortable with digital tools and apps. They are generally quick to adapt to new technology, including various mobile apps. Moreover, in collectivist cultures, users benefit from strong social support, which alleviates any challenges in understanding an app’s features and functions. Finally, the dual-language feature (English and Bengali) enhances users’ understanding of various app functions, eliminating effort-related challenges and resulting in no significant association between effort expectancy and mHAI.
The findings revealed the most significant factor is PE, which signifies that users may receive utilitarian benefits from mobile health applications such as quick inquiry by using an AI chatbot [91], no appointment [92], automated prescription [93], and real-time service [16]. Our findings are aligned with several prior studies, such as mobile health adoption [15]; wearable health-monitoring technology [3]; and social mobile apps [94].
The correlation between SI and mHAI is supported by our study, which revealed that it plays a significant role in establishing its importance regarding social interaction and its relationship with technology. For example, Millennials often rely on recommendations from friends and family. If peers are using and benefiting from mHealth, they are more likely to adopt them as well. Therefore, in this scenario, they may receive higher recommendations from them to use this mobile health platform to inquire about their mental and health issues. Prior studies also portray similar outcomes, such as mHealth in China [34] and telemedicine service acceptance [95].
The empirical findings of this study have established significant influences of FC on the mHAI. The result was parallel with the recent research [96,97]. Furthermore, the necessary facilities for mHealth (e.g., fast internet connections, reliable Wi-Fi, android or iOS cell phones, and applications with dual language) are recognized as the fundamental aspects of operating mHealth. Ultimately, individuals would likely use mHealth if they were supported by techno or other facilities related to their service.
The SEM results also showed that all the HBM constructs are significant in relation to mHAI. A prior study by Walrave et al., [32], has shown that both PSU and PSE have a positive significant relationship with contact tracing apps adoption behavior. In addition, several health-related studies [44,67,98] have found similar results. The findings also revealed the significant results of both HB and HM, which were aligned with the prior similar empirical research findings [68].
The analysis of IPMA yields findings that can pinpoint the gaps between the importance levels and the performance levels of the constructs represented in the model. According to the IPMA results, since effort expectancy and perceived severity exhibit high performance but low importance, organizations and policy makers should reallocate efforts toward more impactful constructs such as facilitating conditions, perceived severity, and health motivation, which fall into the medium-importance, high-performance quadrant. By doing so, they can focus on improving infrastructure support, such as reliable internet access and technical assistance, and enhancing security measures to address digital fraud and data privacy concerns will have a more significant impact on the adoption and sustained usage of mHAI. Moreover, digital health service providers can reinforce performance expectancy by collaborating with public health agencies and hospitals to offer seamless access to medical records, telemedicine, and e-prescriptions. Social influence can be strengthened through community influence and key opinion leader endorsements. Simultaneously, health motivation can be enhanced with culturally relevant gamification, including localized rewards, interactive learning, and user incentives.
6. Implications of the Study
Present research offers crucial theoretical and practical contributions and implications for the benefit of researchers, academicians, practitioners, government, and policy makers.
6.1. Theoretical Contributions
This research has made multiple theoretical contributions to the field of digital healthcare. First, this study integrated both the UTAUT and HBM, distinguishing threat, social, intrinsic factors, and app characteristics to obtain full insights into an individual’s mHAI. As far as we are aware, only a few studies have integrated these two models to predict mHAI. The integrated framework is more advanced than a single model, indicating that combining the HBM and UTAUT concepts improves the predictive power for the intention to adopt mHealth. Prior literature has asserted that incorporating two or more theories into a study leads to a better understanding of the phenomenon under examination [99], and in a digital health context [44]. Secondly, the current study enriches the health literature by examining Millennial’s mHAI, whereas the majority of the studies concentrated on elder age people’s mobile health-using behavior. Methodologically, this study employed a hybrid approach combining SEM, ANN, and IPMA analyses to determine the normalized importance of constructs and identify those with higher and lower performance. Finally, the research findings unveiled R2 values of 71% which demonstrate a greater explained variance in comparison to the other integrated models like HBM-ECM = 0.457; HBM-TCT = 0.559. As a result, it can be determined that the integration of two models led to an improved understanding of Millennials’ mHAI compared to the other integrated models in the health domain. These theoretical insights unveiled in this research will provide the basis for future research on the digital health sector.
6.2. Practical Contributions
This study has some practical contributions. The results of this study will help the healthcare industry to formulate market strategies and increase users’ satisfaction. In this study, performance expectancy was found to be the most influential factor. Which helps healthcare service providers to focus more on providing unitarian benefits to their customers. In addition, they should offer adequate customer support so that users can utilize the features and receive maximum benefits out of them. As health benefits are revealed as the second most influential factors, therefore, healthcare service providers should provide adequate serviceable options and ensure patient privacy, where users can receive maximum trustworthiness in using mHealth. Such options include service, telemedicine, AI prescription generator, health finance and insurance. Furthermore, social influence is considered as the third most influencing factor. In this regard, health industry experts should widely introduce the mHealth features and benefits to rural to urban areas. The educational institute can be a suitable place for familiarization with their mobile application’s new features and existing services as well. As a result, social awareness will increase, and users tend to adopt mHealth. The current study also found facilitating conditions as supported, thereby, healthcare service providers must consider the pre-requisite utilities availability. Such as affordable smart phones, internet connection especially in urban areas, low subscription fees, and reputed health experts’ availability. For this, we can suggest healthcare providers to alliance with government and other stakeholders to facilitate their potential customers. Furthermore, the health motivation construct from HBM signified our findings, and the government and private health sectors can modify their existing health offering with additional features, such as Medi-insurance, which can motivate users and at the same time give assurance of the potential health risk in the future. For perceived susceptivity and severity, healthcare experts or doctors can encourage the patients to adopt mHealth parallel to the contemporary health service. Finally, healthcare providers should educate their potential customers about the health benefits and gain trustworthiness. In this regard, government and health NGOs can play a significant role in the establishment of trust and belief among digital health service users.
7. Limitations and Future Recommendations
Despite our efforts to thoroughly explore all the relevant dimensions of the topic, our study is subject to certain limitations. First, this study used a cross-sectional survey, which may not capture users’ post-adoption behavior over time. Since mHealth adoption evolves with user experience and technological changes, a longitudinal study is recommended to better understand long-term engagement, emerging barriers, and sustained adoption factors.
Second, this study discusses mHealth in general, even though healthcare apps differ significantly by type—such as telemedicine, doctor appointment scheduling, female fertility tracking, and fitness applications. Given that different app types are associated with unique behavioral patterns, future studies could adopt an experimental setup to analyze variations in adoption behavior across multiple mHealth applications.
Third, this study focuses on “intention to adopt” as the key dependent variable. Future research could explore post-adoption behaviors such as actual adoption, continuance intention, satisfaction, switching behavior, and loyalty, providing deeper insights into user engagement and retention.
Fourth, the current research does not incorporate mediating or moderating constructs. To enhance the explanatory power of future models, moderating variables such as gender, internet speed, and internet cost could be examined to understand their influence on adoption behavior across different user segments.
Finally, this study is conducted in an emerging market context, which may limit its generalizability to other economic settings. Future research could undertake cross-cultural comparisons between developing and developed countries to gain broader insights into how economic and cultural differences impact mHealth adoption.
8. Conclusions
Empirical studies on Millennials’ adoption intention of mHealth remain limited, particularly in the digital healthcare domain of least-developed countries. However, understanding adoption intention presents a significant challenge, emphasizing the need for further research in this area. This study addresses both research questions. For Research Question 1, factors from both the UTAUT and the HBM influence the mHAI. Among them, all the constructs were found supported except effort expectancy. For Research Question 2, performance expectancy emerges as the most important factor, followed by HB, HM, FC, PSU, PSE, and SI. Finally, the integrated model has provided more insightful explanations and has a high explanatory power (R2 = 71%) to explore the factors influencing mHAI. The research provides great theoretical and managerial insights aimed at enhancing understanding of the mHAI in least-developed countries or beyond.
Author Contributions
A.R.: conceptualization, writing—original draft, and analysis of result; J.U.: review/editing and investigation; A.R.: formal analysis, data curation, and data analysis; J.U.: project administration; J.U.: supervision. All authors have read and agreed to the published version of the manuscript.
Funding
This research is funded by Woosong University Academic Research 2025.
Institutional Review Board Statement
The study was conducted in accordance with the Declaration of Helsinki, and approved by the Research Ethics Committee (REC) of FSIT DIU/FIST/Ethical Clearance (2024-241004 and approved on 15 August 2024).
Informed Consent Statement
Informed consent was obtained from all subjects involved in the study.
Data Availability Statement
The data will be made available upon request from the corresponding author.
Conflicts of Interest
The authors declare no conflicts of interest.
References
- Lee, E.; Han, S. Determinants of adoption of mobile health services. Online Inf. Rev. 2015, 39, 556–573. [Google Scholar] [CrossRef]
- Vrontis, D.; El Chaarani, H.; El Abiad, Z.; El Nemar, S.; Haddad, A.Y. Managerial innovative capabilities, competitive advantage, and performance of healthcare sector during COVID-19 pandemic period. Foresight 2022, 24, 504–526. [Google Scholar] [CrossRef]
- Rahman, M.S.; Hasan, N.; Zhang, J.; Moral, I.H.; Hossain, G.M.S. Women’s adoption of wearable health-monitoring technology: Empirical evidence from a least developed country. Aslib J. Inf. Manag. 2024, 76. [Google Scholar] [CrossRef]
- Pal, S.; Biswas, B.; Gupta, R.; Kumar, A.; Gupta, S. Exploring the factors that affect user experience in mobile-health applications: A text-mining and machine-learning approach. J. Bus. Res. 2023, 156, 113484. [Google Scholar] [CrossRef] [PubMed]
- International Telecommunication Union. Measuring Digital Development: Facts and Figures 2021; International Telecommunication Union: Geneva, Switzerland, 2021; Available online: https://www.itu.int/en/ITU-D/Statistics/Pages/facts/default.aspx (accessed on 8 January 2025).
- Edo, O.C.; Ang, D.; Etu, E.E.; Tenebe, I.; Edo, S.; Diekola, O.A. Why do healthcare workers adopt digital health technologies? A cross-sectional study integrating the TAM and UTAUT model in a developing economy. Int. J. Inf. Manag. Data Insights 2023, 3, 100186. [Google Scholar] [CrossRef]
- Sampa, M.B.; Rahman, M.M.; Ahmmed, R.; Ahmed, M.R.; Zaman, M.U.; Akter, S.; Hasan, M.M.; Faruque, F.; Saha, S.; Bhuiyan, M.N.; et al. Redesigning Portable Health Clinic Platform as a Remote Healthcare System to Tackle COVID-19 Pandemic Situation in Unreached Communities. Int. J. Environ. Res. Public Health 2020, 17, 4709. [Google Scholar] [CrossRef]
- Alam, M.Z.; Hu, W.; Kaium, M.A.; Hoque, M.R.; Alam, M.M.D. Understanding the determinants of mHealth apps adoption in Bangladesh: A SEM-Neural network approach. Technol. Soc. 2020, 61, 101255. [Google Scholar] [CrossRef]
- Hossain, M. Digital Bangladesh Vision and the Current State of Digitalization. In Digital Transformation and Economic Development in Bangladesh: Rethinking Digitalization Strategies for Leapfrogging; Springer Nature Singapore: Singapore, 2022; pp. 29–56. [Google Scholar]
- Khan, M.M.H.; Grübner, O.; Krämer, A. Frequently Used Healthcare Services in Urban Slums of Dhaka and Adjacent Rural Areas and Their Determinants. J. Public Health 2012, 34, 261–271. [Google Scholar] [CrossRef] [PubMed]
- Windasari, N.A.; Kusumawati, N.; Larasati, N.; Amelia, R.P. Digital-only banking experience: Insights from Gen Y and Gen Z. J. Innov. Knowl. 2022, 7, 100170. [Google Scholar] [CrossRef]
- Duh, H.I. Childhood family experiences and young Generation Y money attitudes and materialism. Personal. Individ. Differ. 2016, 95, 134–139. [Google Scholar] [CrossRef]
- Walle, A.D.; Ferede, T.A.; Shibabaw, A.A.; Wubante, S.M.; Guadie, H.A.; Yehula, C.M.; Demsash, A.W. Willingness of diabetes mellitus patients to use mHealth applications and its associated factors for self-care management in a low-income country: An input for digital health implementation. BMJ Health Care Inform. 2023, 30, e100186. [Google Scholar] [CrossRef] [PubMed]
- Dolničar, V.; Petrovčič, A.; Škafar, M.; Laznik, J.; Prevodnik, K.; Hvalič-Touzery, S. Determinants of the intention to use mHealth in the future: Evidence from an intervention study of patients with chronic diseases in Slovenia. Int. J. Med. Inform. 2024, 190, 105537. [Google Scholar] [CrossRef] [PubMed]
- Aranha, M.; Shemie, J.; James, K.; Deasy, C.; Heavin, C. Behavioural intention of mobile health adoption: A study of older adults presenting to the emergency department. Smart Health 2024, 31, 100435. [Google Scholar] [CrossRef]
- Wu, X.; Liu, C.; Wang, L.; Bilal, M. Internet of Things-enabled real-time health monitoring system using deep learning. Neural Comput. Appl. 2023, 35, 14565–14576. [Google Scholar] [CrossRef]
- Yang, M.; Al Mamun, A.; Gao, J.; Rahman, M.K.; Salameh, A.A.; Alam, S.S. Predicting mHealth acceptance from the perspective of unified theory of acceptance and use of technology. Sci. Rep. 2024, 14, 339. [Google Scholar] [CrossRef]
- Gumasing, M.J.J.; Carrillo, G.Z.D.V.; De Guzman, M.A.A.; Suñga, C.A.R.; Tan, S.Y.B.; Mascariola, M.M.; Ong, A.K.S. Investigating user-centric factors influencing smartwatch adoption and user experience in the Philippines. Sustainability 2024, 16, 5401. [Google Scholar] [CrossRef]
- Venkatesh, V.; Morris, M.G.; Davis, G.B.; Davis, F.D. User acceptance of information technology: Toward a unified view. MIS Q. 2003, 27, 425–478. [Google Scholar] [CrossRef]
- Kijsanayotin, B.; Pannarunothai, S.; Speedie, S.M. Factors influencing health information technology adoption in Thailand’s community health centers: Applying the UTAUT model. Int. J. Med. Inform. 2009, 78, 404–416. [Google Scholar] [CrossRef]
- Kim, Y.; Park, Y.-J.; Choi, J.; Yeon, J. An empirical study on the adoption of “Fintech” service: Focused on mobile payment services. Adv. Sci. Technol. Lett. 2015, 114, 136–140. [Google Scholar]
- Mahfuz, M.A.; Khanam, L.; Mutharasu, S.A. The influence of website quality on m-banking services adoption in Bangladesh: Applying the UTAUT2 model using PLS. In 2016 International Conference on Electrical, Electronics, and Optimization Techniques (ICEEOT); IEEE: Piscataway, NJ, USA, 2016; pp. 2329–2335. [Google Scholar] [CrossRef]
- Yuen, K.F.; Chua, J.Y.; Li, X.; Wang, X. The determinants of users’ intention to adopt telehealth: Health belief, perceived value and self-determination perspectives. J. Retail. Consum. Serv. 2023, 73, 103346. [Google Scholar] [CrossRef]
- Akinnuwesi, B.A.; Uzoka, F.M.E.; Okwundu, O.S.; Fashoto, G. Exploring biometric technology adoption in a developing country context using the modified UTAUT. Int. J. Bus. Inf. Syst. 2016, 23, 482–521. [Google Scholar] [CrossRef]
- Faqih, K.M.; Jaradat, M.I.R.M. Integrating TTF and UTAUT2 theories to investigate the adoption of augmented reality technology in education: Perspective from a developing country. Technol. Soc. 2021, 67, 101787. [Google Scholar] [CrossRef]
- El-Masri, M.; Tarhini, A. Factors affecting the adoption of e-learning systems in Qatar and USA: Extending the Unified Theory of Acceptance and Use of Technology 2 (UTAUT2). Educ. Technol. Res. Dev. 2017, 65, 743–763. [Google Scholar] [CrossRef]
- Al Halbusi, H.; Al-Sulaiti, K.; Abdelfattah, F.; Ahmad, A.B.; Hassan, S. Understanding consumers’ adoption of e-pharmacy in Qatar: Applying the unified theory of acceptance and use of technology. J. Sci. Technol. Policy Manag. 2024. [Google Scholar] [CrossRef]
- Addy, M.N.; Addo, E.T.; Kwofie, T.E.; Yartey, J.E. Predicting the adoption of e-procurement in construction project delivery in Sub-Saharan Africa: An application of UTAUT2. Constr. Innov. 2023, 23, 1038–1053. [Google Scholar] [CrossRef]
- Pai, R.R.; Alathur, S. Determinants of individuals’ intention to use mobile health: Insights from India. Transform. Gov. People Process Policy 2019, 13, 306–326. [Google Scholar] [CrossRef]
- Glanz, K.; Burke, L.E.; Rimer, B.K. Health behavior theories. In Philosophies and Theories for Advanced Nursing Practice; Jones & Bartlett Learning: Burlington, MA, USA, 2011; pp. 247–270. [Google Scholar]
- Alhemimah, A. Understanding tourists’ attitude toward online travel health information during and post-COVID-19: A health belief model application. Tour. Hosp. Res. 2024, 24, 257–271. [Google Scholar] [CrossRef]
- Walrave, M.; Waeterloos, C.; Ponnet, K. Adoption of a contact tracing app for containing COVID-19: A health belief model approach. JMIR Public Health Surveill. 2020, 6, e20572. [Google Scholar] [CrossRef]
- Wang, M.; Huang, L.; Pan, C.; Bai, L. Adopt proper food-handling intention: An application of the health belief model. Food Control 2021, 127, 108169. [Google Scholar] [CrossRef]
- Overdijkink, S.B.; Velu, A.V.; Rosman, A.N.; Van Beukering, M.D.; Kok, M.; Steegers-Theunissen, R.P. The usability and effectiveness of mobile health technology–based lifestyle and medical intervention apps supporting health care during pregnancy: Systematic review. JMIR Mhealth Uhealth 2018, 6, e8834. [Google Scholar] [CrossRef]
- Greiwe, J.; Nyenhuis, S.M. Wearable technology and how this can be implemented into clinical practice. Curr. Allergy Asthma Rep. 2020, 20, 36. [Google Scholar] [CrossRef]
- Han, H.; Yoon, H.J. Hotel customers’ environmentally responsible behavioral intention: Impact of key constructs on decision in green consumerism. Int. J. Hosp. Manag. 2015, 45, 22–33. [Google Scholar] [CrossRef]
- Jackson, J.D.; Mun, Y.Y.; Park, J.S. An empirical test of three mediation models for the relationship between personal innovativeness and user acceptance of technology. Inf. Manag. 2013, 50, 154–161. [Google Scholar] [CrossRef]
- Wu, P.; Zhang, R.; Luan, J.; Zhu, M. Factors affecting physicians using mobile health applications: An empirical study. BMC Health Serv. Res. 2022, 22, 24. [Google Scholar] [CrossRef] [PubMed]
- Hassan, M.S.; Islam, M.A.; Sobhani, F.A.; Hassan, M.M.; Hassan, M.A. Patients’ intention to adopt fintech services: A study on Bangladesh healthcare sector. Int. J. Environ. Res. Public Health 2022, 19, 15302. [Google Scholar] [CrossRef]
- Lu, H.H.; Lin, W.S.; Raphael, C.; Wen, M.J. A study investigating user adoptive behavior and the continuance intention to use mobile health applications during the COVID-19 pandemic era: Evidence from telemedicine applications utilized in Indonesia. Asia Pac. Manag. Rev. 2023, 28, 52–59. [Google Scholar] [CrossRef]
- Miao, R.; Wu, Q.; Wang, Z.; Zhang, X.; Song, Y.; Zhang, H.; Jiang, Z. Factors that influence users’ adoption intention of mobile health: A structural equation modeling approach. Int. J. Prod. Res. 2017, 55, 5801–5815. [Google Scholar] [CrossRef]
- Yan, M.; Filieri, R.; Raguseo, E.; Gorton, M. Mobile apps for healthy living: Factors influencing continuance intention for health apps. Technol. Forecast. Soc. Change 2021, 166, 120644. [Google Scholar] [CrossRef]
- Saheb, T. An empirical investigation of the adoption of mobile health applications: Integrating big data and social media services. Health Technol. 2020, 10, 1063–1077. [Google Scholar] [CrossRef]
- Hasan, N.; Bao, Y.; Chiong, R. A multi-method analytical approach to predicting young adults’ intention to invest in mHealth during the COVID-19 pandemic. Telemat. Inform. 2022, 68, 101765. [Google Scholar] [CrossRef]
- Khashan, M.A.; Alasker, T.H.; Ghonim, M.A.; Elsotouhy, M.M. Understanding physicians’ adoption intentions to use Electronic Health Record (EHR) systems in developing countries: An extended TRAM approach. Mark. Intell. Plan. 2024, 43, 1–27. [Google Scholar] [CrossRef]
- Segars, A.H.; Grover, V. Strategic information systems planning success: An investigation of the construct and its measurement. MIS Q. 1998, 22, 139–163. [Google Scholar] [CrossRef]
- Venkatesh, V.; Thong, J.Y.; Xu, X. Consumer acceptance and use of information technology: Extending the unified theory of acceptance and use of technology. MIS Q. 2012, 36, 157–178. [Google Scholar] [CrossRef]
- Luo, J.; Ahmad, S.F.; Alyaemeni, A.; Ou, Y.; Irshad, M.; Alyafi-Alzahri, R.; Unnisa, S.T. Role of perceived ease of use, usefulness, and financial strength on the adoption of health information systems: The moderating role of hospital size. Humanit. Soc. Sci. Commun. 2024, 11, 516. [Google Scholar] [CrossRef]
- Cherif, E.; Mzoughi, M. Electronic health record adopters: A typology based on patients’ privacy concerns and perceived benefits. Public Health 2022, 207, 46–53. [Google Scholar] [CrossRef]
- Chan, Y.K.; Tang, Y.M.; Teng, L. A comparative analysis of digital health usage intentions towards the adoption of virtual reality in telerehabilitation. Int. J. Med. Inform. 2023, 174, 105042. [Google Scholar] [CrossRef]
- Xiong, F.; Shen, W.; Chen, H.; Pan, S.; Wang, X.; Yan, Z. Exploiting implicit influence from information propagation for social recommendation. IEEE Trans. Cybern. 2019, 50, 4186–4199. [Google Scholar] [CrossRef]
- Isaac, J.T.; Sherali, Z. Secure mobile payment systems. IT Prof. 2014, 16, 36–43. [Google Scholar] [CrossRef]
- Cao, J.; Feng, H.; Lim, Y.; Kodama, K.; Zhang, S. How social influence promotes the adoption of mobile health among young adults in China: A systematic analysis of trust, health consciousness, and user experience. Behav. Sci. 2024, 14, 498–521. [Google Scholar] [CrossRef]
- Janz, N.K.; Becker, M.H. The health belief model: A decade later. Health Educ. Q. 1984, 11, 1–47. [Google Scholar] [CrossRef]
- Zhao, Y.; Ni, Q.; Zhou, R. What factors influence the mobile health service adoption? A meta-analysis and the moderating role of age. Int. J. Inf. Manag. 2018, 43, 342–350. [Google Scholar] [CrossRef]
- Deng, Z.; Hong, Z.; Ren, C.; Zhang, W.; Xiang, F. What predicts patients’ adoption intention toward mHealth services in China: Empirical study. JMIR mHealth uHealth 2018, 6, e9316. [Google Scholar] [CrossRef]
- Sutarno, M. The interaction of perceived susceptibility with predictors of mHealth technology usage. Am. J. Health Behav. 2022, 46, 716–728. [Google Scholar] [CrossRef]
- Lu, W.; Wei, D.; Li, C.; Gao, P.; Ma, R.; Zhai, Y.; Wang, C. How to promote telemedicine patient adoption behavior for greener healthcare? J. Clean. Prod. 2024, 434, 139884. [Google Scholar] [CrossRef]
- Tajeri Moghadam, M.; Zobeidi, T.; Sieber, S.; Löhr, K. Investigating the adoption of precautionary behaviors among young rural adults in South Iran during COVID-19. Front. Public Health 2022, 10, 787929. [Google Scholar] [CrossRef] [PubMed]
- Kumari, N.; Biswas, A. Does M-payment service quality and perceived value co-creation participation magnify M-payment continuance usage intention? Moderation of usefulness and severity. Int. J. Bank Mark. 2023, 41, 1330–1359. [Google Scholar] [CrossRef]
- Shao, H.; Liu, C.; Tang, L.; Wang, B.; Xie, H.; Zhang, Y. Factors Influencing the Behavioral Intentions and Use Behaviors of Telemedicine in Patients with Diabetes: Web-Based Survey Study. JMIR Human Factors 2023, 10, e46624. [Google Scholar] [CrossRef]
- An, H.Y.; Chen, W.; Wang, C.W.; Yang, H.F.; Huang, W.T.; Fan, S.Y. The relationships between physical activity and life satisfaction and happiness among young, middle-aged, and older adults. Int. J. Environ. Res. Public Health 2020, 17, 4817. [Google Scholar] [CrossRef]
- Palos-Sanchez, P.R.; Saura, J.R.; Rios Martin, M.A.; Aguayo-Camacho, M. Toward a better understanding of the intention to use mHealth apps: Exploratory study. JMIR Mhealth Uhealth 2021, 9, 220–235. [Google Scholar] [CrossRef]
- Tandon, U.; Ertz, M.; Shashi. Continued Intention of mHealth Care Applications among the Elderly: An Enabler and Inhibitor Perspective. Int. J. Hum. Comput. Interact. 2024, 40, 5026–5041. [Google Scholar] [CrossRef]
- Hsieh, P.J. Determinants of physicians’ intention to use AI-assisted diagnosis: An integrated readiness perspective. Comput. Hum. Behav. 2023, 147, 107868. [Google Scholar] [CrossRef]
- Tao, D.; Liu, K. How do self-motivation and social motivation contribute to consumers’ acceptance of m-health services? Health Policy Technol. 2024, 13, 100878. [Google Scholar] [CrossRef]
- Tu, M.; Wu, L.; Wan, H.; Ding, Z.; Guo, Z.; Chen, J. The adoption of QR code mobile payment technology during COVID-19: A social learning perspective. Front. Psychol. 2022, 12, 798199. [Google Scholar] [CrossRef] [PubMed]
- Abdollahzadeh, G.; Sharifzadeh, M.S. Predicting farmers’ intention to use PPE for preventing pesticide adverse effects: An examination of the health belief model (HBM). J. Saudi Soc. Agric. Sci. 2021, 20, 40–47. [Google Scholar]
- Kabir, M.H.; Sato, M.; Habbiba, U.; Yousuf, T.B. Assessment of urban disaster resilience in Dhaka North City Corporation (DNCC), Bangladesh. Procedia Eng. 2018, 212, 1107–1114. [Google Scholar] [CrossRef]
- Zheng, G.-W.; Rahman, M.K.; Ashraf, S.F.; Rahman, M.M.; Khan, A.; Várallyai, L. Organic foods purchase behavior among Generation Y of Bangladesh: The moderation effect of trust and price consciousness. Foods 2021, 10, 2278. [Google Scholar] [CrossRef]
- Alam, S.S.; Ahmed, S.; Kokash, H.A.; Mahmud, M.S.; Sharnali, S.Z. Utility and Hedonic Perception—Customers’ Intention Towards Using of QR Codes in Mobile Payment of Generation Y and Generation Z. Electron. Commer. Res. Appl. 2024, 65, 1–13. [Google Scholar] [CrossRef]
- Lee, H.; Chen, Y.J.; Sideris, J.; Watson, L.R.; Crais, E.R.; Baranek, G.T. Sensory features of young children from a large community sample: Latent factor structures of the Sensory Experiences Questionnaire (Version 2.1, Short Form). Am. J. Occup. Ther. 2022, 76, 7603205140. [Google Scholar] [CrossRef]
- Podsakoff, P.M.; Organ, D.W. Self-reports in organizational research: Problems and prospects. J. Manag. 1986, 12, 531–544. [Google Scholar] [CrossRef]
- Podsakoff, P.M.; MacKenzie, S.B.; Lee, J.Y.; Podsakoff, N.P. Common method biases in behavioral research: A critical review of the literature and recommended remedies. J. Appl. Psychol. 2003, 88, 879–903. [Google Scholar] [CrossRef]
- Dubey, B.; Kartikeyan, B.; Subbiah, M.M. Rational polynomial coefficients modeling and bias correction by using iterative polynomial augmentation. J. Indian Soc. Remote Sens. 2019, 47, 165–175. [Google Scholar] [CrossRef]
- Kock, N. Common method bias in PLS-SEM: A full collinearity assessment approach. Int. J. e-Collab. 2015, 11, 1–10. [Google Scholar] [CrossRef]
- Hair, J.F.; Ringle, C.M.; Sarstedt, M. PLS-SEM: Indeed a silver bullet. J. Mark. Theory Pract. 2011, 19, 139–152. [Google Scholar] [CrossRef]
- Hair, J.F.; Sarstedt, M.; Ringle, C.M.; Mena, J.A. An assessment of the use of partial least squares structural equation modeling in marketing research. J. Acad. Mark. Sci. 2012, 40, 414–433. [Google Scholar] [CrossRef]
- Alam, M.M.D.; Alam, M.Z.; Rahman, S.A.; Taghizadeh, S.K. Factors Influencing mHealth Adoption and Its Impact on Mental Well-Being during COVID-19 Pandemic: A SEM-ANN Approach. J. Biomed. Inform. 2021, 116, 103722. [Google Scholar] [CrossRef] [PubMed]
- Najmi, A.; Kanapathy, K.; Aziz, A.A. Understanding Consumer Participation in Managing ICT Waste: Findings from Two-Staged Structural Equation Modeling–Artificial Neural Network Approach. Environ. Sci. Pollut. Res. 2021, 28, 14782–14796. [Google Scholar] [CrossRef]
- Hayat, N.; Salameh, A.A.; Mamun, A.A.; Helmi Ali, M.; Makhbul, Z.K.M. Tax compliance behavior among Malaysian taxpayers: A dual-stage PLS-SEM and ANN analysis. SAGE Open 2022, 12, 21582440221127190. [Google Scholar] [CrossRef]
- Rahman, A.; Ai Ping, T.; Mubeen, S.K.; Mahmud, I.; Abbasi, G.A. What influences home gardeners’ food waste composting intention in high-rise buildings in Dhaka megacity, Bangladesh? An integrated model of TPB and DMP. Sustainability 2022, 14, 9400. [Google Scholar] [CrossRef]
- Abbasi, G.A.; Tiew, L.Y.; Tang, J.; Goh, Y.N.; Thurasamy, R. The adoption of cryptocurrency as a disruptive force: Deep learning-based dual-stage structural equation modeling and artificial neural network analysis. PLoS ONE 2021, 16, e0247582. [Google Scholar] [CrossRef]
- Mahmud, I.; Sultana, S.; Rahman, A.; Ramayah, T.; Cheng Ling, T. E-waste recycling intention paradigm of small and medium electronics store managers in Bangladesh: An S–O–R perspective. Waste Manag. Res. 2020, 38, 1438–1449. [Google Scholar] [CrossRef]
- Fornell, C.; Larcker, D.F. Evaluating structural equation models with unobservable variables and measurement error. J. Mark. Res. 1981, 18, 39–50. [Google Scholar] [CrossRef]
- Ramayah, T.; Samat, N.; Lo, M.C. Market orientation, service quality and organizational performance in service organizations in Malaysia. Asia-Pac. J. Bus. Adm. 2011, 3, 8–27. [Google Scholar] [CrossRef]
- Hair, J.F.; Risher, J.J.; Sarstedt, M.; Ringle, C.M. When to use and how to report the results of PLS-SEM. Eur. Bus. Rev. 2019, 31, 2–24. [Google Scholar] [CrossRef]
- Ringle, C.M.; Sarstedt, M. Gain more insight from your PLS-SEM results: The importance-performance map analysis. Ind. Manag. Data Syst. 2016, 116, 1865–1886. [Google Scholar] [CrossRef]
- Khayer, A.; Talukder, M.S.; Bao, Y.; Hossain, M.N. Application-based mobile payment systems: Continuance intention and intention to recommend. Int. J. Mob. Commun. 2023, 21, 19–53. [Google Scholar] [CrossRef]
- Cheng, Y.; Sharma, S.; Sharma, P.; Kulathunga, K.M.M.C.B. Role of personalization in continuous use intention of mobile news apps in India: Extending the UTAUT2 model. Information 2020, 11, 33. [Google Scholar] [CrossRef]
- Haque, M.R.; Rubya, S. An overview of chatbot-based mobile mental health apps: Insights from app description and user reviews. JMIR Mhealth Uhealth 2023, 11, e44838. [Google Scholar] [CrossRef]
- Hamid, K.; Ibrar, M.; Delshadi, A.M.; Hussain, M.; Iqbal, M.W.; Hameed, A.; Noor, M. ML-based Meta-Model Usability Evaluation of Mobile Medical Apps. Int. J. Adv. Comput. Sci. Appl. 2024, 15, 29–37. [Google Scholar] [CrossRef]
- Islam, M.N.; Mim, S.T.; Tasfia, T.; Hossain, M.M. Enhancing patient treatment through automation: The development of an efficient scribe and prescribe system. Inform. Med. Unlocked 2024, 45, 101456. [Google Scholar] [CrossRef]
- Akdim, K.; Casaló, L.V.; Flavián, C. The role of utilitarian and hedonic aspects in the continuance intention to use social mobile apps. J. Retail. Consum. Serv. 2022, 66, 102888. [Google Scholar] [CrossRef]
- Vidal-Silva, C.; Sánchez-Ortiz, A.; Serrano-Malebrán, J.; Arriagada, V.; Flores, M.; Godoy, M.; Vargas, C. Social influence, performance expectancy, and price value as determinants of telemedicine services acceptance in Chile. Heliyon 2024, 10, e27067. [Google Scholar] [CrossRef] [PubMed]
- Martinez, B.M.; McAndrews, L.E. Do you take…? The effect of mobile payment solutions on use intention: An application of UTAUT2. J. Mark. Anal. 2023, 11, 458–469. [Google Scholar] [CrossRef]
- Migliore, G.; Wagner, R.; Cechella, F.S.; Liébana-Cabanillas, F. Antecedents to the adoption of mobile payment in China and Italy: An integration of UTAUT2 and innovation resistance theory. Inf. Syst. Front. 2022, 24, 2099–2122. [Google Scholar] [CrossRef] [PubMed]
- Hatteberg, S.J.; Kollath-Cattano, C. Applying the Health Belief Model to examine college students’ early-stage adoption of non-pharmaceutical interventions in response to COVID-19. J. Am. Coll. Health 2024, 72, 340–345. [Google Scholar] [CrossRef]
- Hesse-Biber, S. Qualitative approaches to mixed methods practice. Qual. Inq. 2010, 16, 455–468. [Google Scholar] [CrossRef]
Disclaimer/Publisher’s Note: The statements, opinions and data contained in all publications are solely those of the individual author(s) and contributor(s) and not of MDPI and/or the editor(s). MDPI and/or the editor(s) disclaim responsibility for any injury to people or property resulting from any ideas, methods, instructions or products referred to in the content. |
© 2025 by the authors. Licensee MDPI, Basel, Switzerland. This article is an open access article distributed under the terms and conditions of the Creative Commons Attribution (CC BY) license (https://creativecommons.org/licenses/by/4.0/).