
Personalized Course Recommendation System: A Multi-Model Machine Learning Framework for Academic Success


Abstract
1. Introduction
- (1)
- How can a modular, multi-model ML system improve the accuracy and constraint compliance of course recommendations?
- (2)
- What role do domain-specific features and constraint-enforcing meta-functions play in enhancing the interpretability and applicability of ML-driven advising?
- (3)
- Can realistic synthetic academic datasets support the ethical and scalable development of personalized advising tools in the absence of real student data?
2. Related Work
2.1. Collaborative and Content-Based Filtering Models
2.2. Deep Learning Approaches
2.3. Context-Aware and Constrained Optimization Models
2.4. Hybrid and Ensemble Learning Models
2.5. Feature Engineering and Interpretability
2.6. Synthetic Data in Academic Recommender Systems
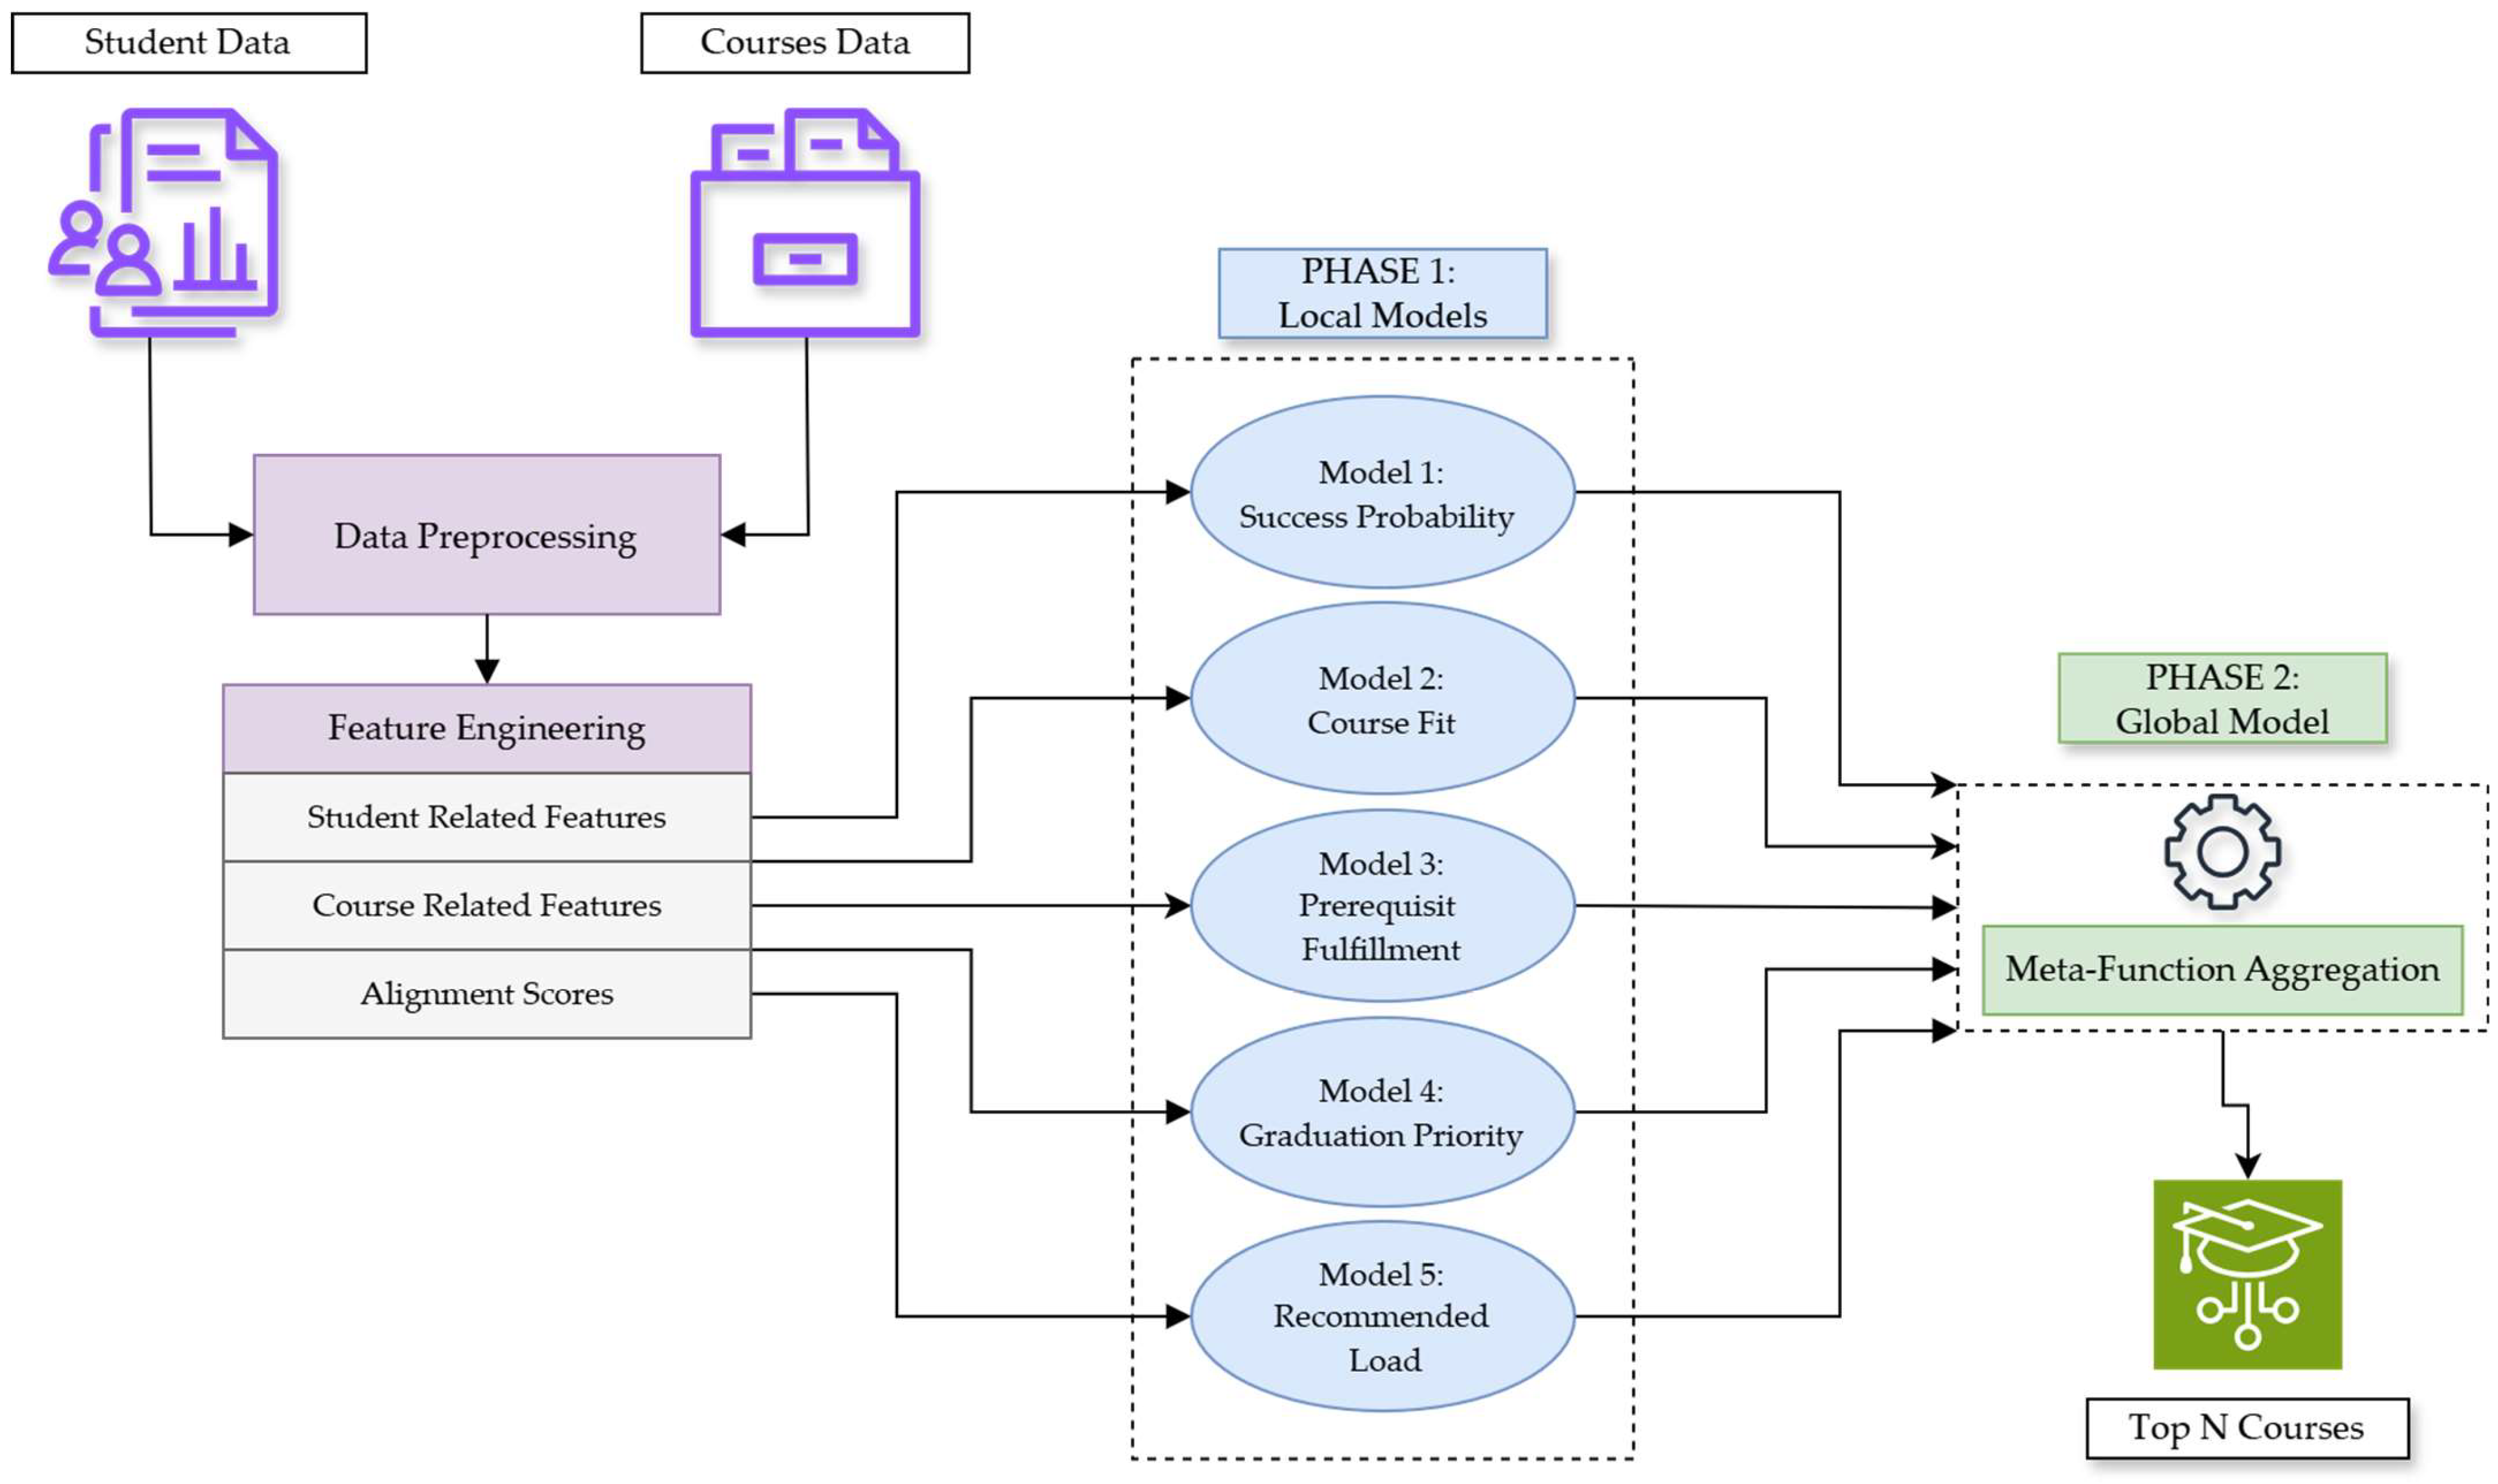
3. The Proposed Personalized Course Recommendation System
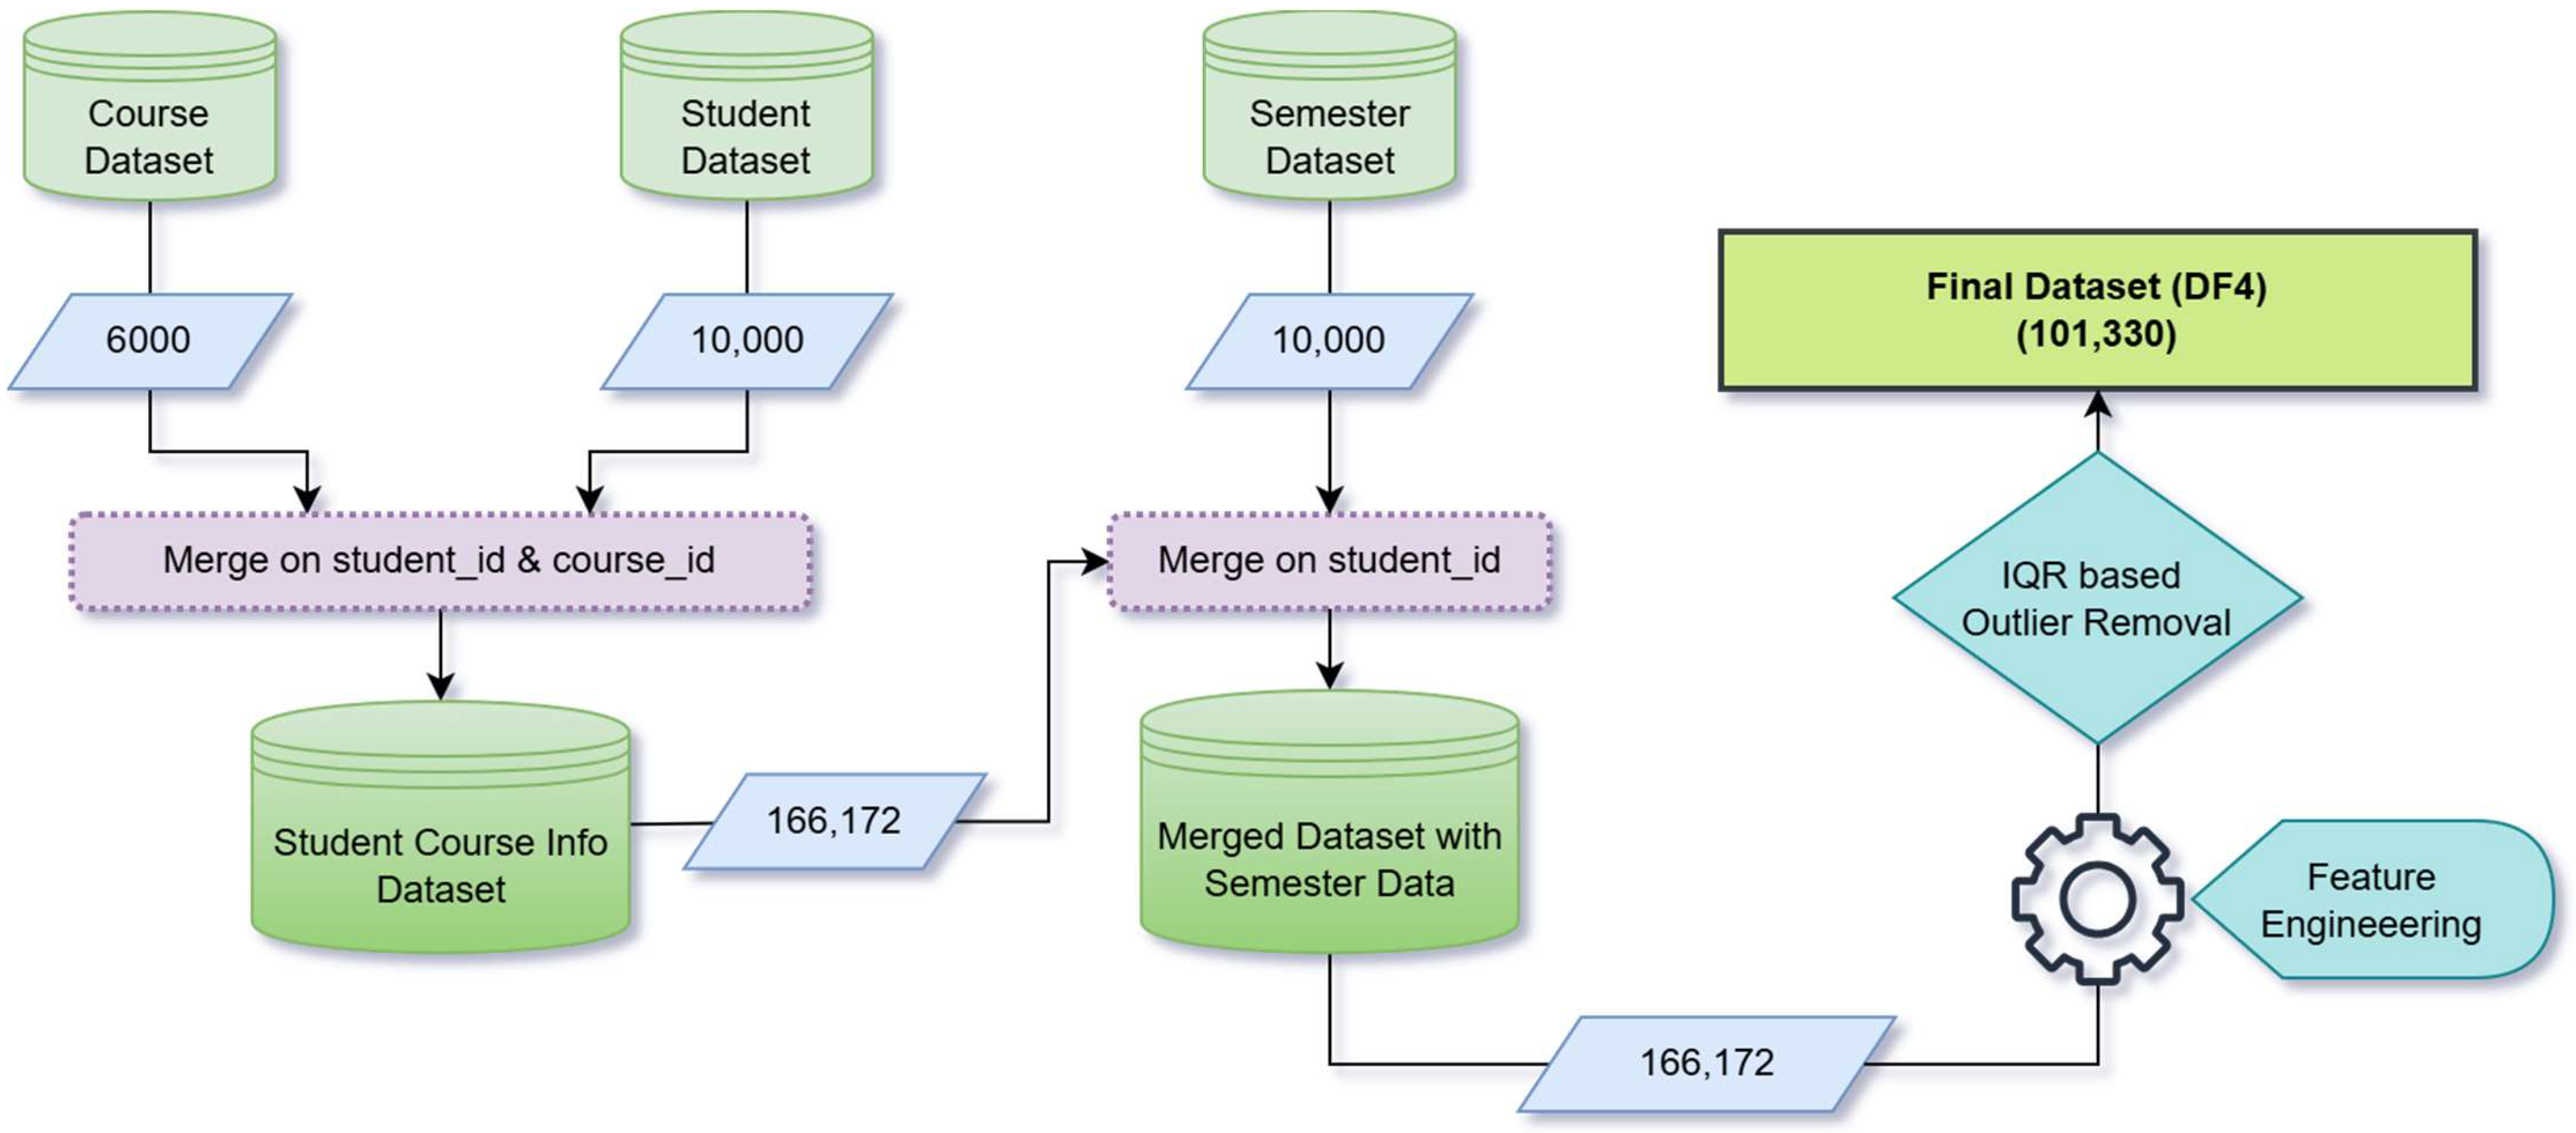
3.1. Dataset Collection
3.2. Data Preparation and Feature Engineering
3.3. Local Model Framework
3.4. Global Model Framework
| Algorithm 1: Global meta-function for course recommendation |
| Input: student_id: Unique identifier of the student course_data: Dataset containing course information models: {success_model, fit_model, prerequisite_model, graduation_model, load_model} Pretrained local models for success probability, course fit score, prerequisite fulfillment, graduation priority, and workload optimization weights: {w_success, w_fit, w_priority} Default weights for meta-function components max_credits: Maximum allowable workload per semester (default = 18 credits) Output: Ranked list of recommended courses for the student |
| 1: Initialize: completed_courses ← GetCompletedCourses(course_data, student_id) eligible_courses ← Filter(course_data, course_id NOT IN completed_courses) 2: Predict Local Model Outputs: For each course in eligible_courses: success_probability ← Predict(success_model, course_features) course_fit_score ← Predict(fit_model, course_features) prerequisite_flag ← Predict(prerequisite_model, course_features) graduation_priority ← Predict(graduation_model, course_features) recommended_load ← Predict(load_model, course_features) 3: Compute Meta-Function Scores: For each course in eligible_courses: final_score ← 4: Apply Constraints: valid_courses ← Filter(eligible_courses, prerequisite_flag == 1 AND recommended_load ≤ max_credits) 5: Rank and Select: ranked_courses ← Sort(valid_courses, by = final_score, descending = True) recommendations ← SelectTopN(ranked_courses, N = 10) 6: Enrich Recommendations: For each course in recommendations: Add additional metadata: {course_name, course_level, prerequisites, credit_type, mode_of_instruction} 7: Return: recommendations |
4. Performance Evaluation
4.1. Experiment Setup
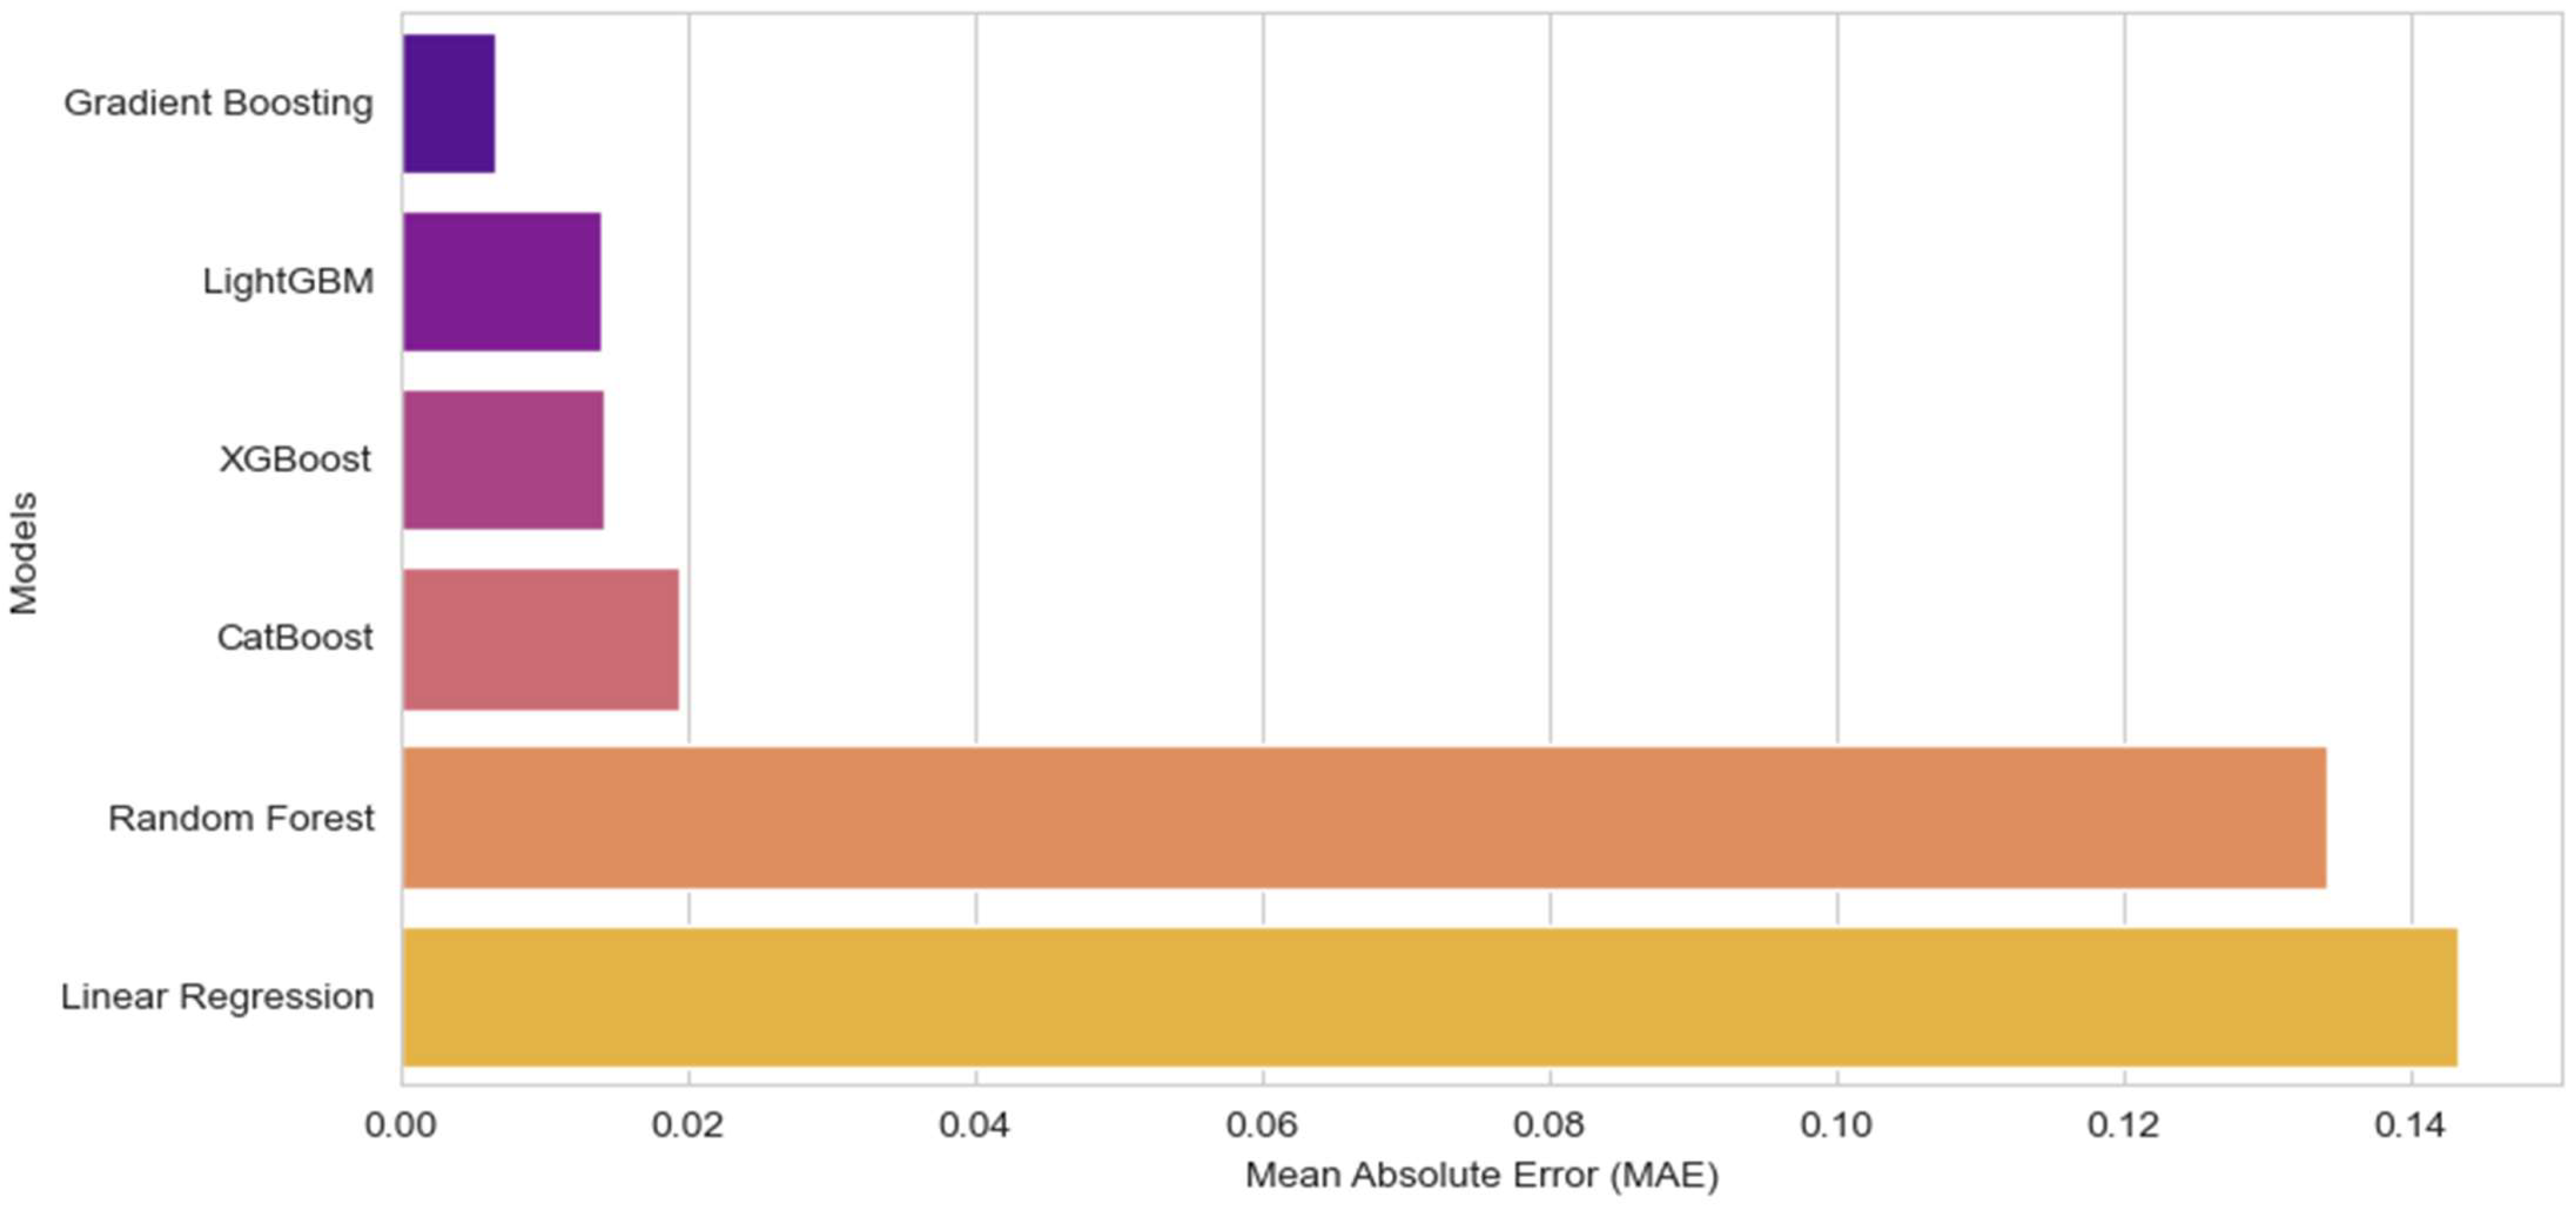
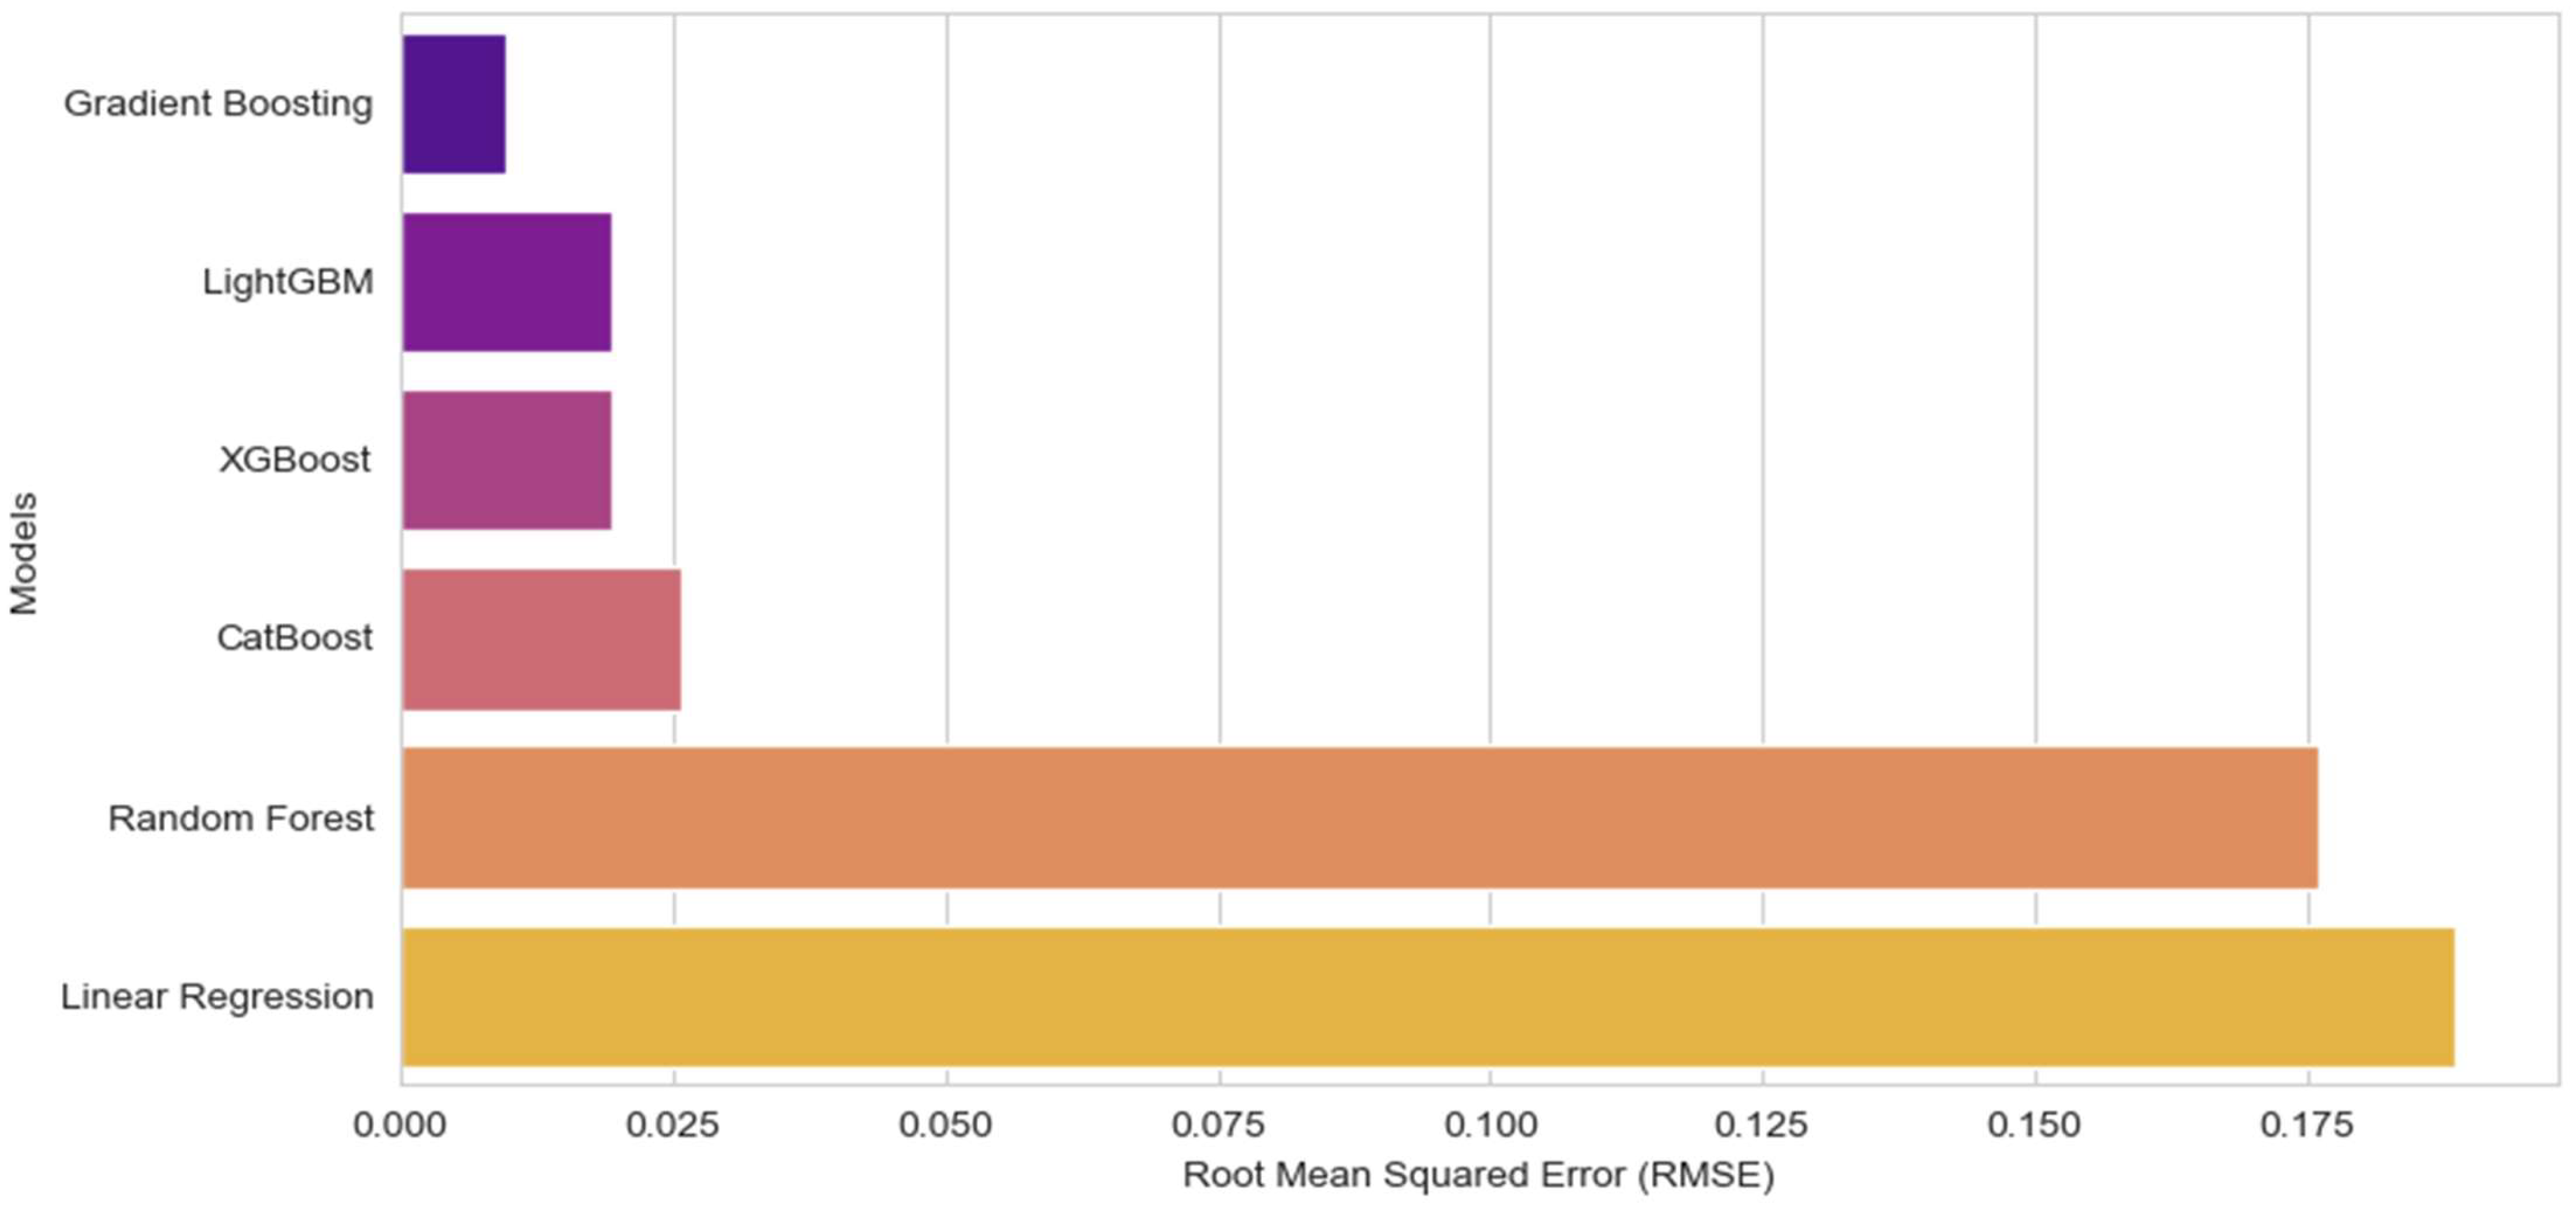
4.2. Results Analysis of the Local Models
4.3. Results Analysis of the Global Model
4.4. Discussion
5. Conclusions
Author Contributions
Funding
Data Availability Statement
Conflicts of Interest
References
- Khan, M.A.Z.; Polyzou, A. Session-based Methods for Course Recommendation. J. Educ. Data Min. 2024, 16, 164–196. [Google Scholar]
- Hu, H.; Pan, L.; Ran, Y.; Kan, M.-Y. Modeling and leveraging prerequisite context in recommendation. In Proceedings of the Workshop on Context-Aware Recommender Systems (CARS@RecSys’22), Seattle, WA, USA, 18–23 September 2022; pp. 1–13. [Google Scholar]
- Xu, J.; Xing, T.; van der Schaar, M. Personalized course sequence recommendations. IEEE Trans. Signal Process. 2016, 64, 5340–5352. [Google Scholar] [CrossRef]
- Tilahun, L.A.; Sekeroglu, B. An intelligent and personalized course advising model for higher educational institutes. SN Appl. Sci. 2020, 2, 1635. [Google Scholar] [CrossRef]
- Ma, Y.; Ouyang, R.; Long, X.; Gao, Z.; Lai, T.; Fan, C. DORIS: Personalized course recommendation system based on deep learning. PLoS ONE 2023, 18, e0284687. [Google Scholar] [CrossRef] [PubMed]
- Ren, X.; Yang, W.; Jiang, X.; Jin, G.; Yu, Y. A deep learning framework for multimodal course recommendation based on LSTM+Attention. Sustainability 2022, 14, 2907. [Google Scholar] [CrossRef]
- Maphosa, M.; Doorsamy, W.; Paul, B. Improving academic advising in engineering education with machine learning using a real-world dataset. Algorithms 2024, 17, 85. [Google Scholar] [CrossRef]
- Vie, J.-J.; Rigaux, T.; Minn, S. Privacy-Preserving Synthetic Educational Data Generation. In Educating for a New Future: Making Sense of Technology-Enhanced Learning Adoption, Proceedings of the 17th European Conference on Technology Enhanced Learning, EC-TEL 2022, Toulouse, France, 12–16 September 2022; Lecture Notes in Computer Science; Springer: Cham, Switzerland; Volume 13450.
- Liu, Q.; Shakya, R.; Jovanovic, J.; Khalil, M.; de la Hoz-Ruiz, J. Ensuring privacy through synthetic data generation in education. Br. J. Educ. Technol. 2025, 56, 1053–1073. [Google Scholar] [CrossRef]
- Pereira, M.; Kshirsagar, M.; Mukherjee, S.; Dodhia, R.; Ferres, J.L.; de Sousa, R. Assessment of differentially private synthetic data for utility and fairness in end-to-end machine learning pipelines for tabular data. PLoS ONE 2024, 19, e0297271. [Google Scholar] [CrossRef] [PubMed]
- Torfi, A.; Fox, E.A.; Reddy, C.K. Differentially Private Synthetic Medical Data Generation using Convolutional GANs. Inf. Sci. 2022, 586, 485–500. [Google Scholar] [CrossRef]
- Hassan, R.H.; Hassan, M.T.; Sameem, M.S.I.; Rafique, M.A. Personality-Aware Course Recommender System Using Deep Learning for Technical and Vocational Education and Training. Information 2024, 15, 803. [Google Scholar] [CrossRef]
- Li, D.; Zhang, F.; Liu, C.; Chen, Y. Constrained Multi-objective Bayesian Optimization through Optimistic Constraints Estimation. In Proceedings of the 28th International Conference on Artificial Intelligence and Statistics (AISTATS), PMLR, Mai Khao, Thailand, 3–5 May 2025; Volume 258. [Google Scholar]
- San, K.K.; Win, H.H.; Chaw, K.E.E. Enhancing Hybrid Course Recommendation with Weighted Voting Ensemble Learning. J. Future Artif. Intell. Technol. 2025, 1, 338–347. [Google Scholar] [CrossRef]
- Gil, N.M.; Patel, D.; Reddy, C.; Ganapavarapu, G.; Vaculin, R.; Kalagnanam, J. Identifying Homogeneous and Interpretable Groups for Conformal Prediction. In Proceedings of the Fortieth Conference on Uncertainty in Artificial Intelligence, Barcelona, Spain, 15–19 July 2024. [Google Scholar]
- Iatrellis, O.; Samaras, N.; Kokkinos, K.; Panagiotakopoulos, T. Leveraging generative AI for sustainable academic advising: Enhancing educational practices through AI-driven recommendations. Sustainability 2024, 16, 7829. [Google Scholar] [CrossRef]
- Cheng, X. A Comprehensive Study of Feature Selection Techniques in Machine Learning Models. Insights Comput. Signals Syst. 2024, 1, 65–78. [Google Scholar] [CrossRef]
- Bobadilla, J.; Gutiérrez, A. Generating and Testing Synthetic Datasets for Recommender Systems to Improve Fairness in Collaborative Filtering Research. In Proceedings of the 2023 20th ACS/IEEE International Conference on Computer Systems and Applications (AICCSA), Giza, Egypt, 4–7 September 2023; pp. 1–6. [Google Scholar] [CrossRef]
- de Wilde, P.; Arora, P.; Buarque, F.; Chin, Y.C.; Thinyane, M.; Stinckwich, S.; Fournier-Tombs, E.; Marwala, T. Recommendations on the Use of Synthetic Data to Train AI Models; United Nations University: Tokyo, Japan, 2024. [Google Scholar]
- Jordan, M.I.; Jacobs, R.A. Hierarchical mixtures of experts and the EM algorithm. Neural Comput. 1994, 6, 181–214. [Google Scholar] [CrossRef]
- Vinutha, H.P.; Poornima, B.; Sagar, B. Detection of outliers using interquartile range technique from intrusion dataset. In Information and Decision Sciences, Proceedings of the 6th International Conference on FICTA, Bhubaneswar, India, 14–16 October 2017; Springer: Singapore, 2018; pp. 511–521. [Google Scholar] [CrossRef]
- Heaton, J. An Empirical Analysis of Feature Engineering for Predictive Modeling. In Proceedings of the SoutheastCon 2016, Norfolk, VA, USA, 30 March–3 April 2016; pp. 1–6. [Google Scholar] [CrossRef]
- Aslam, M.A.; Murtaza, F.; Haq, M.E.U.; Yasin, A.; Azam, M.A. A Human-Centered Approach to Academic Performance Prediction Using Personality Factors in Educational AI. Information 2024, 15, 777. [Google Scholar] [CrossRef]
- Prokhorenkova, L.; Gusev, G.; Vorobev, A.; Dorogush, A.V.; Gulin, A. CatBoost: Unbiased Boosting with Categorical Features. In Proceedings of the Advances in Neural Information Processing Systems 31 (NeurIPS 2018), Montréal, QC, Canada, 3–8 December 2018. [Google Scholar]
- Ke, G.; Meng, Q.; Finley, T.; Wang, T.; Chen, W.; Ma, W.; Ye, Q.; Liu, T. LightGBM: A Highly Efficient Gradient Boosting Decision Tree. In Proceedings of the 31st Conference on Neural Information Processing Systems (NIPS 2017), Long Beach, CA, USA, 4–9 December 2017. [Google Scholar]
- Ricci, F.; Rokach, L.; Shapira, B. Recommender Systems Handbook; Springer: New York, NY, USA, 2011. [Google Scholar] [CrossRef]
- Bentéjac, C.; Csörgő, A.; Martínez-Muñoz, G. A comparative analysis of gradient boosting algorithms. Artif. Intell. Rev. 2021, 54, 1937–1967. [Google Scholar] [CrossRef]


| Ref. | Methodology | Key Contributions | Limitations |
|---|---|---|---|
| [5] | Deep Learning (DeepFM) | Improves prediction accuracy (AUC = 0.969), mitigates cold-start issues | Lacks structured academic constraints (prerequisites, workload balance, graduation planning) |
| [6] | Hybrid (Collaborative + Content-Based Filtering) | Enhances recommendations in sparse data settings | Requires additional domain-specific adjustments for structured academic environments |
| [12] | Personality-Aware Recommender (Deep Learning) | Personalized recommendations based on individual traits | Does not enforce prerequisite fulfillment or workload balancing |
| [13] | Constrained Multi-Objective Bayesian Optimization | Balances competing objectives under constraints using optimistic estimation and UCB. | Not designed for recommendation systems |
| [14] | Ensemble Learning (Weighted Voting: RF, Naïve Bayes, SVM) | Improves robustness and accuracy in course recommendation (ARHR: 0.333, NDCG: 1.0) | Lacks integration of academic constraints like prerequisites, workload balance, and graduation planning |
| [15] | Ensemble Learning for Interpretability | Enhances interpretability in predictive models using conformal prediction | Does not address structured multi-model academic advising |
| [16] | AI-Driven Feature Engineering | Enhances transparency and user trust in AI-powered advising | Does not consider academic-specific constraints such as workload balance and prerequisite satisfaction |
| [17] | Feature Selection in ML Models | Improves explainability in AI-driven decision systems | Does not explore structured academic advising constraints |
| [18] | Synthetic Data for Recommender Systems | Demonstrates that synthetic datasets can match real-world data in recommendation tasks | No specific application for academic advising |
| [19] | Policy Research on Synthetic Data | Provides guidelines on synthetic data use for AI models in privacy-sensitive domains | Does not address multi-model integration for course advising |
| Feature Name | Data Type | Sample Entry |
|---|---|---|
| course_id | int | 329 |
| department | object | Mathematics |
| credits | int | 3 |
| credit_type | object | GE |
| prerequisites | list | [269, 254] |
| corequisites | list | [560] |
| course_level | object | Introductory |
| course_schedule | dict | {‘MWF’: ‘2–3 PM’} |
| semester_offered | list | [‘Fall’] |
| mode_of_instruction | object | Online |
| historical_pass_rate | float | 0.70 |
| course_category | object | Theory |
| workload_level | object | Medium |
| popularity_score | float | 0.993988 |
| graduation_rate_impact | float | 0.95 |
| course_name | object | MATH 329 |
| course_code | object | MATH193 |
| prerequisites_count | int | 2 |
| corequisites_count | int | 1 |
| skill_tags_count | int | 2 |
| Feature Name | Data Type | Sample Entry |
|---|---|---|
| student_id | int64 | 77672505 |
| major | object | Biological Sciences |
| minor | object | Mathematics |
| current_gpa | float64 | 3.32 |
| completed_courses | object | [353, 379, 103, 188, 357, 111, 363, 184, 182] |
| completed_credits_by_type | object | {‘MR’: 36, ‘ME’: 24, ‘GR’: 13, ‘GE’: 9, ‘Special’: 10} |
| remaining_credits_by_type | object | {‘MR’: 31, ‘ME’: 7, ‘GR’: 2, ‘GE’: 10, ‘Special’: 12} |
| total_required_credits | int64 | 120 |
| preferred_class_days | object | MWF |
| preferred_class_times | object | Morning |
| semester_availability | object | [‘Fall’, ‘Spring’] |
| learning_style | object | Reading/Writing |
| has_academic_advisor | int64 | 1 |
| transfer_credits | int64 | 3 |
| course_re_enrollment | int64 | 0 |
| program_start_date | object | 15-08-2022 |
| current_course_load | int64 | 2 |
| career_goals_tags | object | Entrepreneurship |
| extracurricular_commitments | object | Full-time Job |
| Feature Name | Data Type | Sample Entry |
|---|---|---|
| student_id | int | 77672505 |
| course_id | int | 452 |
| enrollment_status | int | 1 |
| grade | float | 2.70 |
| completion_status | int | 0 |
| feedback_score_x (Student) | float | 3.500000 |
| satisfaction_level | int | 1 |
| engagement_level | object | Low |
| grade_exam | float | 2.24 |
| grade_project | float | 3.65 |
| grade_participation | float | 2.48 |
| time_to_complete | int | 11 |
| engagement_type | object | Attendance |
| timestamp | datetime | 08-05-2022 04:40 |
| year | int | 2022 |
| Semester | object | Spring |
| historical_pass_rate | float | 0.78 |
| course_category | object | Application |
| workload_level | object | Medium |
| popularity_score | float | 0.150301 |
| graduation_rate_impact | float | 0.67 |
| course_name | object | COMP 452 |
| course_code | object | CS293 |
| prerequisites_count | int | 0 |
| corequisites_count | int | 1 |
| skill_tags_count | int | 1 |
| semesters_left | int | 5 |
| current_semester | int | 5 |
| feedback_score_y (Course) | float | 3.1 |
| engagement_score | float | 6.5 |
| participation_rate | float | 76.5 |
| instructor_rating | float | 3.9 |
| assignments_completed | int | 10 |
| discussion_posts | int | 5 |
| lecture_attendance | int | 12 |
| online_resources_used | int | 2 |
| peer_interactions | int | 15 |
| project_score | float | 65.2 |
| exam_attempts | int | 1 |
| Model | MAE (↓ Lower Is Better) | RMSE (↓ Lower Is Better) |
|---|---|---|
| GBR (Optimized) | 0.006522 | 0.009565 |
| GBR (Initial) | 0.013726 | 0.018875 |
| LightGBM | 0.013944 | 0.019402 |
| XGB | 0.014076 | 0.019320 |
| CB | 0.019341 | 0.025844 |
| RFR | 0.134149 | 0.175979 |
| LR | 0.143416 | 0.188638 |
| Model | MAE (↓ Lower Is Better) | RMSE (↓ Lower Is Better) |
|---|---|---|
| GBR | 0.009170 | 0.011713 |
| XGB | 0.009811 | 0.012612 |
| LightGBM | 0.012393 | 0.015815 |
| CB | 0.011153 | 0.014404 |
| SVR | 0.042138 | 0.050452 |
| LR | 0.091535 | 0.091535 |
| RFR | 0.122978 | 0.153813 |
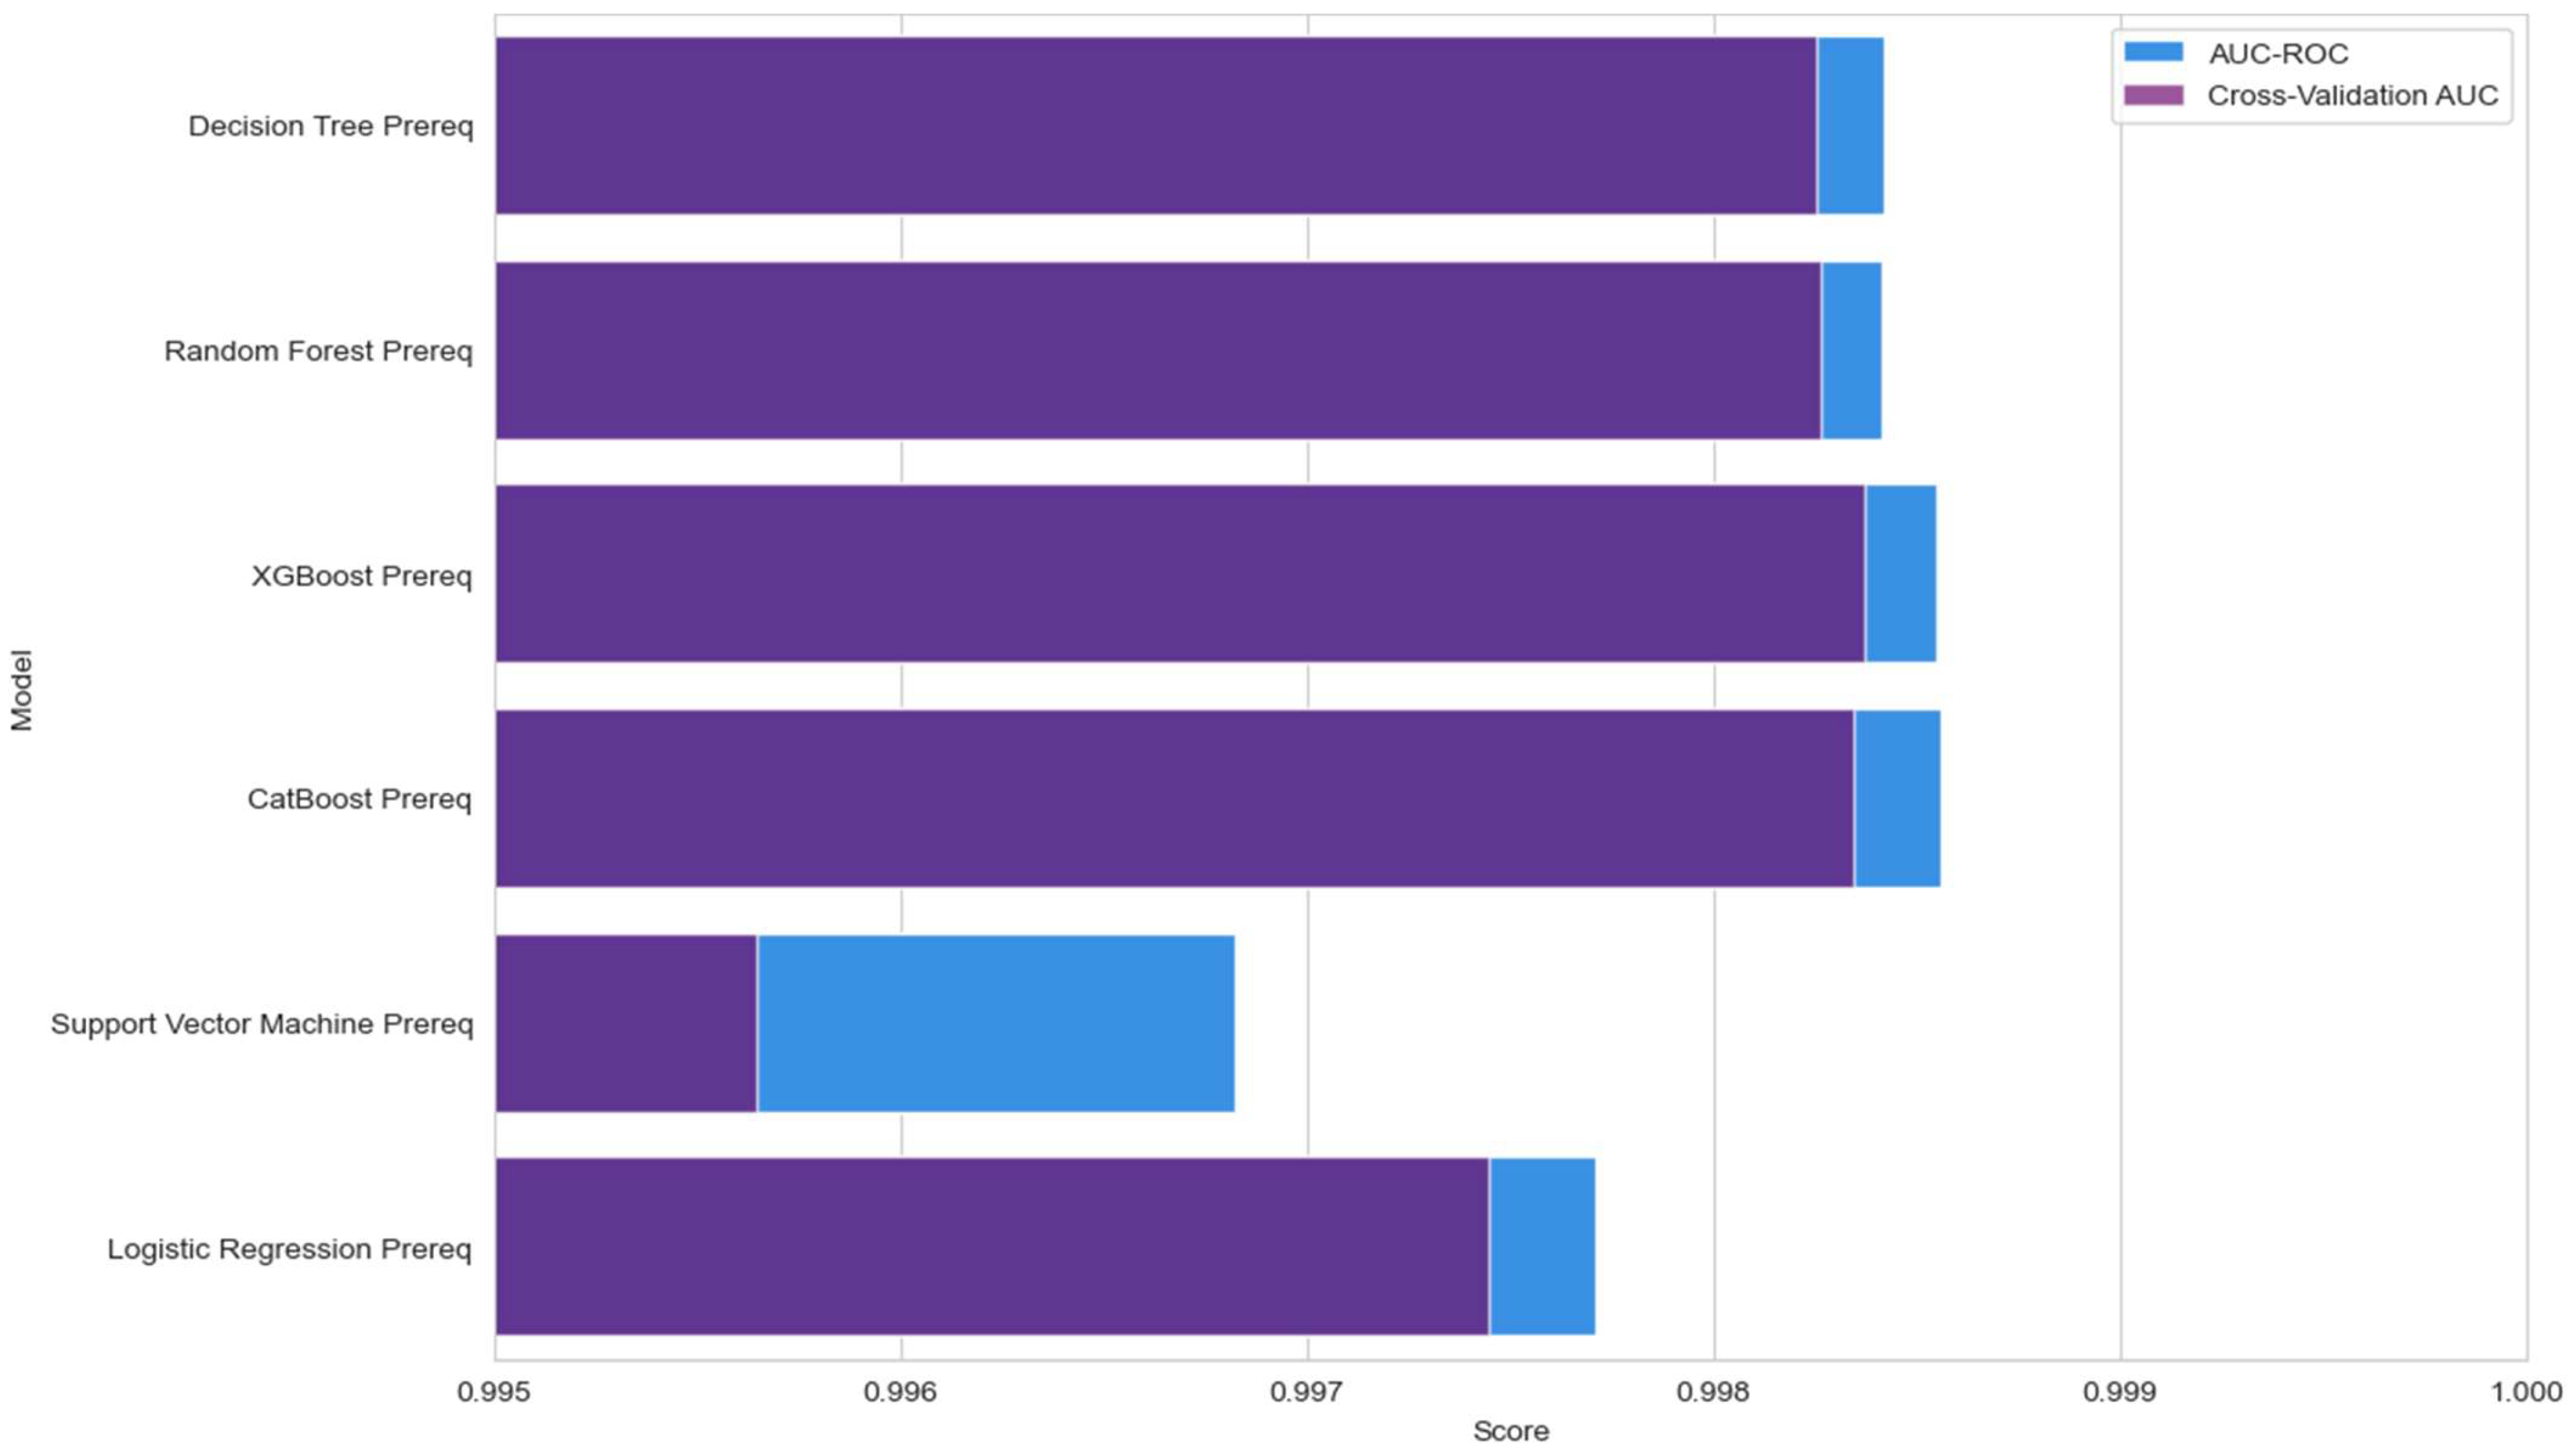
| Model | Accuracy | Precision | Recall | F1-Score | AUC-ROC | Cross-Validation AUC |
|---|---|---|---|---|---|---|
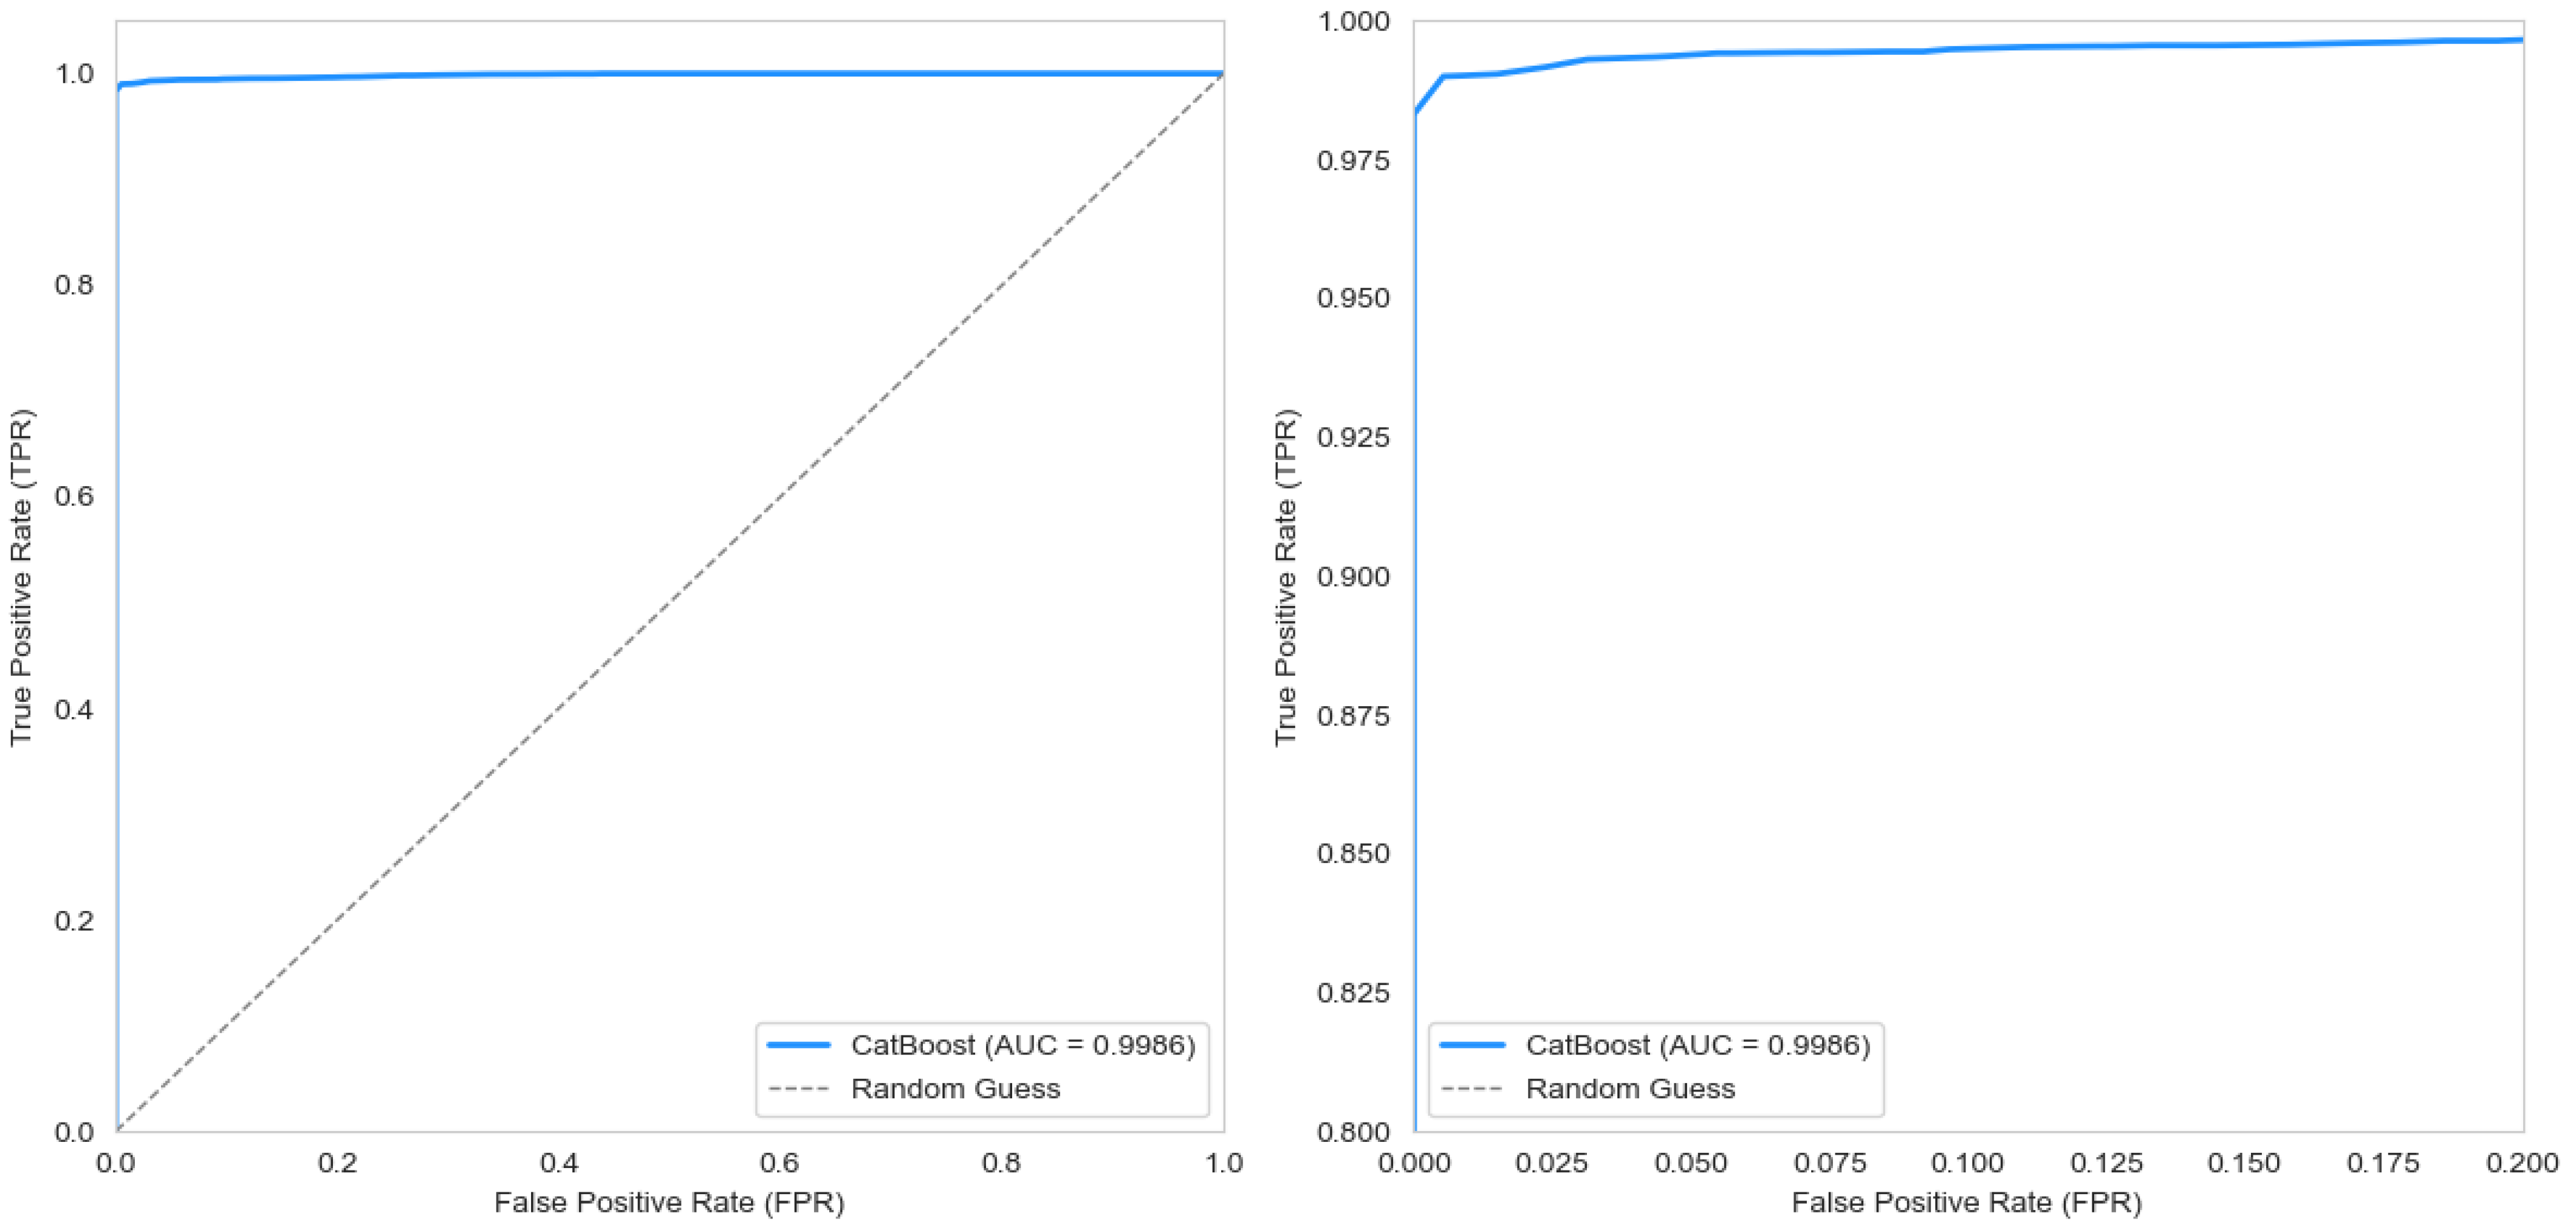
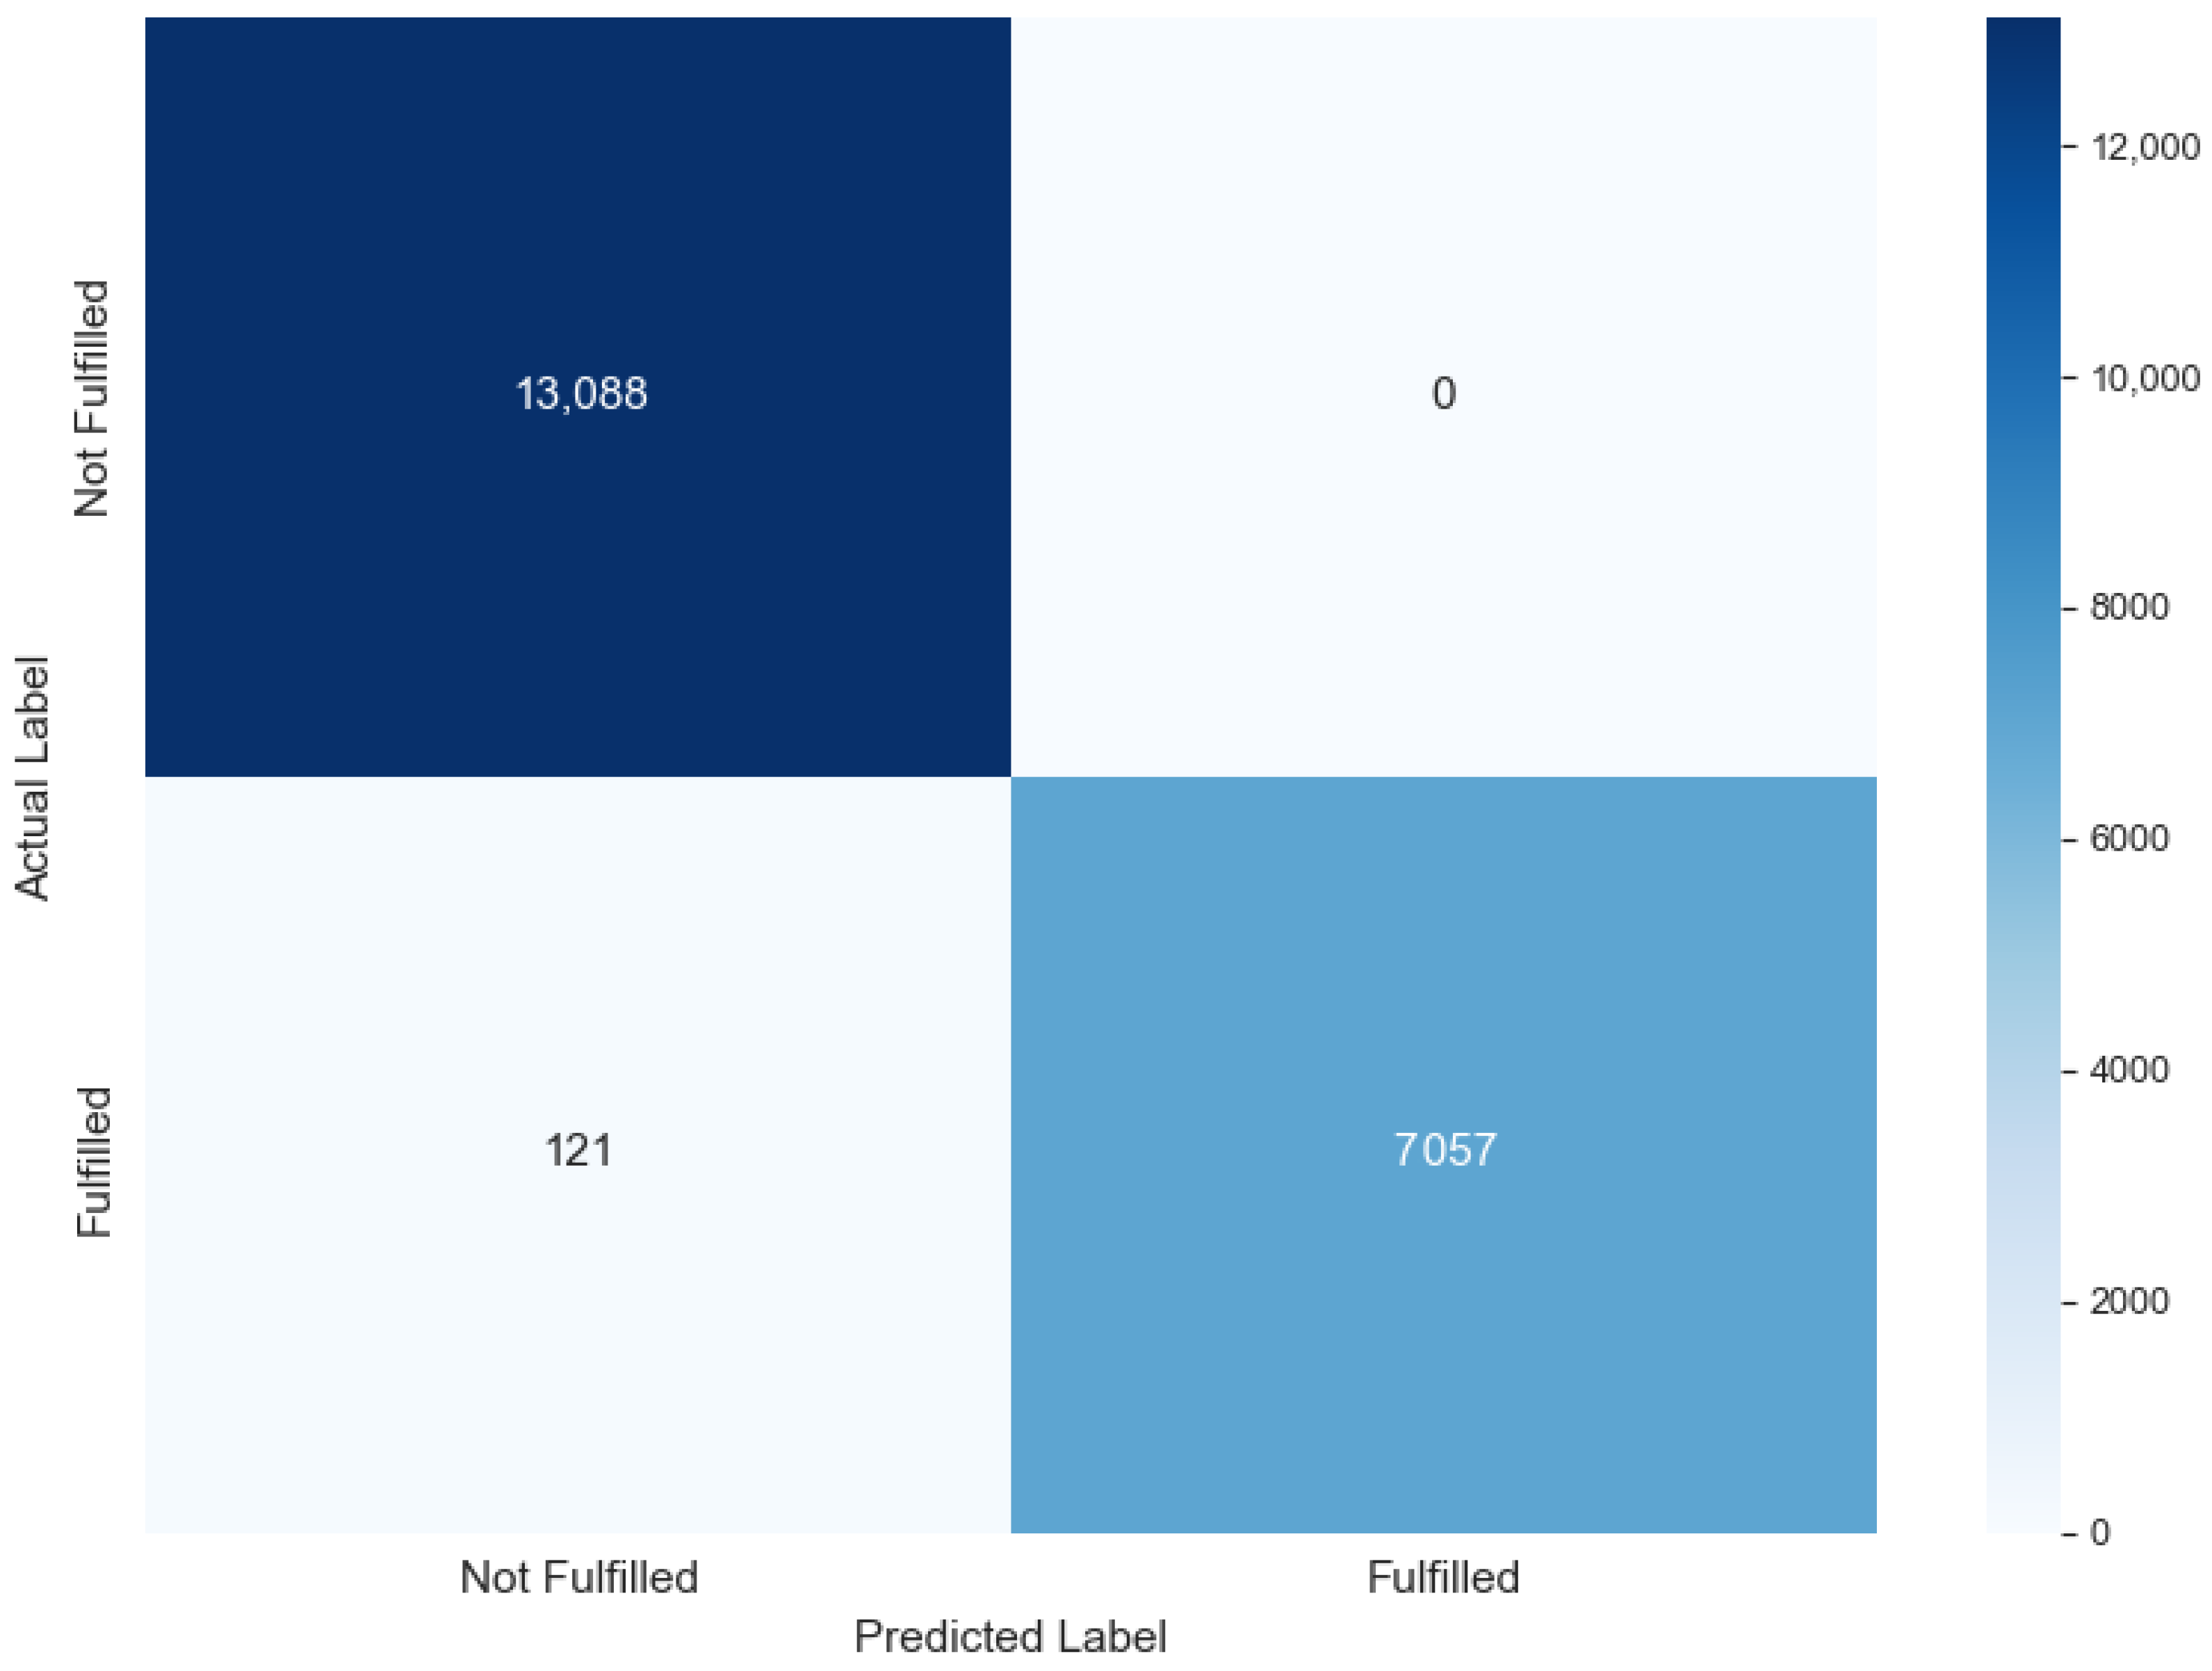
| CB | 99.40% | 100.00% | 98.31% | 99.15% | 0.998556 | 0.998345 |
| XGB | 99.40% | 100.00% | 98.31% | 99.15% | 0.998546 | 0.998369 |
| RFR | 99.40% | 100.00% | 98.31% | 99.15% | 0.998414 | 0.998261 |
| DT | 99.40% | 100.00% | 98.31% | 99.15% | 0.998417 | 0.998249 |
| SVM | 99.40% | 100.00% | 98.31% | 99.15% | 0.996821 | 0.995645 |
| Logistic Regression | 99.40% | 100.00% | 98.31% | 99.15% | 0.997709 | 0.997448 |
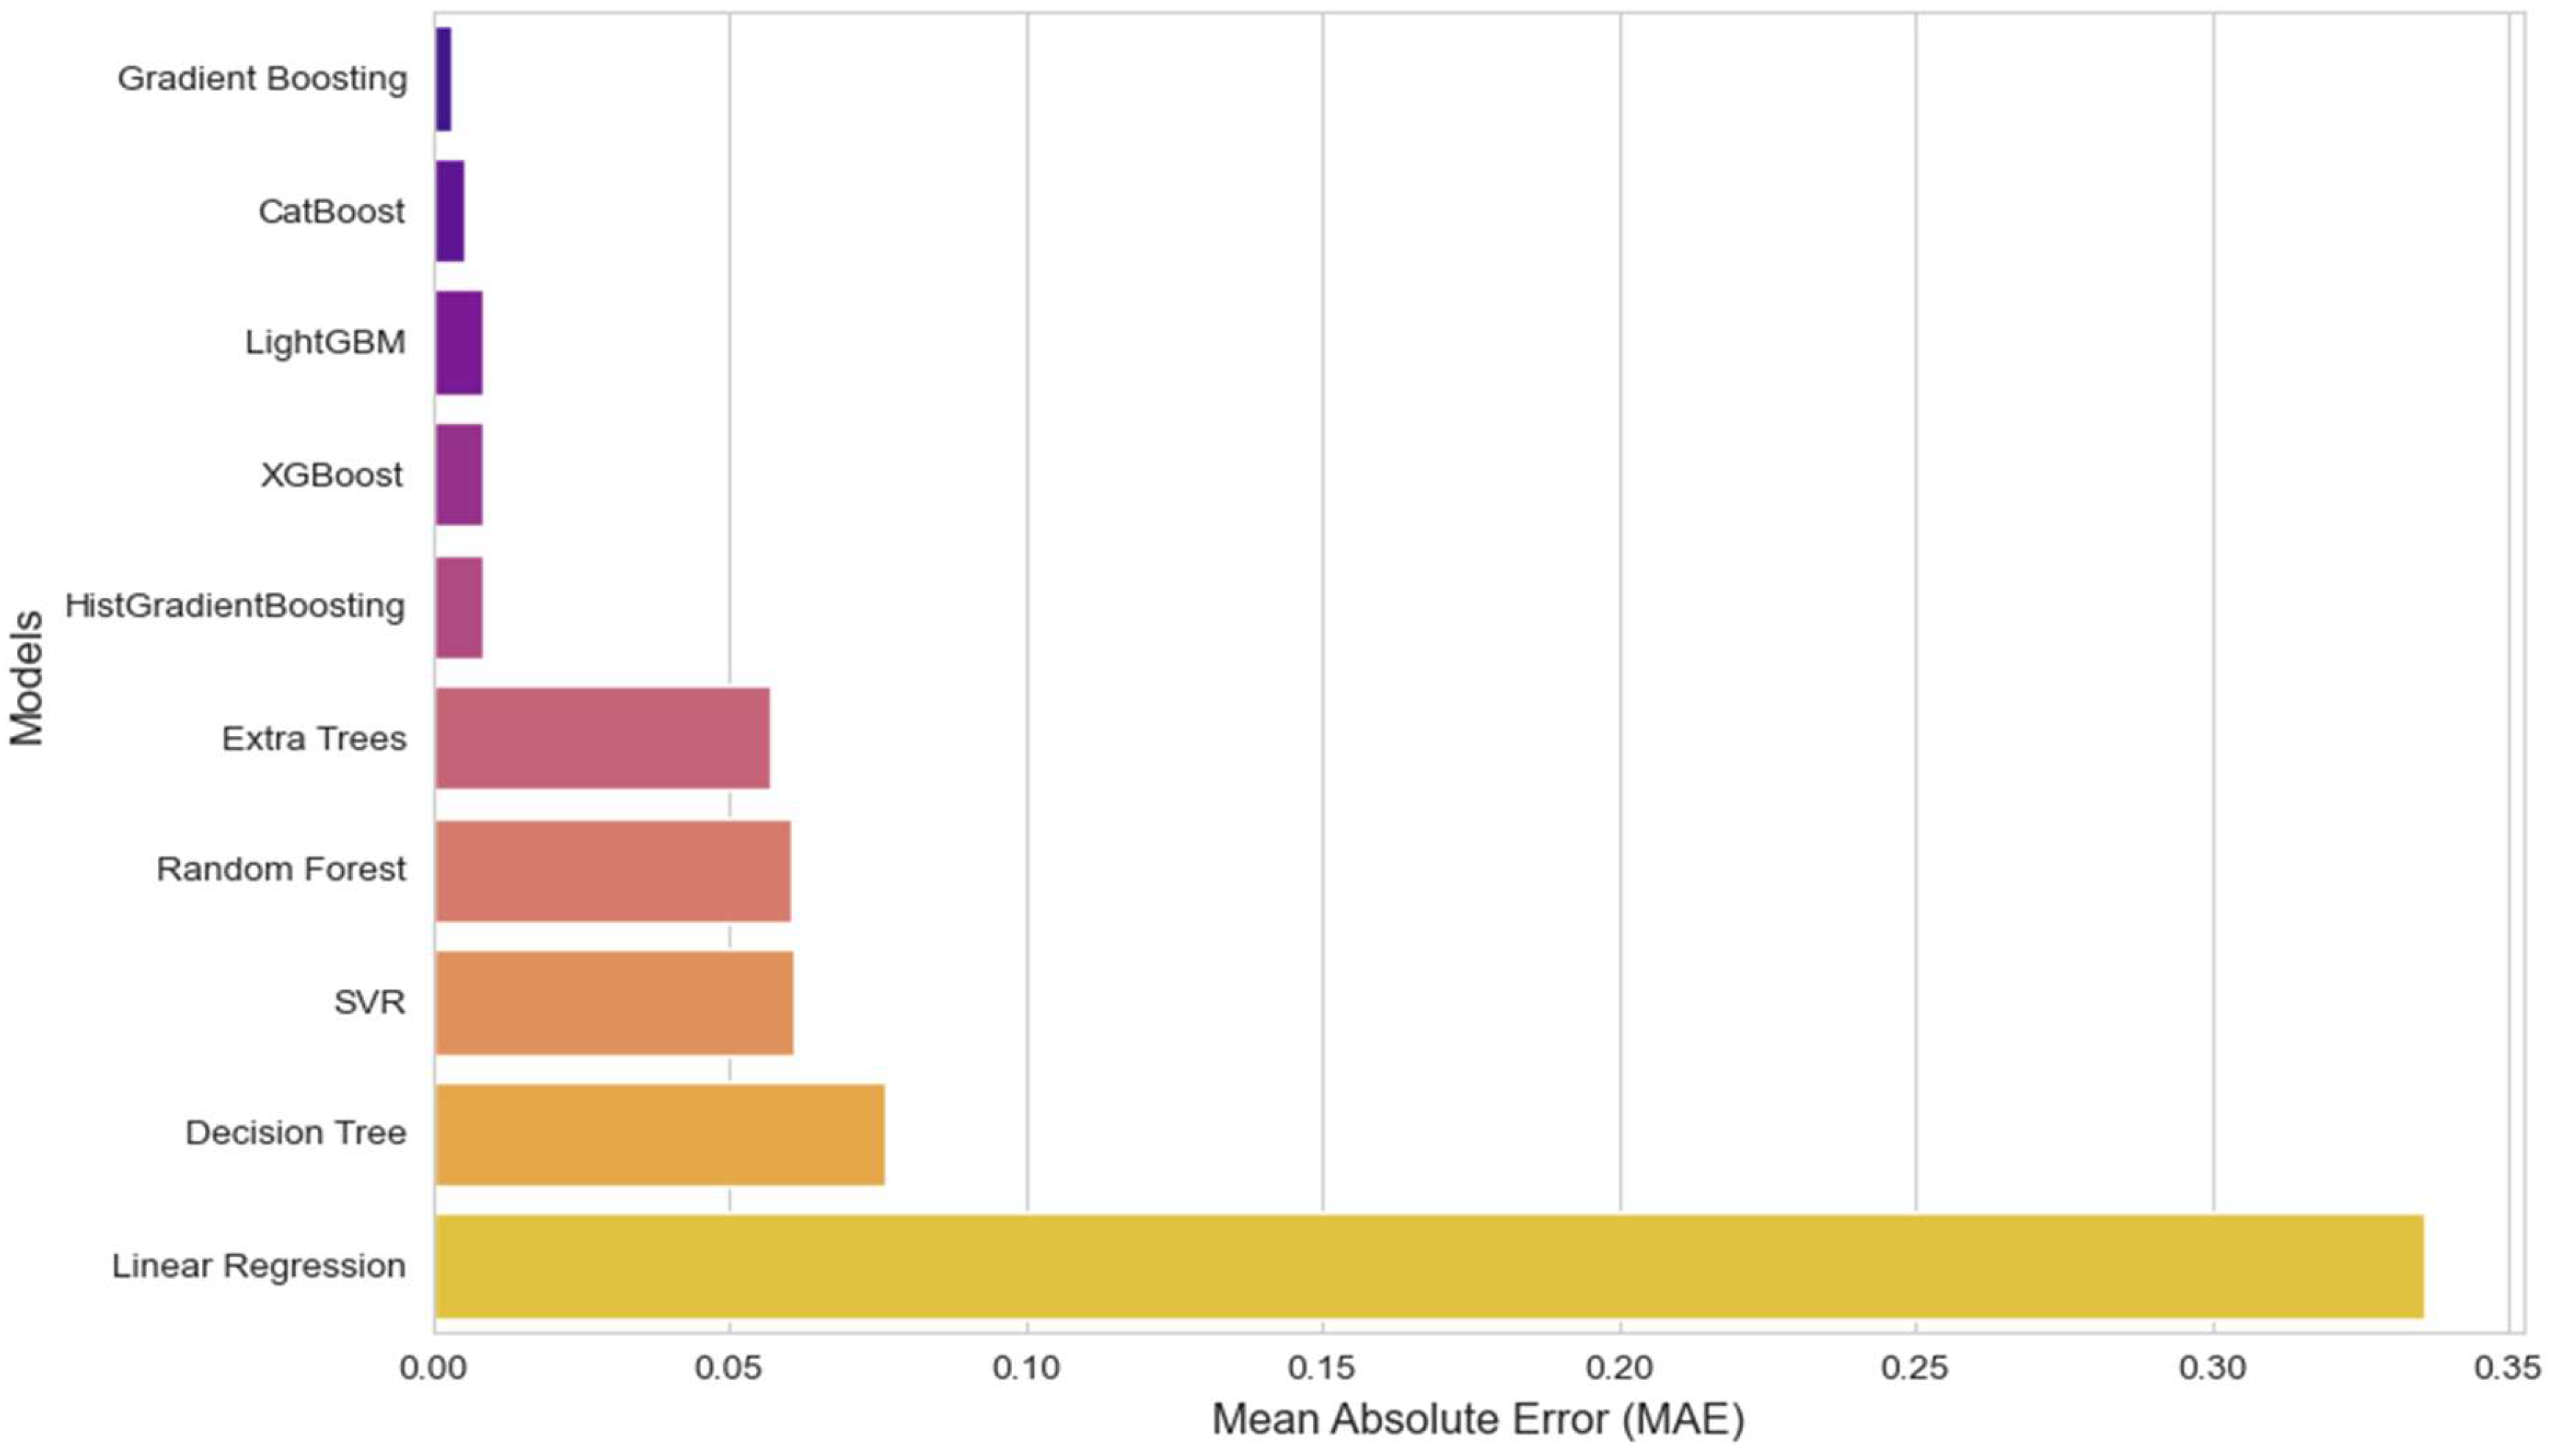
| Model | MAE (↓ Lower Is Better) | RMSE (↓ Lower Is Better) |
|---|---|---|
| GBR | 0.003403 | 0.005406 |
| CB | 0.005237 | 0.020630 |
| LightGBM | 0.008566 | 0.021444 |
| XGB | 0.008574 | 0.022642 |
| HistGradientBoosting | 0.008716 | 0.022654 |
| Extra Trees | 0.057097 | 0.097678 |
| RFR | 0.060356 | 0.095996 |
| SVR | 0.061143 | 0.069634 |
| DT | 0.076509 | 0.114145 |
| LR | 0.335903 | 0.435449 |
| Model | Selected Algorithm | MAE (↓ Lower Is Better) | RMSE (↓ Lower Is Better) | Accuracy | Precision | Recall | F1-Score | AUC-ROC |
|---|---|---|---|---|---|---|---|---|
| SPM | GBR | 0.006522 | 0.009565 | - | - | - | - | - |
| CFSM | GBR | 0.009170 | 0.011713 | - | - | - | - | - |
| PFM | CBC | - | - | 99.40% | 100.00% | 98.31% | 99.15% | 0.998556 |
| GPM | LightGBM | - | - | 100.00% | 100.00% | 100.00% | 100.00% | 1.000 |
| RLM | GBR | 0.003403 | 0.005406 | - | - | - | - | - |
| Course ID | Final Score | Course Name | Course Level | Course Category | Credit Type |
|---|---|---|---|---|---|
| 458 | 1.34 | PSYC 458 | Upper-division | Theory | ME |
| 242 | 1.32 | PSYC 242 | Upper-division | Application | GE |
| 499 | 1.18 | PSYC 499 | Intermediate | Research | MR |
| 103 | 1.07 | PSYC 103 | Intermediate | Research | GR |
| 483 | 1.04 | PSYC 483 | Upper-division | Application | GR |
| Course ID | Final Score | Course Name | Course Level | Course Category | Credit Type |
|---|---|---|---|---|---|
| 179 | 1.83 | ECON 179 | Upper-division | Application | MR |
| 420 | 1.33 | ECON 420 | Upper-division | Application | GR |
| 193 | 1.33 | ECON 193 | Introductory | Research | GR |
| 159 | 1.30 | ECON 159 | Upper-division | Theory | MR |
| 268 | 1.06 | ECON 268 | Intermediate | Theory | Special |
Disclaimer/Publisher’s Note: The statements, opinions and data contained in all publications are solely those of the individual author(s) and contributor(s) and not of MDPI and/or the editor(s). MDPI and/or the editor(s) disclaim responsibility for any injury to people or property resulting from any ideas, methods, instructions or products referred to in the content. |
© 2025 by the authors. Licensee MDPI, Basel, Switzerland. This article is an open access article distributed under the terms and conditions of the Creative Commons Attribution (CC BY) license (https://creativecommons.org/licenses/by/4.0/).
Share and Cite
Islam, M.S.; Hosen, A.S.M.S. Personalized Course Recommendation System: A Multi-Model Machine Learning Framework for Academic Success. Digital 2025, 5, 17. https://doi.org/10.3390/digital5020017
Islam MS, Hosen ASMS. Personalized Course Recommendation System: A Multi-Model Machine Learning Framework for Academic Success. Digital. 2025; 5(2):17. https://doi.org/10.3390/digital5020017
Chicago/Turabian StyleIslam, Md Sajid, and A. S. M. Sanwar Hosen. 2025. "Personalized Course Recommendation System: A Multi-Model Machine Learning Framework for Academic Success" Digital 5, no. 2: 17. https://doi.org/10.3390/digital5020017
APA StyleIslam, M. S., & Hosen, A. S. M. S. (2025). Personalized Course Recommendation System: A Multi-Model Machine Learning Framework for Academic Success. Digital, 5(2), 17. https://doi.org/10.3390/digital5020017