Communication

PDX1 Functions as a Tumor Suppressor in MCF7 Breast Cancer Cells: Implications for Chemotherapeutic Sensitivity

by
Tayo Alex Adekiya
Department of Pharmaceutical Sciences, College of Pharmacy, Howard University, Washington, DC 20059, USA
BioChem 2025, 5(3), 20; https://doi.org/10.3390/biochem5030020
Submission received: 21 May 2025 / Revised: 8 July 2025 / Accepted: 14 July 2025 / Published: 17 July 2025

Abstract

Background: Transcription factor pancreatic and duodenal homeobox 1 (PDX1) plays a central role in pancreatic development and insulin regulation. However, its role in breast cancer remains largely unexplored. Objective: This study investigated the effects of PDX1 knockdown and overexpression on MCF7 breast cancer cell proliferation and responsiveness to paclitaxel and doxorubicin. Methods: PDX1 knockdown and overexpression models were established in MCF7 cells. Cell viability was assessed using the XTT assay following exposure to paclitaxel (5–100 nM) or doxorubicin (125–10 µM). Gene and protein expression levels were analyzed by qRT-PCR and western blotting. Results: PDX1 knockdown in MCF7 cells led to a significant increase in proliferation compared to the scrambled control, with approximately 3.22-fold at 72 h, whereas PDX1 overexpression markedly reduced proliferation by about 2.4-fold at 72 h when compared with the control. Upon treatment with paclitaxel or doxorubicin, knockdown cells showed higher viability, indicating reduced drug sensitivity. In contrast, PDX1-overexpressing cells exhibited a significant decrease in viability after treatment with both drugs, demonstrating enhanced sensitivity. Conclusions: PDX1 exhibits tumor-suppressive properties in MCF7 cells and modulates drug response, suggesting that it may serve as a biomarker or therapeutic target in hormone receptor-positive breast cancer.

1. Introduction

Breast cancer remains a significant global health concern, and chemoresistance poses a major challenge in its treatment [1]. Despite significant advances in early detection and therapeutic interventions, resistance to chemotherapy continues to be a formidable challenge that limits treatment success, particularly in hormone receptor-positive (HR+) breast cancer subtypes such as those represented by MCF7 cells [2,3] (Lainetti et al. 2020; Chun, Park, and Fan 2017). Understanding the molecular determinants of chemoresistance and identifying novel biomarkers that can guide personalized treatment approaches remain critical priorities in breast cancer research. Among the numerous molecular players implicated in cancer biology, the pancreatic and duodenal homeobox 1 (PDX1) gene is a key transcriptional regulator primarily known for its role in pancreatic development and function. Recent studies have implicated its dysregulation in multiple cancers, where it has emerged as a potential tumor suppressor or oncogene [4,5,6,7], depending on the tissue type and microenvironment. In pancreatic ductal adenocarcinoma, PDX1 plays a dynamic role in both tumor initiation and maintenance [6], whereas in other cancers, including gastric and breast cancer, PDX1 downregulation has been associated with enhanced tumor growth and aggressiveness [4,7,8,9]. However, its role in breast cancer, particularly in modulating chemotherapeutic sensitivity, remains largely unexplored.
Recent studies have highlighted the importance of understanding the molecular mechanisms underlying drug resistance in breast cancer cells [10,11,12]. Previous studies have demonstrated that other tumor suppressors, such as p53 and RUNX3, play crucial roles in regulating estrogen receptor α (ERα) activity and chemosensitivity in breast cancer cells [13,14]. Additionally, regulators of apoptosis, epithelial–mesenchymal transition (EMT), and drug metabolism, such as microRNAs and transglutaminases, have been implicated in determining the responsiveness of breast cancer cells to chemotherapy [15,16]. In addition, the complex interplay between tumor suppressors and chemotherapeutic agents is well documented. For instance, the expression of tissue transglutaminase (TG2) has been linked to drug resistance in MCF-7 cells [1], whereas tumor protein D54 (TPD54) has been shown to enhance cellular sensitivity to metformin treatment [17]. Furthermore, microRNAs have been implicated in modulating chemoresistance, as evidenced by the role of miR-129-3p in docetaxel resistance [12]. These findings suggest that transcription factors, such as PDX1, which are capable of modulating broad gene expression networks, could significantly influence drug sensitivity.
Notably, while PDX1 expression has been studied in pancreatic and gastric cancers, its role in breast cancer, and more specifically, in the context of chemotherapy response, remains largely unexplored. Breast cancer is a heterogeneous disease with hormone receptor-positive (HR+) subtypes, such as MCF7 cells, exhibiting distinct molecular characteristics and variable responses to chemotherapeutic agents such as paclitaxel and doxorubicin, compared to triple-negative or HER2-enriched variants [18]. Elucidating the contribution of PDX1 to proliferation and drug sensitivity within this context could provide valuable clinical insights and potentially inform tailored therapeutic strategies for HR+ breast cancer.
In this study, the role of PDX1 in MCF7 breast cancer cells was investigated by employing both overexpression and knockdown strategies to modulate its expression. The effects of PDX1 modulation on cell proliferation and its impact on sensitivity to two widely used chemotherapeutic agents, paclitaxel and doxorubicin, were evaluated. The aim of this study was to determine whether PDX1 acts as a tumor suppressor in breast cancer cells and whether its expression influences the chemotherapeutic efficacy. By addressing these questions, this study contributes to the growing body of knowledge on the molecular underpinnings of drug resistance in breast cancer and suggests novel avenues for improving therapeutic outcomes through the modulation of transcription factor activity.
Given the emerging but poorly defined role of PDX1 in breast cancer biology, this study hypothesized that PDX1 functions as a tumor suppressor in hormone receptor-positive breast cancer cells and modulates their sensitivity to chemotherapeutic agents. To the best knowledge of this study’s author, this is the first study to comprehensively assess the effects of PDX1 knockdown and overexpression on MCF7 breast cancer cell proliferation and responsiveness to paclitaxel and doxorubicin. By elucidating the functional role of PDX1 in this context, the findings from this study may identify PDX1 as a potential biomarker for predicting chemotherapeutic responses or as a target for future therapeutic interventions aimed at overcoming drug resistance in breast cancer.

2. Materials and Methods

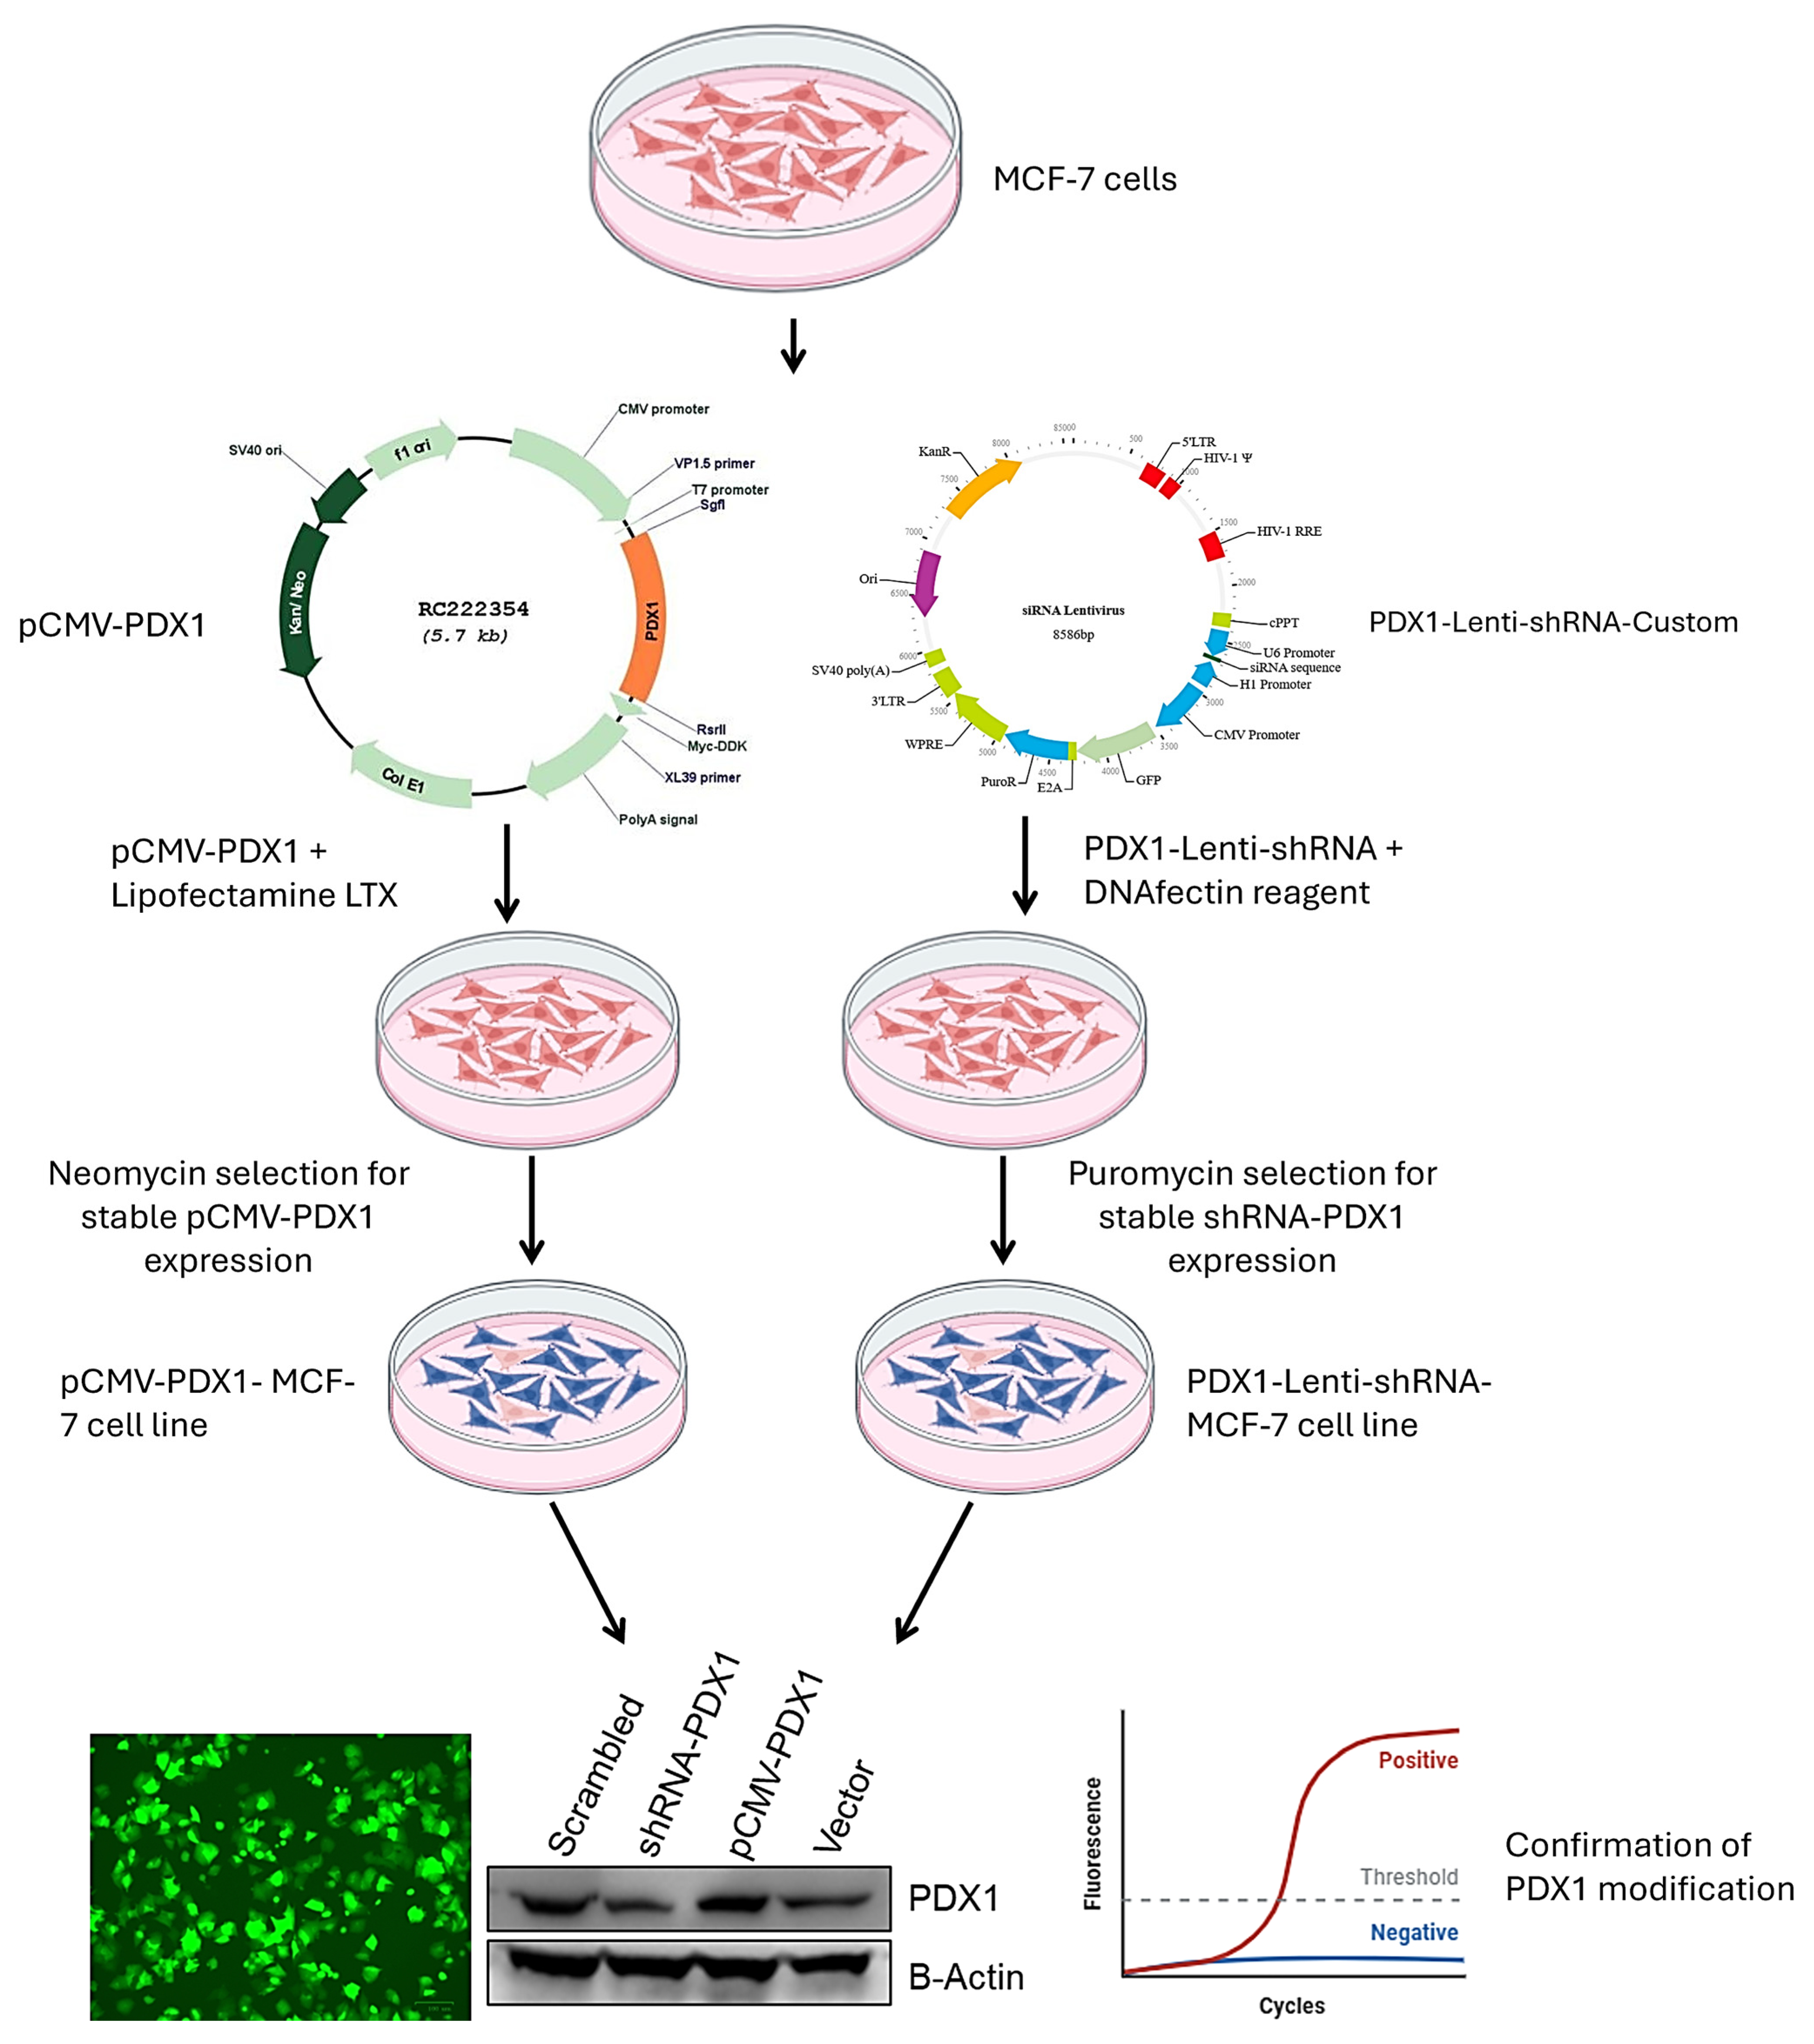
2.1. Cell Culture and Genetic Modulation

MCF7 cells (ATCC, Manassas, VA, USA) were cultured in RPMI 1640 medium (ATCC, Manassas, VA, USA) supplemented with 10% fetal bovine serum (FBS) (ATCC, Manassas, VA, USA) and 1% penicillin-streptomycin (Thermo Fisher Scientific, Waltham, MA, USA) at 37 °C in a humidified atmosphere with 5% CO22. For PDX1 overexpression, MCF7 cells were seeded at a density of 1 × 10⁶ cells in T25 flasks. After a 24 h incubation period, the cells were transfected with 2.5, 5, or 10 µg/flask of the pCMV-PDX1 (Myc-DDK-tagged) plasmid construct (OriGene, Cat. No. RC222354) or an empty pCMV vector (OriGene, Rockville, MD, USA) using Lipofectamine LTX transfection reagent (Invitrogen, Waltham, MA, USA) according to the manufacturer’s protocol. Cells were harvested and counted 24, 48, or 72 h post-transfection using a Coulter counter to determine the optimum pCMV-PDX1 concentration. To generate stable PDX1-overexpressing cells, optimal transfected cells were selected in a medium containing 400 µg/mL neomycin (Gibco, Grand Island, NY, USA) starting one day post-transfection. After three weeks of selection, the neomycin-resistant clones were pooled and expanded. These stably transfected cells were used for RNA and protein extraction, quantitative RT-PCR (qRT-PCR), western blot analysis, and subsequent studies.
For PDX1 knockdown, MCF7 cells were seeded at a density of 1 × 1066 cells per T25 flask and transduced with either PDX1-targeting shRNA or scrambled negative control shRNA (ABM Biolabs, Vancouver, Canada; Cat. No. LV015-G-Custom) using DNAfectin Plus transfection reagent (ABM Cat. No. G2500), according to the manufacturer’s instructions. At 24 h post-transduction, the cells were placed in a medium containing 3 µg/mL puromycin (Thermo Fisher Scientific, Cat. No. J67236) for the selection of stably transduced clones, and strong GFP fluorescence indicated high transduction efficiency in both scrambled and shRNA-PDX1 cells. Cells were harvested 48 h post-selection for RNA extraction to assess knockdown efficiency via qRT-PCR. The shRNA construct demonstrating the greatest PDX1 suppression and growth inhibition was selected, and stable puromycin-resistant clones were pooled and propagated for two weeks. These stable PDX1 knockdown cells were used for RNA and protein extraction, qRT-PCR, western blot analysis, and drug treatment.
Control cells received either an empty pCMV vector for overexpression experiments or a lentiviral vector expressing scrambled shRNA for knockdown experiments. The efficiency of PDX1 overexpression or knockdown was verified using quantitative RT-PCR and western blot analysis. This comprehensive approach allowed for robust genetic modulation of PDX1 expression in MCF7 cells, enabling further investigation of its role in breast cancer biology. Figure 1 presents a schematic representation of PDX1 modulation in MCF-7 breast cancer cells, illustrating both the overexpression and knockdown strategies used to investigate the functional and drug response roles of PDX1 in an in vitro model.

2.2. Gene and Protein Expression Analysis

To confirm the modulation of PDX1 expression at both the transcript and protein levels, quantitative real-time PCR (qRT-PCR) and western blot analyses were performed. Total RNA was extracted using TRIzol reagent (Invitrogen, Cat No. 15596026), and cDNA was synthesized using the RevertAid RT Kit (ThermoScientific, Cat No. K1691) according to the manufacturer’s instructions. Gene expression was analyzed using TaqMan assays (Table 1) with HotStarTaq Master Mix (Qiagen, Venlo, The Netherlands, Cat No. 203203) on a CFX96 Real-Time PCR System (Bio-Rad, Hercules, CA, USA). The PCR protocol included an initial activation at 95 °C for 15 min, followed by 35 cycles of 94 °C for 30 s, 54 °C for 30 s, and 72 °C for 1 min. The relative expression levels were calculated using the 2−ΔΔCt method, with β-actin as the endogenous control. All qRT-PCR experiments were conducted in triplicate.
For western blotting, proteins were separated using NuPAGE 4–12% Bis-Tris gels and transferred to membranes, which were then probed with specific antibodies. Protein integrity was maintained by using lysis buffers supplemented with 0.5 M EDTA and a protease/phosphatase inhibitor cocktail (Thermo Scientific, Rosemont, IL, USA, Cat No. 1861281). Protein concentrations were quantified using the BCA Protein Assay Kit (Pierce, Rockford, IL, USA). Membranes were imaged using the ChemiDoc MP imaging system (Bio-Rad, Hercules, CA, USA). The anti-PDX1 antibody (Proteintech, Chicago, IL, USA, Cat No. 20989-1-AP) was used to detect PDX1 protein levels, with β-actin (1:500; sc-69879; Lot# D1911) serving as a loading control (Santa Cruz Biotechnology, Dallas, TX, USA). Secondary antibodies, including anti-mouse and anti-rabbit antibodies, were obtained from Cell Signaling Technology (Cat No. 7076P2 and 7074P2, respectively).

2.3. Drug Treatment and Viability Assays

The cells were treated with paclitaxel (Millipore Sigma, St. Louis, MO, USA) (5–100 nM) or doxorubicin (Thermo Fisher Scientific, Waltham, MA, USA) (125 nM–10 µM) for 24, 48, and 72 h according to method described by Adekiya et al. [19]. Cell viability was assessed using the XTT assay (Thermo Fisher Scientific, Waltham, MA, USA) according to the manufacturer’s protocol. Absorbance was measured at 450 nm on a Biotek ELx808 absorbance microplate reader (Lonza, Walkersville, MD, USA). The results are presented as percentage viabilities normalized to that of the controls. The data represent the mean ± SD of four replicates per concentration tested.

2.4. Statistical Analysis

All experiments were conducted in triplicate. Data were analyzed using one-way ANOVA with Tukey’s post-hoc test (GraphPad Prism-Version 10.1.2 for windows) (p < 0.05 considered significant). IC50 values were calculated using an online tool: “Quest Graph™ IC50 Calculator,” AAT Bioquest, Inc. (Pleasanton, CA, USA) (https://www.aatbio.com/tools/ic50-calculator, accessed on 2 March 2025) [20].

3. Results

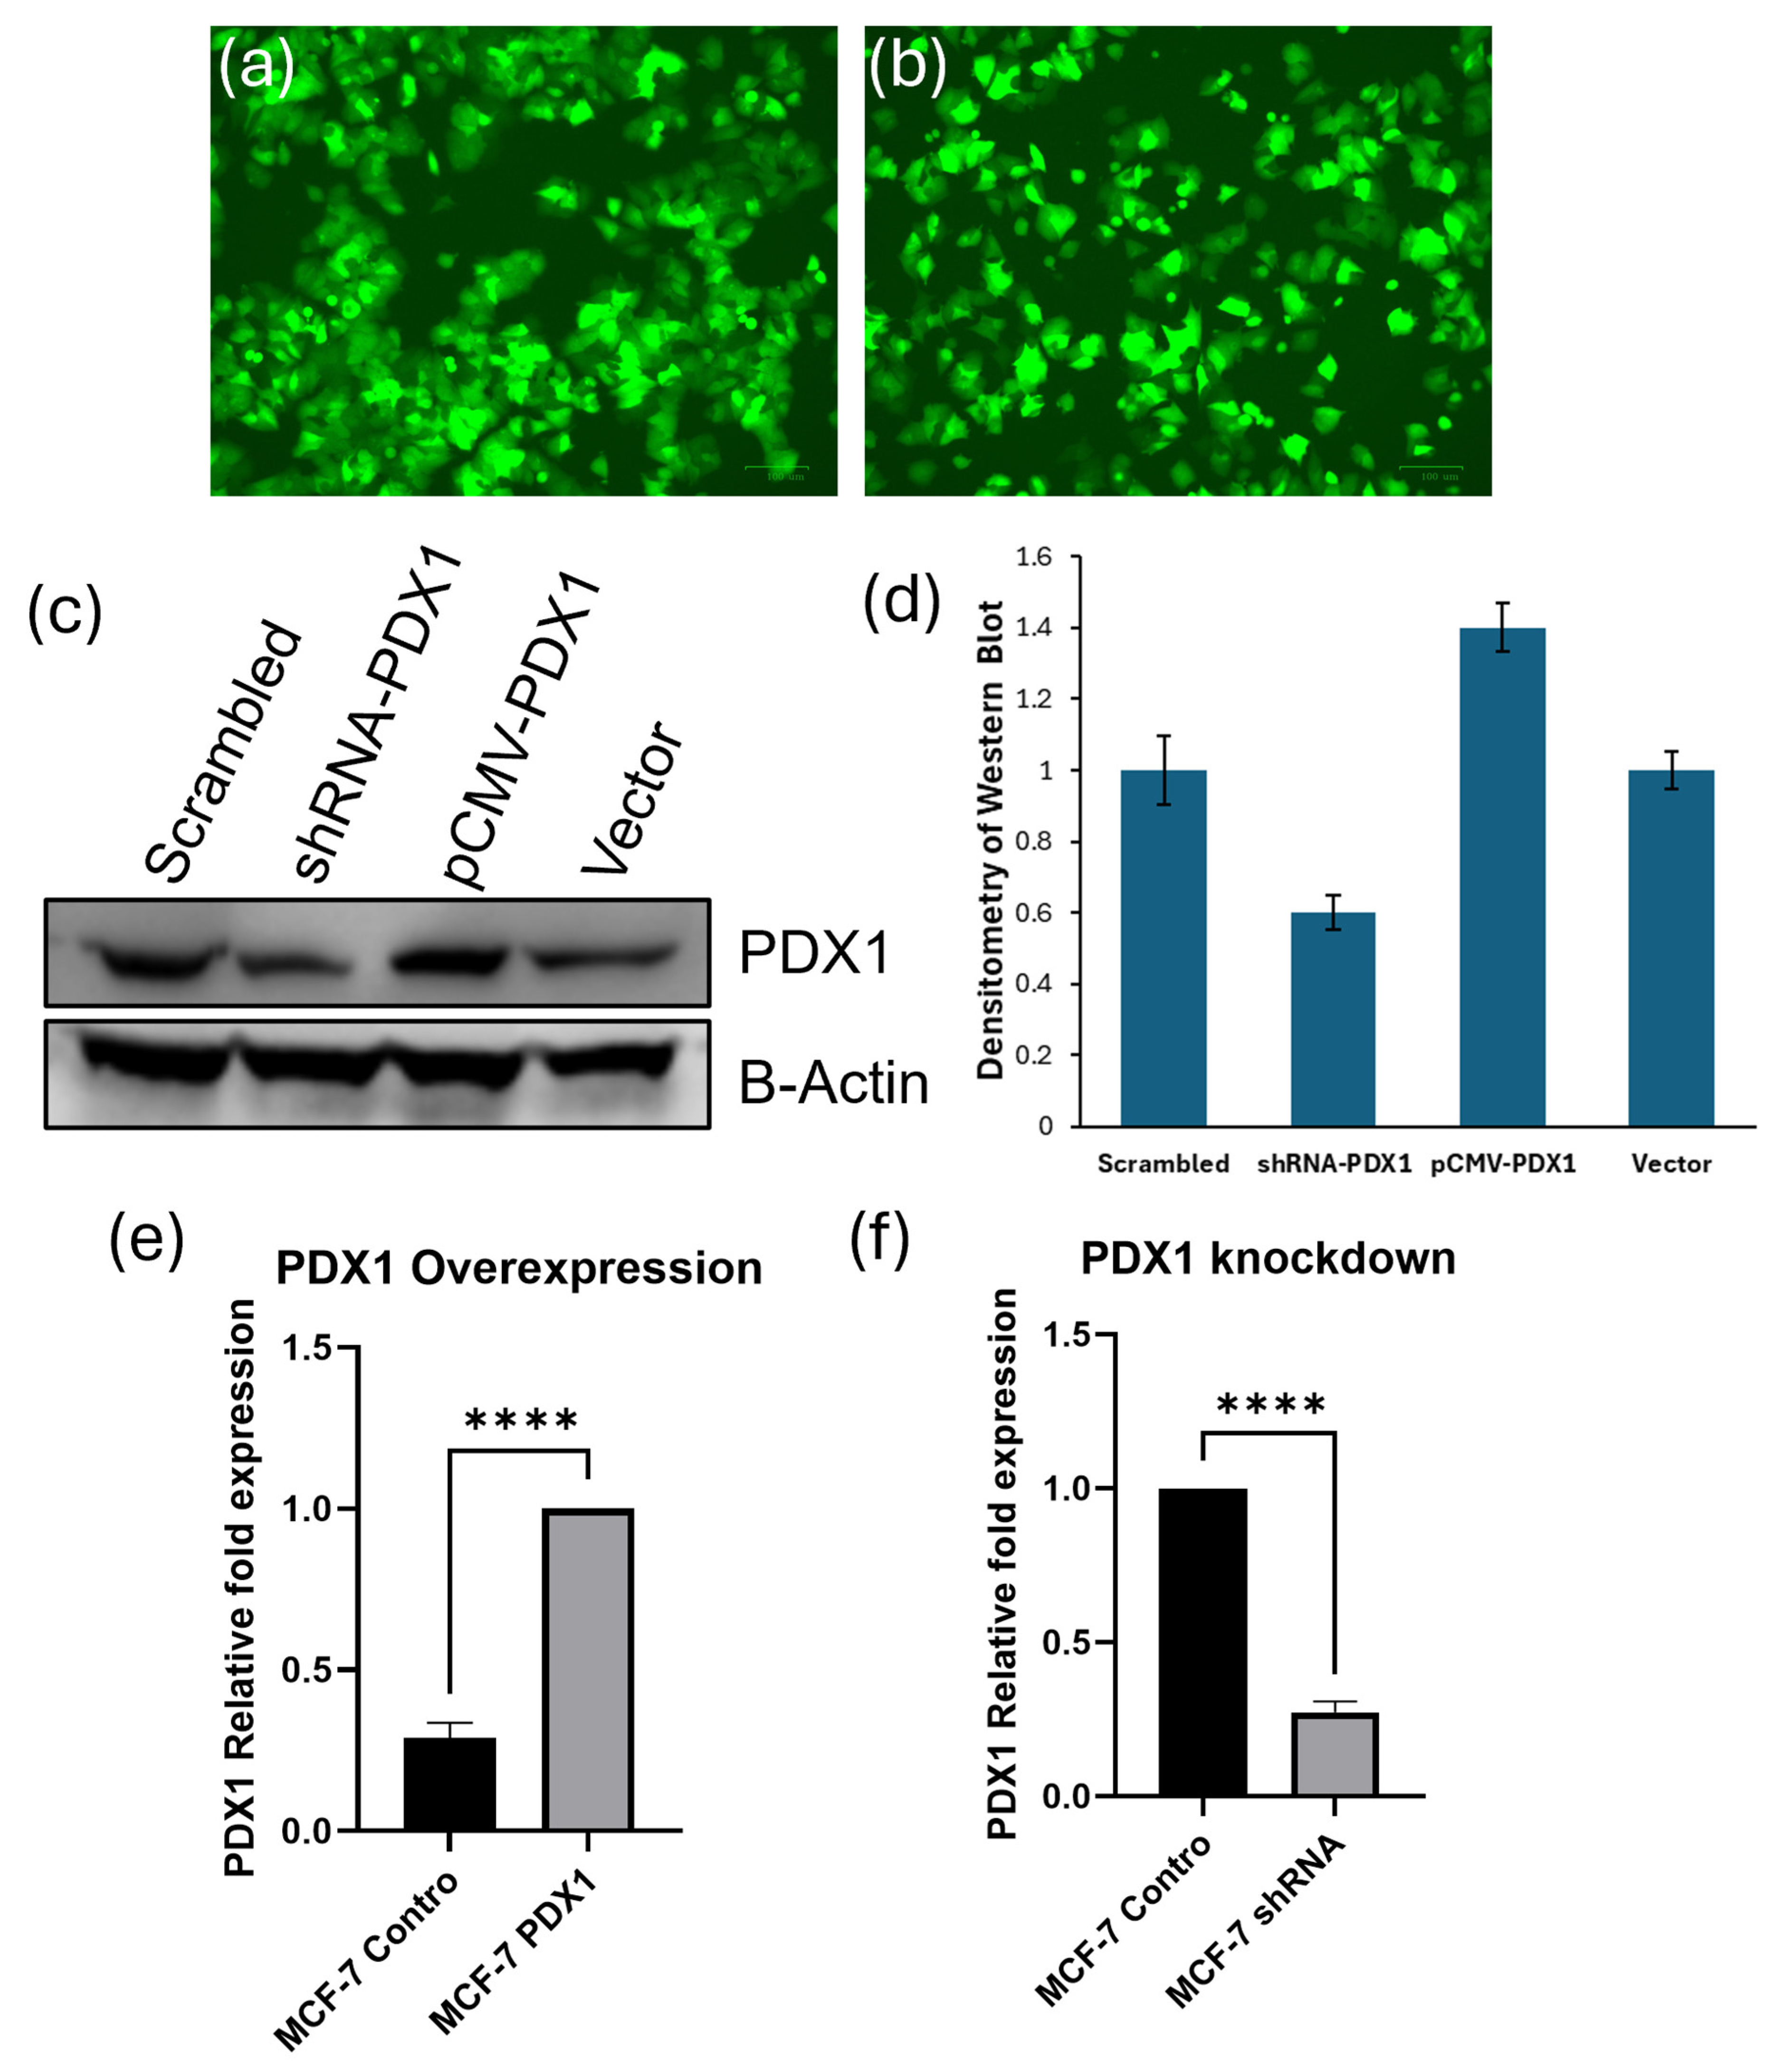
3.1. PDX1 Expression Is Effectively Modulated in MCF-7 Breast Cancer Cells

To investigate the functional role of PDX1 in MCF-7 breast cancer cells, both PDX1 overexpression and knockdown expression modulation were performed. At 72 h post-transfection, cell morphology was assessed using fluorescence microscopy. Successful transfection was confirmed by GFP fluorescence quality, as observed in both the scrambled control group (Figure 2a) and PDX1 shRNA-transduced cells (Figure 2b). Western blot analysis confirmed that MCF-7 cells transfected with the PDX1 expression vector exhibited marked upregulation of PDX1 protein compared to the vector control (Figure 2c,d). Conversely, cells transduced with shRNA targeting PDX1 showed a robust decrease in PDX1 protein levels relative to the scrambled control (Figure 2c,d), demonstrating an effective knockdown. Furthermore, qRT-PCR analysis supported these findings at the transcriptional level. Overexpression of PDX1 significantly elevated mRNA expression in transfected cells compared to vector-only controls by approximately 4.31-fold (Figure 2e). In contrast, PDX1 mRNA levels were substantially reduced in cells transduced with PDX1 shRNA (approximately 4.54-fold), confirming the successful gene silencing (Figure 2f).

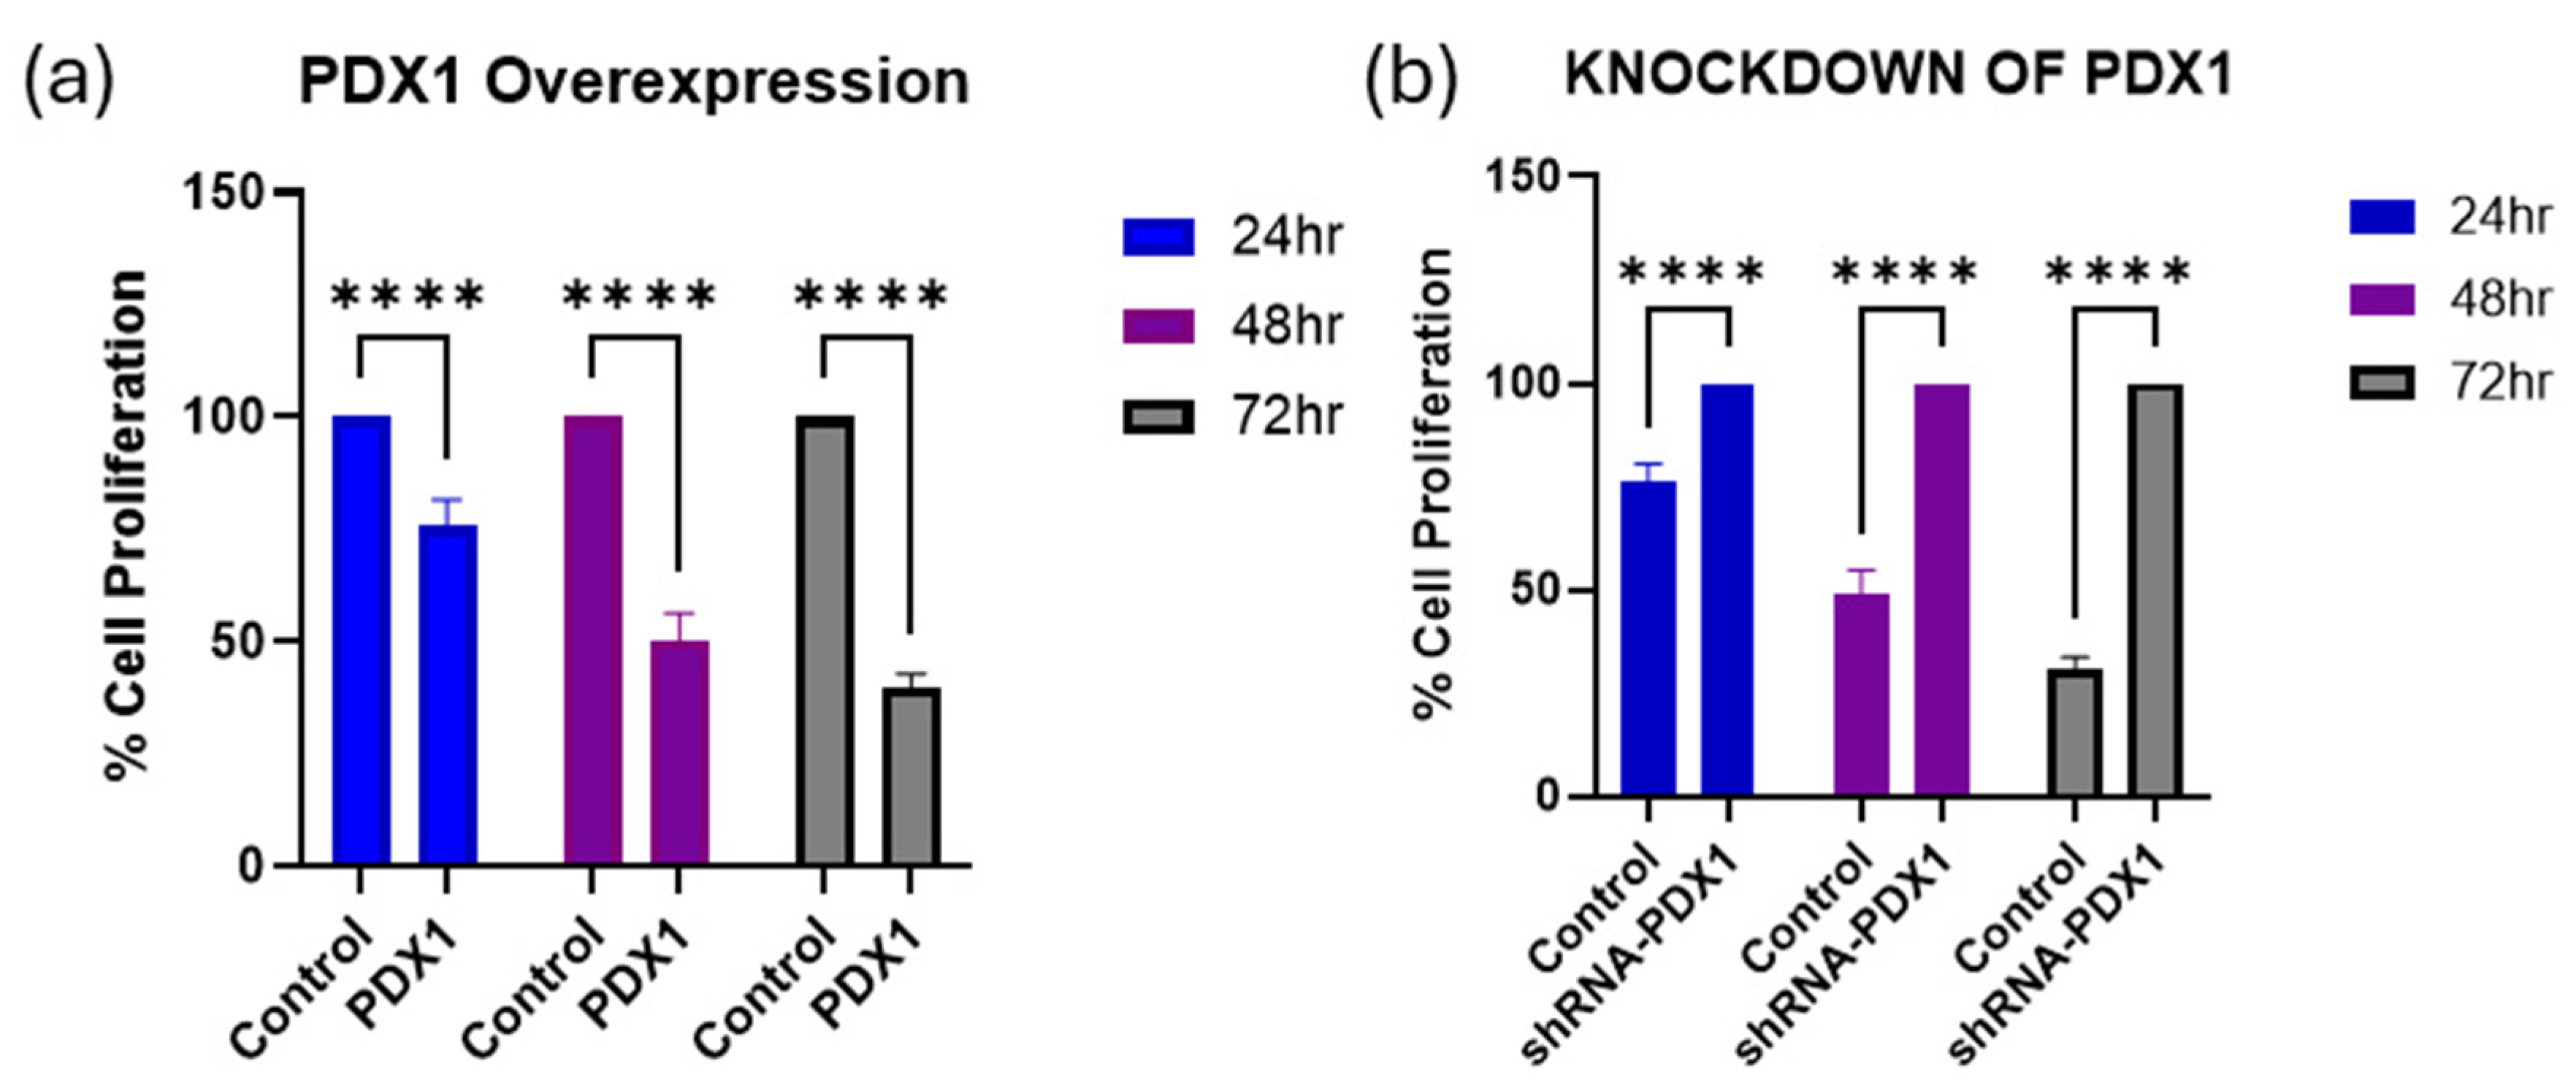
3.2. PDX1 Modulation Influences MCF-7 Cell Viability over Time

To determine the role of PDX1 in regulating cell proliferation, MCF-7 cell viability was examined following genetic modulation of PDX1 expression. Figure 3a shows the viability of PDX1-overexpressing cells compared to that of vector controls at 24 h, 48 h, and 72 h post-transfection. At all three time points, PDX1 overexpression markedly reduced the cell viability. Notably, a significant decrease was observed at 48 and 72 h, with viability dropping to approximately 2.2-fold and 2.4-fold, respectively, in PDX1-overexpressing cells compared to the control. Conversely, PDX1 knockdown increased cell proliferation (Figure 3b). Compared to the scrambled control, MCF-7 cells with PDX1 knockdown showed elevated viability, which was particularly pronounced at 48 h and 72 h, where viability showed a 2.22-fold increase and a 3.22-fold increase, respectively. The difference in cell viability between the PDX1 knockdown and its scrambled control was statistically significant at each time point, as determined by one-way ANOVA followed by Tukey’s post-hoc test (p < 0.05). This indicates that the observed effect is not solely due to a drop in the control group’s viability but also reflects a true inhibitory role of PDX1 knockdown on cell proliferation. These findings suggest that endogenous PDX1 expression suppresses cell growth, and its loss promotes a proliferative phenotype in hormone receptor-positive breast cancer cells.

3.3. PDX1 Modulation Alters Chemosensitivity of MCF-7 Cells to Paclitaxel and Doxorubicin

To evaluate the effect of PDX1 modulation on chemotherapeutic sensitivity, the viability of MCF-7 cells following treatment with paclitaxel and doxorubicin under both PDX1 knockdown and overexpression conditions was assessed. IC5500 values at 72 h post-treatment were calculated and compared (Table 2). In PDX1 knockdown cells, paclitaxel IC5500 increased from 1.313 nM (control) to 2.652 nM, indicating reduced sensitivity. Conversely, overexpression of PDX1 led to a lower IC5500 of 0.966 nM compared to 1.472 nM in the control vector group. A similar trend was observed for doxorubicin: IC5500 values increased from 1.327 µM to 1.361 µM with PDX1 knockdown and decreased from 1.663 µM to 1.488 µM with PDX1 overexpression. For paclitaxel treatment, cell viability increased approximately 2.02-fold in PDX1 knockdown cells and 1.52-fold in PDX1 overexpressing cells. In contrast, under doxorubicin treatment, the increase was about 1.03-fold in PDX1 knockdown and 1.12-fold in PDX1 overexpression conditions. As shown in Figure 4a–d, PDX1 knockdown cells showed a modest decrease in viability with paclitaxel treatment compared to vector controls at 24 h (Figure 4a) and a more pronounced but still less effective cytotoxic response at 72 h (Figure 4b). For doxorubicin, PDX1 knockdown cells retained higher viability at all concentrations at both 24 h and 72 h (Figure 4c,d). In contrast, PDX1 overexpression enhanced drug sensitivity. Cells overexpressing PDX1 demonstrated significantly reduced viability upon paclitaxel exposure for both 24 h (Figure 4e) and 72 h (Figure 4f). Similarly, doxorubicin treatment resulted in greater cytotoxicity in PDX1-overexpressing cells than in the controls (Figure 4g,h), particularly at higher concentrations and longer exposure times. To capture intermediate effects, data from the 48 h time point are provided in Supplementary Figure S1.

4. Discussion

Gene modulation plays a crucial role in cancer treatment and significantly affects sensitivity to chemotherapy. The ability to manipulate gene expression has opened new avenues for targeted therapies and for overcoming drug resistance in cancer cells. Gene modulation can be used to enhance the efficacy of chemotherapeutic agents in cancer treatment [21,22]. For instance, microRNAs (miRNAs) have emerged as key players in regulating drug sensitivity. Specifically, miR-34 has been identified as a tumor suppressor miRNA whose expression levels are associated with chemotherapy response. Low levels of miR-34 in tumors or circulation often correlate with poor response to chemotherapy, while elevated miR-34 levels in resistant cancer cells can restore drug sensitivity [23]. This highlights the potential of miRNA modulation as a strategy to improve chemotherapy outcomes.
This study provides strong evidence that PDX1 plays a tumor-suppressive role in MCF-7 breast cancer cells and significantly influences their sensitivity to chemotherapy. Using both overexpression and knockdown strategies, we successfully modulated PDX1 expression in the MCF-7 cells. The consistent changes observed at both protein and transcript levels confirmed the effectiveness of the transfection methods and validated the system for functional analysis. These tools allowed us to investigate the biological effects of PDX1 modulation on cell growth and the response to chemotherapy. Functionally, overexpression of PDX1 significantly reduced MCF-7 cell viability in a time-dependent manner, indicating progressive suppression of proliferative capacity or activation of cytotoxic pathways. In contrast, silencing PDX1 enhanced proliferation, particularly at later time points, suggesting that loss of PDX1 may contribute to unchecked tumor growth. These findings align with emerging research showing that transcription factors traditionally associated with developmental roles, such as PDX1 in pancreatic lineage specification, can exhibit tumor suppressor functions in other tissues [5]. Other similar studies have also reported the role of PDX1 in suppressing breast cancer cells and gastric cancer [7,9].
Mechanistically, PDX1 may inhibit tumor progression by reinforcing cell cycle checkpoints, promoting apoptosis, or repressing oncogenic transcriptional programs. The enhanced proliferation of PDX1-deficient cells may reflect their release from these suppressive controls, resulting in more aggressive growth. Conversely, the reintroduction of PDX1 may reinstate tumor-suppressive signaling, potentially through pathways governing differentiation, cell cycle arrest, or programmed cell death.
Importantly, chemotherapeutic assays demonstrated that PDX1 modulation directly affects the drug response. PDX1 knockdown conferred partial resistance to both paclitaxel and doxorubicin, as evidenced by higher IC5500 values and sustained cell viability across drug concentrations and time points. Conversely, PDX1 overexpression sensitized cells to these agents, leading to greater cytotoxic effects and lower IC5500 values. These differences became more pronounced with longer drug exposure, suggesting a cumulative or synergistic interaction between PDX1 expression and drug-induced stress response. The integration of gene therapy with traditional chemotherapy, as demonstrated by the use of cationic micelles for co-delivery of drugs and suicide genes [24], exemplifies the synergistic potential of combining gene modulation with conventional treatment.
These findings suggest that PDX1 may serve not only as a tumor suppressor but also as a key modulator of chemotherapy sensitivity in hormone receptor-positive breast cancer. Given the increasing emphasis on personalized oncology, assessing PDX1 expression levels could inform treatment decisions and help predict patient responses to chemotherapeutic regimens. Furthermore, therapeutic strategies aimed at restoring or enhancing PDX1 activity may offer a novel approach to re-sensitize resistant tumors and suppress disease progression. Further studies are warranted to elucidate the downstream molecular pathways regulated by PDX1 and to validate its role in clinical settings using patient-derived models. Nonetheless, the findings from this study offer valuable insights into the dual role of PDX1 in growth suppression and chemotherapy sensitization, positioning it as a potential biomarker and therapeutic target in breast cancer management.

5. Conclusions

PDX1 regulates breast cancer cell growth and enhances sensitivity to paclitaxel and doxorubicin. In the broader context of personalized oncology, these results suggest that PDX1 status could serve as a predictive biomarker for chemotherapy responses in hormone receptor-positive breast cancers. Targeting the pathways that regulate PDX1 expression or harness its sensitizing effect may represent a novel therapeutic strategy for overcoming drug resistance in breast cancer.

Supplementary Materials

Supporting information can be downloaded at https://www.mdpi.com/article/10.3390/biochem5030020/s1, Figure S1: Percent cell viability of MCF-7 cells following PDX1 modulation and treatment with chemotherapeutic agents. (a) PDX1 knockdown cells treated with paclitaxel at 48 h; (b) PDX1 overexpressing cells treated with paclitaxel at 48 h; (c) PDX1 knockdown cells treated with doxorubicin at 44 h; (d) PDX1 overexpressing cells treated with doxorubicin at 48 h. Data are presented as mean ± SD (n = 4). Control represents 0.01% DMSO in media.

Funding

This research received no external funding.

Institutional Review Board Statement

This study did not involve human participants, human data, or animal subjects. Therefore, ethical approval was not required.

Informed Consent Statement

Not applicable.

Data Availability Statement

The data supporting the findings of this study will be made available upon request.

Acknowledgments

I acknowledge the Department of Pharmaceutical Sciences and College of Pharmacy, Howard University, for their support. I also thank B. Kwabi-addo for availing his laboratory to conduct the experiments.

Conflicts of Interest

The author declares no conflicts of interest.

References

  1. Herman, J.F.; Mangala, L.S.; Mehta, K. Implications of increased tissue transglutaminase (TG2) expression in drug-resistant breast cancer (MCF-7) cells. Oncogene 2006, 25, 3049–3058. [Google Scholar] [CrossRef]
  2. Lainetti, P.D.F.; Leis-Filho, A.F.; Laufer-Amorim, R.; Battazza, A.; Fonseca-Alves, C.E. Mechanisms of resistance to chemotherapy in breast cancer and possible targets in drug delivery systems. Pharmaceutics 2020, 12, 1193. [Google Scholar] [CrossRef]
  3. Chun, K.H.; Park, J.H.; Fan, S. Predicting and overcoming chemotherapeutic resistance in breast cancer. In Translational Research in Breast Cancer: Biomarker Diagnosis, Targeted Therapies and Approaches to Precision Medicine; Springer: Singapore, 2017; pp. 59–104. [Google Scholar]
  4. Kondratyeva, L.; Chernov, I.; Kopantzev, E.; Didych, D.; Kuzmich, A.; Alekseenko, I.; Kostrov, S.; Sverdlov, E. Pancreatic lineage specifier PDX1 increases adhesion and decreases motility of cancer cells. Cancers 2021, 13, 4390. [Google Scholar] [CrossRef] [PubMed]
  5. Tang, Z.C.; Chu, Y.; Tan, Y.Y.; Li, J.; Gao, S. Pancreatic and duodenal homeobox-1 in pancreatic ductal adenocarcinoma and diabetes mellitus. Chin. Med. J. 2020, 133, 344–350. [Google Scholar] [CrossRef]
  6. Roy, N.; Takeuchi, K.K.; Ruggeri, J.M.; Bailey, P.; Chang, D.; Li, J.; Leonhardt, L.; Puri, S.; Hoffman, M.T.; Gao, S.; et al. PDX1 dynamically regulates pancreatic ductal adenocarcinoma initiation and maintenance. Genes Dev. 2016, 30, 2669–2683. [Google Scholar] [CrossRef]
  7. Ma, J.; Li, J.; Li, H.; Xiao, X.; Shen, L.; Fang, L. Downregulation of pancreatic-duodenal homeobox 1 expression in breast cancer patients: A mechanism of proliferation and apoptosis in cancer. Mol. Med. Rep. 2012, 6, 983–988. [Google Scholar] [CrossRef]
  8. Oz Puyan, F.; Can, N.; Ozyilmaz, F.; Usta, U.; Sut, N.; Tastekin, E.; Altaner, S. The relationship among PDX1, CDX2, and mucin profiles in gastric carcinomas; correlations with clinicopathologic parameters. J. Cancer Res. Clin. Oncol. 2011, 137, 1749–1762. [Google Scholar] [CrossRef]
  9. Ma, J.; Chen, M.; Wang, J.; Xia, H.H.; Zhu, S.; Liang, Y.; Gu, Q.; Qiao, L.; Dai, Y.; Zou, B.; et al. Pancreatic duodenal homeobox-1 (PDX1) functions as a tumor suppressor in gastric cancer. Carcinog. 2008, 29, 1327–1333. [Google Scholar] [CrossRef]
  10. Li, Z.; Qian, J.; Li, J.; Zhu, C. Knockdown of lncRNA-HOTAIR downregulates the drug-resistance of breast cancer cells to doxorubicin via the PI3K/AKT/mTOR signaling pathway. Exp. Ther. Med. 2019, 18, 435–442. [Google Scholar] [CrossRef]
  11. Li, P.; Zhong, D.; Gong, P.Y. Synergistic effect of paclitaxel and verapamil to overcome multi-drug resistance in breast cancer cells. Biochem. Biophys. Res. Comm 2019, 516, 183–188. [Google Scholar] [CrossRef]
  12. Zhang, Y.; Wang, Y.; Wei, Y.; Li, M.; Yu, S.; Ye, M.; Zhang, H.; Chen, S.; Liu, W.; Zhang, J. MiR-129-3p promotes docetaxel resistance of breast cancer cells via CP110 inhibition. Sci. Rep. 2015, 5, 15424. [Google Scholar] [CrossRef]
  13. Huang, B.; Qu, Z.; Ong, C.W.; Tsang, Y.H.; Xiao, G.; Shapiro, D.; Salto-Tellez, M.; Ito, K.; Ito, Y.; Chen, L.F. RUNX3 acts as a tumor suppressor in breast cancer by targeting estrogen receptor α. Oncogene 2012, 31, 527–534. [Google Scholar] [CrossRef]
  14. Lam, S.; Lodder, K.; Teunisse, A.F.A.S.; Rabelink, M.J.W.E.; Schutte, M.; Jochemsen, A.G. Role of Mdm4 in drug sensitivity of breast cancer cells. Oncogene 2010, 29, 2415–2426. [Google Scholar] [CrossRef] [PubMed]
  15. Antonyak, M.A.; Miller, A.M.; Jansen, J.M.; Boehm, J.E.; Balkman, C.E.; Wakshlag, J.J.; Page, R.L.; Cerione, R.A. Augmentation of tissue transglutaminase expression and activation by epidermal growth factor inhibit doxorubicin-induced apoptosis in human breast cancer cells. J. Biol. Chem. 2004, 279, 41461–41467. [Google Scholar] [CrossRef] [PubMed]
  16. Dong, B.; Li, S.; Zhu, S.; Yi, M.; Luo, S.; Wu, K. MiRNA-mediated EMT and CSCs in cancer chemoresistance. Exp. Hematol. Oncol. 2021, 10, 1–12. [Google Scholar] [CrossRef] [PubMed]
  17. Zhuang, Y.; Ly, R.C.; Frazier, C.V.; Yu, J.; Qin, S.; Fan, X.Y.; Goetz, M.P.; Boughey, J.C.; Weinshilboum, R.; Wang, L. The novel function of tumor protein D54 in regulating pyruvate dehydrogenase and metformin cytotoxicity in breast cancer. Cancer Metab. 2019, 7, 1. [Google Scholar] [CrossRef]
  18. Orrantia-Borunda, E.; Anchondo-Nuñez, P.; Acuña-Aguilar, L.E.; Gómez-Valles, F.O.; Ramírez-Valdespino, C.A. Subtypes of breast cancer. In Breast Cancer; Mayrovitz, H.N., Ed.; Exon Publications: Brisbane, Australia, 2022. [Google Scholar]
  19. Adekiya, T.A.; Moore, M.; Thomas, M.; Lake, G.; Hudson, T.; Adesina, S.K. Preparation, optimization, and in-vitro evaluation of brusatol-and docetaxel-loaded nanoparticles for the treatment of prostate cancer. Pharmaceutics 2024, 16, 114. [Google Scholar] [CrossRef]
  20. AAT Bioquest, Inc. Quest Graph™ IC50 Calculator. Available online: https://www.aatbio.com/tools/ic50-calculator (accessed on 21 January 2025).
  21. Liu, H.; Zhu, X.; Wei, Y.; Song, C.; Wang, Y. Recent advances in targeted gene silencing and cancer therapy by nanoparticle-based delivery systems. Biomed. Pharmacother. 2023, 157, 114065. [Google Scholar] [CrossRef]
  22. Youssef, E.; Fletcher, B.; Palmer, D. Enhancing precision in cancer treatment: The role of gene therapy and immune modulation in oncology. Front. Med. 2025, 11, 1527600. [Google Scholar] [CrossRef]
  23. Naghizadeh, S.; Mohammadi, A.; Duijf, P.H.; Baradaran, B.; Safarzadeh, E.; Cho, W.C.S.; Mansoori, B. The role of miR-34 in cancer drug resistance. J. Cell. Physiol. 2020, 235, 6424–6440. [Google Scholar] [CrossRef]
  24. Li, K.; Tian, S.; Sun, K.; Su, Q.; Mei, Y.; Niu, W. ROS-responsive polyprodrug micelles carrying suicide genes in combination with chemotherapy and gene therapy for prostate cancer treatment. RSC Adv. 2024, 14, 5577–5587. [Google Scholar] [CrossRef]
Figure 1. Schematic workflow representation of PDX1 modulation in MCF-7 breast cancer cells, illustrating both the overexpression and knockdown approaches used in vitro.
Biochem 05 00020 g001
Figure 2. (a) Scrambled control; (b) shRNA-PDX1. Representative fluorescence micrographs of MCF-7 cells 72 h post-transfection. Strong GFP fluorescence indicates high transduction efficiency in both scrambled and shRNA-PDX1 groups. Although quantification was not performed, consistent and widespread GFP expression was observed across multiple fields of view. Scale bars, 100 μm. (c) Western blot analysis of PDX1 expression in MCF-7 cells transfected with either vector control or pCMV-PDX1. (d) Western blot analysis of PDX1 expression in MCF-7 cells transfected with either PDX1 shRNA vector or scrambled control. (d) Densitometric analysis of western blot bands was performed using ImageJ software (Version 1.54k) with PDX1 expression levels normalized to β-actin. (e) QRT-PCR analysis of PDX1 expression in stably transfected MCF-7 cells compared to vector control. (f) QRT-PCR analysis of PDX1 knockdown in MCF-7 cells compared to scrambled control. Statistical significance is indicated as (**** p ≤ 0.0001; t-test). Data shown are representative of three independent experiments.
Biochem 05 00020 g002
Figure 3. Cell proliferation assay showing the effect of (a) PDX1 overexpression on MCF-7 cells compared to vector control; (b) PDX1 knockdown in MCF-7 cells compared to scrambled control. Statistical significance is indicated as (**** p ≤ 0.0001; t-test). Data shown are representative of three independent experiments.
Biochem 05 00020 g003
Figure 4. Percent cell viability of MCF-7 cells following PDX1 modulation and treatment with chemotherapeutic agents. (a,b) PDX1 knockdown cells treated with paclitaxel at 24 h (a) and 72 h (b). (c,d) PDX1 knockdown cells treated with doxorubicin at 24 h (c) and 72 h (d). (e,f) PDX1 overexpressing cells treated with paclitaxel at 24 h (e) and 72 h (f). (g,h) PDX1 overexpressing cells treated with doxorubicin at 24 h (g) and 72 h (h). Data are presented as mean ± SD (n = 4). Control represents 0.01% DMSO in media.
Biochem 05 00020 g004
Table 1. Primer and TaqMan probe sequences for RT-qPCR experiment.
Gene
Abbreviation
Forward Primer (5′-3′)Reverse Primer (5′-3′)Taqman (5′-3′)
B-actinGAACTGCCTGACTACCTCATGCGAAGTCCAGGGCAACATAGTGCGTGACA/ZEN/TCAAAGAGAAGCTGTGC
PDX1TGAAGTCTACCAAAGCTCACGTCCTTCTCCAGCTCTAGCACCTGCCCACTGGCCTTTCCA
Table 2. IC50 values of paclitaxel or doxorubicin solutions compared to controls in different PDX1 modulated MCF-7 cell lines.
TreatmentsControlshRNA-PDX1ControlpCMV-PDX1
Paclitaxel1.313 nM2.652 nM1.472 nM0.966 nM
Doxorubicin1.327 µM1.361 µM1.663 µM1.488 µM
Disclaimer/Publisher’s Note: The statements, opinions and data contained in all publications are solely those of the individual author(s) and contributor(s) and not of MDPI and/or the editor(s). MDPI and/or the editor(s) disclaim responsibility for any injury to people or property resulting from any ideas, methods, instructions or products referred to in the content.

