Article

Formulation and In Vitro Characterization of Cellulose-Based Propranolol Hydrochloride Sustained Release Matrix Tablets

by
Aashish Khadka
1,
Bhupendra Raj Giri
2,
Rishiram Baral
3,
Shailendra Shakya
1 and
Ashwinee Kumar Shrestha
1,*
1
Department of Pharmacy, School of Science, Kathmandu University, Dhulikhel 45200, Nepal
2
Division of Molecular Pharmaceutics and Drug Delivery, College of Pharmacy, The University of Texas at Austin, TX 78712, USA
3
Department of Pharmaceutical Sciences, University of Nebraska Medical Center, 986025 Nebraska Medical Center, Omaha, NE 68198, USA
*
Author to whom correspondence should be addressed.
BioChem 2025, 5(2), 14; https://doi.org/10.3390/biochem5020014
Submission received: 20 April 2025 / Revised: 26 May 2025 / Accepted: 28 May 2025 / Published: 30 May 2025

Abstract

:
Background/Objectives: Propranolol HCl (PPH), a nonselective beta-adrenergic receptor blocker, is employed as an anti-hypertensive, anti-anginal, anti-arrhythmic, and anti-migraine agent. Given its utility in chronic conditions, developing a sustained-release dosage form becomes imperative to optimize therapeutic outcomes while enhancing patient adherence and minimizing side effects. In this study, we employed a widely adopted matrix-based system to develop PPH sustained-release (PPH-SR) matrix tablets, ensuring the uniform dispersion of the drug within the polymeric matrix to regulate its release rate. Methods: Utilizing cellulose-based polymers, specifically HPMC K100M and ethyl cellulose (EC), as matrix formers, nine different formulations were prepared at varying drug-to-polymer ratios. We employed a wet granulation method, followed by compression of the dried granules, to fabricate round-shaped biconvex PPH-SR tablets. Results: Among these different formulations, formulation 2 (F2), comprising 40 mg PPH and 50 mg HPMC K100M (along with other excipients), showed excellent flowability, as evidenced by Carr’s index and angle of repose values of 12.50 and 28.50, respectively. Additionally, the mechanical properties of F2 tablets showed a hardness of 12.34 ± 0.91 KP, an average weight of 200.45 ± 1.87 mg, with a friability of 0.20%, and a content uniformity of 98.36%. Moreover, in vitro release characteristics of F2 tablets demonstrated a sustained-release behavior, with 94.3 ± 10.2% drug release over 24 h. A comparative analysis with marketed tablets yielded similarity and dissimilarity factors of 64 and 8, respectively. Furthermore, the release profile of F2 exhibited a high degree of linearity with the Korsmeyer–Peppas model (R2 of 0.977), showcasing its reliability and predictability. Conclusions: In essence, this in-house developed PPH sustained-release formulation can improve patient adherence, reduce side effects, and improve therapeutic outcomes. These results align with our objective of enhancing the therapeutic efficacy of PPH and affirm the broader relevance of innovative formulation strategies in addressing the challenges of chronic disease management.

1. Introduction

Propranolol hydrochloride (PPH), chemically known as 1-(naphthalen-1-yloxy)-3-[(propan-2-yl) amino] propan-2-ol hydrochloride, is a nonselective β-adrenoceptor blocker with no other autonomic nervous system activity [1]. It exhibits high affinity to beta-1 and beta-2 receptor subtypes, with a slightly lower affinity for the beta-3 subtype [2]. PPH shows its effects primarily by blocking the action of endogenous catecholamines, epinephrine, and norepinephrine at beta-adrenoceptors [3]. PPH is widely used to treat cardiovascular complications, including hypertension, angina, arrhythmias, myocardial infarction, congestive heart failure, and hypertrophic subaortic stenosis [2]. Beyond cardiovascular conditions, PPH is also used to treat hyperthyroidism, pheochromocytoma, migraine, anxiety, and essential tremor [4]. The recommended adult oral daily dose of PPH is typically 40 mg three times a day during an acute heart attack, with variations ranging from 40 to 120 mg, sometimes increasing to 640 mg, depending upon the complication [2].
Despite its widespread use, PPH is associated with several side effects, including bradycardia, hair loss, diarrhea, allergic reactions, breathing problems, hallucinations, muscle cramps or weakness, altered blood sugar levels, and sudden weight gain, among others [5]. To minimize side effects, improve patient adherence, and reduce dosing frequency while extending the therapeutic window, it is essential to develop innovative formulation strategies such as sustained-release (SR) systems that provide controlled drug release and optimized pharmacokinetic profiles [6].
The SR dosage forms are designed to release drugs at a controlled rate, ensuring prolonged drug delivery over an extended period [7]. Such drug release approach is particularly beneficial for drugs that are desired to remain within the therapeutic window for a prolonged time, metabolize rapidly, and eliminate from the body shortly after administration (Dash et al. [8]). When developing SR dosage forms, parameters such as molecular weight, aqueous solubility, apparent partition coefficient or lipophilicity, drug ionization at physiological pH, and drug stability must be carefully considered [9]. These parameters must be optimized appropriately to minimize dosage dumping, delay the beginning of effect, facilitate accurate dose retrieval, and allow for exact dose changes [10].
Multiple formulation design approaches must be investigated to achieve optimal drug release from the SR dosage forms. Commonly utilized SR systems include diffusion systems, porous membrane-controlled systems, porous matrix-controlled systems, and dissolution SR systems [11]. Water-swellable excipients such as xanthan gum, locust bean gum, alginates, hydroxypropyl methylcellulose (HPMC), or non-swellable water-insoluble polymers such as ethyl cellulose (EC), are used as rate-controlling excipients in porous matrix-controlled release systems [12]. Matrix tablets, a common technique to prepare SR dosage forms, combine the principles of porous matrix-controlled release systems. In this method, the drug is carefully mixed with a polymer with desirable properties before being compacted into tablets. Entrapping the drug within the intricate network of polymer chains allows for sustained drug release behavior [13]. Based on the choice of polymer/s used in the formulation, matrix tablets are categorized into hydrophobic matrixes (plastic matrixes), lipid matrixes, hydrophilic matrixes, biodegradable polymers, and mineral matrices. Drug release from these matrixes can occur through diffusion or disintegration mechanisms. Upon contact with aqueous media, the matrix starts to hydrate, leading to swelling and pore blockage, and eventually resulting in the dissolution or release of the drug. Gel formation results in a viscous solution, which generates positive pressure, preventing liquid/media ingress and immediate matrix disintegration [14,15].
The judicious selection of polymer/s is known to show significant effects on the effective formulation design of matrix tablets and the subsequent drug release profile [16,17]. The selection of cellulose-based high-viscosity polymers such as HPMC K100M and EC was intentional, given the high viscosity that makes them ideal for matrix systems as well as PPH’s significant aqueous solubility [18,19]. HPMC, one of the most commonly used carrier materials in hydrophilic matrix tablets, has properties and suitable viscosity that can regulate the rate of hydration and the gel layer properties, thereby affecting drug release behavior [20]. As a result, drug release from matrices incorporating HPMC is closely related to factors such as molecular weight and the degree of methoxy and hydroxypropyl group substitution [21,22]. On the other hand, EC is a cellulose-derived linear polysaccharide that is well suited for developing hydrophobic matrix tablets [22]. The transformation of hydroxyl groups within the repeating anhydrous glucose units of EC into ethyl ether groups yields a non-ionic ethyl ether of cellulose, which has a diverse range of properties, such as a versatile melting point range, specific density, heat distortion point, and fire point. As a result, EC has found widespread application in polymer-controlled drug release, microencapsulation, and a variety of other SR dosage forms, including innovative 3D-printed dosage forms [22,23].
The primary objective of this study was to develop and thoroughly evaluate an in-house 40 mg (therapeutically relevant and commonly commercially available dose) sustained-release PPH tablet using different compositions of cellulose-based hydrophilic and hydrophobic polymers, or a combination of these two. Specifically, we are interested in responsive polymers, notably swellable polymers, as they hold immense promise as versatile carriers for tailoring drug release profiles.

2. Materials and Methods

2.1. Chemicals and Reagents

Excipients like HPMC K100M, EC, microcrystalline cellulose (MCC PH 101), polyvinylpyrrolidone (PVP K 30), colloidal silicon dioxide (Aerosil), magnesium stearate (MgSt), and the model drug, PPH, were obtained as a generous gift from the QbD Pharmaceuticals Pvt. Ltd. (Sanga, Banepa—14, Kavre, Nepal). Analytical-grades acetonitrile, sodium chloride, hydrochloric acid, and citric acid were purchased from the Tokyo Chemical Industry, Japan, and used as received. Dibasic sodium phosphate, methanol, and disodium hydrogen phosphate were procured from Thermo-Fisher Scientific Pvt. Ltd., (Waltham, MA, USA) India. All chemicals and reagents used were of analytical reagent grade.

2.2. Drug Excipient Compatibility Study

The drug and excipient were weighed in a 1:1 weight ratio and then transferred to glass vials. The composite systems were mixed in a vortex mixer for 2 min. Then, water (10%) was added to each vial, and the drug–excipient blend was mixed with a glass capillary (both ends were heat-sealed). The capillary was broken and left inside the vial to prevent material loss. Each vial was sealed using a Teflon-lined screw cap and stored at 50 ˚C in a hot air oven. Similarly, control samples were prepared and stored under refrigerated conditions for comparative study. The samples were periodically examined for any unusual color changes. After 4 weeks of storage under the aforementioned conditions, samples were qualitatively analyzed using Fourier transform infrared spectroscopy (FT-IR).

2.3. Evaluation of Pre-Compression Properties of the Powder Mix

2.3.1. Bulk Density (Db)

Bulk density is the proportion of a powder’s total mass to its bulk volume, which includes spaces between particles and voids within the particles. It is an important parameter in the pharmaceutical industry, as it affects the powder’s flowability, compressibility, and mixing properties. In this study, the bulk density was measured by pouring a fixed weight (100 g powder material in a 250 mL graduated cylinder (as per Method I, USP), and the initial volume was recorded. The bulk density is given by Db = M/V.
Here, M is the weighed mass of the powder, and V is the recorded volume of the container [24].

2.3.2. Tapped Density (Dt)

Tapped density is the ratio of total mass to tapped volume of powder. The powder volume was calculated by tapping it 500 times using a tapped density tester (Campbell Electronics, model TDA-2). The reading is noted if the difference between the two volumes is less than 2%. If it is more than 2%, tapping is repeated another 100 times, and the reading is noted. It is expressed by D = M/V.
Here, M is the weighed mass of powder, and V is the final recorded volume occupied by tapped powder [25].

2.3.3. Powder Flow Property Study

The bulk and tapped density were used to calculate Carr’s index. A fixed funnel method was used to compute the angle of repose. In brief, roughly 50 g of the powder was poured through a funnel with a narrow opening, positioned at a fixed height above the surface that forms a cone-like structure, and then the height and radius of the cone were measured. The following equations were used to calculate the angle of repose and compressibility index:
Angle of repose (tan θ) = height/0.5 base.
Compressibility index (C.I.) = 100 × (Vo − Vf)/(Vo).
Vo is the unsettled apparent volume, and Vf is the final tapped volume [26].

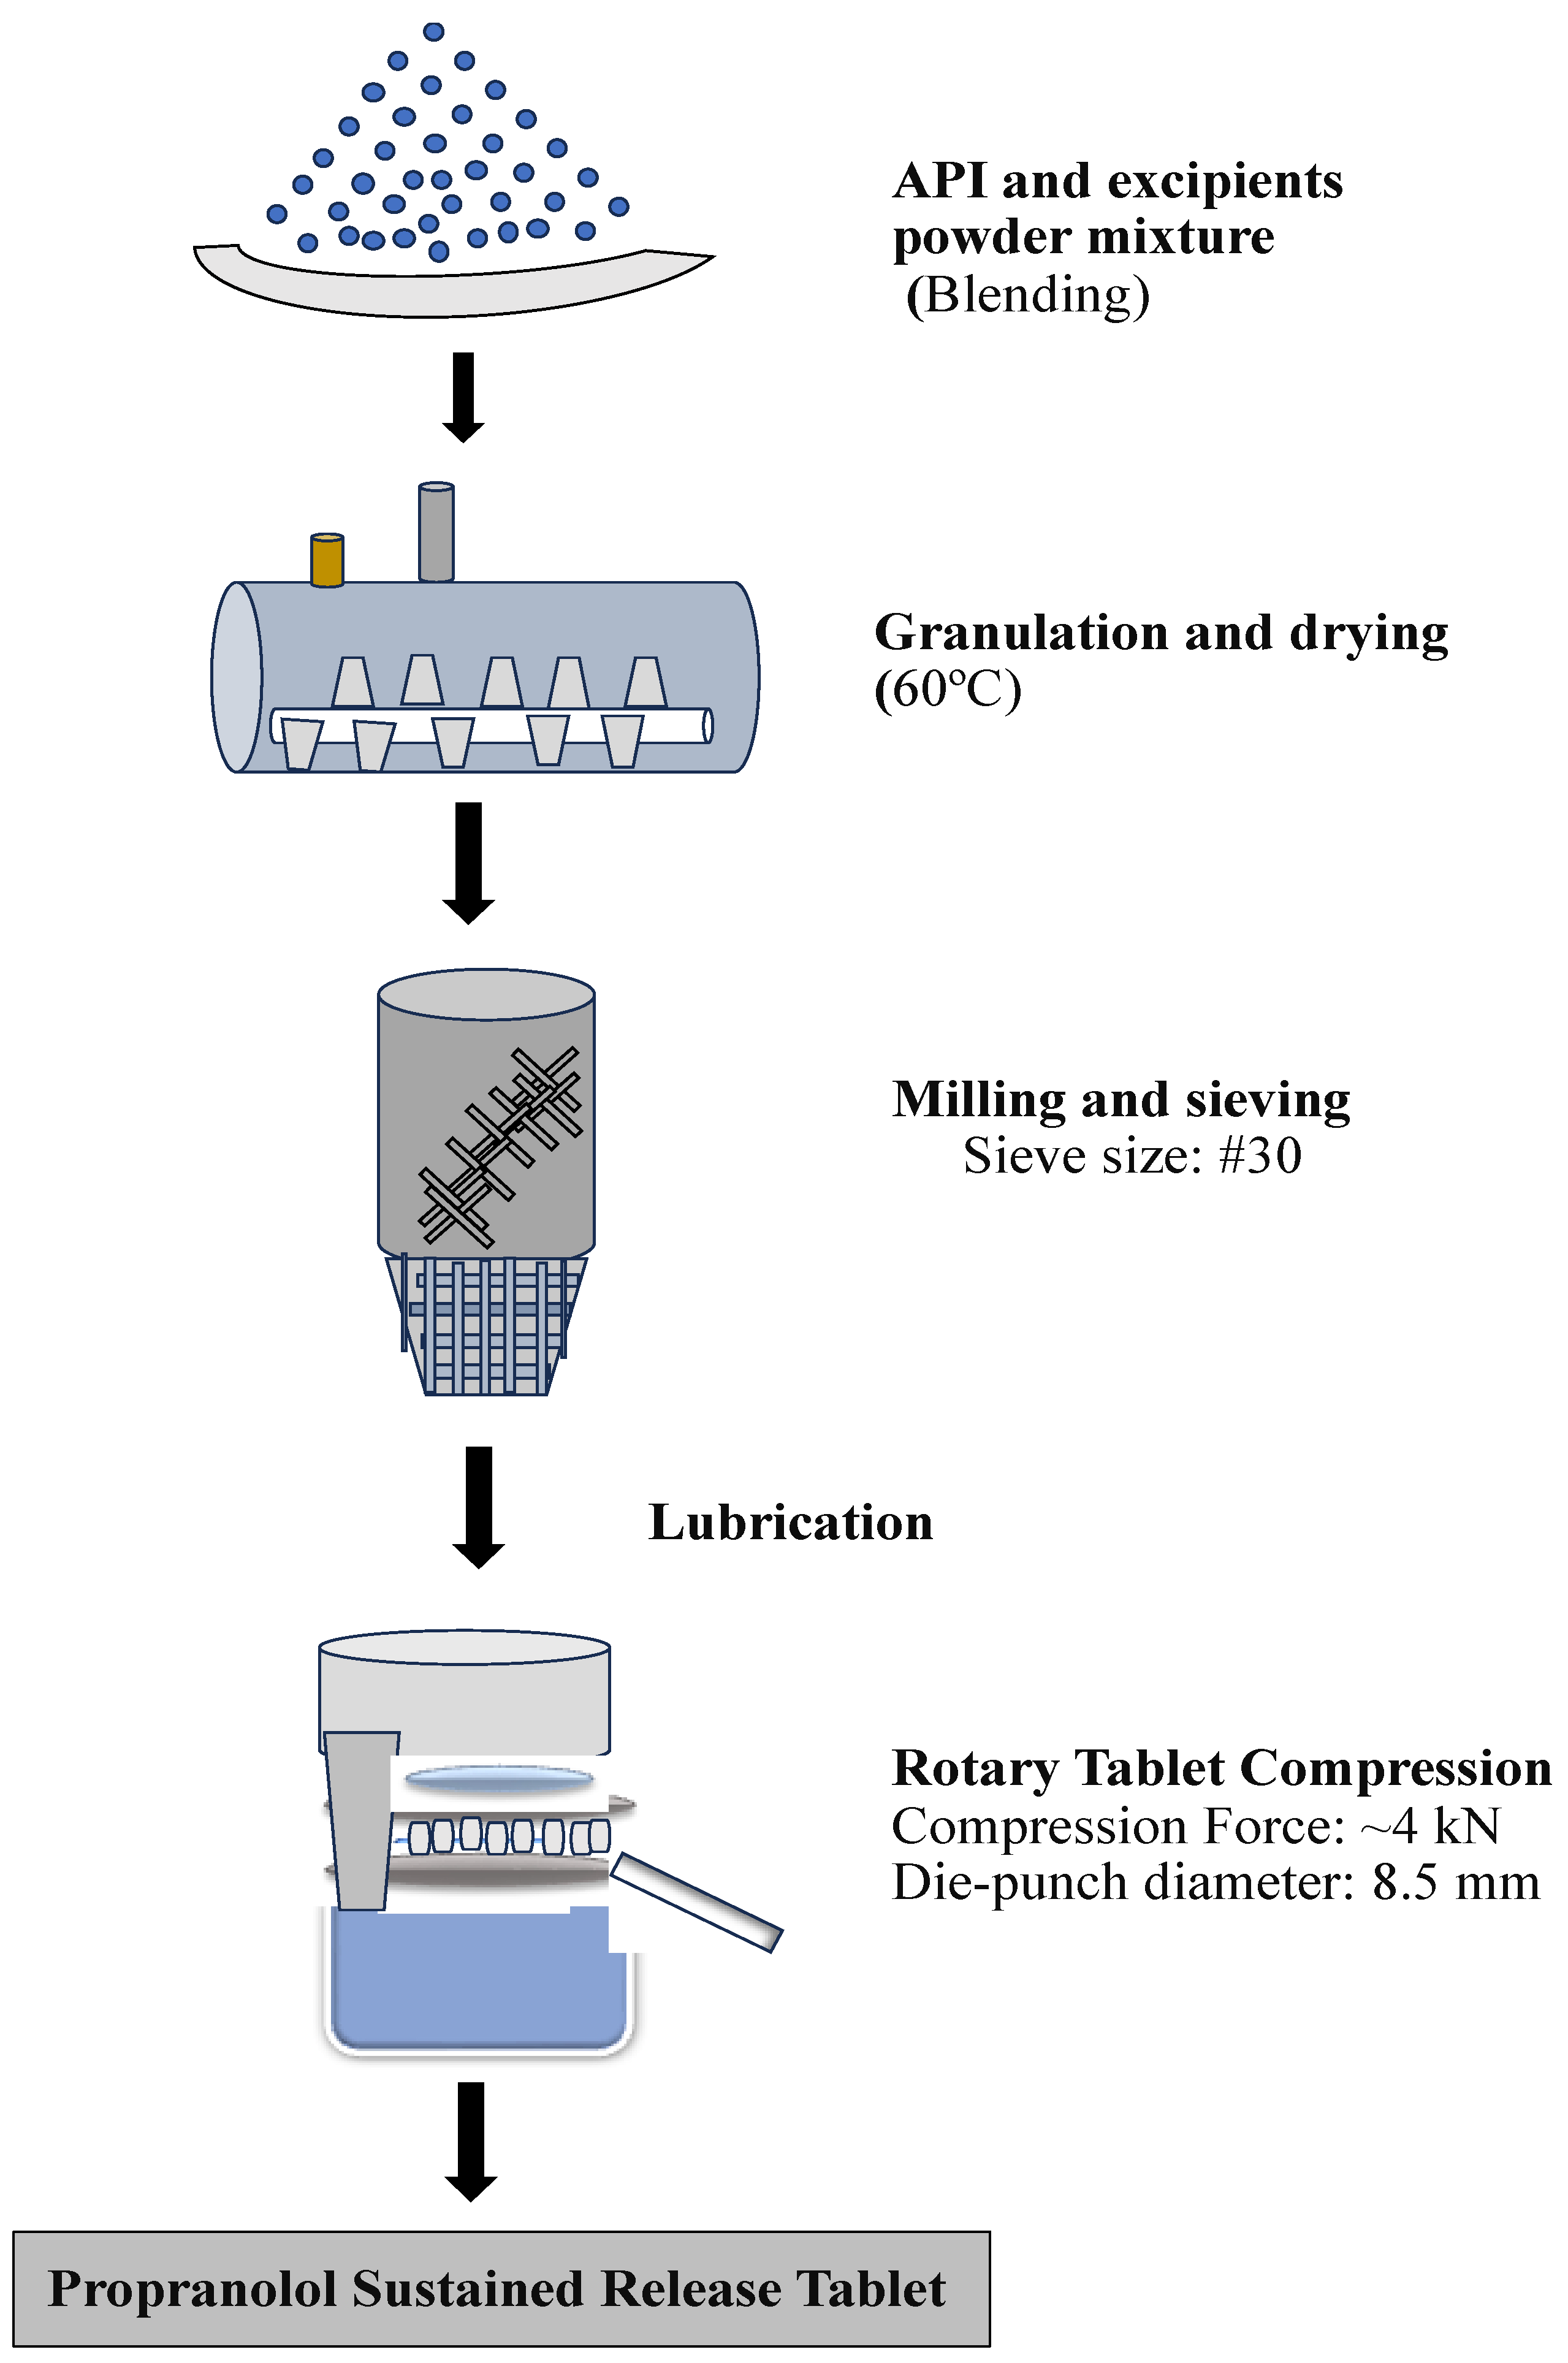
2.4. Formulation of Sustained-Release Matrix Tablets

A total of 9 different formulations were developed by altering the weight ratio of PPH and excipients (Table 1). HPMC K 100 M was used as the hydrophilic cellulose-based polymer in different concentrations, and ethyl cellulose (EC) was used as the hydrophobic polymer at different concentrations. All the formulation ingredients (physical mixtures) were weighed accurately, blended for 15 min in a Conta blender (Mumbai, India), and analyzed for the pre-compression properties before proceeding to the compression step. In the wet granulation method, PPH and excipients (either HPMC K100M or EC or both) and MCC used as filler were granulated using PVP K30 in water as a binding solution, and the obtained granules were dried in a tray drier at 60 °C. Finally, the dried granules were milled and sieved using #30 sieves, and then, lubrication was carried out by the addition of 2% w/w magnesium stearate (MgSt) and 1% w/w aerosil [27]. The final blend was blended for an extra 5 min. The final blend powder was compressed at ~4 kN compression force using a rotary tablet machine (Eliza Press model no. EP-200L, McKeesport, PA, USA) with an 8.5 mm round-faced die-punch set. The total weight of each tablet was kept at 200 mg. The composition in terms of mass fraction (% w/w) of drug and excipients used in the nine different formulations is given in Table 1, and the process flow diagram is shown in Figure 1.

2.5. Physical Characterization

2.5.1. Visual Inspection

The prepared PPH-SR 40 mg matrix tablets were evaluated visually for any visual defects in integrity, shape, or color, as per the method mentioned by [28].

2.5.2. Weight Variation Studies

The core tablets were evaluated for size, including length (L) and thickness (T), using a Vernier caliper. For the weight variation test, twenty compressed tablets were randomly selected and weighed individually to evaluate the uniformity in weight. Individual tablet weights and average weights were compared. If no more than two tablets fall outside the percentage restriction (7.5% deviation from actual weight as per USP) and none of the tablets differ by more than double the percent limit, the tablet passes the weight variation test [29].
The percentage weight variation was calculated by using the following equations:
M a x i m u m   d e v i a t i o n = M a x i m u m   W e i g h t A v e r a g e   w e i g h t A v e r a g e   w e i g h t × 100
M i n i m u m   d e v i a t i o n = M i n i m u m   w e i g h t A v e r a g e   w e i g h t A v e r a g e   w e i g h t × 100

2.5.3. Friability Test

Friability is expressed as the % loss in weight of a specified quantity of tablets when subjected to mechanical shock or attrition in a suitably designed apparatus. The test was conducted using a friability test apparatus (friability tester, Campbell electronics, model: FTA-20N, Mumbai, India) at 25 rpm for 100 revolutions. As the average weight of the PPH (40 mg) SR tablets was 200 mg, which is less than or equal to 650 mg, a tablet weight equivalent of 6.5 g was used for friability testing. The weight was noted before and after the operation of the friability apparatus, and the % friability was calculated. The friability of tablets was less than 1%, which was considered acceptable [30].
Friability % = Loss of weight/Initial weight × 100

2.5.4. Hardness Test

The strength of a tablet is determined by its hardness. An Electrolab digital hardness tester (EBT-2PRL—Electrolab hardness tester, model: EBT-2PRL, Mumbai, India) was used to determine the tablet’s hardness (n = 10 tablets). The hardness was measured in terms of Kilopond (KP). The mean average hardness and standard deviation were calculated [31].

2.6. Drug Content

The drug content in the compressed tablets was determined using the high-performance liquid chromatography (HPLC) method described below. Phosphate buffer pH 6.8 was prepared by dissolving 6.8 g of monobasic potassium phosphate in 1000 mL of water in a volumetric flask. The mobile phase was prepared using acetonitrile and buffer in a 35:65 (% v/v), while the diluent was prepared using a mix of acetonitrile and water in the same ratio. The standard stock solution was prepared by weighing 20 mg of PPH standard in 60 mL methanol to prepare a 200 μg/mL concentration stock solution, and further dilutions were made using methanol to develop a 6-point calibration plot. The tablet assay was carried out by crushing 10 tablets into a fine powder, which was then dissolved into the methanol using a magnetic stirrer. The solution was then allowed for 16 h, followed by sonication to complete the solubilization of the drug content in methanol. The clear supernatant was saved for further use. The content of PPH per tablet was calculated using the equation below:
S a m p l e   A r e a S t a n d a r d   A r e a × S t a n d a r d   W e i g h t   ( g ) S a m p l e   W e i g h t   g × D F × S t a n d a r d   P o t e n c y 100 × A v e r a g e   w e i g h t
The acceptance criteria of drug content in SR matrix tablets are 90–110% (as per the USP test method for PHP-ER capsules).

2.7. In Vitro Drug Release

An in vitro drug release study was performed to estimate the quantity of PPH released from each formulation at different time intervals, as per the method given by Badshah et al. 2011 (Badshah et al. [32]). Six tablets from each formulation batch were placed in each USP type 1 dissolution apparatus (Vankel VK7000, Agilent Technologies, Santa Clara, CA, USA). Acid stage and buffer stage dissolution medium were prepared, and the release pattern of the drug was assessed at 37 ± 0.5 °C with a rotating speed of 100 rpm. The 10 mL sample from each dissolution paddle apparatus was collected at different time points like 1.5 h (T1) in the acid stage and 4 h (i.e., 1.5 h acid stage + 2.5 h buffer stage), 8 h, 14 h, and 24 h, and an equal amount of dissolution medium was used for replacement. All the samples were passed through 10 μm pore size filters, and a working standard of PPH was prepared for the standard curve. The amount of drug released was determined using a UV spectrophotometer (UV-1800; Shimadzu, Kyoto, Japan) at λ = 320 nm, using a 1 cm cell and water as the blank. To understand the drug release mechanism of the manufactured tablets, we calculated the correlation coefficient (R2) using various mathematical models such as zero-order and first-order, Hixson–Crowell, Higuchi, and Korsmeyer–Peppas models.

2.8. Comparative Dissolution Profile Study

The comparative dissolution profile was studied using a dissimilarity factor (f1) and a similarity factor (f2). The desired value for the similarity factor (f2) is not less than 50, and the desired dissimilarity factor (f2) value is not more than 10.

3. Results

PPH is a highly water-soluble (BCS Class I) drug. Previous studies have shown that drug release is affected by the types of polymers used in the formulation and their compositions [18,32]. This study used one hydrophilic and one hydrophobic polymer to control the drug release from the tablet matrix. HPMC K100M is a high-viscosity grade cellulose-based hydrophilic polymer. At the same time, EC is a hydrophobic polymer, and due to its inherently different nature, the use of appropriate amounts of these two polymers is supposed to deliver the desired release behavior. Other excipients used to formulate the SR tablet are PVP-K30, which was used as a binder; MCC PH101 as a filler; a low amount of MgSt, which was used as a lubricant; and colloidal silicon dioxide (i.e., Aerosil) as a glidant to improve the flow property of the blend and aid the targetability.
A total of nine different formulations (F1 to F9) were prepared. Formulations F1 to F3 contained hydrophilic polymer HPMC K100M in the concentrations of 15%, 25%, and 30% (w/w), respectively, whereas formulations F4 to F6 contained only hydrophobic polymer EC in the concentrations of 10%, 20%, and 30% (w/w), respectively. Lastly, formulations F7 to F9 contained a mixture of HPMC K 100M and EC at varying weight ratios (Table 1).

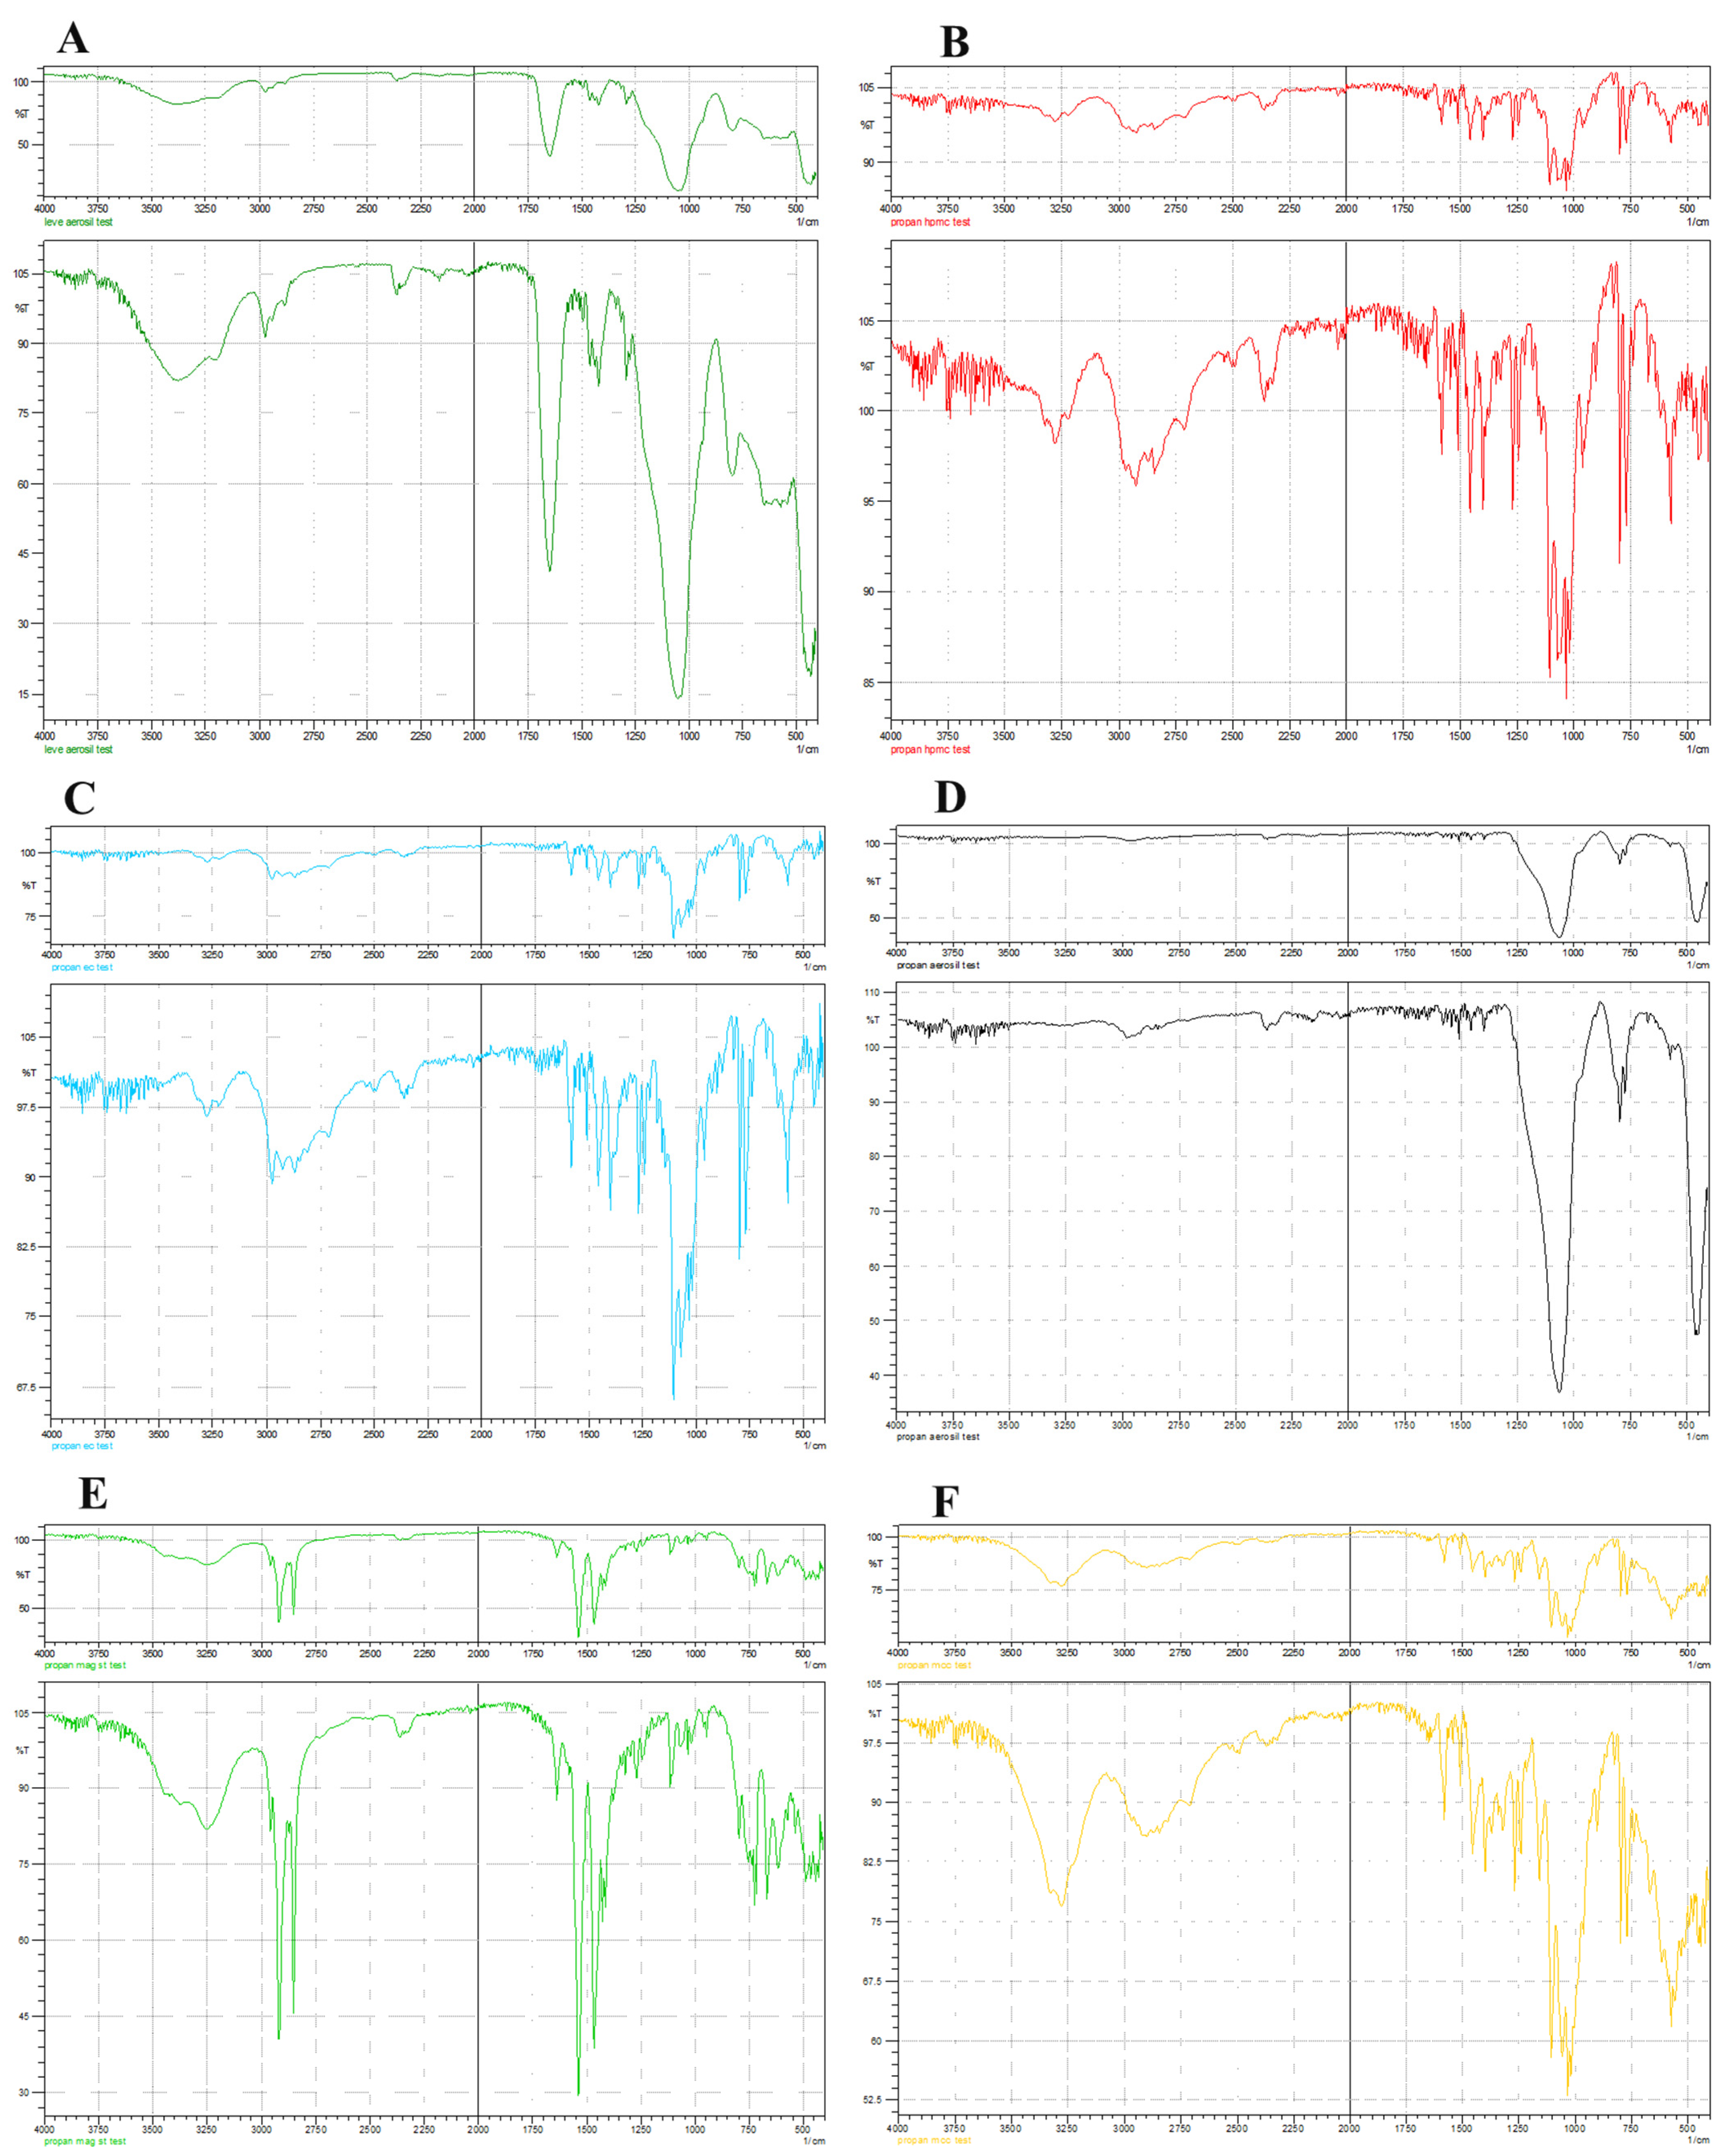
3.1. Drug–Excipient Compatibility Study

The FT-IR spectroscopic study showed no physical interaction between the drug and drug–excipient combinations. The spectrum of drug (PPH) alone, PPH-HPMC, PPH-EC, PPH-MCC, PPH-PVP-K30, and PPH-MgSt at controlled and after the 1 month of accelerated storage condition were compared to find any change in the frequency of the drug excipient with that of the drug. The IR spectrum shows various modes of vibration for mono-substituted naphthalene. The C-C ring stretching vibration of naphthalene is identified in the range between 1266 and 1615 cm−1, and the C-H in-plane bending mode vibration of the naphthalene is identified in the 810–1245 cm−1 range. Similarly, the C-H out-of-plane blending vibration mode is identified in the range of 860–965 cm−1, CH3 symmetric and asymmetric vibration modes are found to occur at 2878 cm−1 and 2969 cm−1, respectively, and CH2 asymmetric stretching is found to occur at 2928 cm−1. Other vibrations include C-O stretching, which occurs at about 1159 cm−1, C-N stretching at 1186 cm−1, and N-H and O-H stretching at 3359 cm−1 and 3295 cm−1, respectively. The IR spectrum of PPH alone and the combination of PPH and polymers are given in Figure 2, and they show intact spectra of PPH, meaning that no interaction occurred between drug excipients used in this study. Our results of the compatibility study aligned with the study of Sahoo et al., 2008, which highlighted the compatibility study of PPH with HPMC K15M and other excipients using FT-IR and differential scanning calorimetry (DSC) and showed that there was no well-defined chemical interaction between PPH with HPMC K15M and other excipients used in the study [33].

3.2. Pre-Compression Analysis of Granules

The results of the pre-compression analysis of all the formulations, including the angle of repose, Carr’s index (CI), and Hausner ratio (HR), are given in Table 2. The flowability of formulations F1, F2, and F3 is excellent, as the value represented is below 30. Similarly, the flowability of the other six formulations is good, as the repose angle lies between 30 and 35. One of the primary reasons for the flow property of all the formulations to range between excellent and good is the wet granulation processing step used as a pre-formulation approach. Since most drugs possess inherently poor flowability and compressibility, wet granulation helps mitigate these issues and aids in drug uniformity by reducing particle segregation. In this study, PVP-K30 was used as a liquid binder to aid the wet granulation process. It is a versatile excipient that forms a strong adhesive bond between the drug’s individual particles and excipients, forming a cohesive granule. The mechanism of wet granulation and its associated advantages for the tableting process can be found in detail in prior articles by [34,35]. The results from the study of Muhammad et al. (2011) [36] showed that the uniformity of the drug content and the wet granulation technique enhanced the flow property of PPH granules used in that study. The findings of the previous investigation reported an angle of repose ranging from 23.5° to 28.5° and a CI between 18.5% and 22.8%, consistent with the results obtained in the present study [36].

3.3. Post-Compression Analysis of the Formulations

The result of the post-compressional analysis of the prepared formulations, including average weight, hardness, thickness, friability, and the assay, is given in Table 3. Since the flow property of granules was good, it resulted in less variation in the average tablet weight. Similarly, all the formulations’ friability, hardness, assay, and thickness are within the acceptable range.

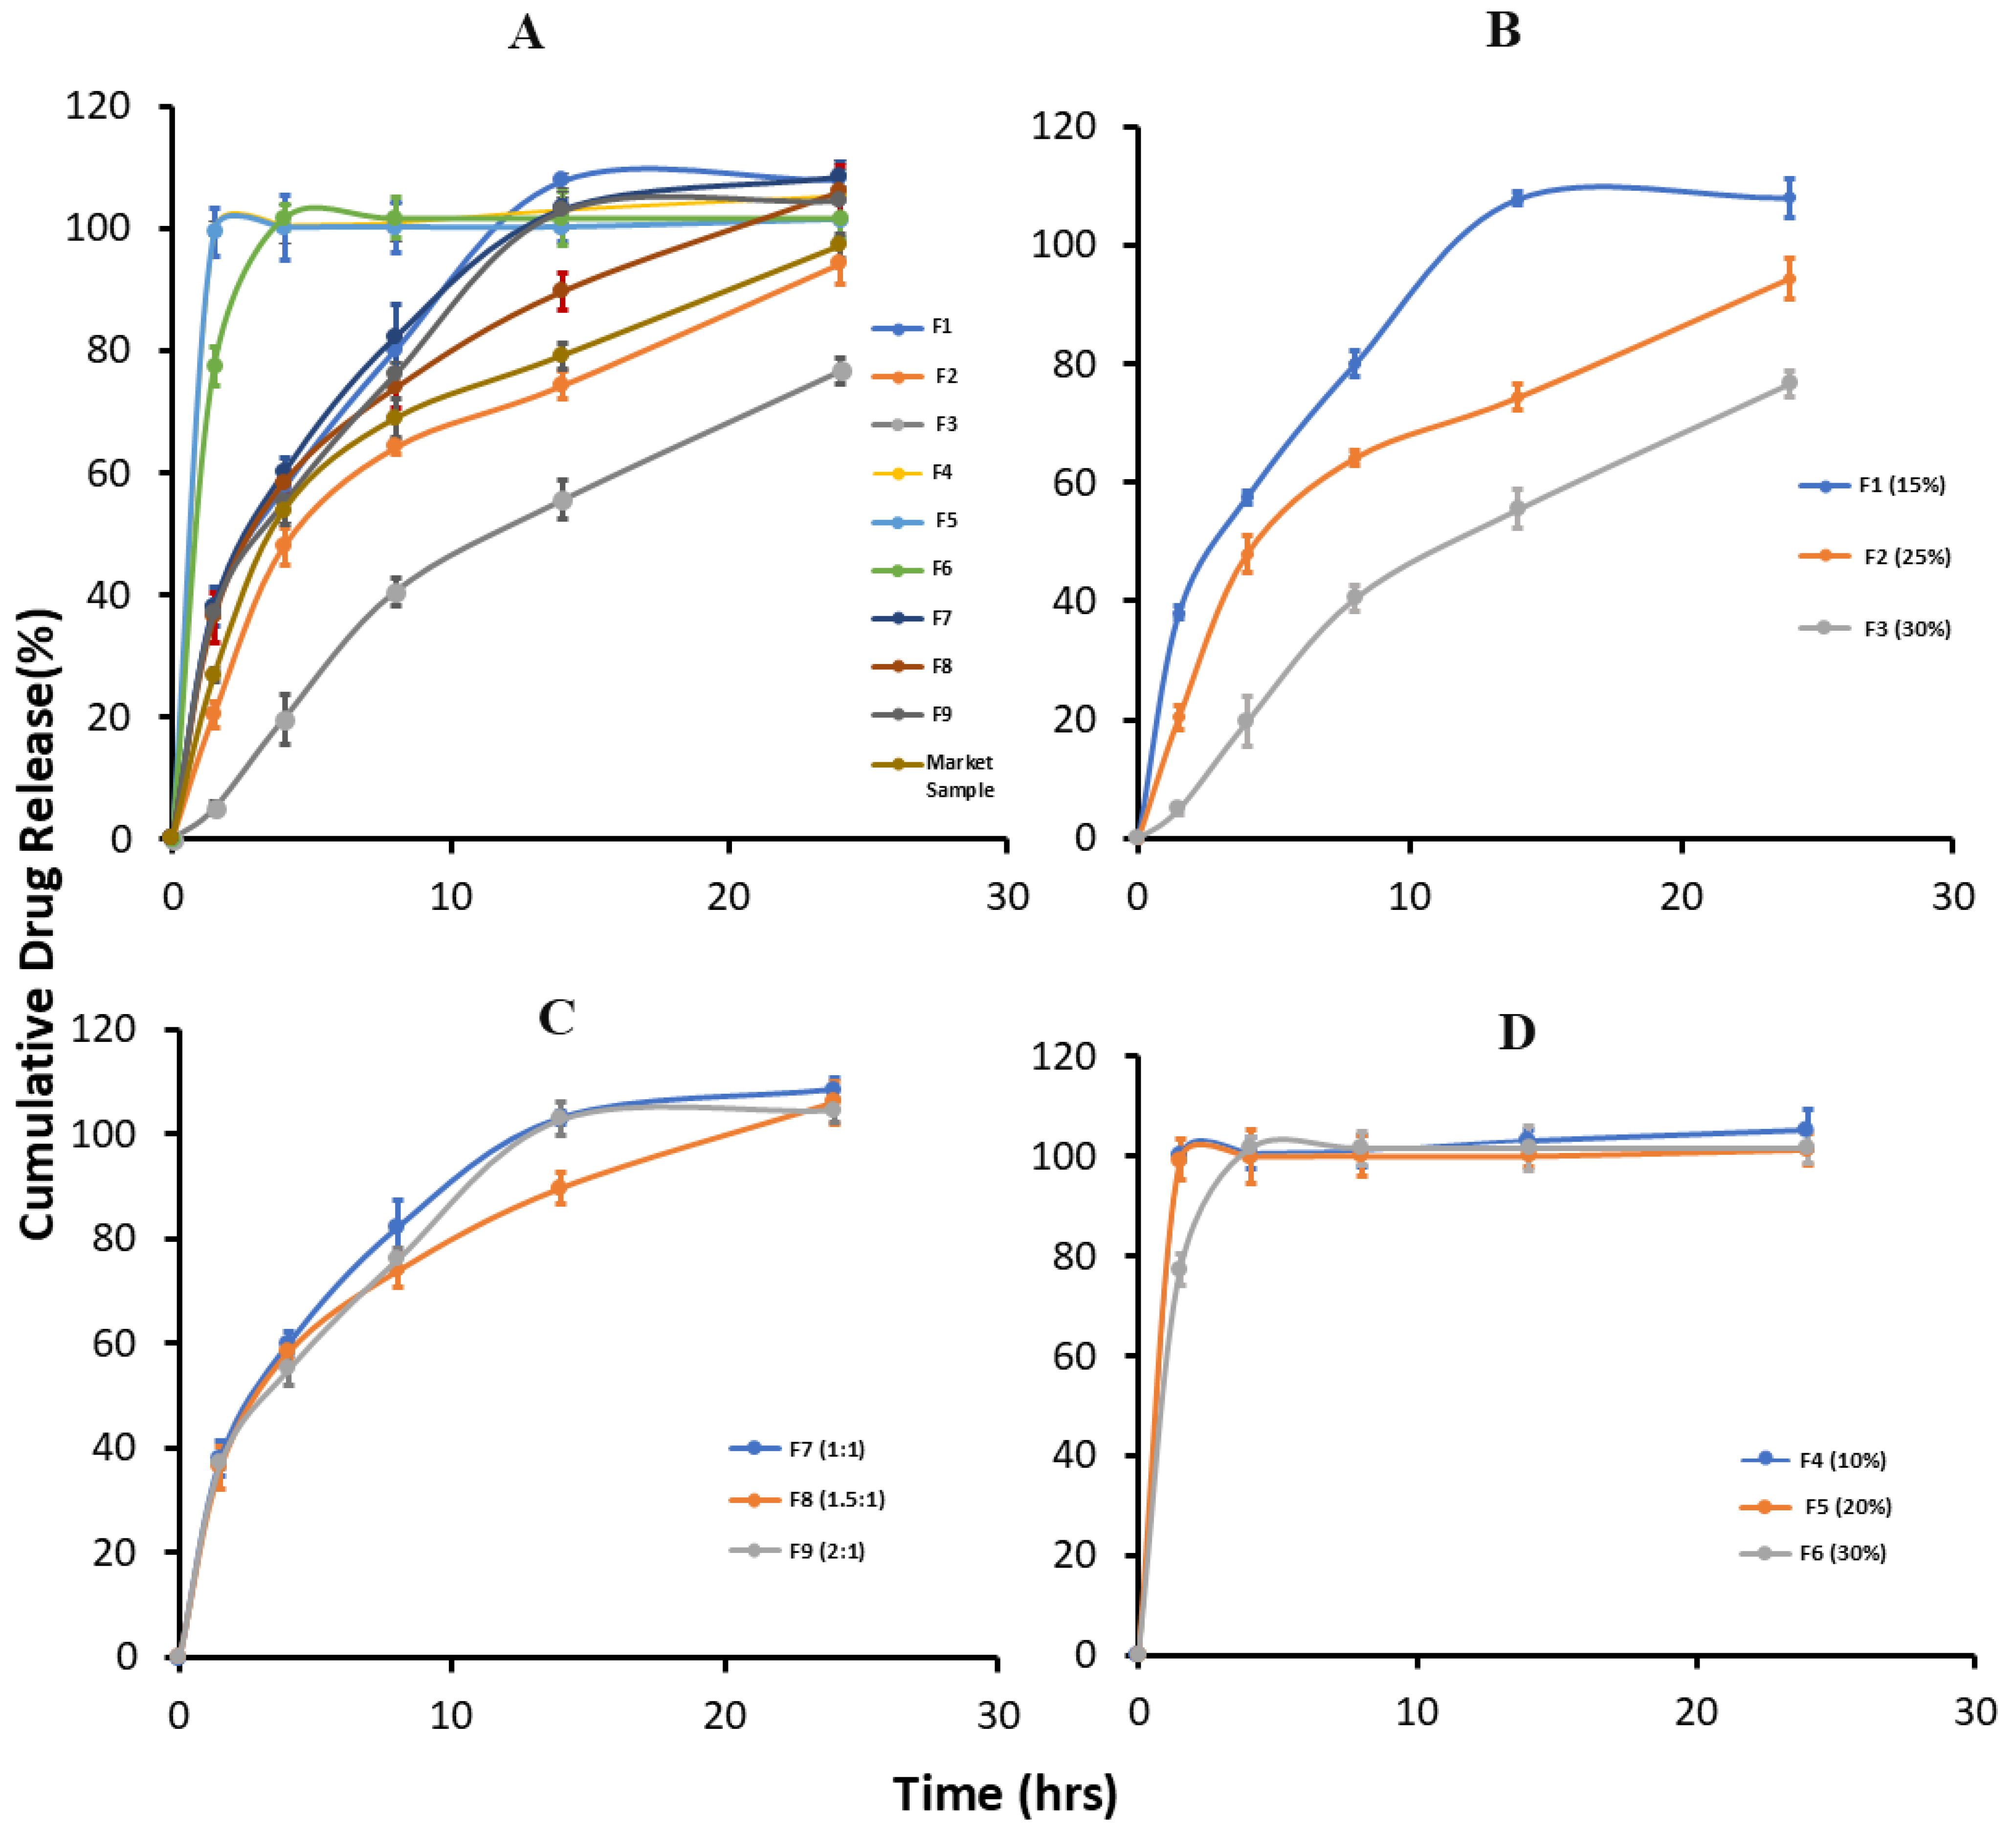
3.4. In Vitro Drug Release Study

The drug release study showed that the drug release rate was significantly retarded as the concentration of hydrophilic cellulose-based high-viscosity HPMC K100M polymer increased from 15% to 30%. The result of our study is parallel with the findings of Mohamed et al. [37]. The study showed that when the Mebeverine Hydrochloride was mixed with the polymer HPMC K100M in a 1:1 ratio as the highest polymer concentration used, the release of the drug was slowest among all prepared tablet formulations [37]. In our observation, in the first 1.5 h for the formulations F1, F2, and F3 containing 15%, 25%, and 30% of HPMC K100M, the cumulative dissolution rate was 38.02, 20.40, and 5.0%, respectively. Similarly, the release rates of the drug post 24 h for the first three formulations were 107.95, 94.30, and 76.67%, respectively. Additionally, for matrix tablets containing 10%, 20%, and 30% (F4, F5, and F6) of EC, it was observed that the tablet eroded within 1.5 h of the dissolution study. This suggests that the EC concentration was inadequate to establish a gelatinous layer around the tablet core (Figure 3). For the formulation containing a mixture of HPMC K100M and EC in the ratios of 1:1, 1.5:1, and 2:1 (formulations F7, F8, and F9), the initial release of the first 1.5 h was 38.01%, 36.30%, and 37.12%, respectively, which is much higher than that of the marketed formulation, i.e., 26.10%. This finding of our study coincides with the finding of Tiwari et al., 2003, which proved that the tablets of Tramadol hydrochloride prepared by mixing HPMC K100M and EC accelerate the rate of drug release from the controlled release formulations and fail to prolong the drug release beyond 10 h [38]. This may be due to the inability to control the initial burst release from the tablets by the combination of HPMC K100M and EC. Similarly, after 24 h, the drug release from formulations F7, F8, and F9 was much higher, i.e., 108.50%, 106.00%, and 104.52%, respectively, which was higher than the marketed sample at 97.10%. The cumulative drug release of the marketed sample in 1.5 h, 4 h, 8 h, 14 h, and 24 h was 26.10%, 53.80%, 68.80%, 79.10%, and 97.10%, respectively. It has been established that hydrophilic or water-soluble drugs are primarily released via diffusion from the HPMC-based matrix system, while the use of EC creates a hydrophobic system that prevents rapid matrix erosion, thereby alleviating burst drug release. In this study, we observed a similar trend and showed that HPMC K100M and EC are essential carriers in formulating PPM SR tablets, each playing a specific role in modulating the drug release rate. Upon contact with the dissolution media, HPMC K100M functions as a hydrophilic matrix-forming agent; first, it becomes hydrated and then forms a gel-like matrix layer, which limits the water-soluble PPH diffusion. A high viscosity grade of HPMC, such as K100M used in this study, induces stronger gel layers, resulting in a slower drug release. EC, on the other hand, acts as a hydrophobic matrix-forming agent while remaining water-insoluble. It helps to keep the tablet intact for a longer duration and alleviates the burst drug release phenomenon. The drug release is primarily governed by diffusion from this two-matrix system, and using different ratios in this study allows for fine-tuning of the PPH release rate.
On evaluation, formulation F2 containing 25% of HPMC K100M closely resembled the drug release profile with the marketed sample, as its similarity factor (f2) is sixty-four and the dissimilarity factor (f1) is eight. Thus, it was considered the optimal batch, and the release kinetics of this batch was further studied. This output coincides with the findings of the study by Anirbandeep et al., 2013 [39]. The study revealed that itopride hydrochloride in the presence of HPMC K100M and polyvinylpyrrolidone (PVP) as polymer and lactose as filler sustained the drug release for more than 12 h [39].
The drug release rate from each formulation at different time intervals is shown in Table 4, and the drug release profiles are represented in Figure 3.

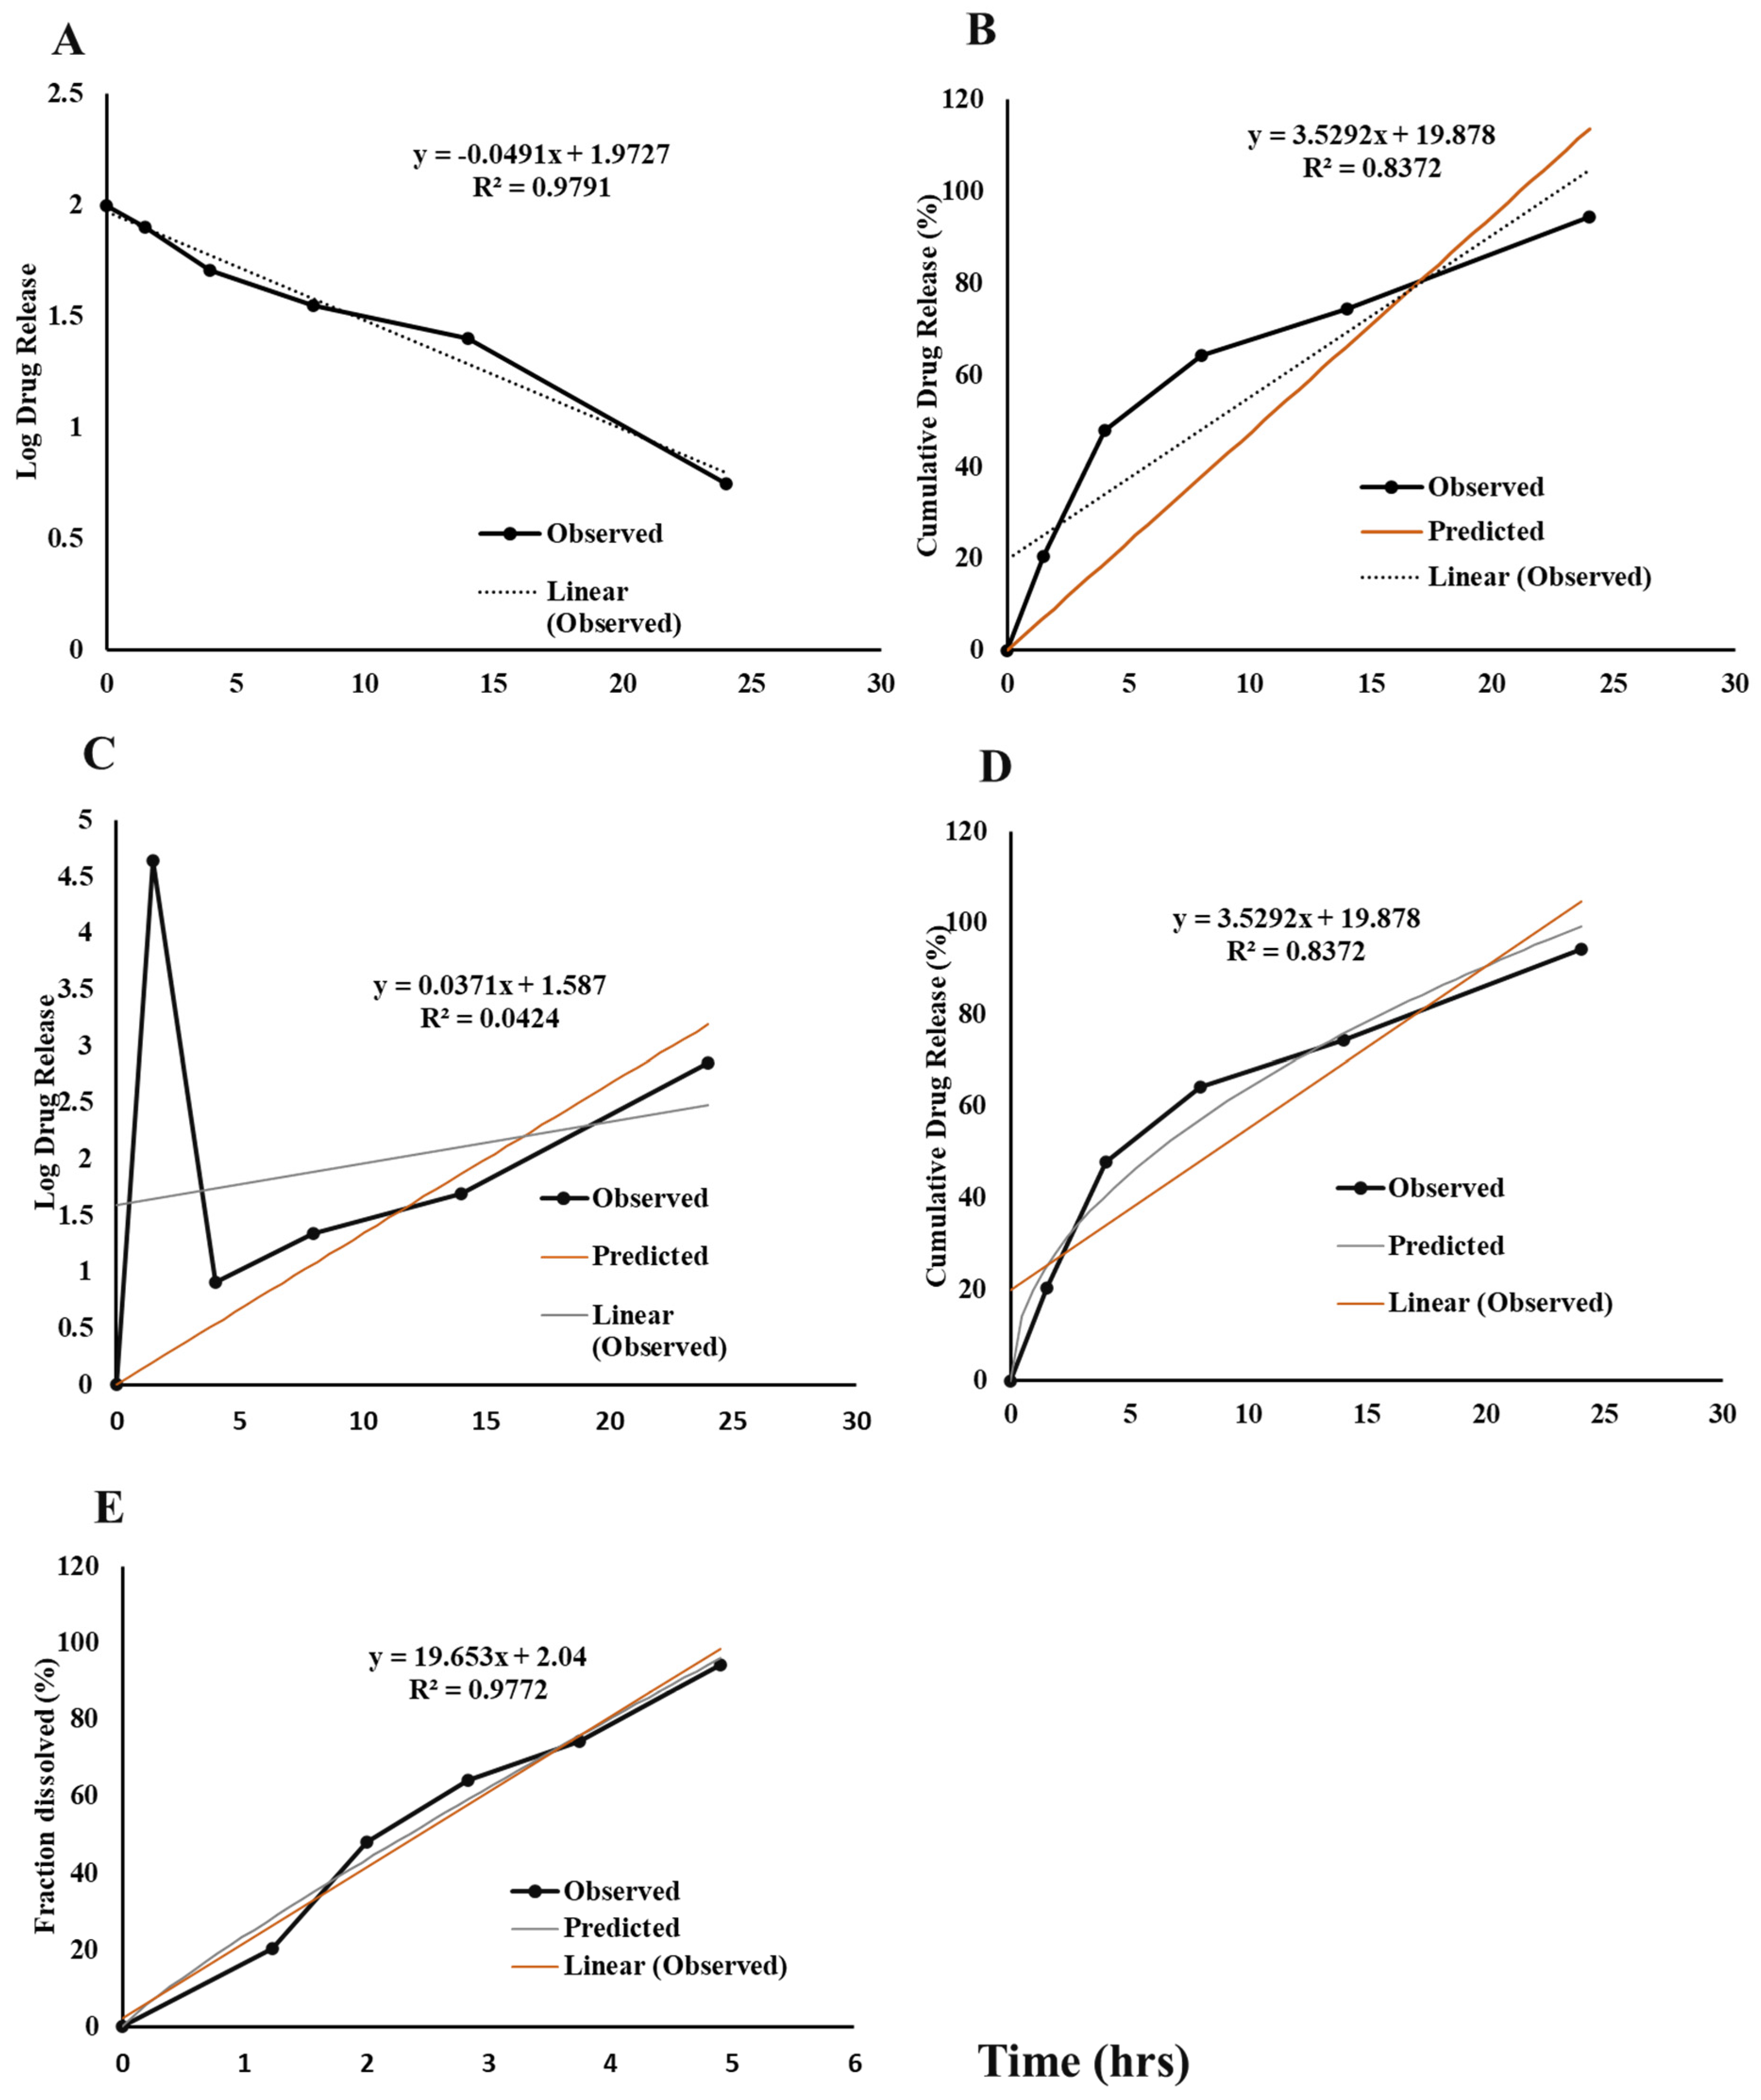
3.5. In Vitro Drug Release Kinetic Study

Five release models, including the zero order, first order, Higuchi, Hixson–Crowell, and Korsmeyer–Peppas equations, were fitted to the dissolution data set to comprehensively characterize the drug release mechanisms from the tablets, as each model describes different kinetic behaviors, as shown in Figure 4. Zero-order kinetics indicate a constant release rate, while first-order kinetics reflect a concentration-dependent release. Higuchi models offer insights into diffusion-controlled release; Hixson–Crowell addresses variations in surface area and particle size; and Korsmeyer–Peppas assesses anomalous release mechanisms through an exponent (n). Regression analysis was performed in each case. The linear regression indices, including slope, intercept, and regression coefficient, were calculated using Microsoft Excel 2010, using the DDsolver plugin. Certain models demonstrate good fit when their foundational assumptions correspond with the actual drug release process. For instance, the Korsmeyer–Peppas model is appropriate when drug release involves both diffusion and erosion mechanisms. On the other hand, models that fit poorly indicate that their mechanisms are less applicable to a specific formulation. Our results indicate that the release of PPH from the formulated sustained-release tablets is primarily concentration-dependent and diffusion-controlled, as evidenced by a strong correlation with first-order release kinetics and Korsmeyer–Peppas models. This supports the design of a sustained-release system utilizing both the hydrophilic and hydrophobic polymers to effectively modulate drug diffusion.
HPMC is a hydrophilic, swellable, and soluble polymer. The drug release mechanism from HPMC has multiple steps, which can be summarized as water imbibition, swelling, and polymer erosion, during which the drug is released by dissolution, followed by diffusion [40]. In this study, the tablet was compressed into a biconvex round shape, 8.5 mm in diameter. After water imbibition and swelling, biconvex, round tablets tend to become spherical. During this time, being a soluble polymer, HPMC dissolves/erodes in the medium, decreasing the size of the swelled tablet. In the Higuchi model, the dissolution medium penetrates the matrix through pores, fissures, and intergranular spaces, dissolving the solid drug and then releasing it through diffusion through these solvent-filled pores [41]. Also, the value of n is 0.883 (0.5 < n < 1) in the Korsmeyer model (R2 = 0.977), which indicates the release to be non-Fickian or anomalous transport, where the mechanism of drug release is governed by diffusion and swelling, which can also be correlated with the swelling effect of HPMC. However, it found a poor fit in the zero-order, Hixson–Crowell, and Higuchi models, with R2 values of 0.837, 0.042, and 0.83, respectively.

3.6. Comparative Dissolution Profile Study

The accepted range for the similarity factor (f2) is not less than 50, and the accepted range for the dissimilarity factor (f1) value is not more than 10. The result shows that only formulation F2 has similarity and dissimilarity factors within the range. These factors are typically derived using established formulas [42]: f2 is calculated based on the squared differences between the two profiles at various time points, providing a value between 0 and 100, with values above 50 indicating similarity and values below 10 supporting dissimilarity. Similarly, f1 measures the percentage difference at each time point. The study indicates that only formulation F2 has an f2 value of 64 (above 50) and an f1 value of 8 (below 10), suggesting its dissolution profile closely resembles the marketed product. Thus, formulation F2 is considered an optimal formulation. Also, we can say there is no dissimilarity between the expected and test dissolution results. The values of f1 and f2 of all the formulations are listed in Table 5.

4. Discussion

The formulation of cellulose-based SR matrix tablets for PPH signifies a noteworthy advancement in pharmaceutical drug delivery systems to improve therapeutic adherence and efficacy. PPH, a well-characterized nonselective β-adrenergic receptor antagonist, is extensively utilized in the treatment of cardiovascular disorders such as hypertension, angina pectoris, and cardiac arrhythmias due to its high binding affinity for both β1- and β2-adrenergic receptors, while it exhibits comparatively lower affinity toward β3-receptors [43]. The design of an SR system for PPH is of clinical importance, as it facilitates the maintenance of prolonged plasma drug concentrations, thereby minimizing dosing frequency, enhancing patient compliance, and potentially improving clinical outcomes [44]. Sustained-release modalities are recognized for attenuating peak–trough fluctuations in plasma drug levels, ensuring a more consistent pharmacokinetic profile. In this study, integrating the cellulose-based hydrophilic polymer HPMC K100M with the hydrophobic matrix former EC is judiciously employed to modulate drug release kinetics. This dual-polymer approach enables the establishment of a controlled-release matrix system that sustains therapeutic drug levels and mitigates adverse effects associated with peak plasma concentrations [45]. The formulation aligns with contemporary pharmaceutical research that underscores the critical role of advanced drug delivery design in maximizing therapeutic performance and patient-centric outcomes.
Moreover, our findings indicate that formulation F2 achieved the most favorable drug release profile among the tested formulations, releasing approximately 94.3% of PPH over 24 h. This aligns with previous studies that demonstrated similar release behaviors using HPMC combined with hydrophobic agents to extend drug release duration [46]. The results from the comparative dissolution profile analysis indicated a significant correlation with the marketed formulation, further validating the reliability of our developed system. Such efficacy is critical in chronic disease management, where fluctuations in drug levels can lead to adverse effects or therapeutic failures. The use of polymers in controlling drug release rates is well-documented, with hydrophilic matrices often exhibiting a superior ability to modulate drug diffusion compared to their hydrophobic counterparts [47]. Our results substantiate these findings, confirming that the balanced use of hydrophilic and hydrophobic polymers can optimize drug release profiles in sustained-release tablet formulations.
Finally, the clinical implications of our study suggest that the developed SR matrix tablets for PPH could significantly improve treatment adherence and overall patient outcomes. Given that many patients struggle with the complexities of multiple dosing schedules, a formulation that provides sustained therapeutic levels with a single daily dose is particularly advantageous. Future research must focus on in vivo studies to further validate this study’s pharmacokinetic profiles and establish the formulations’ efficacy in real-world clinical scenarios. Concurrently, long-term stability and in vivo studies are essential to ensure that the formulation is stable over extended period and can show similar in vitro SR characteristics in in vivo models, which is critical for its potential commercial usages. The groundwork laid by this research paves the way for innovative approaches in drug formulation, emphasizing the need for extensive studies to explore other polymers and excipients that may further enhance drug release and patient outcomes. Continued investigation will be necessary to translate these promising in vitro findings into clinical practice.

5. Conclusions

In conclusion, the development of cellulose-based sustained-release matrix tablets for PPH has demonstrated significant potential in improving patient adherence and therapeutic outcomes, as evidenced by the compelling results from formulation F2. This formulation effectively combined hydrophilic HPMC K100M and hydrophobic ethyl cellulose, showcasing superior mechanical properties and a sustained-release profile with 94.3% drug release over 24 h. The favorable similarity factor (f2) of 64 compared to marketed formulations, along with its reliable release kinetics fitting the Korsmeyer–Peppas model (R2 = 0.977), highlights the efficacy of the dual polymer approach in modulating drug release. These results align with our objective of enhancing the therapeutic efficacy of PPH and affirm the broader relevance of innovative formulation strategies in addressing the challenges of chronic disease management. Further, in vivo studies will be essential to validate these promising in vitro findings and facilitate the transition of this formulation into clinical practice.

Author Contributions

Conceptualization, A.K., A.K.S. and S.S.; methodology: A.K., B.R.G., A.K.S. and S.S.; formal analysis, A.K., S.S. and A.K.S.; investigation: A.K., B.R.G. and R.B.; data curation, A.K., S.S., A.K.S. and R.B.; writing—original draft: B.R.G. and R.B.; writing—review and editing: R.B. and B.R.G.; supervision and project administration: A.K.S. and S.S. All authors have read and agreed to the published version of the manuscript.

Funding

This research was supported by the Department of Pharmacy, School of Science, Kathmandu University, Dhulikhel, Nepal.

Data Availability Statement

The data supporting this study’s findings are available from the corresponding author upon reasonable request.

Acknowledgments

The author wants to thank QbD Pharmaceuticals Pvt. Ltd. Sanga, Banepa -14, Kavre, Nepal, for providing excipients like HPMC K100M, EC, microcrystalline cellulose (MCC PH 101), polyvinylpyrrolidone (PVP K 30), colloidal silicon dioxide (Aerosil), magnesium stearate (MgSt), and the model drug, PPH, as a generous gift.

Conflicts of Interest

The authors declare that they have no competing interests.

Abbreviations

The following abbreviations are used in this manuscript:
ECEthylcellulose
HPMCHydroxypropyl methylcellulose
SRSustained Release
FT-IRFourier transform infrared spectroscopy
MCCMicrocrystalline cellulose
DbBulk density
DtTapped density
USPUnited State Pharmacopeia
HPLCHigh-performance liquid chromatography
PVPPolyvinyl pyrrolidone
APIActive Pharmaceutical Ingredient
DSCDifferential scanning calorimetry
CICarr’s index
HRHausner ratio

References

  1. Stritzke, A.; Kabra, N.; Kaur, S.; Robertson, H.; Lodha, A. Oral propranolol in prevention of severe retinopathy of prematurity: A systematic review and meta-analysis. J. Perinatol. 2019, 39, 1584–1594. [Google Scholar] [CrossRef] [PubMed]
  2. Propranolol Hydrochloride. Available online: https://go.drugbank.com/salts/DBSALT000549 (accessed on 5 March 2025).
  3. Lampert, R.; Ickovics, J.R.; Viscoli, C.J.; Horwitz, R.I.; Lee, F.A. Effects of propranolol on recovery of heart rate variability following acute myocardial infarction and relation to outcome in the Beta-Blocker Heart Attack Trial. Am. J. Cardiol. 2003, 91, 137–142. [Google Scholar] [CrossRef] [PubMed]
  4. Williams, F.N.; Herndon, D.N.; Kulp, G.A.; Jeschke, M.G. Propranolol decreases cardiac work in a dose-dependent manner in severely burned children. Surgery 2011, 149, 231–239. [Google Scholar] [CrossRef] [PubMed]
  5. Ji, Y.; Chen, S.; Wang, Q.; Xiang, B.; Xu, Z.; Zhong, L.; Yang, K.; Lu, G.; Qiu, L. Intolerable side effects during propranolol therapy for infantile hemangioma: Frequency, risk factors and management. Sci. Rep. 2018, 8, 4264. [Google Scholar] [CrossRef]
  6. Acharya, P.; Baral, R.; Manandhar, S.; Shahi, P.; Gurung, B. Formulation and In-vitro Characterization of Fluoxetine Hydrochloride Loaded Fast Dissolving Oral Film Using HPMC 15CPS and HPMC K4M. J. Pharm. Drug Dev. 2021, 8, 101. [Google Scholar]
  7. Martinez, M.; Rathbone, M.; Burgess, D.; Huynh, M. In vitro and in vivo considerations associated with parenteral sustained release products: A review based upon information presented and points expressed at the 2007 Controlled Release Society Annual Meeting. J. Control. Release 2008, 129, 79–87. [Google Scholar] [CrossRef]
  8. Dash, A.; Cudworth, G., II. Therapeutic applications of implantable drug delivery systems. J. Pharmacol. Toxicol. Methods 1998, 40, 1–12. [Google Scholar] [CrossRef]
  9. Shen, J.; Burgess, D. Accelerated in-vitro release testing methods for extended-release parenteral dosage forms. J. Pharm. Pharmacol. 2012, 64, 986–996. [Google Scholar] [CrossRef]
  10. Nashed, N.; Lam, M.; Nokhodchi, A. A comprehensive overview of extended-release oral dosage forms manufactured through hot melt extrusion and its combination with 3D printing. Int. J. Pharm. 2021, 596, 120237. [Google Scholar] [CrossRef]
  11. Robinson, J.; Eriksen, S. Theoretical formulation of sustained-release dosage forms. J. Pharm. Sci. 1966, 55, 1254–1263. [Google Scholar]
  12. Almeida, A.; Possemiers, S.; Boone, M.; De Beer, T.; Quinten, T.; Van Hoorebeke, L.; Remon, J.P.; Vervaet, C. Ethylene vinyl acetate as matrix for oral sustained release dosage forms produced via hot-melt extrusion. Eur. J. Pharm. Biopharm. 2011, 77, 297–305. [Google Scholar] [CrossRef] [PubMed]
  13. Tabasi, S.H.; Moolchandani, V.; Fahmy, R.; Hoag, S.W. Sustained release dosage forms dissolution behavior prediction: A study of matrix tablets using NIR spectroscopy. Int. J. Pharm. 2009, 382, 1–6. [Google Scholar] [CrossRef]
  14. Körner, A.; Piculell, L.; Iselau, F.; Wittgren, B.; Larsson, A. Influence of different polymer types on the overall release mechanism in hydrophilic matrix tablets. Molecules 2009, 14, 2699–2716. [Google Scholar] [CrossRef] [PubMed]
  15. Viridén, A.; Wittgren, B.; Andersson, T.; Larsson, A. The effect of chemical heterogeneity of HPMC on polymer release from matrix tablets. Eur. J. Pharm. Sci. 2009, 36, 392–400. [Google Scholar] [CrossRef]
  16. Giri, B.R.; Maniruzzaman, M. Fabrication of Sustained-Release Dosages Using Powder-Based Three-Dimensional (3D) Printing Technology. AAPS PharmSciTech 2022, 24, 4. [Google Scholar] [CrossRef]
  17. Giri, B.R.; Kwon, J.; Vo, A.Q.; Bhagurkar, A.M.; Bandari, S.; Kim, D.W. Hot-melt extruded amorphous solid dispersion for solubility, stability, and bioavailability enhancement of telmisartan. Pharmaceuticals 2021, 14, 73. [Google Scholar] [CrossRef]
  18. Pearnchob, N.; Siepmann, J.; Bodmeier, R. Pharmaceutical applications of shellac: Moisture-protective and taste-masking coatings and extended-release matrix tablets. Drug Dev. Ind. Pharm. 2003, 29, 925–938. [Google Scholar] [CrossRef] [PubMed]
  19. Giri, B.R.; Poudel, S.; Kim, D.W. Cellulose and its derivatives for application in 3D printing of pharmaceuticals. J. Pharm. Investig. 2021, 51, 1–22. [Google Scholar] [CrossRef]
  20. Kwon, J.; Giri, B.R.; Song, E.S.; Bae, J.; Lee, J.; Kim, D.W. Spray-dried amorphous solid dispersions of atorvastatin calcium for improved supersaturation and oral bioavailability. Pharmaceutics 2019, 11, 461. [Google Scholar] [CrossRef]
  21. Viridén, A.; Wittgren, B.; Larsson, A. The consequence of the chemical composition of HPMC in matrix tablets on the release behavior of model drug substances having different solubility. Eur. J. Pharm. Biopharm. 2011, 77, 99–110. [Google Scholar] [CrossRef]
  22. Chavan, R.B.; Rathi, S.; Jyothi, V.G.S.; Shastri, N.R. Cellulose based polymers in development of amorphous solid dispersions. Asian J. Pharm. Sci. 2019, 14, 248–264. [Google Scholar] [CrossRef] [PubMed]
  23. Chen, Q.; Zuo, X.; Liang, H.; Zhu, T.; Zhong, Y.; Liu, J.; Nan, J. A heat-resistant poly (oxyphenylene benzimidazole)/ethyl cellulose blended polymer membrane for highly safe lithium-ion batteries. ACS Appl. Mater. Interfaces 2019, 12, 637–645. [Google Scholar] [CrossRef]
  24. Reddy, K.R.; Mutalik, S.; Reddy, S. Once-daily sustained-release matrix tablets of nicorandil: Formulation and in vitro evaluation. AAPS PharmSciTech 2003, 4, 480–488. [Google Scholar] [CrossRef] [PubMed]
  25. Kuksal, A.; Tiwary, A.K.; Jain, N.K.; Jain, S. Formulation and in vitro, in vivo evaluation of extended-release matrix tablet of zidovudine: Influence of combination of hydrophilic and hydrophobic matrix formers. AAPS PharmSciTech 2006, 7, E1–E9. [Google Scholar] [CrossRef]
  26. Patil, H.; Tiwari, R.V.; Upadhye, S.B.; Vladyka, R.S.; Repka, M.A. Formulation and development of pH-independent/dependent sustained release matrix tablets of ondansetron HCl by a continuous twin-screw melt granulation process. Int. J. Pharm. 2015, 496, 33–41. [Google Scholar] [CrossRef]
  27. Mandal, S.; Basu, S.K.; Sa, B. Sustained release of a water-soluble drug from alginate matrix tablets prepared by wet granulation method. AAPS PharmSciTech 2009, 10, 1348–1356. [Google Scholar] [CrossRef]
  28. Hamza, Y.E.-S.; Aburahma, M.H. Design and in vitro evaluation of novel sustained-release matrix tablets for lornoxicam based on the combination of hydrophilic matrix formers and basic pH-modifiers. Pharm. Dev. Technol. 2010, 15, 139–153. [Google Scholar] [CrossRef] [PubMed]
  29. Khaled, S.A.; Alexander, M.R.; Wildman, R.D.; Wallace, M.J.; Sharpe, S.; Yoo, J.; Roberts, C. 3D extrusion printing of high drug loading immediate release paracetamol tablets. Int. J. Pharm. 2018, 538, 223–230. [Google Scholar] [CrossRef]
  30. Abdelbary, G.A.; Tadros, M.I. Design and in vitro/in vivo evaluation of novel nicorandil extended release matrix tablets based on hydrophilic interpolymer complexes and a hydrophobic waxy polymer. Eur. J. Pharm. Biopharm. 2008, 69, 1019–1028. [Google Scholar] [CrossRef]
  31. Sahadevan, J.; Prabhakaran, R.; Vijay, J.; Gilhotra, R.M. Formulation and evaluation of cephalexin extended-release matrix tablets using hydroxy propyl methyl cellulose as rate-controlling polymer. J. Young Pharm. 2012, 4, 3–12. [Google Scholar] [CrossRef]
  32. Badshah, A.; Subhan, F.; Rauf, K.; Irfan Bukhari, N.; Shah, K.; Khan, S.; Ahmed, Z.; Khan, I. Development of controlled-release matrix tablet of risperidone: Influence of Methocel®- and Ethocel®-based novel polymeric blend on in vitro drug release and bioavailability. AAPS PharmSciTech 2011, 12, 525–533. [Google Scholar] [CrossRef] [PubMed]
  33. Sahoo, J.; Murthy, P.; Biswal, S.; Sahoo, S.; Mahapatra, A. Comparative study of propranolol hydrochloride release from matrix tablets with Kollidon® SR or hydroxy propyl methyl cellulose. AAPS PharmSciTech 2008, 9, 577–582. [Google Scholar] [CrossRef] [PubMed]
  34. Shanmugam, S. Granulation techniques and technologies: Recent progresses. BioImpacts BI 2015, 5, 55. [Google Scholar] [CrossRef]
  35. De Simone, V.; Caccavo, D.; Dalmoro, A.; Lamberti, G.; D’amore, M.; Barba, A.A. Inside the phenomenological aspects of wet granulation: Role of process parameters. In Granularity in Materials Science; IntechOpen: Rijeka, Croatia, 2018; pp. 63–84. [Google Scholar]
  36. Mughal, M.A.; Iqbal, Z.; Neau, S.H. Guar gum, xanthan gum, and HPMC can define release mechanisms and sustain release of propranolol hydrochloride. AAPS PharmSciTech 2011, 12, 77–87. [Google Scholar] [CrossRef]
  37. El Nabarawi, M.A.; Teaima, M.H.; Abd El-Monem, R.A.; El Nabarawy, N.A.; Gaber, D.A. Formulation, release characteristics, and bioavailability study of gastroretentive floating matrix tablet and floating raft system of Mebeverine HCl. Drug Des. Dev. Ther. 2017, 2017, 1081–1093. [Google Scholar] [CrossRef]
  38. Tiwari, S.B.; Murthy, T.K.; Raveendra Pai, M.; Mehta, P.R.; Chowdary, P.B. Controlled release formulation of tramadol hydrochloride using hydrophilic and hydrophobic matrix system. AAPS PharmSciTech 2003, 4, 18–23. [Google Scholar] [CrossRef]
  39. Bose, A.; Wong, T.W.; Singh, N. Formulation development and optimization of sustained release matrix tablet of Itopride HCl by response surface methodology and its evaluation of release kinetics. Saudi Pharm. J. 2013, 21, 201–213. [Google Scholar] [CrossRef] [PubMed]
  40. Siepmann, J.; Peppas, N.A. Modeling of drug release from delivery systems based on hydroxypropyl methylcellulose (HPMC). Adv. Drug Deliv. Rev. 2012, 64, 163–174. [Google Scholar] [CrossRef]
  41. Amalia, A.; Lestari, W.W.; Pratama, J.H.; Wibowo, F.R.; Larasati, L.; Saraswati, T.E. Modification of dry-gel synthesized MIL-100 (Fe) with carboxymethyl cellulose for curcumin slow-release. J. Polym. Res. 2022, 29, 487. [Google Scholar] [CrossRef]
  42. Costa, P.; Lobo, J.M. Comparison of dissolution profiles—Advancement of in vitro correlation method. Pharm. Sci. Technol. Today 2001, 4, 240–246. [Google Scholar]
  43. Prichard, B. Propranolol and beta-adrenergic receptor blocking drugs in the treatment of hypertension. Br. J. Clin. Pharmacol. 1982, 13, 51–60. [Google Scholar] [CrossRef] [PubMed]
  44. Kaur, G.; Grewal, J.; Jyoti, K.; Jain, U.K.; Chandra, R.; Madan, J. Oral controlled and sustained drug delivery systems: Concepts, advances, preclinical, and clinical status. In Drug Targeting and Stimuli Sensitive Drug Delivery Systems; Elsevier: Amsterdam, The Netherlands, 2018; pp. 567–626. [Google Scholar]
  45. Dos Santos, J.; Da Silva, G.S.; Velho, M.C.; Beck, R.C.R. Eudragit®: A versatile family of polymers for hot melt extrusion and 3D printing processes in pharmaceutics. Pharmaceutics 2021, 13, 1424. [Google Scholar] [CrossRef] [PubMed]
  46. Kiortsis, S.; Kachrimanis, K.; Broussali, T.; Malamataris, S. Drug release from tableted wet granulations comprising cellulosic (HPMC or HPC) and hydrophobic component. Eur. J. Pharm. Biopharm. 2005, 59, 73–83. [Google Scholar] [CrossRef] [PubMed]
  47. Bolívar-Monsalve, E.J.; Alvarez, M.M.; Hosseini, S.; Espinosa-Hernandez, M.A.; Ceballos-González, C.F.; Sanchez-Dominguez, M.; Shin, S.R.; Cecen, B.; Hassan, S.; Di Maio, E. Engineering bioactive synthetic polymers for biomedical applications: A review with emphasis on tissue engineering and controlled release. Mater. Adv. 2021, 2, 4447–4478. [Google Scholar] [CrossRef]
Figure 1. Process flow diagram of the PHP-SR tablets in this experimental design.
Biochem 05 00014 g001
Figure 2. FT-IR spectrum of PPH and other excipients used in formulating SR matrix tablets. (A) The IR spectrum of PPH alone. (B) IR spectrum of PPH and HPMC K100M mixture. (C) IR spectrum of PPH and EC mixture. (D) IR spectrum of PPH with Aerosil mixture. (E) IR spectrum of PPH with magnesium stearate mixture. (F) IR spectrum of PPH and MCC PH101 mixture.
Biochem 05 00014 g002
Figure 3. Drug release profile of the prepared formulations (F1 to F9) compared with marketed samples. (A) Dissolution profile comparison of different formulations and marketed samples up to a 24 h period. (B) Dissolution profile comparison of formulations (F1, F2, and F3) with HPMC K100M at different concentrations. (C) Dissolution profile comparison in formulations (F7, F8, and F9) containing a combination of HPMC K100M and EC at 25% in different ratios. (D) Dissolution profile comparison of formulations (F4, F5, and F6) containing EC at different concentrations.
Biochem 05 00014 g003
Figure 4. Release kinetics of drug plotted using different models. (A) First−order model. (B) Zero−order model. (C) Hixson–Crowell model. (D) Higuchi model. (E) Korsmeyer model. The plot resembles all the kinetic models for formulation F2. Standard equation plots and coefficients of determination were provided with all linear plots of each model.
Biochem 05 00014 g004
Table 1. Formulation compositions (% w/w) of PPH sustained-release matrix tablets. The total weight of each tablet was 200 mg.
FormulationsPropranololHPMC K100MECPVP K30MCC PH101MgStAerosil
F12015-2.061.51.00.5
F22025-2.051.51.00.5
F32030-2.046.51.00.5
F420-10.02.066.51.00.5
F520-20.02.056.51.00.5
F620-30.02.046.51.00.5
F72012.512.52.051.51.00.5
F82018.86.32.051.51.00.5
F92016.78.32.051.51.00.5
F1–F9 = Formulation 1 to Formulation 9, HPMC K100M = hydroxypropyl methylcellulose K100M, EC = ehylcellulose, PVP K30 = polyvinyl pyrrolidone K30, MCC PH101 = microcrystalline cellulose PH101, and MgSt = magnesium stearate.
Table 2. Pre-compression analysis of nine different propranolol HCl granule formulations.
FormulationsAngle of Repose (θ)Carr’s Index (CI)Hausner Ratio (HR)
F128.115.791.19
F228.512.51.14
F328.711.91.14
F433.513.791.16
F534.112.901.15
F634.513.511.16
F730.211.761.13
F830.513.891.16
F930.310.811.12
Table 3. Results of post-compression analysis of nine different propranolol HCl sustained-release formulations.
FormulationsAverage wt (mg)Assay (%)Hardness (Kp)Friability (%)Thickness (mm)
F1200.45 ± 1.8797.4511.93 ± 1.240.183.81 ± 0.02
F2200.55 ± 1.7098.3612.34 ± 0.910.203.80 ± 0.02
F3200.90 ± 1.9997.1713.28 ± 1.140.153.80 ± 0.03
F4200.85 ± 1.9596.3612.84 ± 1.140.273.81 ± 0.02
F5200.55 ± 1.9397.7512.72 ± 1.080.303.81 ± 0.02
F6199.55 ± 1.5798.6512.26 ± 1.290.253.80 ± 0.02
F7201.25 ± 2.4298.0512.54 ± 0.980.283.82 ± 0.02
F8201.00 ± 2.2797.8012.29 ± 1.240.293.81 ± 0.02
F9200.75 ± 1.6896.0913.66 ± 1.080.323.81 ± 0.02
Data are expressed as mean ± standard deviation (n = 3).
Table 4. Percentage cumulative drug release from the nine different formulations prepared.
Formulation1.5 h4 h8 h14 h24 h
F1 *38.02 ± 1.0957.51 ± 1.0880.07 ± 2.12107.81 ± 1.14107.95 ± 3.21
F2 *20.40 ± 2.0747.91 ± 3.0264.11 ± 1.2174.30 ± 2.2194.30 ± 3.31
F3 *05.00 ± 1.0319.66 ± 4.1540.53 ± 2.1755.50 ± 3.1776.67 ± 2.17
F4100.0 ± 1.16100.60 ± 3.21101.03 ± 3.21103.10 ± 2.12105.40 ± 4.15
F599.33 ± 4.07100.01 ± 5.32100.12 ± 4.18100.13 ± 2.31101.66 ± 3.18
F677.33 ± 3.15101.66 ± 2.17101.66 ± 3.31101.66 ± 4.37101.69 ± 3.14
F7 *38.01 ± 3.2460.03 ± 2.2682.20 ± 5.21103.15 ± 1.17108.50 ± 2.19
F8 *36.30 ± 4.0258.33 ± 1.3173.83 ± 3.2489.66 ± 3.14106.00 ± 4.17
F9 *37.12 ± 1.1255.07 ± 3.2176.12 ± 2.15102.87 ± 3.17104.52 ± 2.36
The data are presented as mean ± standard deviation (n = 6). A one-way ANOVA was conducted to assess the statistical significance of the differences in percentage drug release for each formulation between 1.5 and 24 h. The analysis revealed that formulations F1, F2, F3, F7, F8, and F9 exhibited statistically significant differences (p < 0.05) in drug release between these time points. An asterisk (*) following the formulation name in the table denotes a statistically significant change in percentage drug release from 1.5 to 24 h.
Table 5. Dissimilarity factor (f1) and similarity factor (f2) of different formulations.
FormulationDissimilarity Factor (f1)Similarity Factor (f2)
F14020
F2864
F33929
F45718
F55319
F64922
F72042
F81254
F91545
Disclaimer/Publisher’s Note: The statements, opinions and data contained in all publications are solely those of the individual author(s) and contributor(s) and not of MDPI and/or the editor(s). MDPI and/or the editor(s) disclaim responsibility for any injury to people or property resulting from any ideas, methods, instructions or products referred to in the content.

