Article

Antidiabetic and Antioxidant Activities of the Twigs of Andrograhis paniculata on Streptozotocin-Induced Diabetic Male Rats

1
Biochemistry Unit, Department of Biological Sciences, Covenant University, Ota 112233, Nigeria
2
Biochemistry Unit, Department of Natural Sciences, Faculty of Pure and Applied Sciences, Precious Cornerstone University, Ibadan 200223, Nigeria
3
Department of Biological Sciences, Crawford University, Igbesa P.M.B. 2001, Nigeria
4
Department of Biochemistry, Osun State University, Osogbo 232106, Nigeria
*
Authors to whom correspondence should be addressed.
BioChem 2021, 1(3), 238-249; https://doi.org/10.3390/biochem1030017
Submission received: 17 June 2021 / Revised: 18 October 2021 / Accepted: 20 October 2021 / Published: 18 November 2021

Abstract

:
Background: Diabetes is associated with chronic hyperglycaemia, long-term damage, dysfunction, and organ failure. This study aims to evaluate the antidiabetic activity of the twigs of Andrographis paniculata and its toxicological markers on Streptozotocin (STZ)-induced diabetic Albino rats. Methods: A total of thirty rats were randomly divided into five groups of six animals each. Non-diabetic animals were treated with distilled water as non-diabetic sham control group 1, while diabetic animals (group 2, 3, 4 and 5) were treated with 60 mg/kg bw STZ intravenous (iv) and 100 mg/kg body weight (bwt) of metformin orally for group 2, distilled water for group 3, and 250 and 500 mg/kg bwt of Andrograhis paniculata (A. paniculata) for groups 4 and 5, respectively. The animals were dosed for 28 days, after which they were sacrificed. Liver and kidney function tests as well as livid profile tests were used as the biomarkers of toxicological assessment. Fasting blood glucose was carried out weekly. Oral Glucose Tolerance Test (OGTT) was conducted on the 28th day of the antidiabetic assessment. Results: A. paniculata groups 4 and 5 were significant at different doses (p < 0.05) in reducing the blood glucose level in comparison with metformin. There were significant changes in total and direct bilirubin, total protein, potassium, triglyceride and inorganic phosphorus in 500 mg/kg bwt of the treated group in comparison with the metformin and diabetic group groups. A. paniculata at 500 mg/kg bwt is most effective for its antidiabetic and organ protecting effects.

1. Introduction

Diabetes Mellitus is well recognized as a significant endocrine-metabolic and chronic condition influencing the metabolism of carbohydrates, fats and proteins due to inadequate insulin synthesis and action characterized by recurrent hyperglycemia [1]. It is a public health problem and the fourth leading cause of death in the world today. There is usually a long-term risk of developing progressive disorders such as blindness, end-stage renal disease, heart disease, cerebrovascular and peripheral vascular disease in people with diabetes [2]. The predominance of diabetes mellitus is rapidly growing and is a significant threat to humanity. There are about 100 million diabetic patients in the world at present, i.e., 3% of the global population [3]. According to the International Diabetes Federation (IDF), approximately 13.6 million people in Africa suffer from diabetes. Approximately 7 million are in sub-Saharan Africa, making this one of the largest IDF areas. This number is expected to double and will reach 15 million in 2025. In rural areas, the approximate incidence of diabetes is 1%, up to 7% in urban sub-Saharan Africa and 8–13% in more developed regions such as South Africa [4]. More than 64 percent of the global population have also been reported to rely on medicinal plants for their primary health care [5]. About 80% of rural people in Africa alone have no access to modern medicine and are thus relying on traditional medicine for health care [6]. With this increase in the incidence of diabetics in the world, there is also a need to discover and validate the effectiveness of more therapeutic agents in the management of diabetes mellitus. The management of diabetes includes non-pharmacological therapy (diet and exercise) and pharmacological therapy (medications, insulin intake). Diets rich in fibre and exercise promote weight reduction and improve insulin sensitivity, thus lowering blood glucose levels. Pharmacological therapies such as sulfonylureas, metformin, thiazolidinediones, and alpha-glucosidase inhibitors also help in the management of diabetes by improving insulin sensitivity and reducing blood glucose levels.
In curing the sufferings of humanity especially in the era of civilization, medicinal plants are an integral part of human life [7]. It is estimated that more than 80,000 of the total plant species have been recognized and used globally as medicinal plants. [8]. Potential sources of herbal medicines are native medicinal plants and plant-based medicines, which are widely used to treat different health conditions [9]. Most of these medicinal plants have not been well validated for their effectiveness and possible side effects. It is therefore important to validate these ethnomedicinal claims and their possible side effects. Various parts of plants have been used in herbal medicines for the treatment of diabetes, and reportedly carry no adverse effects. Some of the medicinal plants used by various researchers include: Allium cepa, Allium sativum, Ficus bengalensis, Gymnema sylvestre, Pterocarpus marsupium, etc. It should also be noted that active hypoglycemic principles have been isolated and their mechanism of action in these plant extracts has been studied, and most of them seem to act directly on the pancreas (pancreatic effect) and stimulate insulin level in blood. Some incur extra pancreatic effects also by acting directly on tissues such as liver, muscle etc., and favourably alter the activities of the regulatory enzymes of glycolysis, gluconeogenesis and other pathways. However, some of these plant extracts either carry side effects, are toxic to the body, or are not widely spread around the world.
A. paniculata (Burm. f.) wall. Ex nees (AP) is a significant therapeutic plant that is widely used worldwide. It belongs to the Acanthaceae family. A. paniculata is used as herbal medicine in countries such as China, Hong Kong, Bangladesh, Indonesia, India, Malaysia, and Thailand [10,11]. Ethno-botanically, it has been used in the treatment of snake bite, bug bite, diabetes, dysentery, fever and malaria [12]. The aerial parts of A. paniculata are the most frequently used parts. Its extracts contain diterpenoids, diterpene, glycosides, lactones, flavonoids and flavonoid glycosides. A wide range of pharmacological benefits have been reported for A. paniculata including anticancer [13], antidiarrheal [14], antihepatitis [15], anti-HIV [16], antihyperglycemic [17,18], anti-inflammatory [19], antimicrobial, antimalarial [20], antioxidant [21], cardiovascular [22], cytotoxic [16], hepatoprotective [23], immunostimulatory [24] and sexual dysfunction [25]. This study was conducted to investigate the anti-diabetic activities of the ethanolic extract of the twigs of Andrographis paniculata on STZ-induced diabetic Albino rats.

2. Materials and Methods

2.1. Plant Collection and Extraction

Twigs of A. paniculata were acquired from Oyo state Nigeria in October. Botanical identification was completed by J.O. Popoola, Covenant University, Ota, Ogun state, Nigeria. The collected plants were air- dried at room temperature for about 4 weeks and protected from direct sunlight and heat.,after which they were grinded into fine powder using a domestic blender and electric grinding machine. After grinding, 204.54 g of sample was obtained and soaked in 4000 mL of ethanol (80 v/v) for 72 h in an airtight container and stirred at intervals. After 72 h the mixture was vigorously shaken and filtered using a piece of muslin cloth. The filtrate was kept in an airtight container and the residue was re-soaked in ethanol and left to stand for another 72 h and then filtered. The mixture was filtered and both filtrates were mixed together and crude extract was obtained using a rotary evaporator.

2.2. Chemicals and Reagents

Normal saline (0.9%), Metformin, Ethanol, STZ (STZ), Glucose-D, potassium dihydrogen phosphate (KH2PO4), Ellman’s reagent, sodium nitrate.

2.3. Experimental Animals

Thirty wistar rats between the ages of 4–8 weeks old were used for this study. They were acquired from the Animal house of Covenant University, Ota, Ogun state, Nigeria. Animals were acclimatized for 2 weeks and fed with standard experimental feed and water ad libitum. The rats were housed in well ventilated cages at a temperature of 28–32 °C in the Biological Sciences Department animal laboratory of Covenant University, Ota, Ogun state. The rats were allowed access to water freely and fed throughout the period of study. Animal experiments and handling were carried out in compliance with standard guidelines approved by the Department of Biological Sciences’ Animal Ethics Committee, Covenant University, Ota, Ogun State, Nigeria.

2.4. Induction of Diabetes

Diabetes was induced by injecting a single dose of freshly prepared aqueous solution of STZ (60 mg/kg) intravenously. Blood was taken from the tail vein for glucose analysis and rats with fasting glucose levels ≥250 mg/dL showing clear signs of polyphagia, polydipsia and polyuria were considered diabetic and were used for the antidiabetic assessment study.

2.5. Experimental Design

After acclimatization, the thirty Albino rats were weighed and distributed accordingly into 5 groups; each group consisted of 6 animals with weights ranging from 100–240 g at the start of the experiment as shown in Table 1.
Metformin is known to be a standard drug for diabetes patients. This drug was therefore used together with the sham control, as standard to compare the efficacy of the two doses of A. paniculata in the treatment of diabetes

2.6. Oral Glucose Tolerance Test (OGTT)

OGGT was carried out on diabetic and non-diabetic animals. The animals were fasted 12 h earlier for OGGT. The fasting glycaemia was recorded and termed as zero-time. Thereafter, the animals received their treatment orally. After 30 min, all the groups received glucose (2.0 kg/bodyweight) once orally. The blood glucose levels were then taken and measured at 30, 60, 120 and 150 min after glucose administration.

2.7. Estimation of Livid Profile Parameters

Blood samples were obtained after sacrifice and plasma samples were taken and measured using the standard method. Livid profile parameters, such as Triglycerides, High Density lipoprotein (HDL), Total Cholesterol and Low Density Lipoprotein were assayed using the guidelines of the manufacturer.

2.8. Estimation of Liver Function Parameters

Blood samples were obtained after sacrifice and plasma samples were taken and measured using the standard method. Liver function biomarkers such as total bilirubin, alanine aminotransferase (ALT), albumin, alkaline phosphatase (ALP), direct bilirubin and total protein were assayed using the guidelines of the manufacturer.

2.9. Estimation of Kidney Functions Parameters

Blood samples were obtained after sacrifice and plasma samples were taken and measured using the standard method. Kidney function biomarkers, such as creatinine, inorganic phosphorus and potassium were assayed using the guidelines of the manufacturer.

2.10. Statistical Analysis

Data were expressed as Mean ± Standard Error of Mean (SEM). The statistical analysis of the results was carried out by one way analysis of variance (ANOVA) using the Statistical Package for the Social Sciences (SPSS), version 15.0 (SPSS Inc., Chicago, IL, USA). The differences between the mean groups of A. paniculata treated animals at different doses. Metformin, diabetic group, and sham control were compared using the least significant difference (LSD). The test for statistical significance was evaluated at the 95% confidence interval.

3. Results

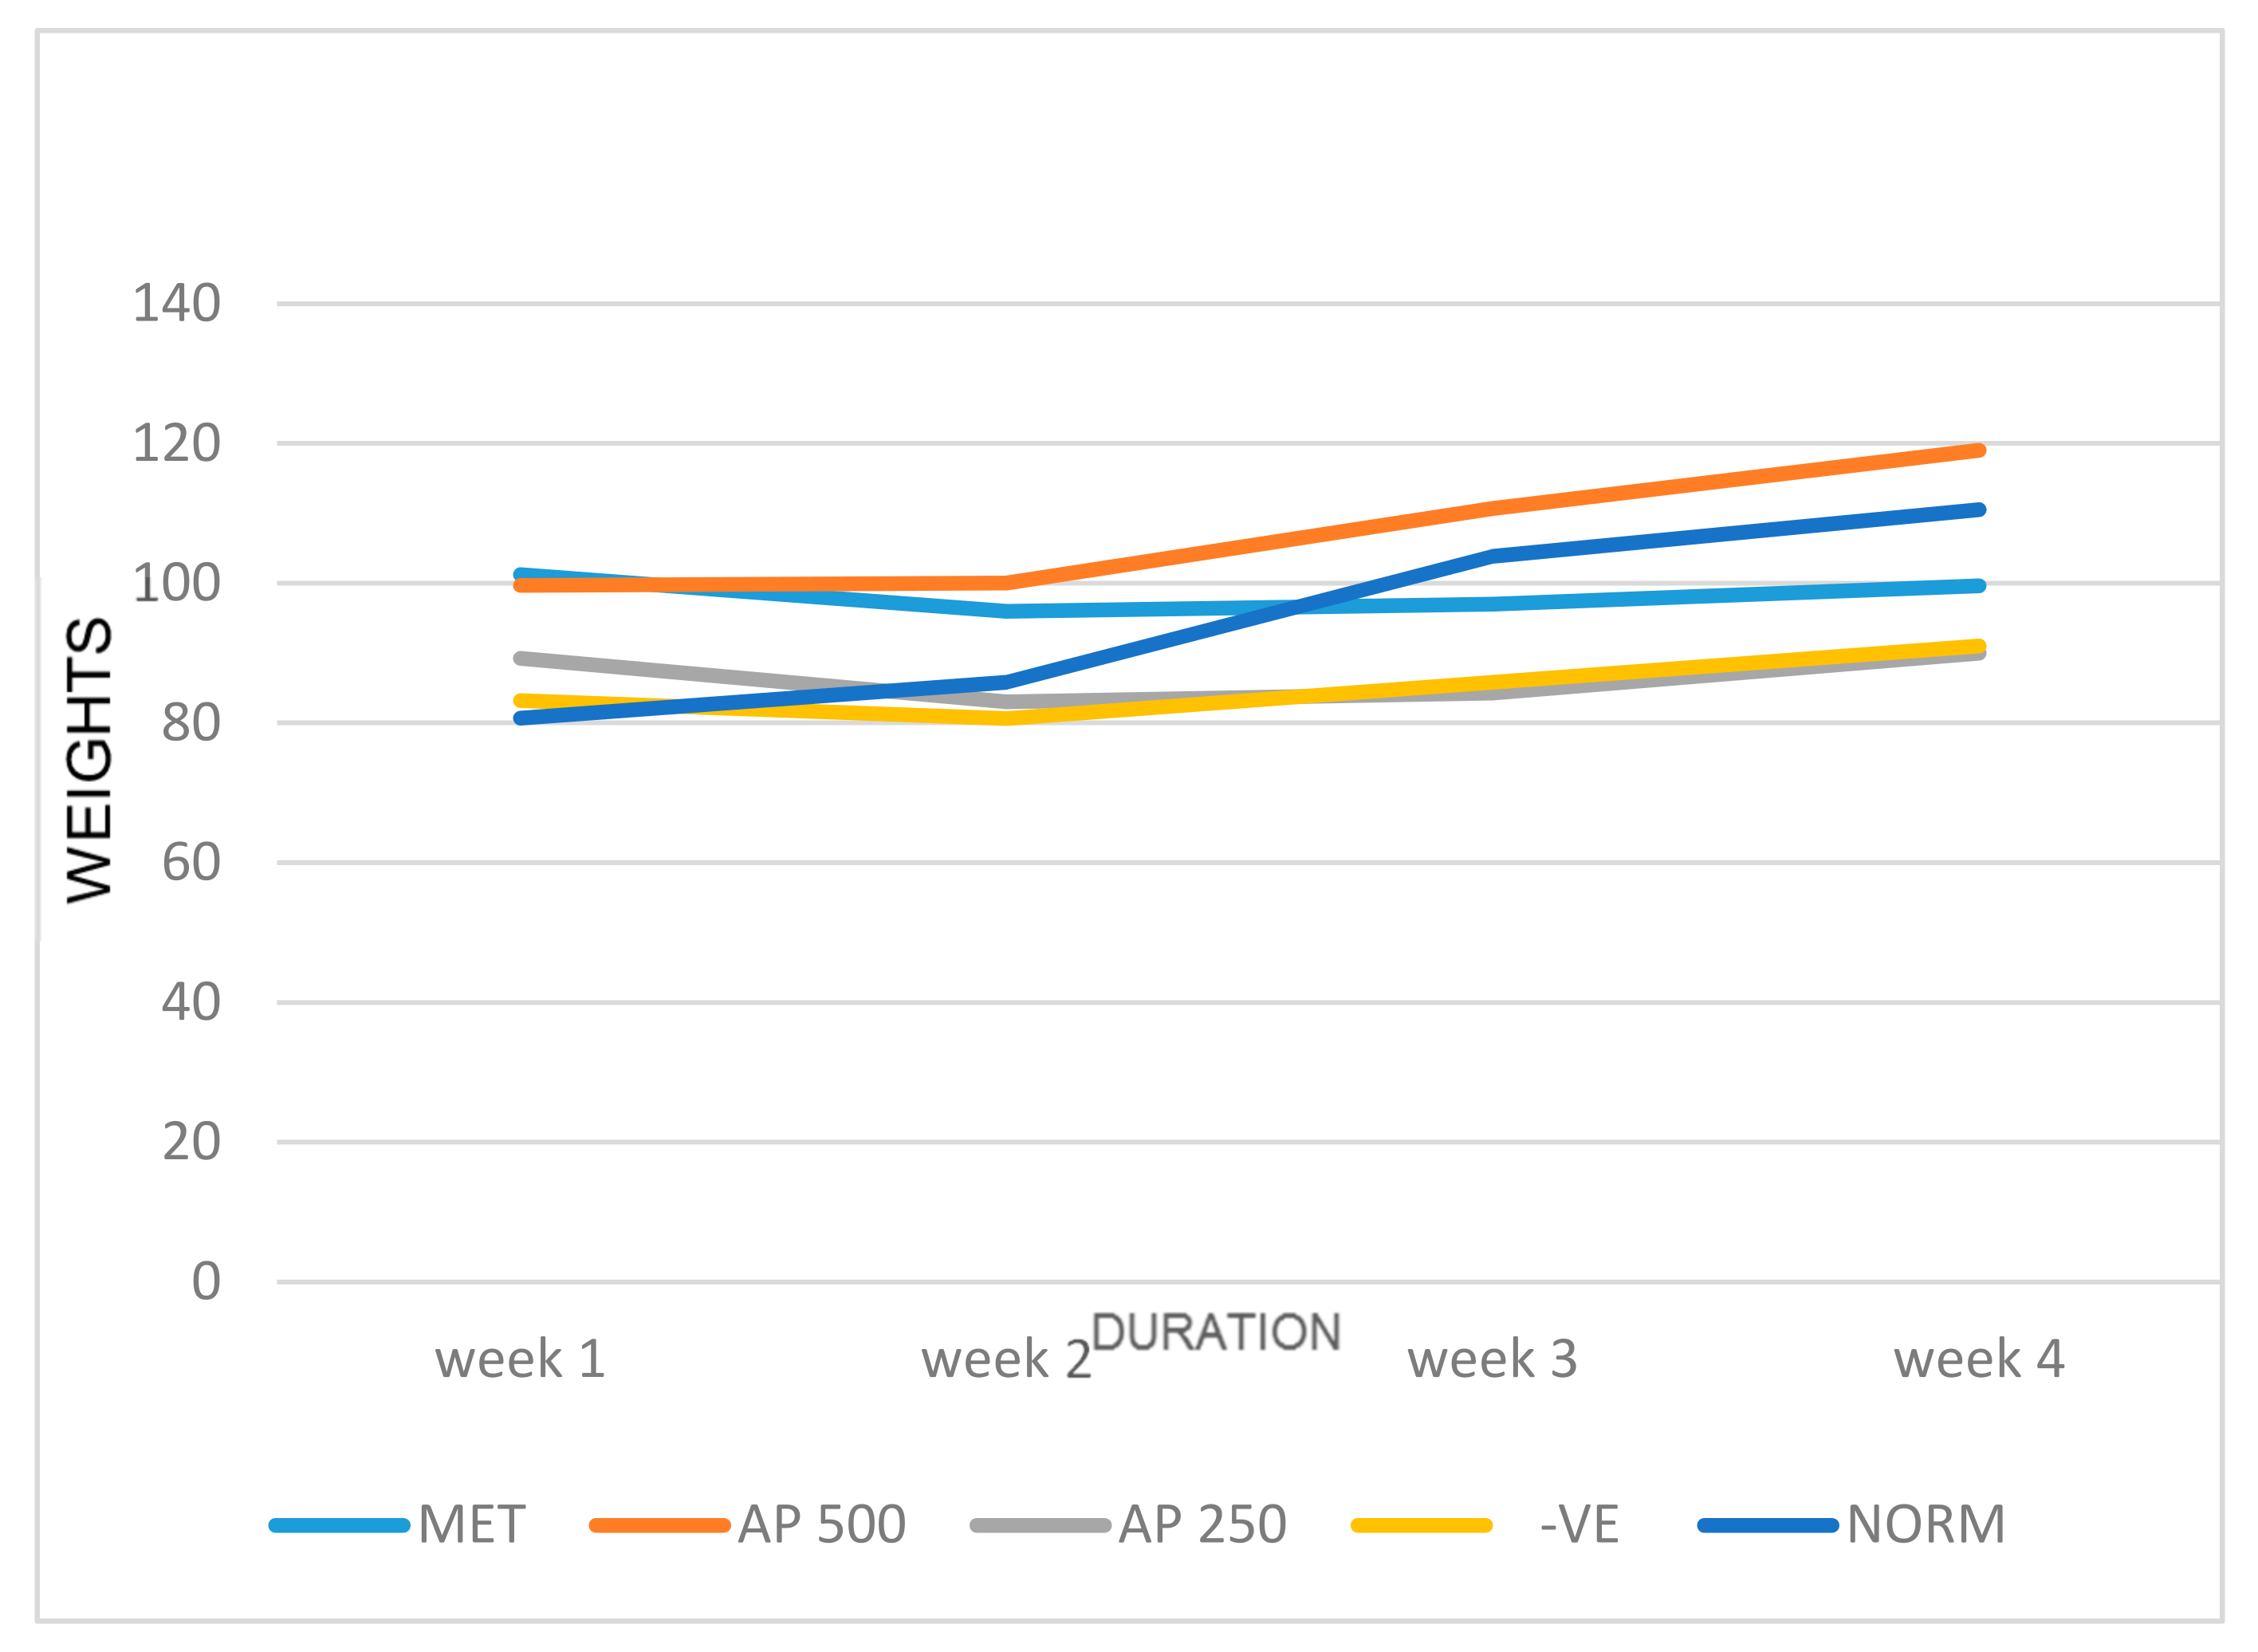
3.1. Effect of A. paniculata on Body Weight and Relative Organ Weights of STZ-Induced Diabetic Albino Rats

Table 2 shows the relative organ weight of both sham normal control, diabetic rats and A. paniculata treated rats. There was a significant (p < 0.05) increase in the relative organ (Liver, kidney and spleen) weight of rats injected with STZ as compared to the sham normal control, but an increase in these organs weight, when compared to rats treated with metformin, 250 mg and 500 mg A. paniculata treated rats when compared with STZ. Figure 1 reveals the body weight of all groups (control and treated). In the 4th week, the body weight of sham control rats increased significantly (p < 0.05), whereas STZ-induced diabetic rats revealed a significant decrease in weight as compared to the sham control rats.

3.2. Effect of A. paniculata on Fasting Blood Glucose of STZ-Induced Diabetic Albino Rats

Percentage reduction in the fasting blood glucose over the duration of the experiment is shown in Table 3. After the induction of diabetes with STZ (STZ), animals with fasting blood glucose (FBG) of between 250 to 350 mg/dL were termed to be diabetic and used in the diabetic group. After three weeks of duration, the diabetic group showed significantly elevated blood glucose concentration when compared with the control group. Extract and metformin treated groups show a comparable reduction in FBG as compared to the diabetic group.

3.3. Effect of A. paniculata on Oral Glucose Tolerance Test in Non-Diabetic Albino Rats

Table 4 shows the blood glucose level after the administration of glucose in non-diabetic rats. At initial time the fasting blood glucose (FBG) of A. paniculata was not significantly (p < 0.05) different in the FBG of metformin and A. paniculata in comparison with control. At 60 min and 120 min metformin was able to decrease the BG levels significantly lower that of the control rats group.

3.4. Effect of A. paniculata on Oral Glucose Tolerance Test in Diabetic Albino Rats

Blood glucose levels after oral administration of glucose in rats (both normal and diabetic) are given in Table 5. At initial time, significant difference (p < 0.05) was observed in the FBG of A. paniculata-treated and diabetic group rats in comparison to the sham control. At 60 min, sham control reached a glucose induced hyperglycemia peak and returned near to a normal level at 120 min. Metformin significantly (p < 0.05) reduced the blood glucose levels at 60 min in comparison with the diabetic group. A. paniculata was able to reduce the blood glucose levels when compared with diabetic group, but was not as significant as metformin.

3.5. Effect of A. paniculata and Metformin on Liver Function Test in Plasma

In Table 6, there was significant increase in A. paniculata 250 mg (p < 0.05) and a significant (p < 0.05) decrease in A. paniculata 500 mg in total bilirubin activity compared to sham control. There was a significant (p < 0.05) increase in A. paniculata 250 mg and the diabetic group in total bilirubin when compared to metformin. In addition there was a significant (p < 0.05) increase in A. paniculata 250 mg and a significant (p < 0.05) decrease in A. paniculata 500 mg and metformin in total bilirubin activity in comparison to the diabetic group. In Table 6, there was a significant (p < 0.05) increase in metformin, diabetic group and A. paniculata 250 mg in direct bilirubin comparison with sham control group, and there was a significant (p < 0.05) increase in diabetic group and A. paniculata 250 mg and a significant (p < 0.05) decrease in A. paniculata 500 mg when compared to metformin. In addition, there was a significant increase (p < 0.05) in metformin and A. paniculata 250 mg and a significant (p < 0.05) decrease in A. paniculata 500 mg when compared with diabetic group. Table 7 revealed a significant (p < 0.05) increase in the diabetic group, A. paniculata 250 mg and 500 mg in ALP activity when compared with sham control. There was a significant (p < 0.05) decrease in metformin when compared with diabetic group. In Table 7, ALT levels increased significantly (p < 0.05) in metformin when compared with sham control; there was a significant (p < 0.05) decrease in A. paniculata 500 mg in ALT activity in comparison with metformin. ALT levels also decreased significantly (p < 0.05) in A. paniculata 500 mg in comparison with the diabetic group. In Table 8, there was a significant (p < 0.05) decrease in Albumin level of rats treated with 500 mg A. paniculata when compared to sham control; and a significant (p < 0.05) increase in A. paniculata 500 mg in Albumin in comparison with the diabetic group. No significant change was observed in total protein activity as shown in Table 8.

3.6. Effect of A. paniculata and Metformin on Lipid Profile in Plasma

In Table 9, there was a significant (p < 0.05) increase in HDL activity in metformin and a significant decrease in A. paniculata 500 mg with comparison to sham control. In addition, HDL significantly (p < 0.05) decreased in the diabetic group and A. paniculata 500 mg when compared with the sham control group; significant (p < 0.05) decrease was also observed in A. paniculata 500 mg when compared with the diabetic group. In Table 9, there was a significant (p < 0.05) increase in the diabetic group and a significant (p < 0.05) decrease in metformin in LDL activity when compared with the sham control. There was a significant (p < 0.05) decrease in the diabetic group, A. paniculata 250 mg and 500 mg in LDL activity when compared with the sham control and metformin. In addition, significant decrease was observed in LDL activity in metformin when compared with the diabetic group. In Table 5, a significant increase (p < 0.05) in cholesterol activity was observed in the diabetic group and A. paniculata 250 mg when compared with the sham control. In Table 10, no significant change was observed in triglyceride activity.

3.7. Effect of A. paniculata and Metformin on Kidney Markers Test

In Table 11, there was a significant (p < 0.05) increase in metformin and a significant (p < 0.05) decrease in the diabetic group, A. paniculata 250 mg/kg and 500 mg/kg in Potassium activity compared to the sham control; there was a significant (p < 0.05) decrease in sham control, diabetic group, A. paniculata 250 mg/kg and 500 mg/kg in Potassium in comparison with metformin. In addition, significant increase was seen in metformin for potassium levels in comparison with the diabetic group. In Table 11, no significant difference was observed in inorganic phosphorus activity. Table 12 revealed a significant (p < 0.05) increase in creatinine activity in A. paniculata 250 mg/kg when compared with the diabetic group and metformin. Creatinine levels also increased significantly (p < 0.05) in A. paniculata 250 mg/kg when compared with the sham control.

4. Discussion

The usage of medicinal plants for the management of life-threatening ailments such as diabetes has gained more acceptance within the last two decades [26]. These plants are rich in flavonoids and alkaloids [27]. The present study investigated the anti-diabetic potentials of A. paniculata. The prolonged administration of A. paniculata at both doses for 3 weeks resulted in a significant decrease of blood glucose levels compared to the diabetic untreated rats (Table 3, Table 4 and Table 5). Metformin has been known to produce insulin-lowering effects in diabetic patients [28]. This result confirms the findings by Subramanian et al. [29] that A. paniculata has the ability to reduce blood glucose levels via inhibition of α-glycosidase and α-amylase. The weight gain as seen in Figure 1 of the diabetic rats as compared to control animals may be due to the ability of A. paniculata to reduce hyperglycemia, most especially in the rats treated with 500 mg/kg bw of A. paniculata, which show a drastic reduction in weight. This reduction in the cholesterol level of the treated rats as compared to diabetic group shows that A. paniculata has lipid lowering potential, thereby stimulating low density lipoprotein catabolism. In addition, the oral glucose test also suggests that A. paniculata could improve glucose tolerance of rats and also glucose utilization.
In the liver function tests, ALT and ALP are known to be definite markers for diagnosing liver injury and necrosis of hepatocytes. Elevated levels of ALT in metformin, STZ and 250 mg/kg A. paniculata may be as a result of necrosis of hepatocytes leading to a rise in cell membrane permeability which causes the release of aminotransferases into the bloodstream. By contrast, the decrease in ALT at 500 mg/kg could be due to the ability of the extract to modify the hepatocytes and down regulate its production, which could be helpful. ALP was significantly decreased in both treatment groups of A. paniculata in comparison with the untreated (STZ) group. Metformin, however, reduced the ALP level significantly, indicating its protective role against hepatic damage and possibly intrahepatic cholestasis [30]. Albumin, which is an indicator of the integrity of the glomerular membrane, was evaluated. A. paniculata at 500 mg/kg significantly reduced the total albumin in plasma. The total protein was evaluated and no significant variation was observed across all groups suggesting the non-toxicity of the plant extract to liver during treatment [31]. Total and direct Bilirubin was also estimated. 250 mg/kg of A. paniculata showed a significant rise in total and direct bilirubin while 500 mg/kg of A. paniculata showed a significant decrease in these levels. This showed that lower doses might pose some challenges as an increase in bilirubin levels might be due to excessive hemolysis, cytotoxicity of the liver from obstruction in the bile ducts [32].
Plasma triglycerides are useful biomarkers in prediction of renal dysfunction [33]. High concentrations of all lipids except HDLs are associated with an increased risk of atherosclerosis. Metformin was significant in increasing the HDL level while the plant extract at different doses of 250 mg and 500 mg/bodyweight showed no significant variation. High plasma levels of triglycerides and LDLs are associated with coronary artery disease. The reduction in the plasma levels of triglycerides, especially at the doses of 250 mg and 500 mg, suggests that the plant extract may contain hypolipidaemic and hypocholesterolaemic agents. However, total cholesterol and LDL were significantly increased in plant extract at different doses 250 mg and 500 mg. This also suggests that the use of A. paniculata might not be suitable towards managing cardiovascular diseases associated with obesity or hyperlipidemia.
Creatinine levels were also estimated in plasma. Creatinine is the primary catabolic agent of muscle and is excreted in the kidneys. Creatinine levels are used to suggest renal insufficiency [34]. However, elevated plasma creatinine has been reported following trauma or anuria, traumatic muscle injury and muscle dystrophy in renal injury [35]. Increased creatinine levels were observed for plant extract at 250 mg/kg; 500 mg/kg and metformin groups were not statistically significant compared to the sham control group. Increased concentrations of inorganic phosphorus or phosphate ions (hyperphosphatemia) could indicate bone and kidney disease. There was no significant variation in inorganic phosphorus at different doses of the plant extract as compared with sham control. In addition, different doses of plant extract were more significant in reducing the potassium level in the plasma than metformin, as compared with the sham control. Potassium levels can be used in diagnosing kidney diseases.

5. Conclusions

The findings from the study showed that A. paniculata possesses the ability to restore blood glucose levels, livid profile and liver enzymes. Although traditional Chinese literature states that A. paniculata has few toxic side effects, large oral doses may cause gastric discomfort and anorexia. Emesis may be caused by the bitter andrographolide. Commercial preparations in current use tend to be highly concentrated and standardized extracts, which may significantly change the safety profile of this ingredient. The World Health Organization (WHO) monograph for ‘Herbal Andrographidis’ (dried aerial parts of A. paniculata) contraindicates the use of Herbal Andrographidis during pregnancy or lactation, or in cases of known allergy to plants of the Acanthaceae family. The WHO monograph also warns against injecting crude extracts of Herbal Andrographidis due to potential anaphylactic reactions. Though highly medicinal, A. paniculata should be taken at a moderate dose. Therefore, A. paniculata could be a possible drug target for the management of diabetes and also liver damage.

Author Contributions

O.O.O., conceptualization, methodology, resources investigation, writing original draft, review and editing; B.O.A., investigation, resources, writing original draft; M.I.R. and J.O.P., methodology investigation, writing original draft; O.E.O., data curation, resources, methodology, writing original draft, review and editing; B.O.A., E.F.E. and O.A.A., resources, writing original draft. All authors have read and agreed to the published version of the manuscript.

Funding

This research did not receive any specific grant from funding agencies in the public, commercial, or not-for-profit sectors.

Institutional Review Board Statement

The Covenant Health, Research and Ethics Committee, approved all experiments and protocols described in the study (CU/HREC/ATS06/19, and the experiments were performed in agreement with the “Guide for the Care and Use of Laboratory Animals” the guidelines of the Declaration of Helsinki and “Committee for the Purpose of Control and Supervision of Experiments on Animals” (CPCSEA).

Informed Consent Statement

Not applicable.

Data Availability Statement

The authors declare that all data supporting the findings of this study are available in the article and can be provided by the corresponding author on reasonable request.

Conflicts of Interest

The authors declare no conflict of interest.

References

  1. Alexander, G.C.; Sehgal, N.L.; Moloney, R.M.; Stafford, R.S. National Trends in Treatment of Type 2 Diabetes Mellitus. Arch. Int. Med. 2008, 168, 94–102. [Google Scholar] [CrossRef] [Green Version]
  2. WHO. Study Group on Diabetes Mellitus; Technical Report Series of a WHO Study Group; Second Report; A Meeting Held in Geneva, Switzerland, Published by World Health Organization. 1985. Available online: https://apps.who.int/iris/handle/10665/39592 (accessed on 17 June 2021).
  3. Crawford, J.M.; Cortran, R. Robbins Pathologic Basis of Disease; W.B. Saunders Co: Philadelphia, PA, USA, 2003; ISBN 0-8089-23021. [Google Scholar]
  4. Chinenye, S.; Young, E. State of Diabetes Care in Nigeria: A Review. Niger. Health J. 2011, 11, 101–106. [Google Scholar]
  5. Farnworth, N. Ethnopharmacology and Drug Development; John Wiley Books and Sons: Chichester, UK, 1994; ISBN 978-953-307-863-2. [Google Scholar]
  6. Sofowora, E.A. Medicinal Plants and Traditional Medicine in African, 2nd ed.; John Wiley Books and Sons: Ibadan, Nigeria, 1993; ISBN 8172361262. [Google Scholar]
  7. Chaudhary, G.; Goyal, S.; Poonia, P. Lawsonia inermis Linnaeus: A phytopharmacological review. Int. J. Pharm. Sci. Drug Res. 2010, 2, 91–98. [Google Scholar]
  8. Joy, P.; Thomas, J.; Mathew, S.; Skaria, B.P. Medicinal plants. Trop. Hortic. 1998, 2, 449–632. [Google Scholar]
  9. Kavishankar, G.; Lakshmidevi, N.; Murthy, S.M.; Prakash, H.; Niranjana, S. Diabetes and medicinal plants—A review. J. Pharm. Biomed. Sci. 2011, 2, 65–80. [Google Scholar]
  10. Akbar, S. Andrographis paniculata: A review of pharmacological activities and clinical effects. Alt. Med. Rev. 2011, 16, 66–77. [Google Scholar]
  11. Kabir, M.H.; Hasan, N.; Rahman, M.M. A survey of medicinal plants used by the Deb barma clan of the Trivura tribe of Moulvibazar district, Bangladesh. J. Ethnobiol. Ethnomed. 2014, 10, 1–19. [Google Scholar] [CrossRef] [Green Version]
  12. Burkill, I.H.; Birtwistle, W.; Foxworthy, F.; Scrivenor, J.; Watson, J. A Dictionary of the Economic Products of the Malay Peninsula; Ministry of Agriculture and Co-Operatives: Kuala Lumpur, Malaysia, 1966.
  13. Ajaya, R.; Kumar, K.; Sridevi, N.; Vijaya, K.; Nanduri, S.; Rajagopal, S. Anticancer and immunostimulatory compounds from Andrographis paniculata. J. Ethnopharm. 2004, 92, 291–295. [Google Scholar] [CrossRef] [PubMed]
  14. Gupta, S.J.; Yadava, N.S.; Tandon, J.S. Antisecretory (antidiarrhoeal) activity of Indian medicinal plants against Escherichia colientero toxin-induced secretion in rabbit and guinea pig ileal loop models. Int. J. Pharmacogn. 1993, 31, 198–204. [Google Scholar] [CrossRef]
  15. Sharma, M.; Sharma, A.; Tyagi, S. Quantitative HPLC analysis of andrographolide in Andrographis paniculata at two different stages of life cycle of plant. Acta Chim. Pharm. Indica 2012, 2, 1–7. [Google Scholar]
  16. Nanduri, S.; Nyavanandi, V.K.; Sanjeeva, S.; Thunuguntla, R. Synthesis and structure-activity relationshivs of andrographolide analogues as novel cytotoxic agents. Bioorg. Med. Chem. Lett. 2004, 14, 4711–4717. [Google Scholar] [CrossRef] [PubMed]
  17. Yu, B.C.; Hung, C.R.; Chen, W.C.; Cheng, J.T. Antihyperglycemic effect of andrographolide in STZ-induced diabetic rats. Planta Med. 2003, 69, 1075–1079. [Google Scholar] [PubMed]
  18. Yu, B.C.; Chang, C.K.; Su, C.F.; Cheng, J.T. Mediation of β-endorphin in andrographolide-induced plasma glucose lowering action in type I diabetes-like animals. Naunyn-Schmiedeberg Arch. Pharmacol. 2008, 377, 529–540. [Google Scholar] [CrossRef] [PubMed]
  19. Shen, Y.C.; Chen, C.F.; Chiou, W.F. Andrographolide prevents oxygen radical production by human neutrophils: Possible mechanism(s) involved in its anti-inflammatory effect. Br. J. Pharmacol. 2002, 135, 399–406. [Google Scholar] [CrossRef] [Green Version]
  20. Wiart, C.; Kumar, K.; Yusof, M.Y.; Hamimah, H.; Fauzi, Z.M.; Sulaiman, M. Antiviral properties of ent-labdene diterpenes of Andrographis paniculata Nees, inhibitors of herpes simplex virus type 1. Phytother. Res. 2005, 19, 1069–1070. [Google Scholar] [CrossRef]
  21. Akowuah, G.A.; Zhari, I.; Mariam, A. Analysis of urinary andrographolides and antioxidant status after oral administration of Andrographis paniculata leaf extract in rats. Food Chem. Toxicol. 2008, 46, 3616–3620. [Google Scholar] [CrossRef]
  22. Zhang, C.Y.; Tan, B.H. Mechanisms of cardiovascular activity of Andrographis paniculata in the anaesthetized rat. J. Ethnopharmacol. 1997, 56, 97–101. [Google Scholar] [CrossRef]
  23. Trivedi, N.P.; Rawal, U.M. Hepatoprotective and antioxidant property of Andrographis paniculata (Nees) in BHC induced liver damage in mice. Ind. J. Exp. Biol. 2001, 39, 41–46. [Google Scholar]
  24. Rana, A.C.; Avadhoot, Y. Hepatoprotective effects of Andrograhphis paniculata against carbon tetrachloride-induced liver damage. Arch. Pharm. Res. 1991, 14, 93–95. [Google Scholar] [CrossRef]
  25. Akbarsha, M.A.; Murugaian, P. Aspects of the male reproductive toxicity/male antifertility property of andrographolide in albino rats: Effect on the testis and the cauda epididymidal spermatozoa. Phytother. Res. 2000, 14, 432–435. [Google Scholar] [CrossRef]
  26. Oyebode, O.; Kandala, N.B.; Chilton, P.J.; Lilford, R.J. Use of traditional medicine in middle-income countries: A WHO-SAGE study. Health Policy Plan. 2016, 31, 984–991. [Google Scholar] [CrossRef] [Green Version]
  27. Oladele, S.; Ayo, J.; Adaudi, A. Medicinal and physiological properties of flavonoids, coumarin derivatives and anthraqoinones of plant origin. West Afr. J. Pharmacol. Drug Res. 2010, 11. [Google Scholar] [CrossRef]
  28. Dowling, R.; Godwin, J.P.; Stambolic, V. Understanding the benefit of metformin use in cancer treatment. Biomedcent. Med. 2011, 9, 33. [Google Scholar] [CrossRef] [Green Version]
  29. Subramanian, R.; Asmawi, M.Z.; Sadikun, A. In vitro α-glucosidase and α-amylase enzyme inhibitory effects of Andrographis paniculata extract and andrographolide. Acta Biochim. Pol. 2008, 55, 391–398. [Google Scholar] [CrossRef] [PubMed] [Green Version]
  30. Davern, T.J.; Scharschmidt, B.F. Biochemical liver tests. In Sleisenger and Fordtran’s Gastrointestinal and Liver Disease: Pathophysiology, diagnosis, management. Saunders 2002, 7, 1227–1228. [Google Scholar]
  31. Gatsing, D.; Aliyu, R.; Kuiate, J.R.; Garba, I.H.; Jaryum, K.H.; Tedongma, N.; Tchouanguep, M.F.; Adoga, G.I. Toxicological evaluation of the aqueous extract of Allium sativum bulbs on laboratory mice and rats. Cameroon J. Exp. Biol. 2005, 1, 39–45. [Google Scholar] [CrossRef]
  32. Nduka, N. Clinical Biochemistry for Students of Pathology; Longman Nig. PLC: Abuja, Nigeria, 1999; Volume 1, pp. 157–168. [Google Scholar]
  33. Muntner, P.; Coresh, J.; Smith, J.C.; Eckfeldt, J.; Klag, M.J. Plasma livids and the risk of developing renal dysfunction: The atherosclerosis risk in communities study. Kidney Int. 2000, 58, 293–301. [Google Scholar] [CrossRef] [Green Version]
  34. Aliyu, R.; Adebayo, A.H.; Gatsing, D.; Garba, I.H. The Effects of Ethanolic Leaf Extract of Commivhora africana (Burseraceae) on Rat Liver and Kidney Functions. J. Pharmacol. Toxicol. 2006, 2, 373–379. [Google Scholar] [CrossRef]
  35. Srisawat, N.; Itoste, E.E.A.; Kellum, J.A. Modern classification of acute kidney injury. Blood Purif. 2010, 29, 300–307. [Google Scholar] [CrossRef] [PubMed]
Figure 1. Effect of STZ-induced diabetes and treatment on metformin and A. paniculata on body weight of rat. Met represents Metformin, AP represents A. paniculata 250 mg and 500 mg, -VE represents Diabetic group, and NORM represents Sham control. Weight is in grams (g).
Biochem 01 00017 g001
Table 1. Experimental design.
GROUPSDOSAGE (mg/kg)
Sham controlDistilled water (oral)
Metformin-100 mg60 mg/kg STZ (iv) + Metformin (oral) 100 mg/kg
Diabetic group60 mg/kg STZ (iv)
A. paniculata 250 mg60 mg/kg STZ (iv) + A. paniculata (oral) (250 mg/kg)
A. paniculata 500 mg60 mg/kg STZ (iv) + A. paniculata (oral) (500 mg/kg)
Table 2. Effect of A. paniculata on Relative organ weight.
GroupLiver (g)Kidney (g)Spleen (g)
Sham control3.53 ± 0.09 #0.72 ± 0.04 #n0.54 ± 0.05 #
Metformin-100 mg4.51 ± 0.3 n*0.93 ± 0.03 *0.30 ± 0.06 *
Diabetic group3.61 ± 0.17 #0.90 ± 0.05 *0.38 ± 0.04
A. paniculata 250 mg4.11 ± 0.640.91 ± 0.11 *0.70 ± 0.14 #n
A. paniculata 500 mg4.4 ± 0.26 *0.90 ± 0.090.73 ± 0.13 #n
Superscripts * represent values at significant difference of p < 0.05 from sham control, # represents values at significant difference of p < 0.05 from metformin control and n represents values at significant difference of p < 0.05 from diabetic group groups, respectively. Metformin, AP 250 mg and AP 500 mg are groups treated with 100 mg/kg metformin, 250 mg/kg A. paniculata and 500 mg/kg A. paniculata, respectively. The negative and sham controls are untreated diabetic and untreated non-diabetic groups, respectively.
Table 3. Percentage reduction in fasting blood glucose levels.
Groups% Reduction
Sham control7.96
Metformin-100 mg81.73
Diabetic group15.8
A. paniculata 250 mg81.21
A. paniculata 500 mg85.8
Table 4. Effect of A. paniculata on oral glucose tolerance test in non-diabetic rats.
GroupZero30 Minutes60 Minutes120 Minutes
Sham control82.83 ± 6.61151.83 ± 28.20157.17 ± 12.05 #116.93 ± 7.52 #
Metformin-100 mg75.33 ± 2.96105.67 ± 25.6295.33 ± 12.33 *64.00 ± 8.14 *
A. paniculata-500 mg75.33 ± 4.26162.33 ± 32.13162.00 ± 10.50 #137.67 ± 21.17 #
Values are expressed in Mean ± SEM; Superscripts * # represent values at significant difference of p < 0.05 from sham control, metformin control and AP 500 mg respectively.
Table 5. Effect of A. paniculata on oral glucose tolerance test in diabetic rats.
GroupsZero Time30 Minutes60 Minutes120 Minutes150 Minutes
Sham control82.8 ± 6.61 n151.8 ± 28.2 n157.2 ± 12.1 n116.2 ± 7.5 n89.3 ± 6.4 n
Metformin 100 mg188.2 ± 64.4 n159.2 ± 45.4 n94.6 ± 26.8 n74.6 ± 12.9 n70.8 ± 11.6 n
Diabetic group421.0 ± 42.4 #*495.4 ± 64.1 #*466.4 ± 76.2 #*423.4 ± 85.6 #*362.4 ± 78.9 #*
A. paniculata-250 mg236.8 ± 108.7544.0 ± 19.1 #*490.0 ± 41.2 #*479.3 ± 46.5 #*358.5 ± 40.8 #*
A. paniculata-500 mg397.0 ± 125.3 *484.7 ± 75.3 #*454.7 ± 80.6 #*446.3 ± 98.7 #*377.3 ± 110.6 #*
Values are expressed in Mean ± SEM; Superscripts * represent values at significant difference of p < 0.05 from sham control, # represents values at signifinant difference of p < 0.05 from metformin control and n represents values at significant difference of p < 0.05 from diabetic group groups, respectively. Metformin, AP 250 mg and AP 500 mg are groups treated with 100 mg/kg metformin, 250 mg/kg A. paniculata and 500 mg/kg A. paniculata, respectively. The negative and sham controls are untreated diabetic and untreated non-diabetic groups, respectively.
Table 6. Effect of A. paniculata and metformin on Total and Direct Bilirubin in plasma.
GroupsTotal Bilirubin (μmol/L)Direct Bilirubin (μmol/L)
Sham control32.89 ± 1.722.02 ± 6.0 #n
Metformin-100 mg29.32 ± 2.4 n76.31 ± 8.0 *n
Diabetic group36.07 ± 1.1 #46.84 ± 0.4 *#
A. paniculata 250 mg42.46 ± 2.3 *#n111.96 ± 5.9 *#n
A. paniculata 500 mg24.94 ± 2.1 *n22.47 ± 1.0 #n
Values are expressed in Mean ± SEM; Superscripts * # n represent values at significant difference of p < 0.05 from sham control, metformin control and diabetic group groups, respectively. Metformin, AP 250 mg and AP 500 mg are groups treated with 100 mg/kg metformin, 250 mg/kg A. paniculata and 500 mg/kg A. paniculata, respectively. The negative and sham controls are untreated diabetic and untreated non-diabetic groups, respectively.
Table 7. Effect of A. paniculata and Metformin on ALP and ALT in plasma.
GroupALP (U/l)ALT (U/l)
Sham control187.99 ± 13.27 n68.52 ± 3.8 #
Metformin-100 mg233.13 ± 26.17 n86.68 ± 6.1 *
Diabetic group398.26 ± 77.56 *#77.24 ± 5.6
A. paniculata 250 mg356.96 ± 0.000 *79.12 ± 3.0
A. paniculata 500 mg392.8 ± 0.00 *#52.03 ± 13.2 #n
Values are expressed in Mean ± SEM; Superscripts * represent values at significant difference of p < 0.05 from sham control, # represents values at signifinant difference of p < 0.05 from metformin control and n represents values at significant difference of p < 0.05 from diabetic group groups, respectively. Metformin, AP 250 mg and AP 500 mg are groups treated with 100 mg/kg metformin, 250 mg/kg A. paniculata and 500 mg/kg A. paniculata, respectively. The negative and sham controls are untreated diabetic and untreated non-diabetic groups, respectively.
Table 8. Effect of A. paniculata and Metformin on Total Protein and Albumin.
GroupTotal Protein (g/L)Albumin (g/L)
Sham control68.26 ± 3.543.7 ± 4.1
Metformin-100 mg64.51 ± 4.436.1 ± 8.6
Diabetic group63.26 ± 3.045.5 ± 8.1
A. paniculata 250 mg68.60 ± 2.832.7 ± 0.21
A. paniculata 500 mg71.66 ± 5.122.9 ± 3.5 *n
Values are expressed in Mean ± SEM; Superscripts * represent values at significant difference of p < 0.05 from sham control, # represents values at signifinant difference of p < 0.05 from metformin control and n represents values at significant difference of p < 0.05 from diabetic group groups, respectively. Metformin, AP 250 mg and AP 500 mg are groups treated with 100 mg/kg metformin, 250 mg/kg A. paniculata and 500 mg/kg A. paniculata, respectively. The diabetic and sham controls are untreated diabetic and untreated non-diabetic groups, respectively.
Table 9. Effect of A. paniculata and metformin on HDL-cholesterol and LDL in plasma.
GroupHDL-Cholesterol (Mmol/L)LDL (Mmol/L)
Sham control1.51 ± 0.2 #4.07 ± 1.1 n
Metformin-100 mg2.87 ± 0.14 *2.59 ± 0.11 *n
Diabetic group1.67 ± 0.22 #6.61 ± 0.50 *#
A. paniculata 250 mg1.69 ± 0.346.78 ± 1.1 #
A. paniculata 500 mg0.07 ± 1.41 *#n5.66 ± 1.1 #
Values are expressed in Mean ± SEM; Superscripts * represent values at significant difference of p < 0.05 from sham control, # represents values at signifinant difference of p < 0.05 from metformin control and n represents values at significant difference of p < 0.05 from diabetic group groups, respectively. Metformin, AP 250 mg and AP 500 mg are groups treated with 100 mg/kg metformin, 250 mg/kg A. paniculata and 500 mg/kg A. paniculata, respectively. The negative and sham controls are untreated diabetic and untreated non-diabetic groups, respectively.
Table 10. Effect of A. paniculata and metformin on Triglyceride and Cholesterol in plasma.
GroupTriglyceride (Mmol/L)Cholesterol (Mmol/L)
Sham control0.48 ± 0.134.5 ± 1.8 n
Metformin-100 mg1.19 ± 0.475.04 ± 0.99 n
Diabetic group1.14 ± 0.298.80 ± 0.38 *#
A. paniculata 250 mg0.64 ± 0.198.77 ± 0.89 *
A. paniculata 500 mg0.44 ± 0.075.94 ± 0.92
Superscripts * represent values at significant difference of p < 0.05 from sham control, # represents values at signifinant difference of p < 0.05 from metformin control and n represents values at significant difference of p < 0.05 from diabetic group groups, respectively. Metformin, AP 250 mg and AP 500 mg are groups treated with 100 mg/kg metformin, 250 mg/kg A. paniculata and 500 mg/kg A. paniculata, respectively. The negative and sham controls are untreated diabetic and untreated non-diabetic groups, respectively.
Table 11. Effect of A. paniculata and metformin on potassium and inorganic phosphorus in plasma.
GroupPotassium (mEg/L)Inorganic Phosphorus (Mmol/L)
Sham control10.67 ± 0.14 #n5.22 ± 1.3
Metformin-100 mg13.99 ± 1.8 *n4.80 ± 0.74
Diabetic group6.55 ± 0.61 *#3.64 ± 0.56
A. paniculata 250 mg7.53 ± 0.50 *#3.78 ± 1.50
A. paniculata 500 mg7.33 ± 0.99 *#3.87 ± 0.89
Superscripts * represent values at significant difference of p < 0.05 from sham control, # represents values at signifinant difference of p < 0.05 from metformin control and n represents values at significant difference of p < 0.05 from diabetic group groups, respectively. Metformin, AP 250 mg and AP 500 mg are groups treated with 100 mg/kg metformin, 250 mg/kg A. paniculata and 500 mg/kg A. paniculata, respectively. The negative and sham controls are untreated diabetic and untreated non-diabetic groups, respectively.
Table 12. Effect of A. paniculata and Metformin on Creatinine in plasma.
GroupCreatinine (μmol/L)
Sham control73.5 ± 2.2
Metformin-100 mg90.19 ± 8.8
Diabetic group81.69 ± 13.2
A. paniculata 250 mg91.5 ± 0.00 *#n
A. paniculata 500 mg75.02 ± 5.8
Superscripts * represent values at significant difference of p < 0.05 from sham control, # represents values at signifinant difference of p < 0.05 from metformin control and n represents values at significant difference of p < 0.05 from diabetic group groups, respectively. Metformin, AP 250 mg and AP 500 mg are groups treated with 100 mg/kg metformin, 250 mg/kg A. paniculata and 500 mg/kg A. paniculata, respectively. The negative and sham controls are untreated diabetic and untreated non-diabetic groups, respectively.
Publisher’s Note: MDPI stays neutral with regard to jurisdictional claims in published maps and institutional affiliations.

