Article

The COMPASS-COVID-19-ICU Study: Identification of Factors to Predict the Risk of Intubation and Mortality in Patients with Severe COVID-19

by
Grigoris T. Gerotziafas
1,2,*,
Patrick Van Dreden
2,3,
Douglas D. Fraser
4,5,6,7,
Guillaume Voiriot
8,
Maitray A. Patel
9,
Mark Daley
9,10,
Alexandre Elabbadi
8,
Aurélie Rousseau
1,3,
Yannis Prassas
11,
Matthieu Turpin
8,
Marina Marchetti
12,
Loula Papageorgiou
1,2,
Evangelos Terpos
13,14,
Meletios A. Dimopoulos
13,14,
Anna Falanga
12,15,
Jawed Fareed
16,
Muriel Fartoukh
8 and
Ismail Elalamy
1,2,17
1
Research Team “Cancer-Hemostasis-Angiogenesis”, Research Group “Cancer Biology and Therapeutics”, Centre de Recherche Saint Antoine (CRSA), Institut Universitaire de Cancérologie, Faculty of Medicine, Sorbonne University, 75012 Paris, France
2
Thrombosis and Haemostasis Centre, Biological Hematology Department, Hôpital Tenon, Assistance Publique-Hôpitaux de Paris (AP-HP), Sorbonne Université, 75012 Paris, France
3
Clinical Research Department, Diagnostica Stago, 92036 Gennevilliers, France
4
Lawson Health Research Institute, London, ON N6C 2R5, Canada
5
Department of Pediatrics, Western University, London, ON N6A 3K7, Canada
6
Department of Physiology and Pharmacology, Western University, London, ON N6A 3K7, Canada
7
Department of Clinical Neurological Sciences, Western University, London, ON N6A 3K7, Canada
8
Service de Médecine Intensive Réanimation, Hôpital Tenon, Département Médico-Universitaire APPROCHES, Assistance Publique-Hôpitaux de Paris (AP-HP), Sorbonne Université, 75020 Paris, France
9
Department of Computer Science, Western University, London, ON N6A 3K7, Canada
10
The Vector Institute for Artificial Intelligence, Toronto, ON M5G 1M1, Canada
11
Department of Pathology and Laboratory Medicine, Mount Sinai Hospital, Toronto, ON M5G 1X5, Canada
12
Immunohematology and Transfusion Medicine Department, ASST Papa Giovanni XXIII Hospital, 24127 Bergamo, Italy
13
Department of Clinical Therapeutics, Alexandra General Hospital, 11528 Athens, Greece
14
School of Medicine, National and Kapodistrian University of Athens, 11528 Athens, Greece
15
School of Medicine, University of Milan Bicocca, 20126 Monza, Italy
16
Cardiovascular Research Institute, Loyola University Chicago Health Sciences Campus, Maywood, IL 60153, USA
17
Department of Obstetrics and Gynecology, I.M. Sechenov First Moscow State Medical University, 119435 Moscow, Russia
*
Author to whom correspondence should be addressed.
Hemato 2022, 3(1), 204-218; https://doi.org/10.3390/hemato3010017
Submission received: 7 December 2021 / Revised: 16 February 2022 / Accepted: 1 March 2022 / Published: 9 March 2022
(This article belongs to the Section Coagulation)

Abstract

:
In some patients, SARS-CoV-2 infection induces cytokine storm, hypercoagulability and endothelial cell activation leading to worsening of COVID-19, intubation and death. Prompt identification of patients at risk of intubation is an urgent need. Objectives. To derive a prognostic score for the risk of intubation or death in patients with COVID-19 admitted in intensive care unit (ICU), by assessing biomarkers of hypercoagulability, endothelial cell activation and inflammation and a large panel of clinical analytes. Design, Setting and Participants. A prospective, observational study enrolled 118 patients with COVID-19 admitted in the ICU. On the first day of ICU admission, all patients were assessed for biomarkers (protein C, protein S, antithrombin, D-Dimer, fibrin monomers, FVIIa, FV, FXII, FXII, FVIII, FvW antigen, fibrinogen, procoagulant phospholipid dependent clotting time, TFPI, thrombomodulin, P-selectin, heparinase, microparticles exposing TF, IL-6, complement C3a, C5a, thrombin generation, PT, aPTT, hemogram, platelet count) and clinical predictors. Main Outcomes and Measures. The clinical outcomes were intubation and mortality during hospitalization in ICU. Results: The intubation and mortality rates were 70% and 18%, respectively. The COMPASS-COVID-19-ICU score composed of P-Selectin, D-Dimer, free TFPI, TF activity, IL-6 and FXII, age and duration of hospitalization predicted the risk of intubation or death with high sensitivity and specificity (0.90 and 0.92, respectively). Conclusions and Relevance. COVID-19 is related to severe endothelial cell activation and hypercoagulability orchestrated in the context of inflammation. The COMPASS-COVID-19-ICU risk assessment model is accurate for the evaluation of the risk of mechanical ventilation and death in patients with critical COVID-19. The COMPASS-COVID-19-ICU score is feasible in tertiary hospitals and could be placed in the diagnostic procedure of personalized medical management and prompt therapeutic intervention.

1. Introduction

Severe acute respiratory syndrome coronavirus 2 (SARS-CoV-2) causes coronavirus disease 2019 (COVID-19), characterized by acute pneumonia which may progress to respiratory failure requiring intubation and may have a fatal outcome [1,2]. SARS-CoV-2 invades host human cells by binding of the spike protein (S-protein) to the angiotensin-converting enzyme 2 (ACE 2) receptor by means of the transmembrane protease serine 2 (TMPRSS2) [3,4,5,6,7]. Endothelial cells, cardiomyocytes, Type I and Type II alveolar epithelial cells in human lung tissue express ACE2 and TMPRSS2 and are targets of SARS-CoV-2 [8,9]. The SARS-CoV-2 and the cells affected by the virus trigger immune response and the cytokine storm. Infiltration, accumulation, and activation of defense cells (i.e., neutrophils, monocytes, lymphocytes, macrophage and dendritic cells) amplify the immune reaction and cytokine secretion. The cytokine IL-6 together with TNF are among the major effectors of the cytokine storm in COVID-19. The infection with SARS-CoV-2 induces activation of the complement system, which further promotes inflammation. The anaphylatoxins C3a and C5a are also major contributors to cytokine storm [10,11]. Subsequent tissue damage can initiate the kinin formation, the activation of the contact system and the intrinsic pathway of blood coagulation composed of plasma prekallikrein (PPK), the nonenzymatic cofactor “high molecular weight kininogen” (HMWK) and the clotting factors XII (FXII) and XI (FXI) [12,13]. Cleavage of free HMWK by plasma kallikrein releases bradykinin, a potent inflammatory mediator and activator of the complement and contact system [14]. Platelet activation and neutrophil extracellular traps are also involved in the pathogenesis of immunothrombosis in COVID-19. The polyphosphates (polyP) released by activated platelets appear to play major role in FXII activation [15]. SARS-CoV-2 may also directly induce activation of coagulation through the highly conserved main proteinase (Mpro) [16,17]. Initiation of a vicious cycle of thrombin generation may lead to consumption of natural coagulation inhibitors; antithrombin (AT), protein C (PC) and protein S (PS). Heparanase is a proinflammatory and proangiogenic protein, capable of degrading heparan sulfate chains both at cell surface and at the extracellular matrix [18]. Glycocalyx degradation that leads to decreased endothelial nitric oxide production is critical for platelet accumulation [19]. Augmented expression of heparanase can boost both the innate and adaptive immune system and propagate inflammatory reactions which could be relevant to severe presentations of COVID-19 [20]. Figure 1 summarizes the principal mechanisms triggered by SARS-CoV-2 infection, leading to hypercoagulability and pulmonary intravascular coagulation.
While most people infected with SARS-CoV-2 remain asymptomatic or develops only mild COVID-19, approximately 5% of patients present critical COVID-19 requiring admission to an intensive care unit (ICU) [2,21,22]. In these patients, the intubation rate is up to 80% and the mortality ranges from 20% to 40%. Prompt identification of patients at risk of disease worsening is a challenging issue [23,24].
Machine learning is a valuable tool to respond to big COVID-19 datasets, which may contribute to further improvement of the accuracy in the identification of the most susceptible patients who could benefit from prompt personalized therapeutic interventions [25,26,27].
The prospective, observational study ROADMAP-COVID-19 (pROspective Risk Assessment anD bioMArkers of hyPercoagulability for the identification of patients with COVID-19 at risk for disease worsening) was conducted aiming to derive a prognostic score for the risk of intubation or death in patients with critical COVID-19 by assessing biomarkers of hypercoagulability, endothelial cell activation and inflammation and a large panel of clinical analytes.

2. Methods

2.1. Participants

ICU-COVID-19 group: The ROADMAP-COVID-19 study was conducted at the Tenon University Hospital Paris and enrolled all admitted patients in the ICU from March 2020 to July 2020. All patients had laboratory-confirmed COVID-19 infection as defined elsewhere [28]. Disease worsening requiring ICU admission was defined according to the criteria published elsewhere [29]. Pregnant women, and patients younger than 18 years were not enrolled in the study. All patients with COVID-19 routinely received standard prophylactic dose of enoxaparin (4000 anti-Xa IU once daily s.c.) upon hospital admission. Patients admitted in ICU received intermediate dose of body weight-adapted enoxaparin.
Control group: The control group consisted of 30 healthy individuals, with the same age as patients. All subjects provided informed written consent before inclusion in the study.
Ethics: The study was conducted in accordance with the Helsinki declaration, and all patients received healthcare according to the recommended institutional practice during COVID-19 pandemic. All hematological tests were performed in the frame of routine monitoring of patients. This is a non-interventional data-based study, using the care data collected during patients stay, involving all the consecutive critically ill COVID-19 patients admitted to the ICU in Tenon Hospital during the pandemic. There is no processing of indirectly identifiable data, or chaining with data from other sources, or long-term patient follow-up for this research. This study was approved by the institutional review board of Sorbonne University (Reference CER-2020-54) according to the French regulations. All participants (or their relatives) gave consent to participate.
Outcomes: The clinical outcomes of the study were intubation and death during hospitalization in ICU.
Blood sample collection and plasma preparation. Blood was collected, at the 1st day of ICU admission, from a peripheral vein using a 19-Gauge needle at BD vacutainer tubes (Becton Dickinson, Franklin Lakes, NJ, USA; 3.8% sodium citrate 109 mMol/L or EDTA 5.4 mg). Platelet-poor plasma (PPP) was prepared within 1 h of blood collection by double centrifugation (2 × 20 min at 2000× g) at room temperature and stored in aliquots at −80 °C until analysis.

2.2. Biomarkers of Hypercoagulability, Endothelial Activation and Inflammation

Protein C (PC), protein S (PS), antithrombin (AT), D-Dimer and fibrin monomers (FM), factor VIIa (FVIIa), Factor V (FV), Factor XII (FXII), Factor VIII (FVIII), Factor von Willebrand antigen (FvW), Fibrinogen, procoagulant phospholipid-dependent clotting time (PPL-ct) Free TFPI, plasma thrombomodulin (TM) were measured with commercially available assays from Diagnostica Stago, (Asnières, France) on a STA®-R analyzer. P-selectin and heparanase were measured with ELISA kits from Cusabio Biotech (CliniSciencies, Nanterre, France) and R&D Systems (Lille, France), respectively. The procoagulant activity of microparticles exposing TF (MP-TF) was measured by Zymuphen MP-TF from Hyphen Biomed (Neuville sur Oise, France). Kininogen levels in PPP were measured by Human Kininogen ELISA Kit (BioVision, Inc., Milpitas, CA, USA) and IL-6 by Human IL-6 ELISA kit, ThermoFisher (Scientific, Asnieres-sur-Seine, France). Complement C3a and C5a were measured with ELISA kit. Thrombin generation in PPP triggered by PPP-Reagent High® was measured with the Calibrated Automated Thrombogram (CAT) Diagnostica Stago. Thrombogram parameters were analyzed lag-time (LT): time to peak (ttPeak), peak (Peak), endogenous thrombin potential (ETP), and mean rate index (MRI). Prothrombin time (PT) and activated partial thromboplastin time (aPTT) with STA-neoPT and STA-PTT-automat (Diagnostica Stago). Hemogram and platelet count were assessed using the Sysmex XN-3100 instrument (Paris, France).

2.3. Statistical Analysis

A number of patients had to provide statistical power for the derivation of an accurate score by responding to the following criteria: (a) the model had to be constructed according to the rule of thumb, the so-called events per variable (EPV) 10-1, (b) less than 10 variables should be included in the model in order for it to be easy to use [30,31,32]. Patients with missing data (clinical variables or biomarkers) were excluded from the analysis. Values of biomarkers measured in the cohort of patients were compared against values measured in the control group. When comparisons were required, continuous variables were assessed using Mann–Whitney U tests; a p-value < 0.05 was considered statistically significant. Separate random forest classifiers were trained on variables to predict intubation and mortality. During training, the random forest classifier performed an implicit feature selection; the top features are those that appear highest ranked in the most trees. To reduce overfitting, the number of trees were limited to ten, the maximum depth of each tree was limited to three, and a three-fold cross validation approach was used [33,34,35]. To remain conservative and to limit the risk of overfitting further, no hyperparameters were tuned or optimized by design and intent. The samples were split into two stratified training (70%) and validation sets (30%), one set for intubation and another for mortality with their respective features. A Boruta feature reduction method, based on random forest classifiers, was then used to develop two models, one for intubation and one for mortality, using the training dataset [36]. The latter provided the two respective models with the least number of features providing the most accurate prediction ability. The reduced variable sets were then visualized with a nonlinear dimensionality reduction on the full data matrix using the t-distributed stochastic nearest neighbor embedding (t-SNE) algorithm [37]. The t-SNE assumes that the “optimal” representation of the data lies on a manifold with complex geometry, but with low dimension, embedded in the full-dimensional space of the raw data. Receiver operating characteristic (ROC) curves were conducted with the random forest to determine sensitivity and specificity of the reduced variable sets for predicting their binary outcome, either intubation or mortality. To avoid circular analysis and reduce overfitting, the reduced model was tested using the validation dataset and a random forest classifier with ten trees, maximum depth of three, and three-fold cross validation. When evaluating the diagnostic ability of a test to discriminate the binary outcomes of the subjects, areas under the curve [>0.90 are generally considered to provide excellent accuracy classification, while 0.80–0.89 are considered to provide very good accuracy classification (with 1.0 being a ‘‘perfect’’ test and 0.5 attributed to ‘‘luck’’)] [38]. All clinical and biological data were cross-checked with the electronical files using the ORBIS software (Agfa Healthcare®, Paris, France) and the GLIMS laboratory information system (MIPS®, Paris, France) of Tenon University Hospital. Data analysis and statistics were performed with the “scikit-learn” module for Python 3.8.5 Open Source.

3. Results

3.1. Hypercoagulability, Cellular Activation and Inflammation Biomarkers

The derivation cohort consisted of 118 ICU patients who had no missing data out of 130 patients admitted in ICU during the study period. Baseline demographics and comorbidities of patients prior to hospital admission are reported in Table 1. The intubation rate was 70% and the mortality rate was 18% in the studied cohort, being similar in the ensemble of the ICU-admitted patients. The levels of biomarkers of hypercoagulability, cellular activation and inflammation in patients and controls are reported in Table 2.

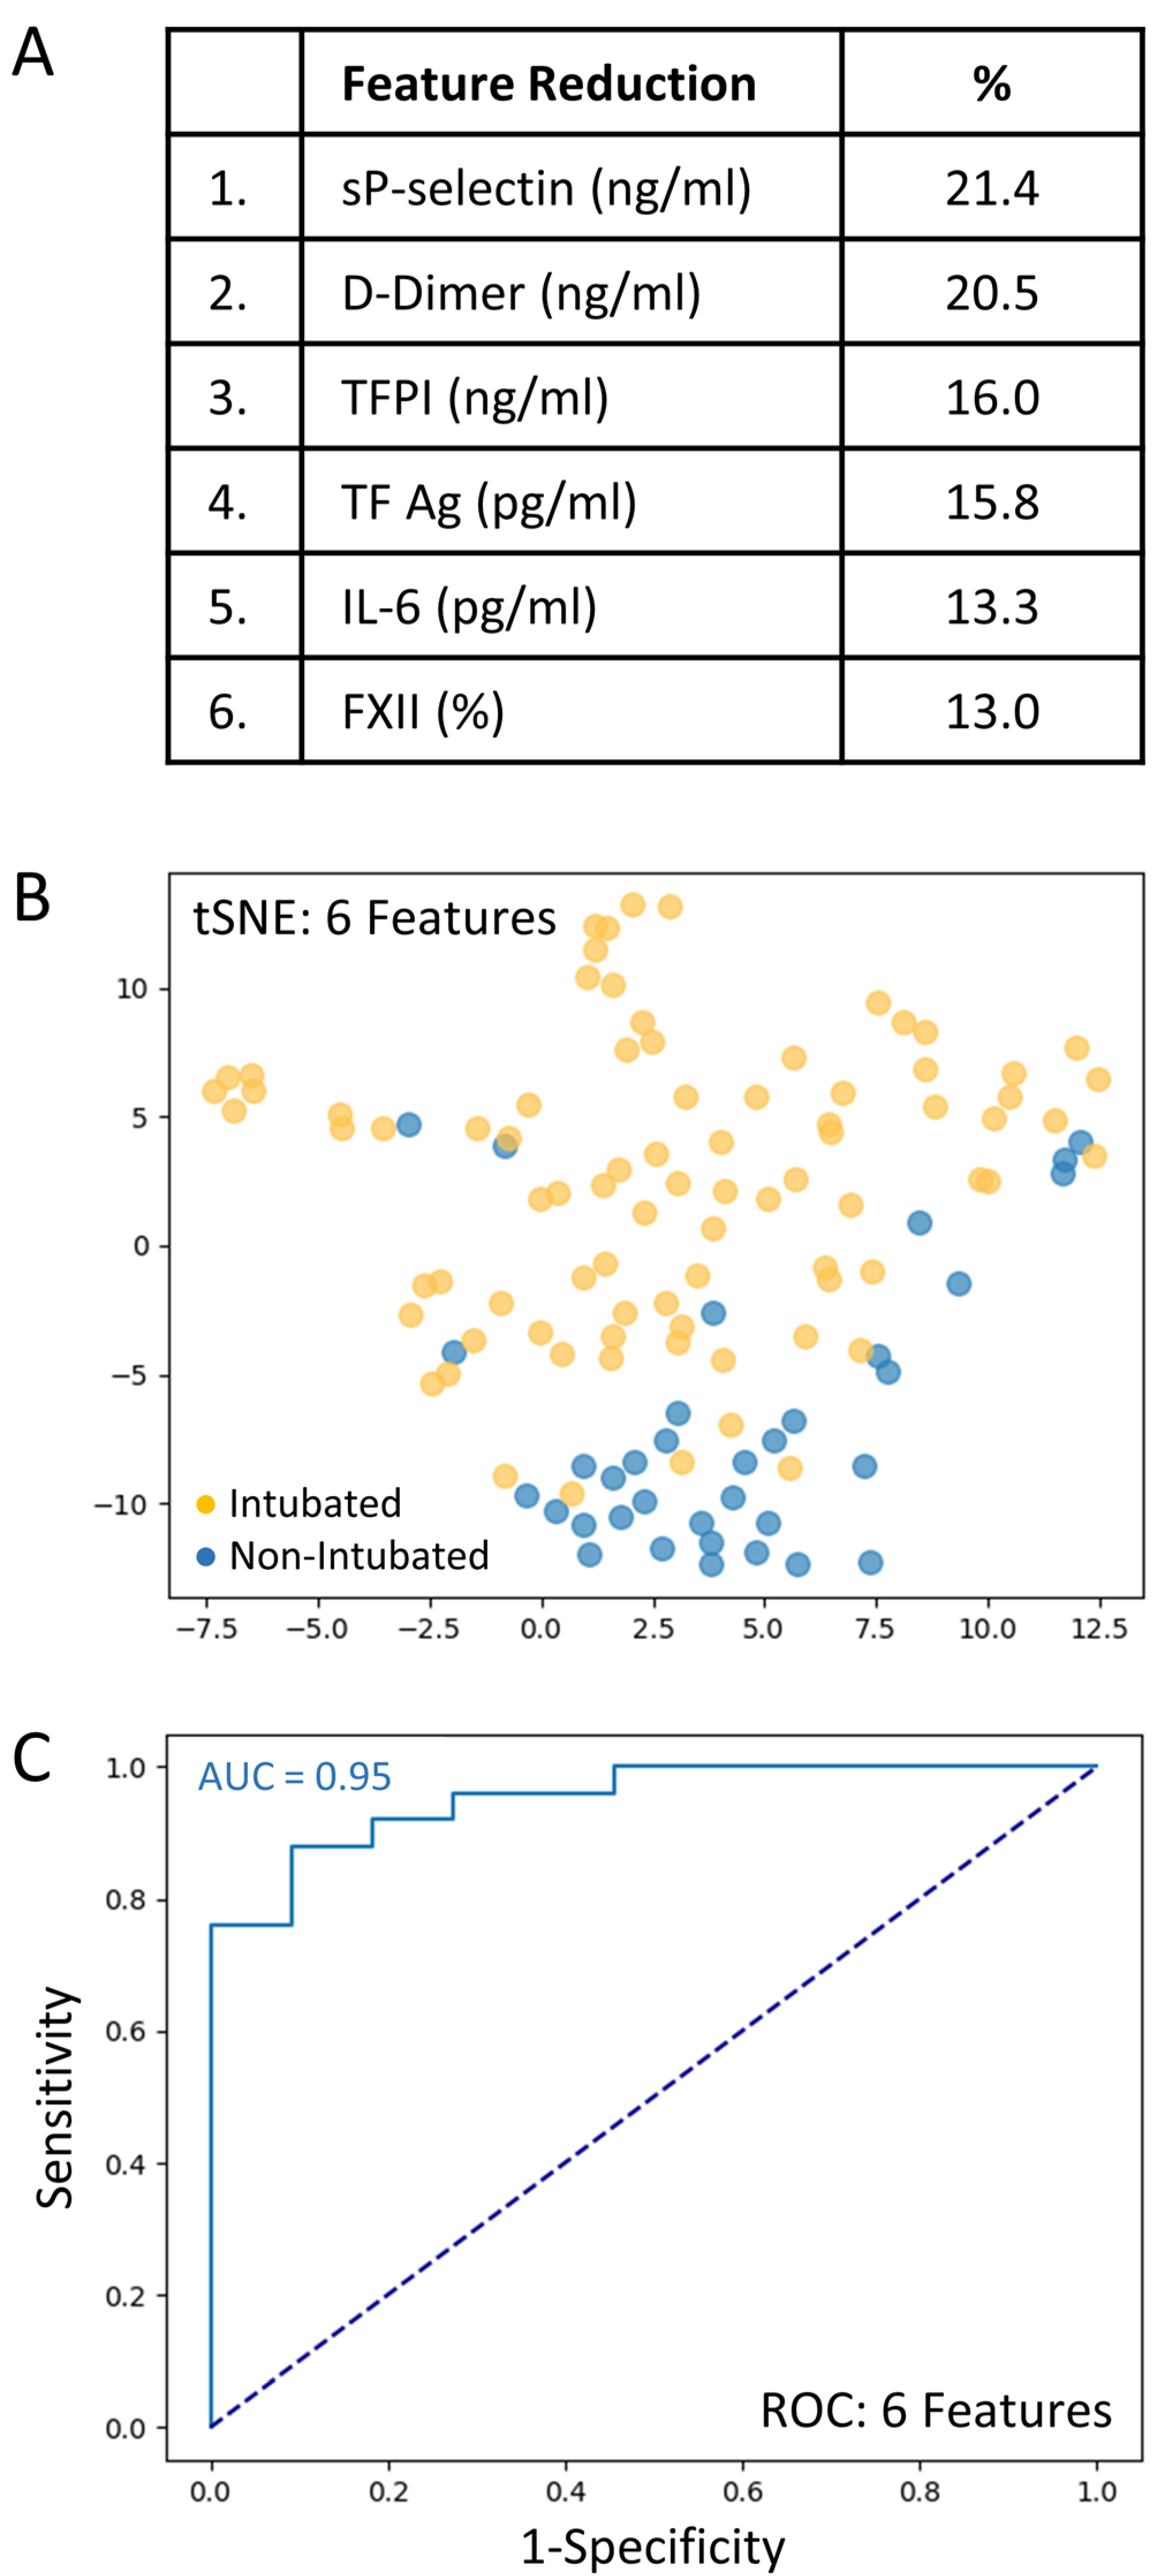
3.2. Risk Assessment for Intubation Using Machine Learning

A total set of 69 variables including clinical predictors (n = 28) and biomarkers (n = 41) was analyzed to determine those associated with intubation risk. Feature selection by way of random forest identified overall ranking, while feature reduction identified the top six variables with the greatest intubation prediction (Figure 2A). A t-SNE plot illustrating that the intubated COVID-19 patients were distinct and easily separable from non-intubated COVID-19 patients (Figure 2B). Given the imbalanced numbers between cohorts, intubated or not, we performed the more precise ROC curve analyses using only the top six variables (Figure 2C). The ‘excellent’ predictive ability of the top six variables for discriminating an intubated COVID-19 patient from a non-intubated one is shown (AUC = 0.95). The sensitivity and specificity were 0.90 and 0.92, respectively; positive predictive value (PPV) and negative predictive value (NPV) were 0.82 and 0.96, respectively. The cut-off values were: sP-Selectin > 21.5 ng/mL; D-Dimer > 1.347 ng/mL; TFPI > 21.3 ng/mL; TF activity > 72.8 pg/mL; IL-6 > 14.0 pg/mL; and FXII < 71.5%. Direct comparisons of the top six variables between intubated and non-intubated COVID-19 patients are shown in Table 3.

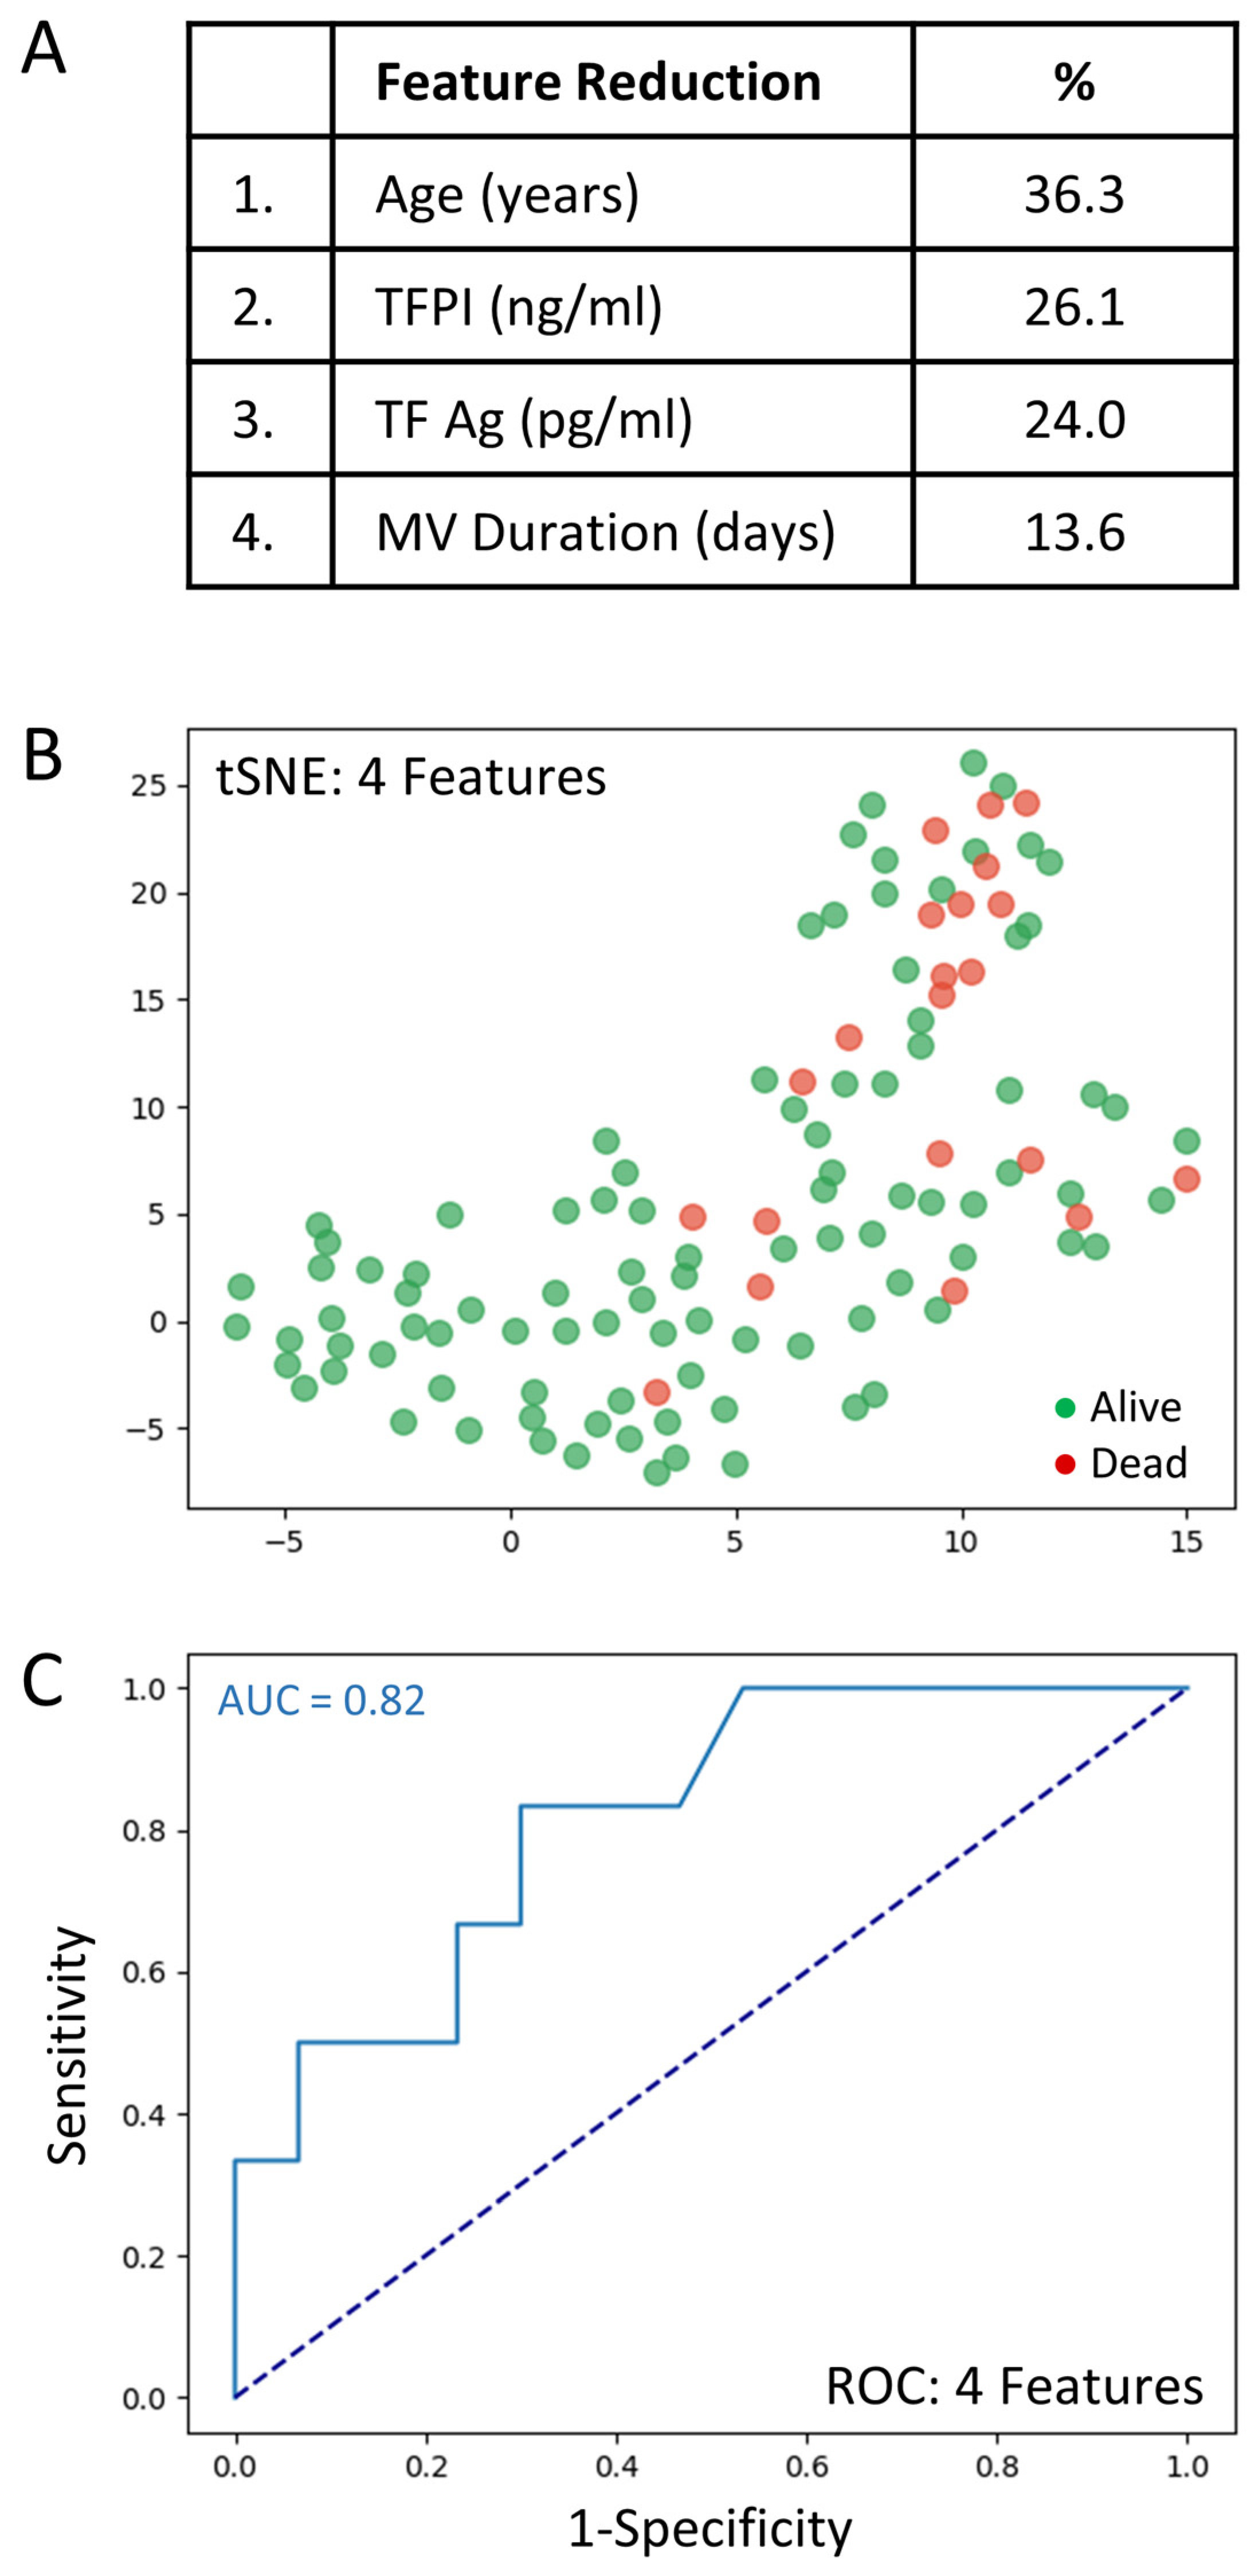
3.3. Risk Assessment for Death Using Machine Learning

The full set of 69 variables was analyzed to determine those associated with mortality. Feature selection by way of random forest identified overall ranking, while feature reduction identified the top four variables with the greatest mortality prediction (Figure 3A). A t-SNE plot illustrates that the COVID-19 patient cohort that died was distinct and separable from those COVID-19 patients that survived (Figure 3B). Given the imbalanced numbers between cohorts, dead or alive, we performed the more precise ROC curve analyses using only the top four variables (Figure 3C).
The very good predictive ability of the top four variables for discriminating COVID-19 patient mortality is shown (AUC = 0.82). The sensitivity and specificity were 0.91 and 0.75, respectively (PPV = 0.97 and NPV = 0.50). The cut-off values were: age > 69.5 years; TFPI > 35.1 ng/mL; TF Ag > 80.4 pg/mL; and mechanical ventilation duration > 1 days. Direct comparisons of the top 4 variables between COVID-19 patients that died or lived is shown in Table 4.
Figure 2 and Figure 3 represent two distinct models; generated separately but using the same methodologies. The data was identical in both models with the exception that MV duration was excluded for the intubation outcome. For intubation, the best model resulted in six features determined by the algorithm. For mortality, the best model resulted in 4 features determined by the algorithm. As such, Figure 2 and Figure 3 only represent the features of these best models.

4. Discussion

The observational cohort study ROADMAP-COVID-19 enrolled patients with severe COVID-19 fulfilling the criteria for ICU admission and provides a methodology for the identification of patients with COVID-19 at high risk for intubation or death using common clinical predictors and biomarkers of inflammation, hypercoagulability, and endothelial cell activation.
Critically ill patients with COVID-19 at the first day of ICU admission presented significant alterations of clotting factors and natural coagulation inhibitors. Patients, as compared to healthy controls, showed significant decrease in factor XII, which is the origin of aPTT prolongation and increase in HMWK, C5 and C3. Patients also showed a significant decrease in factor VIIa, which was related with the prolongation of PT. The decrease in FVIIa could result from factor VII consumption following exaggerated TF pathway activation and/or increased inhibition of factor VIIa by AT. The consumption of AT observed in the patients’ cohort favors the second hypothesis, which needs to be explored by measuring the factor VIIa-AT complexes in patients’ plasma. The data presented herein underline the importance of exacerbated activation of contact phase and intrinsic clotting pathway and TF pathway in the disease worsening process [39,40,41,42]. As it was expected, the levels of IL-6, a major mediator of the cytokine storm and predictor of mortality was above the UNL in the vast majority of the patients.
In addition, patients with critical COVID-19 showed an important consumption of the natural coagulation inhibitors AT, protein C and protein S, which shifts the equilibrium of coagulation towards hypercoagulability.
Nevertheless, this shift was not reflected on thrombin generation measured with calibrated automated thrombogram most probably because of the increase in the TFPI levels (which inhibit the initiation phase of thrombin generation) as a consequence of endothelial cell activation.
P-Selectin, D-Dimer, free TFPI, TF activity, IL-6 and FXII, were identified as leading predictors for the intubation risk while the leading variables for death were age, free TFPI, TF activity and duration of hospitalization. The two panels of predictors showed excellent discrimination capacity for the intubation risk and the mortality risk with an AUC 0.95 and 0.82, respectively. The number of predictors included in the algorithm responds to the “rule of thumb” and warrants both feasibility and accuracy of the cut-offs. The designated biomarkers can be easily measured in tertiary hospitals using commercially available assays. Noteworthy, elevated D-Dimer was the strongest contributor in distinguishing COVID-19 status. As it was expected, patients who were intubated had higher levels of D-Dimer as compared to the patients who were not incubated. The increased levels of D-Dimers document an environment of sustained fibrin formation and lysis. Two systematic reviews highlight that D-dimer values are higher in non-survivors as well as in patients with severe COVID-19 than in those with mild disease showing the association between D-dimer levels and disease severity, or death [43,44]. Nevertheless, our data show that the predictive value of D-Dimers alone for intubation was weak. This finding is in line with the concept that D-dimers cannot be used as a stand-alone test for the evaluation of the risk of COVID-19 aggravation and mortality [44,45]. The derivation group was homogenous regarding the timing of the assessment (all patients were enrolled on the first day of ICU admission) and representative of the population of patients with severe COVID-19, since very limited exclusion criteria were applied. Demographics and epidemiological characteristics, the frequency of the underlying diseases, as well as the rate of intubation (70%) and mortality (18%) were similar to those reported in the literature, further supporting the generalizability of our findings [46,47]. These characteristics allow implementation of the COMPASS-COVID-19-ICU RAM across in tertiary hospitals.
The prospective design is an additional strength of ROADMAP-COVID-19 study, since a detailed registration of clinical variables was possible, and all analyzed patients were tested with the whole panel of the 41 biomarkers. Time-to-event analysis is considered as an optimal methodology for the elaboration of predictive scores, allowing for administrative censoring in a competing risk framework. However, this strategy was not applied, because both clinical end-points (intubation and death) occurred during hospitalization in ICU. Thus, the interval from inclusion to the endpoint occurrence is dictated by the usual stay in ICU. External validation is the optimal strategy to control the accuracy of predictive cut-offs. However, in light of the actual status of the pandemic, this validation strategy is practically impossible when taken into consideration with the persisting pressure on the ensemble of the ICU and the workload of the medical groups of the public healthcare system with which our group collaborates in France, as well as in other European countries and in North America. A validation study in an independent cohort consisting of patients hospitalized in the ICU is ongoing.
The COMPASS-COVID-19-ICU score applied on critically ill patients identified at least 95% and 82% of those at high risk for intubation or death, respectively.
The primary reason for intubation and ventilation in patients with COVID-19 is refractory hypoxia, likely exacerbated by pulmonary microvascular thrombosis resulting in ventilation/perfusion (V/Q) mismatch. Hence, the six variables retained in the model are markers of hypercoagulability, activation of platelets and endothelial cells as well as inflammation. Moreover, FXII together with TFa were retained in the model indicating that deterioration of patients with critical COVID-19 is associated with activation of both pathways of blood coagulation. Once again, the prognostic power of IL-6 levels became significant for intubation risk.
The data presented herein lead to the conclusion that deterioration of patients with critical COVID-19 is driven by endothelial cell activation and hypercoagulability. Thus, we assume that patients identified as high risk using the COMPASS-COVID-19-ICU model could be eligible for intensified antithrombotic treatment non-invasive ventilation/high-flow oxygen and prone positioning [47,48,49,50,51]. This strategy needs to be tested in a prospective clinical study. This has to be further analyzed, since it could orient the research of treatment development towards the discovery of agents that downregulate endothelial cell activation and the optimization of the antithrombotic treatment.
In conclusion, this study provides compelling evidence showing that critical COVID-19 is related with severe endothelial cell activation and hypercoagulability orchestrated in the context of inflammation. This study led to a comprehensive and accurate predictive model for the evaluation of the risk of mechanical ventilation and death in patients with critical COVID-19. Accurate prediction requires the full set of reduced variables. It is possible that a single multiplex immunoassay could be constructed to measure the identified biomarkers and predict outcome shortly after admission. Such prediction with COMPASS-COVID-19-ICU would aid resource mobilization, discussions with patients’ and their families, and help stratify patients for clinical trials and to apply personalized medical management and prompt therapeutic intervention. A future prospective clinical trial could be initiated to validate the identified biomarkers.

Author Contributions

G.T.G. has made substantial contributions to conception and design of the study, analysis and interpretation of data; G.T.G. also wrote the manuscript and has given final approval of the version to be published, and agreed to be accountable for all aspects of the work in ensuring that questions related to the accuracy or integrity of any part of the work are appropriately investigated and resolved. P.V.D. has made substantial contributions to conception and design of the study, analysis and interpretation of data, and contributed to the writing of the manuscript. D.D.F. has made substantial contribution by doing the statistical plan and the statistical analysis. G.V. has made substantial contribution in the enrollment of the patients, and participated in the design of the study. M.A.P. contributed to the statistical plan and the statistical analysis. M.D. contributed to the statistical plan and the statistical analysis. A.E. made significant contribution to the enrollment of the patients and the acquisition of the clinical data. A.R. participated in the realization and the quality control of the bioassays. Y.P. contributed to the statistical analysis. M.T. contributed to the statistical plan and the statistical analysis. M.M. critically revised the manuscript. L.P. contributed to the management of the plasma samples. E.T., M.A.D., A.F., J.F. and I.E. critically revised the manuscript. M.F. made substantial contribution to the design of the study. All authors have read and agreed to the published version of the manuscript.

Funding

There is no founding source for this study.

Institutional Review Board Statement

Not applicable.

Informed Consent Statement

The study was conducted in accordance with the Declaration of Helsinki, and approved by the Institutional Review Board of Sorbonne University (Reference CER-2020-54) according to the French regulations.

Data Availability Statement

G Gerotziafas had full access to all the data in the study and takes responsibility for the integrity of the data and the accuracy of the data analysis. After approval from the legal authorities of the Assistance Publique-Hôpitaux de Paris (APHP), data can be shared—after contacting GTG ([email protected])—with qualifying researchers who submit a proposal with a valuable research question. A contract should be signed.

Acknowledgments

The authors wish to express their gratitude to all medical, nursing and technological staff for serving with altruism in the front line of the COVID-19 center in Tenon University Hospital.

Conflicts of Interest

All authors except Patrick Van Dreden author have no conflict of interest to declare for this study. Patrick Van Dreden is an employee of Stago.

References

  1. Huang, C.; Wang, Y.; Li, X.; Ren, L.; Zhao, J.; Hu, Y.; Zhang, L.; Fan, G.; Xu, J.; Gu, X.; et al. Clinical features of patients infected with 2019 novel coronavirus in Wuhan, China. Lancet 2020, 395, 497–506. [Google Scholar] [CrossRef] [Green Version]
  2. Chen, N.; Zhou, M.; Dong, X.; Qu, J.; Gong, F.; Han, Y.; Qiu, Y.; Wang, J.; Liu, Y.; Wei, Y.; et al. Epidemiological and clinical characteristics of 99 cases of 2019 novel coronavirus pneumonia in Wuhan, China: A descriptive study. Lancet 2020, 395, 507–513. [Google Scholar] [CrossRef] [Green Version]
  3. Cui, J.; Li, F.; Shi, Z.-L. Origin and evolution of pathogenic coronaviruses. Nat. Rev. Microbiol. 2019, 17, 181–192. [Google Scholar] [CrossRef] [Green Version]
  4. Wu, F.; Zhao, S.; Yu, B.; Chen, Y.-M.; Wang, W.; Song, Z.-G.; Hu, Y.; Tao, Z.-W.; Tian, J.-H.; Pei, Y.-Y.; et al. A new coronavirus associated with human respiratory disease in China. Nature 2020, 579, 265–269. [Google Scholar] [CrossRef] [PubMed] [Green Version]
  5. Lu, R.; Zhao, X.; Li, J.; Niu, P.; Yang, B.; Wu, H.; Wang, W.; Song, H.; Huang, B.; Zhu, N.; et al. Genomic characterisation and epidemiology of 2019 novel coronavirus: Implications for virus origins and receptor binding. Lancet 2020, 395, 565–574. [Google Scholar] [CrossRef] [Green Version]
  6. Wan, Y.; Shang, J.; Graham, R.; Baric, R.S.; Li, F. Receptor Recognition by the Novel Coronavirus from Wuhan: An Analysis Based on Decade-Long Structural Studies of SARS Coronavirus. J. Virol. 2020, 94, e00127-20. [Google Scholar] [CrossRef] [Green Version]
  7. Hoffmann, M.; Kleine-Weber, H.; Schroeder, S.; Krüger, N.; Herrler, T.; Erichsen, S.; Schiergens, T.S.; Herrler, G.; Wu, N.-H.; Nitsche, A.; et al. SARS-CoV-2 Cell Entry Depends on ACE2 and TMPRSS2 and Is Blocked by a Clinically Proven Protease Inhibitor. Cell 2020, 181, 271–280.e8. [Google Scholar] [CrossRef]
  8. Hamming, I.; Timens, W.; Bulthuis, M.L.C.; Lely, A.T.; Navis, G.J.; van Goor, H. Tissue distribution of ACE2 protein, the functional receptor for SARS coronavirus. A first step in understanding SARS pathogenesis. J. Pathol. 2004, 203, 631–637. [Google Scholar] [CrossRef]
  9. Vaarala, M.H.; Porvari, K.S.; Kellokumpu, S.; Kyllönen, A.P.; Vihko, P.T. Expression of transmembrane serine protease TMPRSS2 in mouse and human tissues. J. Pathol. 2001, 193, 134–140. [Google Scholar] [CrossRef]
  10. Fraser, D.D.; Cepinskas, G.; Slessarev, M.; Martin, C.; Daley, M.; Miller, M.R.; O’Gorman, D.B.; Gill, S.E.; Patterson, E.K.; dos Santos, C.C. Inflammation Profiling of Critically Ill Coronavirus Disease 2019 Patients. Crit. Care Explor. 2020, 2, e0144. [Google Scholar] [CrossRef]
  11. Han, H.; Ma, Q.; Li, C.; Liu, R.; Zhao, L.; Wang, W.; Zhang, P.; Liu, X.; Gao, G.; Liu, F.; et al. Profiling serum cytokines in COVID-19 patients reveals IL-6 and IL-10 are disease severity predictors. Emerg. Microbes Infect. 2020, 9, 1123–1130. [Google Scholar] [CrossRef] [PubMed]
  12. Song, W.-C.; Fitzgerald, G.A. COVID-19, microangiopathy, hemostatic activation, and complement. J. Clin. Investig. 2020, 130, 3950–3953. [Google Scholar] [CrossRef] [PubMed]
  13. Colman, R.W.; Schmaier, A.H. Contact system: A vascular biology modulator with anticoagulant, profibrinolytic, antiadhesive, and proinflammatory attributes. Blood 1997, 90, 3819–3843. [Google Scholar] [CrossRef] [PubMed] [Green Version]
  14. Maglakelidze, N.; Manto, K.M.; Craig, T.J. A Review: Does Complement or the Contact System Have a Role in Protection or Pathogenesis of COVID-19? Pulm. Ther. 2020, 6, 169–176. [Google Scholar] [CrossRef] [PubMed]
  15. Baker, C.J.; Smith, S.A.; Morrissey, J.H. Polyphosphate in thrombosis, hemostasis, and inflammation. Res. Pract. Thromb. Haemost. 2018, 3, 18–25. [Google Scholar] [CrossRef]
  16. Yang, H.; Xie, W.; Xue, X.; Yang, K.; Ma, J.; Liang, W.; Zhao, Q.; Zhou, Z.; Pei, D.; Ziebuhr, J.; et al. Design of Wide-Spectrum Inhibitors Targeting Coronavirus Main Proteases. PLoS Biol. 2005, 3, e324. [Google Scholar] [CrossRef]
  17. Maas, C.; Renné, T. Coagulation factor XII in thrombosis and inflammation. Blood 2018, 131, 1903–1909. [Google Scholar] [CrossRef] [Green Version]
  18. Goodall, K.; Poon, I.; Phipps, S.; Hulett, M.D. Soluble Heparan Sulfate Fragments Generated by Heparanase Trigger the Release of Pro-Inflammatory Cytokines through TLR-4. PLoS ONE 2014, 9, e109596. [Google Scholar] [CrossRef]
  19. Fraser, D.D.; Patterson, E.K.; Slessarev, M.; Gill, S.E.; Martin, C.; Daley, M.; Miller, M.R.; Patel, M.A.; dos Santos, C.C.; Bosma, K.J.; et al. Endothelial Injury and Glycocalyx Degradation in Critically Ill Coronavirus Disease 2019 Patients: Implications for Microvascular Platelet Aggregation. Crit. Care Explor. 2020, 2, e0194. [Google Scholar] [CrossRef]
  20. Nadir, Y.; Brenner, B. Relevance of Heparan Sulfate and Heparanase to Severity of COVID-19 in the Elderly. Semin. Thromb. Hemost. 2021, 47, 348–350. [Google Scholar] [CrossRef]
  21. Funtowicz, S.; Ravetz, J. Post-normal science. In Encyclopedia of Ecological Economics; International Society for Ecological Economics: Boston, MA, USA, 2003. [Google Scholar]
  22. Massaro, G.; Lecis, D.; Martuscelli, E.; Chiricolo, G.; Sangiorgi, G.M. Clinical Features and Management of COVID-19-Associated Hypercoagulability. Card Electrophysiol. Clin. 2022, 14, 41–52. [Google Scholar] [CrossRef] [PubMed]
  23. Gerotziafas, G.T.; Sergentanis, T.N.; Voiriot, G.; Lassel, L.; Papageorgiou, C.; Elabbadi, A.; Turpin, M.; Vandreden, P.; Papageorgiou, L.; Psaltopoulou, T.; et al. Derivation and Validation of a Predictive Score for Disease Worsening in Patients with COVID-19. Thromb. Haemost. 2020, 120, 1680–1690. [Google Scholar] [CrossRef] [PubMed]
  24. van Dam, P.M.E.L.; Zelis, N.; van Kuijk, S.M.J.; Linkens, A.E.M.J.H.; Brüggemann, R.A.G.; Spaetgens, B.; van der Horst, I.C.C.; Stassen, P.M. Performance of prediction models for short-term outcome in COVID-19 patients in the emergency department: A retrospective study. Ann. Med. 2021, 53, 402–409. [Google Scholar] [CrossRef] [PubMed]
  25. Alimadadi, A.; Aryal, S.; Manandhar, I.; Munroe, P.B.; Joe, B.; Cheng, X. Artificial intelligence and machine learning to fight COVID-19. Physiol. Genom. 2020, 52, 200–202. [Google Scholar] [CrossRef] [PubMed]
  26. Fraser, D.D.; Slessarev, M.; Martin, C.M.; Daley, M.; Patel, M.A.; Miller, M.R.; Patterson, E.K.; O’Gorman, D.B.; Gill, S.E.; Wishart, D.S.; et al. Metabolomics Profiling of Critically Ill Coronavirus Disease 2019 Patients: Identification of Diagnostic and Prognostic Biomarkers. Crit. Care Explor. 2020, 2, e0272. [Google Scholar] [CrossRef]
  27. Fraser, D.D.; Cepinskas, G.; Patterson, E.K.; Slessarev, M.; Martin, C.; Daley, M.; Patel, M.A.; Miller, M.R.; O’Gorman, D.B.; Gill, S.E.; et al. Novel Outcome Biomarkers Identified with Targeted Proteomic Analyses of Plasma from Critically Ill Coronavirus Disease 2019 Patients. Crit. Care Explor. 2020, 2, e0189. [Google Scholar] [CrossRef]
  28. Rubin, G.D.; Ryerson, C.J.; Haramati, L.B.; Sverzellati, N.; Kanne, J.P.; Raoof, S.; Schluger, N.W.; Volpi, A.; Yim, J.-J.; Martin, I.B.; et al. The role of chest imaging in patient management during the COVID-19 pandemic: A multinational consensus statement from the fleischner Society. Chest 2020, 158, 106–116. [Google Scholar] [CrossRef]
  29. Phua, J.; Weng, L.; Ling, L.; Egi, M.; Lim, C.-M.; Divatia, J.V.; Shrestha, B.R.; Arabi, Y.M.; Ng, J.; Gomersall, C.D.; et al. Intensive care management of coronavirus disease 2019 (COVID-19): Challenges and recommendations. Lancet Respir. Med. 2020, 8, 506–517. [Google Scholar] [CrossRef]
  30. Hendriksen, J.M.T.; Geersing, G.J.; Moons, K.G.M.; de Groot, J. Diagnostic and prognostic prediction models. J. Thromb. Haemost. 2013, 11, 129–141. [Google Scholar] [CrossRef]
  31. Harrell, F.E., Jr.; Lee, K.L.; Mark, D.B. Multivariable prognostic models: Issues in developing models, evaluating assumptions and adequacy, and measuring and reducing errors. Stat. Med. 1996, 15, 361–387. [Google Scholar] [CrossRef]
  32. Peduzzi, P.; Concato, J.; Kemper, E.; Holford, T.R.; Feinstein, A.R. A simulation study of the number of events per variable in logistic regression analysis. J. Clin. Epidemiol. 1996, 49, 1373–1379. [Google Scholar] [CrossRef]
  33. Tang, C.; Garreau, D.; Luxburg, U. When do random forests fail? In Proceedings of the 32nd International Conference on Neural Information Processing Systems, Montréal, QC, Canada, 3–8 December 2018; Curran Associates Inc.: Red Hook, NY, USA, 2018; pp. 2987–2997. [Google Scholar]
  34. Hastie, T.; Tibshirani, R.; Friedman, J. The Elements of Statistical Learning, 2nd ed.; Springer: Berlin/Heidelberg, Germany, 2008; ISBN 0-387-95284-5. [Google Scholar]
  35. Cawley, C.G.; Talbot, N.L.C. On Over-fitting in Model Selection and Subsequent Selection Bias in Performance Evaluation. J. Mach. Learn. Res. 2010, 11, 2079–2107. [Google Scholar]
  36. Kursa, M.; Rudnicki, W. Feature Selection with the Boruta Package. J. Stat. Softw. 2010, 36, i02. [Google Scholar] [CrossRef] [Green Version]
  37. van der Maaten, L.; Hinton, G. Visualizing data using t-SNE. J. Mach. Learn. Res. 2008, 9, 2579–2605. [Google Scholar]
  38. Zhu, W.; Zeng, N.; Wang, N. Sensitivity, specificity, accuracy, associated confidence interval and ROC analysis with practical SAS® implementations. In Proceedings of the NESUG Proceedings: Health Care and Life Sciences, Baltimore, MD, USA, 14–17 November 2010; Available online: https://www.lexjansen.com/nesug/nesug10/hl/hl07.pdf (accessed on 4 March 2022).
  39. Wygrecka, M.; Birnhuber, A.; Seeliger, B.; Michalick, L.; Pak, O.; Schultz, A.-S.; Schramm, F.; Zacharias, M.; Gorkiewicz, G.; David, S.; et al. Altered fibrin clot structure and dysregulated fibrinolysis contribute to thrombosis risk in severe COVID-19. Blood Adv. 2021, 6, 1074–1087. [Google Scholar] [CrossRef]
  40. Ceballos, F.C.; Ryan, P.; Blancas, R.; Martin-Vicente, M.; Vidal-Alcántara, E.J.; Peréz-García, F.; Bartolomé, S.; Churruca-Sarasqueta, J.; Virseda-Berdices, A.; Martínez-González, O.; et al. Are Reduced Levels of Coagulation Proteins Upon Admission Linked to COVID-19 Severity and Mortality? Front. Med. 2021, 8, 718053. [Google Scholar] [CrossRef]
  41. Englert, H.; Rangaswamy, C.; Deppermann, C.; Sperhake, J.-P.; Krisp, C.; Schreier, D.; Gordon, E.; Konrath, S.; Haddad, M.; Pula, G.; et al. Defective NET clearance contributes to sustained FXII activation in COVID-19-associated pulmonary thrombo-inflammation. EBioMedicine 2021, 67, 103382. [Google Scholar] [CrossRef]
  42. Gerotziafas, G.T.; Catalano, M.; Colgan, M.-P.; Pecsvarady, Z.; Wautrecht, J.C.; Fazeli, B.; Olinic, D.-M.; Farkas, K.; Elalamy, I.; Falanga, A.; et al. Guidance for the Management of Patients with Vascular Disease or Cardiovascular Risk Factors and COVID-19: Position Paper from VAS-European Independent Foundation in Angiology/Vascular Medicine. Thromb. Haemost. 2020, 120, 1597–1628. [Google Scholar] [CrossRef]
  43. Short, S.A.P.; Gupta, S.; Brenner, S.K.; Hayek, S.S.; Srivastava, A.; Shaefi, S.; Singh, H.; Wu, B.; Bagchi, A.; Al-Samkari, H.; et al. d-dimer and Death in Critically Ill Patients with Coronavirus Disease 2019. Crit. Care Med. 2021, 49, e500–e511. [Google Scholar] [CrossRef]
  44. Gris, J.; Quéré, I.; Pérez-Martin, A.; Lefrant, J.; Sotto, A. Uncertainties on the prognostic value of D-dimers in COVID-19 patients. J. Thromb. Haemost. 2020, 18, 2066–2067. [Google Scholar] [CrossRef]
  45. Zhang, L. Response to “Uncertainties on the prognostic value of D-dimers in COVID-19 patients”. J. Thromb. Haemost. 2020, 18, 2067–2068. [Google Scholar] [CrossRef] [PubMed]
  46. Grasselli, G.; Greco, M.; Zanella, A.; Albano, G.; Antonelli, M.; Bellani, G.; Bonanomi, E.; Cabrini, L.; Carlesso, E.; Castelli, G.; et al. Risk Factors Associated with Mortality among Patients with COVID-19 in Intensive Care Units in Lombardy, Italy. JAMA Intern. Med. 2020, 180, 1345–1355. [Google Scholar] [CrossRef]
  47. Liu, Q.; Huang, N.; Li, A.; Zhou, Y.; Liang, L.; Song, X.; Yang, Z.; Zhou, X. Effect of low-dose aspirin on mortality and viral duration of the hospitalized adults with COVID-19. Medicine 2021, 100, e24544. [Google Scholar] [CrossRef] [PubMed]
  48. Chow, J.H.; Khanna, A.K.; Kethireddy, S.; Yamane, D.; Levine, A.; Jackson, A.M.; McCurdy, M.T.; Tabatabai, A.; Kumar, G.; Park, P.; et al. Aspirin Use Is Associated with Decreased Mechanical Ventilation, Intensive Care Unit Admission, and In-Hospital Mortality in Hospitalized Patients with Coronavirus Disease 2019. Anesthesia Analg. 2021, 132, 930–941. [Google Scholar] [CrossRef] [PubMed]
  49. Billett, H.H.; Reyes-Gil, M.; Szymanski, J.; Ikemura, K.; Stahl, L.R.; Lo, Y.; Rahman, S.; Gonzalez-Lugo, J.D.; Kushnir, M.; Barouqa, M.; et al. Anticoagulation in COVID-19: Effect of Enoxaparin, Heparin, and Apixaban on Mortality. Thromb. Haemost. 2020, 120, 1691–1699. [Google Scholar] [CrossRef]
  50. Tang, N.; Bai, H.; Chen, X.; Gong, J.; Li, D.; Sun, Z. Anticoagulant treatment is associated with decreased mortality in severe coronavirus disease 2019 patients with coagulopathy. J. Thromb. Haemost. 2020, 18, 1094–1099. [Google Scholar] [CrossRef]
  51. Parisi, R.; Costanzo, S.; Di Castelnuovo, A.; de Gaetano, G.; Donati, M.B.; Iacoviello, L. Different Anticoagulant Regimens, Mortality, and Bleeding in Hospitalized Patients with COVID-19: A Systematic Review and an Updated Meta-Analysis. Semin. Thromb. Hemost. 2021, 47, 372–391. [Google Scholar] [CrossRef]
Figure 1. The principal mechanisms triggered by SARS-CoV-2 infection leading to hypercoagulability and pulmonary intravascular coagulation. GAG, glycosaminoglycans; HMWK, high-molecular-weight kininogen; IL, interleukin; INF, interferon; NET, neutrophil extracellular trap; PK, plasma kallikrein; PPK, plasma prekallikrein.
Hemato 03 00017 g001
Figure 2. The top six variables associated with intubation risk of critically ill patients with COVID-19. (A): Feature reduction demonstrating the top six patient variables that classify COVID-19 intubation status, with their % association. (B): COVID-19 patients plotted in two dimensions following dimensionality reduction in their top six patient variables by stochastic neighbor embedding (tSNE). Orange dots represent intubated COVID-19 patients, whereas blue dots represent non-intubated COVID-19 patients. The dimensionality reduction shows that based on the top six patient variables, the two cohorts are distinct and easily separable. The axes are dimensionless. (C): Receiver operating characteristic (ROC) curve analysis of COVID-19 patients, intubated or non-intubated, using the top six patient variables, demonstrates an area-under-the-curve (AUC) of 0.95. The diagonal broken dark blue line represents chance (AUC 0.50). The cut-off values were: sP-Selectin > 21.5 ng/mL; D-Dimer > 1.47 ng/mL; TFPI > 21.3 ng/mL; TF activity > 72.8 pg/mL; IL-6 > 14.0 pg/mL; and FXII < 71.5%.
Hemato 03 00017 g002
Figure 3. The top four clinical variables associated with COVID-19 patient mortality. (A): Feature reduction demonstrating the top four patient variables that classify COVID-19 outcome status, dead or alive, with their % association. (B): COVID-19 patients plotted in two dimensions following dimensionality reduction in their top four patient variables by stochastic neighbor embedding (tSNE). Red dots represent COVID-19 patients that died, whereas green dots represent COVID-19 patients that survived. The dimensionality reduction shows that based on the top four patient variables, the two cohorts are distinct and separable. The axes are dimensionless. (C): Receiver operating characteristic (ROC) curve analysis of COVID-19 patient outcomes, dead or alive, using the top four patient variables, demonstrates an area-under-the-curve (AUC) of 0.82. The diagonal broken dark blue line represents chance (AUC 0.50). The cut-off values were: age > 69.5 years; TFPI > 35.1 ng/mL; TF Ag > 80.4 pg/mL; and mechanical ventilation duration > 1 days.
Hemato 03 00017 g003
Table 1. Demographic and clinical data from patients with COVID-19 admitted in ICU.
VariablesICU-COVID-19 Patients
(n = 118)
Demographic Data
Age (age in years)62.0 (52.3, 70.0)
Sex (male)82/118 (69%)
Body mass index27.6 (25.6, 30.1)
Cardiovascular risk factors and disease
Obesity (BMI > 30)15/118 (13%)
Diabetes37/118 (31%)
Hypertension70/118 (59%)
Cardiovascular disease26/118 (22%)
Stroke74/118 (63%)
Obliterating arterial disease of the lower limbs4/118 (3%)
Acute myocardial infraction17/118 (14%)
Regular tobacco use10/118 (8%)
Non-vascular comorbidities
Active cancer4/118 (3%)
Chronic Renal Disease9/118 (8%)
Dialysis in patients with chronic renal disease6/118 (5%)
Acute renal failure18/118 (15%)
Dialysis in patients with acute renal failure8/118 (7%)
Chronic obstructive pulmonary disease4/118 (3%)
Chronic respiratory insufficiency9/118 (8%)
Sickle cell anemia2/118 (2%)
Personal history of VTE3/118 (3%)
Antithrombotic treatment before hospital admission
Anticoagulant treatment5/118 (4%)
Antiplatelet treatment26/118 (22%)
ICU related complication
Hemoptysis3/118 (3%)
Choc53/118 (45%)
EER Dialysis23/118 (19%)
All Infections47/118 (40%)
Outcome
Death21/118 (18%)
Intubation83/118 (70%)
Table 2. Levels of biomarkers of hypercoagulability, cellular activation, and inflammation in patients with critical COVID-19 and controls. Values are median (range).
Normal Reference RangeControl Group
(n = 30)
ICU-COVID-19 Patients
(n = 118)
Complete blood count
Red blood cell count ×106/μL4.32–5.72 4.20 (2.82–6.32)4.17 (2.46–6.07)
White blood cell count4.0–10.06.20 (3.87–8.43)7.88 (2.20–72.46) *
Hematocrit (%)35.0–47.039 (38–46)34 (21–46)
Hemoglobin (g/dL)12.0–16.011.6 (12.2–14.3)11.9 (7–15.8)
Platelet count (×109/L)150–400220 (180–350)214 (48–490) **
Neutrophil count (%)1.5–7.04.5 (2.2–7.5)6.3 (0.78–21.6) *
Eosinophils (×109/L)0.03–0.70.05 (0.02–0.09)0.01 (0–0.84)
Basophil count (%)<0.10.3 (0.1–0.6)1.0 (0–1) *
Lymphocyte count (%)1.5–4.02.10 ± 0.96 (1.8–2.12)0.75 (0.13–1110) *
Monocyte count (%)0.1–1.00.11 (0.1–0.3)0.29 (0.07–5.8) *
Routine coagulation tests
aPTT (ratio Patient/Control)<1.211.11 (0.9–1.2)1.24 (0.81–3.02) *
PT (s)<13.6 s11.2 (10–12)14.7 (11.9–34.7) *
Fibrinogen (g/L)1.8–4.02.41 ± (2–4)6.97 (3.95–10.0) *
Thrombin generation parameters
lag-time (min)2.1–3.82.5 (2.4–3.2)2.59 (1.4–5.7)
tt-Peak (min)4.0–6.65.0 (4–5.8)5.0 (3.1–16.7)
Peak (nM)222–330284 (230–300)253 (12–463) **
MRI (nM/min)60–120109 (80–120)107 (2–250)
ETP (nMxmin)1000–19001520 (1200–1800)1077 (115–2170) *
Intrinsic and extrinsic clotting pathway parameters
Factor V (%)70–12090 (80–110)121 (42–214) *
Factor VIIa (U/mL)65–13075 (68–120)24 (3–188) *
Factor VIII (%)50–150110 (90–120)143.0 (50–600) *
Factor XII (%)80–120105 (85–115)70 (30–178) *
Natural coagulation inhibitors
Protein C (%)68–11099 (85–110)93 (46–140) *
Protein S (%)70–11586 (75–110)59 (10–112) *
TFPI (ng/mL)8–1210 (9–11)31 (10–460) *
ATIII (%)80–12098 (90–110)92 (51–131) **
Fibrin degradation products
D-Dimers (μg/mL)<0.500.3 (0.2–0.4)1723 (305–20,000) *
Fibrin Monomer (μg/mL)0.5–5.502.5 (1.5–3.3)5 (5–150) *
Procoagulant phospholipids and platelet activation
PPL—ct (s)42–8563 (55–78)32 (13–68) *
P-selectin (ng/mL)82–4263 (50–75)28 (10–71) *
Endothelial cell activation
Factor von Willebrand (%)70–15090 (70–110)331 (43–764) *
TF (pg/mL)35–6049 (35–60)71 (17–323) *
TM (ng/mL))70–12090 (75–110)72 (37–482)
MP-TF+ (pg/mL)0.05–1.000.85 (0.6–1)1.90 (1.1–7.5) *
Heparanase (ng/mL)0.08–0.160.1 (0.8–1.15)0.15 (0.1–3.1)
Complement—Cytokine—Kininogen
HMWK (µg/mL)70–9077 (70–85)167 (89–800) *
C3a (ng/mL)880–28702100 (1200–2700)14,903 (1587–53,602) *
C5a (ng/mL)4.7–9.55.8 (4.8–9.2)6.1 (1.6–63.6) *
IL-6 (pg/mL)0–51.2 (0.8–1.515.6 (0.1–693) *
* p = 0.001, ** p = 0.01 versus the control group.
Table 3. Top six feature combination associated with intubation risk at patients with COVID-19 admitted in ICU. Continuous data are presented as medians (IQRs).
VariableNo Intubation (n = 35)Intubation (n = 83)p-Value *
sP-Selectin (ng/mL)19.5 (15.6, 27.5)29.9 (23.6, 41.1)<0.0001
D-Dimer (ng/mL)1124.0 (747.5, 1956.5)1878.0 (1448.0, 3243.0)0.0001
TFPI free (ng/mL)20.5 (18.7, 28.2)39.4 (27.0, 58.5)<0.0001
TF Ag (pg/mL)54.7 (42.8, 66.8)80.5 (59.9, 102.2)<0.0001
IL-6 (pg/mL)5.0 (1.3, 11.1)29.7 (7.9, 76.6)<0.0001
FXII (%)84.0 (73.5, 94.0)62.0 (47.0, 73.0)<0.0001
* intubation versus non intubation.
Table 4. Top four feature combination associated with mortality risk at patients with COVID-19 admitted in ICU. Continuous data are presented as medians (IQRs).
VariableAlive (n = 97)Dead (n = 21)p-Value *
Age (years)60 (51, 66)73 (70, 77)<0.0001
TFPI free (ng/mL)28.6 (20.8, 50.1)40.0 (35.4, 48.6) 0.057
TF Ag (pg/mL)66.4 (53.4, 94.6)89.5 (70.0, 115.4)0.044
Duration of hospitalization in ICU (days)0 (0, 0)8 (0, 8)<0.0001
* dead versus alive.
Publisher’s Note: MDPI stays neutral with regard to jurisdictional claims in published maps and institutional affiliations.

