Article

Experimental and Statistical Studies in the Development of Ketoprofen–Hydroxypropyl-β-Cyclodextrin Inclusion Complexes for Application in Compressed Tablets

by
Monica Stamate Cretan
1,
Lacramioara Ochiuz
1,*,
Camelia-Elena Iurciuc-Tincu
2,
Carmen Anatolia Gafițanu
1,
Alexandra Barsan (Bujor)
1,
Mousa Sha’at
1 and
Ciprian Stamate
3
1
Department of Pharmaceutical Technology, Faculty of Pharmacy, “Grigore T. Popa” University of Medicine and Pharmacy, 16 Universitatii Street, 700115 Iasi, Romania
2
Department of Natural and Synthetic Polymers, Faculty of Chemical Engineering and Protection of the Environment, “Gheorghe Asachi” Technical University, 73 Prof. Dr. Docent Dimitrie Mangeron Street, 700050 Iasi, Romania
3
Department of Mechatronics and Robotics, Faculty of Mechanical Engineering, “Gheorghe Asachi” Technical University of Iasi, Prof. Dr. Docent Dimitrie Mangeron Rd., No. 43, 700050 Iasi, Romania
*
Author to whom correspondence should be addressed.
Macromol 2026, 6(3), 58; https://doi.org/10.3390/macromol6030058
Submission received: 21 June 2026 / Revised: 28 July 2026 / Accepted: 1 August 2026 / Published: 5 August 2026

Abstract

Ketoprofen is a Biopharmaceutics Classification System (BCS) class II non-steroidal anti-inflammatory drug whose therapeutic performance is limited by its poor aqueous solubility, though complexation with cyclodextrins is a well-established strategy to overcome this limitation. The aim of this work was to prepare and characterize inclusion complexes of ketoprofen with HPβCD. Complexes were obtained by the solution (magnetic-stirring) method at ketoprofen–HPβCD molar ratios of 1:1 and 2:1 and were characterized by Fourier-transform infrared spectroscopy (FT-IR), differential scanning calorimetry (DSC), scanning electron microscopy (SEM) coupled with EDX, and computer-assisted dimensional analysis and statistics (AutoCAD/MathCAD). The bulk and tapped densities were used to derive the Carr index and the Hausner ratio, respectively. FT-IR showed attenuation and shifting of the characteristic C=O, C=C, and –CH bands of ketoprofen and the presence of the 1655 cm−1 band in complexes demonstrates inclusion. DSC revealed a marked reduction of the ketoprofen melting endotherm, the degree of inclusion reaching 75% (1:1) and 62% (2:1). SEM and statistical analysis confirm, individualized particles, predominantly 20–100 µm in perimeter size. The dissolution test showed a faster release of the complexes than in the case of pure ketoprofen. Therefore, HPβCD forms stable inclusion complexes with ketoprofen having pharmacotechnical properties suitable for compressed tablets.

1. Introduction

Ketoprofen drug suspensions are versatile pharmaceutical forms that can be used as such or can be included in solid pharmaceutical forms for both conventional and sustained release. From a pharmacotechnical point of view, the particles of drug suspensions must meet certain flow, compaction, dimensional and shape properties that influence both the technological process and bioavailability. All of these properties, as well as the solubility of the active substance, can be improved by complexation with HPβCD [1].
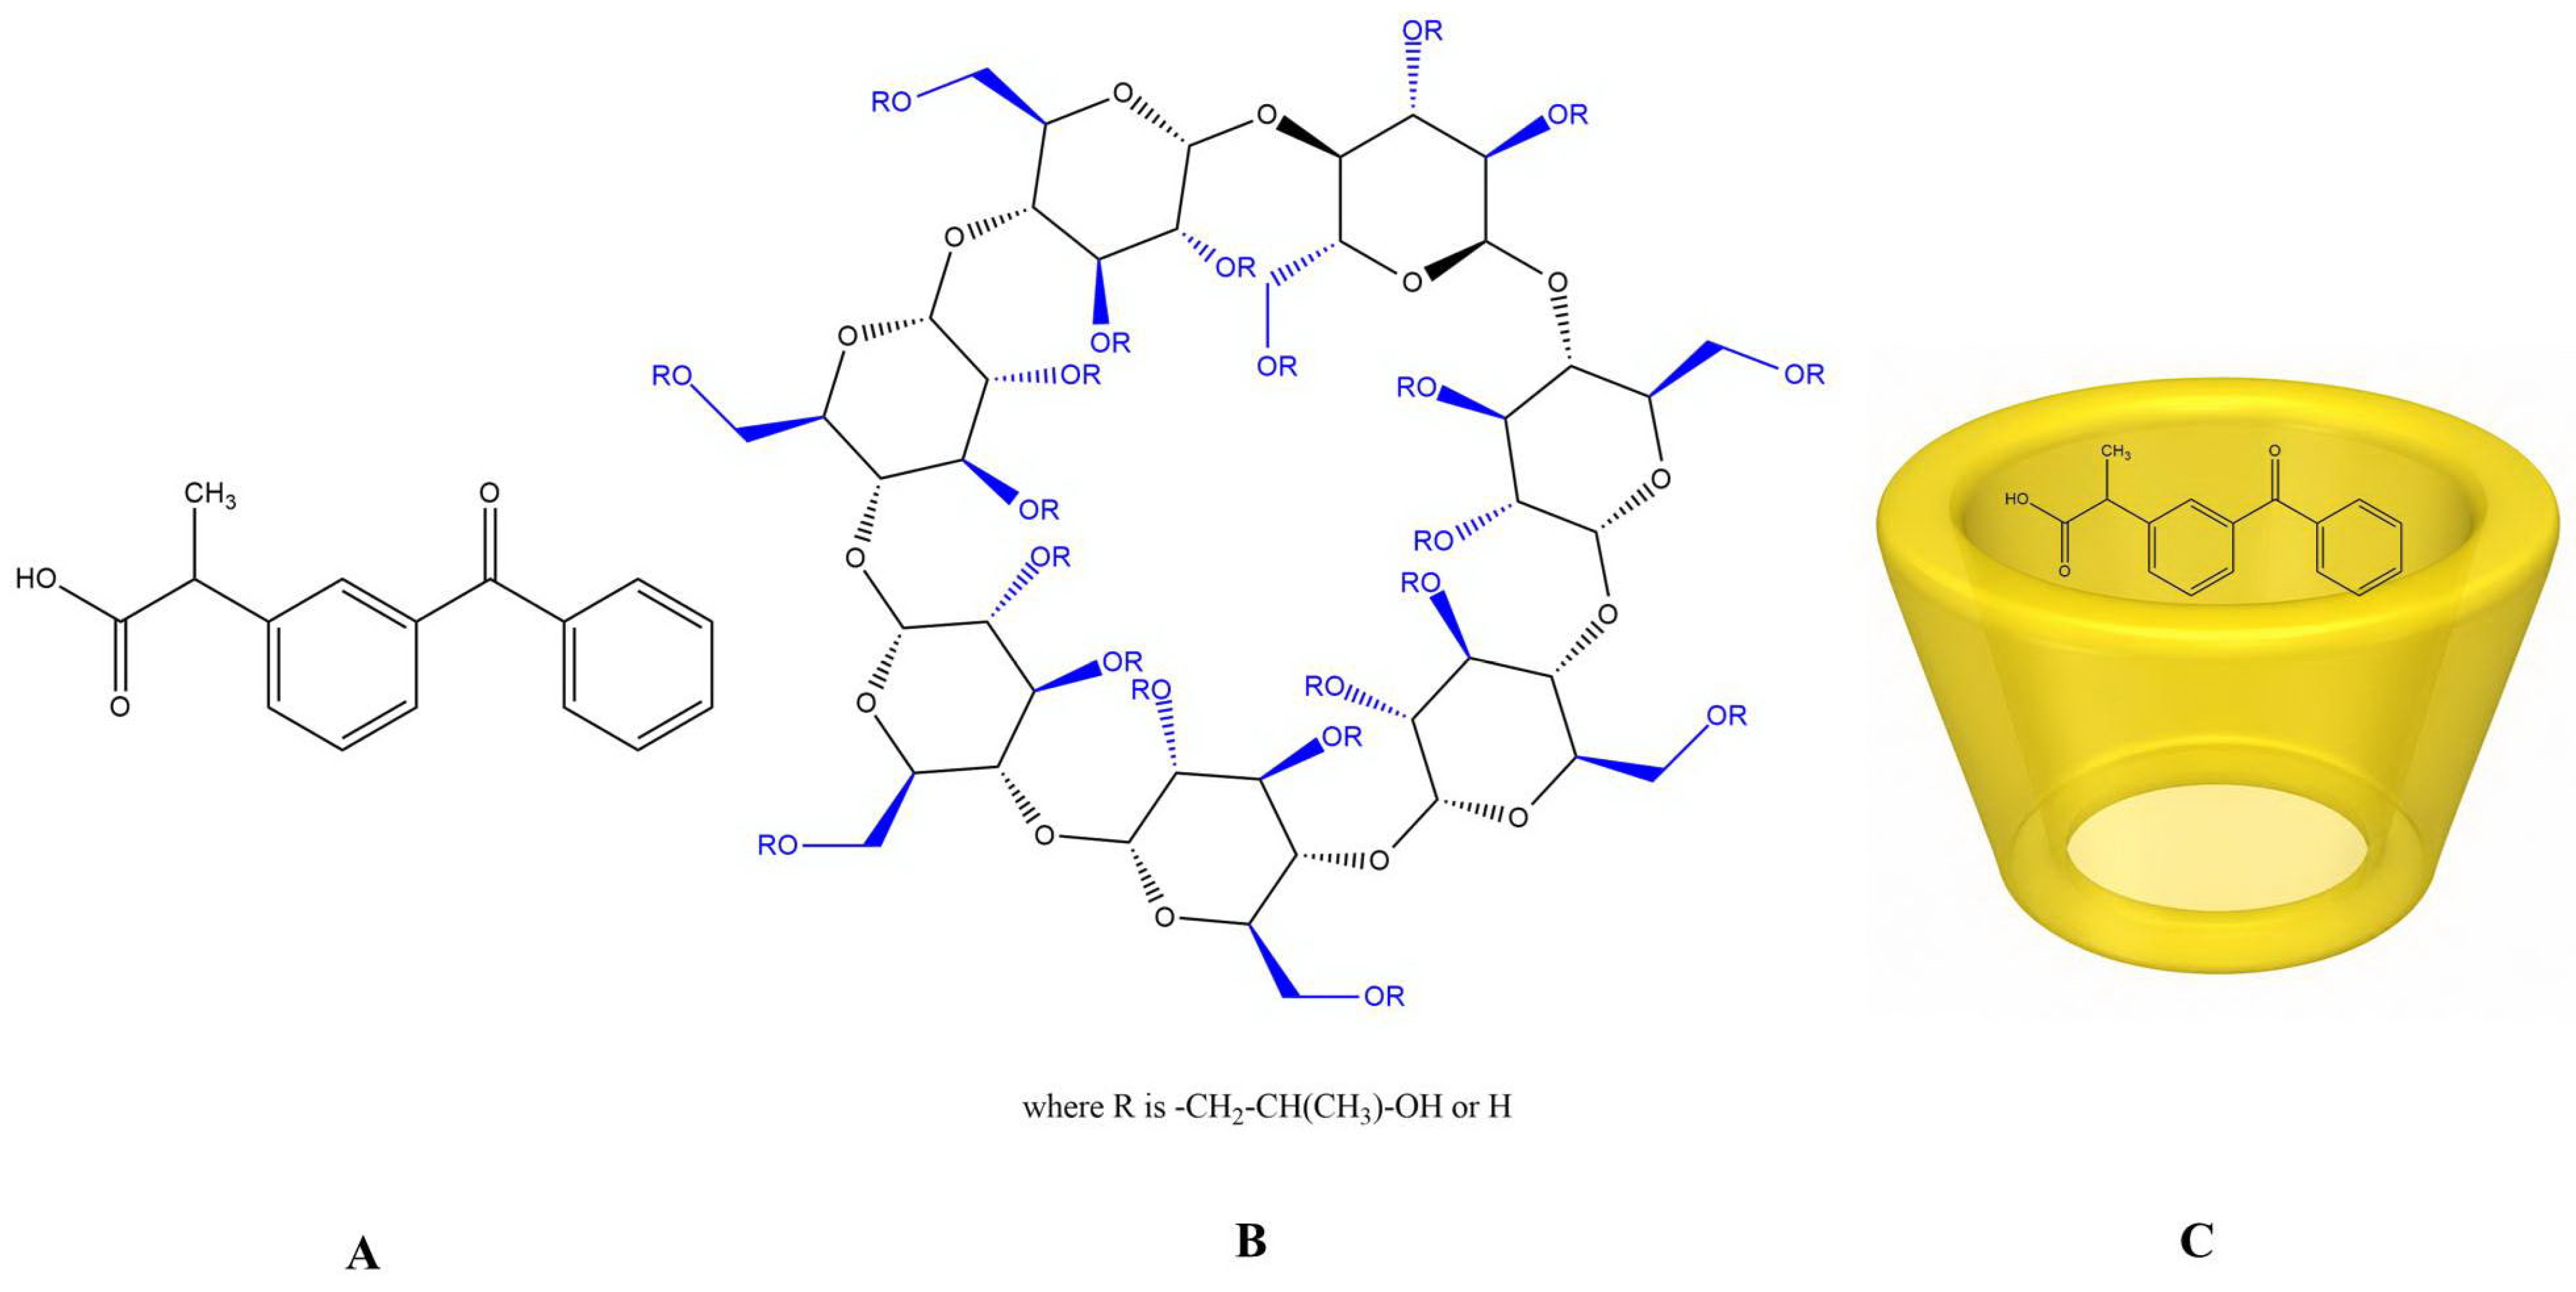
Ketoprofen is a nonsteroidal anti-inflammatory drug (NSAID) used for the treatment of pain, inflammation and fever. This drug is part of the class of aryl-propionic acid derivatives, along with other NSAIDs such as Ibuprofen and Naproxen. Ketoprofen is known as (RS)-2-(3-benzoylphenyl) propionic acid and its mechanism of action is the inhibition of cyclooxygenase enzymes (COX-1 and COX-2), reducing the synthesis of prostaglandins. Ketoprofen contains a substituted biphenyl aromatic nucleus, a ketone group (benzophenone) that contributes to the aromatic and lipophilic character, a carboxylic group (-COOH) that is responsible for the weak acidic character and a chiral center at the α-carbon of the propionic acid (Figure 1). The benzophenone group is linked to the propionic acid chain. The structural characteristics confer relatively high lipophilicity, good gastrointestinal absorption and low solubility in water. Regarding polymorphism, ketoprofen can exist in several crystalline forms, which have different stabilities, different dissolution rates and different bioavailabilities. This aspect is important in pharmaceutical formulation. In terms of solubility, ketoprofen is generally classified in class II of the Biopharmaceutical Classification System (BCS) with high permeability and low solubility. It is soluble in ethanol, methanol, chloroform, acetone and alkaline solutions. In water, at room temperature, the solubility is in the order of hundreds of mg/L, being considered low for pharmaceutical applications. The solubility of ketoprofen, which is a weak acid, is influenced by pH as follows: at acidic pH the non-ionized form predominates, which determines low solubility, and at basic pH the ionized form predominates, which ensures high solubility [2,3].
Ketoprofen is used for the treatment of rheumatic diseases such as rheumatoid arthritis; osteoarthritis and ankylosing spondylitis. It is used in the relief of musculoskeletal pain, postoperative pain, post-traumatic pain and dental pain. In therapy it is also indicated in the treatment of dysmenorrhea, fever and acute inflammations. Ketoprofen is a versatile drug that has been formulated in various pharmaceutical forms, such as extended release tablets, double-layer tablets, cryogels [4,5,6], topical gels, creams, patches, injectable solutions and suppositories.
Improving the solubility of ketoprofen is an important topic in pharmaceutical technology. To improve solubility and bioavailability, various methods have been used such as salt formation (ketoprofen sodium and ketoprofen lysinate); formation of solid dispersions in polymers such as polyvinylpyrrolidone, polyethylene glycol and hydroxypropyl methylcellulose; micronization; nanonization; inclusion in lipid systems (microemulsions, nanoemulsions and self-emulsifying systems); and formation of complexes with cyclodextrins. Each of these applied processes has certain advantages. Thus, salt formation ensures increased dissolution rate, faster absorption and a faster onset of the therapeutic effect. Solid dispersions reduce crystallinity, increase the contact surface, and ensure accelerated dissolution. Micronization and nanonization increase the specific surface area and increase the dissolution rate. Lipid systems provide increased bioavailability and improved intestinal absorption. Complexation with cyclodextrins provides increased solubility, reduced gastric irritation and improved stability [7,8].
For the complexation of ketoprofen with cyclodextrins, the most commonly used are β-cyclodextrin and hydroxypropyl-β-cyclodextrin. The mechanism of complexation with cyclodextrins consists in the inclusion of the hydrophobic ketoprofen molecule in the hydrophilic cavity of the cyclodextrin, which will facilitate dissolution in the aqueous medium. This approach allows for the obtaining of pharmaceutical forms with faster dissolution and improved therapeutic efficacy [9].
Hydroxypropyl-β-cyclodextrin (HPβCD) is a semisynthetic derivative of β-cyclodextrin, obtained by partial substitution of hydroxyl groups with hydroxypropyl groups [4,6]. Due to its high solubility in water and the ability to form inclusion complexes with hydrophobic molecules, HPβCD is one of the most widely used pharmaceutical excipients to improve the solubility, stability and bioavailability of poorly soluble active substances. HPβCD is derived from β-cyclodextrin, which is composed of seven D-glucopyranose units linked by α-(1–4) bonds [9].
Structurally, it has a hydrophilic exterior, a relatively hydrophobic interior cavity, and hydroxypropyl groups randomly distributed on the β-cyclodextrin molecules. Figure 1B represent the structure of HPβCD, made by ChemDraw program, in which all potentially substitutable hydroxyl positions are represented as OR groups, where R = H or CH2CH(OH)CH3. Figure 1B explicitly states that each hydroxyl position can remain unsubstituted or carry a hydroxypropyl group and that the substitution pattern is partial, heterogeneous and variable. This representation reflects the structural heterogeneity of commercially available HPβCD. By including ketoprofen in its cavity, HPβCD raises the apparent aqueous concentration of the drug—because the readily water-soluble inclusion complex dissolves to a greater extent than the uncomplexed crystalline solid—and reduces its tendency to crystallize. The exact molecular formula depends on the degree of substitution with hydroxypropyl groups. In practice, HPβCD is a mixture of molecules with different degrees of substitution, so that the average molecular weight can vary between approximately 1300 and 1600 g/mol, depending on the pharmaceutical product. HPβCD is much less crystalline than β-cyclodextrin and generally occurs in an amorphous form. This amphiphilic structure allows the incorporation of lipophilic molecules into its internal cavity through the formation of inclusion complexes [10,11].
One of the most important properties of HPβCD is its very high solubility in water. The exact values depend on the degree of substitution and temperature. HPβCD improves solubility by forming inclusion complexes, reducing the crystallinity of the active substance, increasing the dissolution rate, preventing recrystallization, and stabilizing the amorphous form. The main advantages of HPβCD are its very high solubility in water, low toxicity, good biological compatibility, increased bioavailability, reduced local irritation, and its stabilization of photosensitive and oxidizable drugs. Although considered safe, the use of HPβCD has certain limitations, including a higher production cost than β-cyclodextrin and the need for high molar ratios for certain drugs [12,13,14].
HP-β-CD is one of the most important modern pharmaceutical excipients. Its unique structure, characterized by a hydrophobic cavity and a hydrophilic exterior, gives it the ability to form inclusion complexes with many poorly soluble active substances (Figure 2). Due to its very high water solubility, biocompatibility and low toxicity, HPβCD is widely used to increase the solubility, stability and bioavailability of drugs, including ketoprofen [15,16,17]. The hydrophobic aromatic moiety of ketoprofen can be accommodated within the relatively non-polar cavity of HPβCD, where hydrophobic interactions and van der Waals forces contribute to complex stabilization. The polar carboxylic acid and ketone groups are expected to remain closer to the hydrophilic rim of the cyclodextrin and may form hydrogen bonds with the hydroxyl groups of HPβCD [18].
Most studies in the literature are based on the strict analysis of inclusion complexes by FT-IR, DSC, SEM and simple dissolution tests. In some articles [19], the formation of ketoprofen and hydroxypropyl beta cyclodextrin complexes is studied but only for a single molar ratio of 1:1 using ultrasonic stirring as the preparation method, because this reduces the time for complex formation. In our work we used two molar ratios, 1:1 and 2:1, to see exactly in which case ketoprofen is better included and if the amount of cyclodextrin used influences the analyzed pharmacotechnical parameters. We did not use ultrasonic stirring as the preparation method, because it has the disadvantage that particles with a size that is much too small are obtained, and the obtained powder agglomerates more easily. In our work, we used the magnetic stirring method to allow particles to form over time and with a larger size precisely to facilitate the flow of the powder, its compactibility, and to avoid particle agglomeration, which would completely compromise the preparation of tablets with a uniform structure. The complexes obtained can be used as such or can be dissolved and the resulting solution can be administered directly or can be used for soaking, as is the case with hydrogels [20]. In studies on hydrogels, the emphasis is on analyzing their behavior, the degree of soaking, and especially on the release of the active substance [20]. In our work, the complexes obtained are analyzed as particles because they will be used further in modified release tablets where, by association with different solid excipients, the complexes should not influence the behavior of the powder that will subsequently be compressed.
Although ketoprofen–cyclodextrin systems, including ketoprofen–HPβCD complexes, have been reported previously, earlier studies focused mainly on solubility, stability constants, or anti-inflammatory activity and did not couple the physicochemical characterization of the complexes with a quantitative, image-based morphometric and pharmacotechnical assessment of the resulting powders. The novelty of the present work lies in combining the conventional spectroscopic and thermal characterization (FT-IR, DSC, SEM-EDX) with a computer-assisted (AutoCAD/MathCAD Express Prime, software version 3.0) dimensional and statistical analysis of the individual particles—form factor, elongation, circularity, compactness and orientation—and with the flow and compaction descriptors (Carr index, Hausner ratio) that govern the direct-compression behavior, thereby linking the supramolecular inclusion of ketoprofen in HPβCD to the technological performance required for compressed tablets.

2. Materials and Methods

2.1. Materials

The ketoprofen (C16H14O3) used in this study was purchased from Bidachem (Bidachem S.p.A., Bergamo, Italy), one of the world’s leading manufacturers of ketoprofen. This active substance was in the form of a white crystalline powder (purity ≥ 97%, density 1.2 g/cm3, melting point 94–97 °C, molecular weight 254.28 g/mol). Hydroxypropyl beta cyclodextrin (C63H112O42) used as a complexing agent for ketoprofen was purchased from Sigma-Aldrich (Sigma-Aldrich Chemie GmbH, Taufkirchen, Germany) as a white, amorphous powder (purity ≥ 98.8%, density 1.05–1.40 g/cm3, melting point 275 °C, molecular weight 1541.5 g/mol). The average degree of substitution (DS) of the hydroxypropyl-β-cyclodextrin used was ≈7 hydroxypropyl groups per β-cyclodextrin torus (molar substitution, MS ≈ 1.0), as derived from its average molecular weight of 1541.5 g/mol relative to that of β-cyclodextrin (1134.99 g/mol). Consistent with the statistical (random) substitution pattern of commercial HPβCD, these groups are distributed mainly over the secondary rim, with only a minor fraction (≈8–20%) located on the primary hydroxyls.

2.2. Sample Preparation

The formation of inclusion compounds with cyclodextrins is based on “host–guest” interactions in which the cyclodextrin acts as host and accepts a guest molecule into its cavity. Cyclodextrins complex a broad range of guests—including highly water-soluble organic molecules and even inorganic salts—and complexation increases the apparent (total dissolved) concentration of the guest because the inclusion complex is itself more soluble than the uncomplexed crystalline solid, rather than changing the intrinsic solubility of the drug molecule. In order to obtain inclusion complexes, the magnetic stirring method in solution was used, by which solutions of hydroxypropyl β-cyclodextrin were prepared in a concentration of 1.5% using distilled water, to which the active substance-ketoprofen was added in two molar ratios, 1:1 and 2:1. Specifically, 1.5 g of HPβCD was dissolved in 100 mL of distilled water (1.5% w/v; ≈0.97 mmol HPβCD), and ketoprofen was added to reach the 1:1 (0.247 g; 0.97 mmol) and 2:1 (0.494 g; 1.94 mmol) ketoprofen:HPβCD molar ratios. An MHK-4-3 ceramic stirrer (MHK-4-3 stirring system, MRC Laboratory Equipment, Harlow, UK) was used as the stirring system (3 positions, stirring speed up to 1600 rpm, heating capacity up to 50 °C). The mixtures were stirred at room temperature for 2 h. For the case of the experiment in which ketoprofen and HP-β-CD are used in a molar ratio of 1:1, the dissolution by stirring is complete, rapid and thermodynamically stable. A perfectly clear, transparent and homogeneous solution is obtained. The aromatic nucleus of ketoprofen enters the central hydrophobic cavity of HP-β-CD, forming a monomolecular inclusion complex. As the exterior of HP-β-CD is branched with hydrophilic hydroxypropyl groups, the entire supramolecular assembly hydrates instantly. Thus, the solubility of ketoprofen increases when compared with that in pure water. Although it is a clear solution, filtration is necessary to remove any microscopic impurities. For the case of the experiment in which ketoprofen and HP-β-CD are used in a molar ratio of 2:1, the system is supersaturated in active substance, and the dissolution by stirring will be incomplete, resulting in a biphasic system. A cloudy solution (suspension) is obtained, with fine particles of ketoprofen that are uniformly dispersed upon stirring and or settle to the bottom of the Berzelius beaker, in the absence of stirring. Ketoprofen and HP-β-CD mainly form complexes with 1:1 stoichiometry. When the components are added in a 2:1 ratio, exactly half of the amount of ketoprofen will be taken up and dissolved by inclusion by the available HP-β-CD. The other half (50%) of the added ketoprofen powder remains uncomplexed. As the free form of ketoprofen has a very low native solubility in water, it cannot dissolve and remains in a solid state. This suspension requires filtration to remove the uncomplexed ketoprofen and any impurities. Each of the two solutions obtained will be individually filled into capsules and dried in an oven at 50 °C until precipitates are obtained (solvent evaporation, without any antisolvent precipitation or freeze-drying step). The resulting complexes were stored in brown containers for further characterization.

2.3. Experimental Techniques

2.3.1. FT-IR Spectroscopic Characterization

Fourier transform infrared (FT-IR) spectroscopic analysis was performed on the obtained samples to investigate the chemical interaction between ketoprofen and 2-hydroxypropyl beta cyclodextrin. The tests were performed using a Bruker Optics IFS 66 FT-IR spectrometer (IFS 66 FT-IR spectrometer, Bruker Optics, Billerica, MA, USA) equipped with a liquid nitrogen-cooled Ge detector (with a spectral resolution of 2 cm−1). An amount of 5 mg of each powder sample was mixed by trituration in a mortar with 500 mg KBr and then pressed into a disk shape. The samples were scanned at room temperature and in the standard range 400–4000 cm−1.

2.3.2. DSC Thermal Characterization

Differential scanning calorimetry (DSC) analysis was performed with DuPont DSC 910 equipment (DSC 910 thermal analyzer with 990701 controller, DuPont Instruments, Hixson, TN, USA). The apparatus uses argon, and heating was done at approximately 10 °C per minute, with a flow rate of approximately 35 cc/min. Indium was used to calibrate the temperature of the device. The melting enthalpy was calculated using the area of the endothermic peak recorded on the thermograms. The analysis of samples weighing 5 mg was done over a temperature range between 20 °C and 450 °C.
Using the peak area obtained within the D method, the melting enthalpy (ΔH) for ketoprofen and for the ketoprofen–HPβCD compounds obtained was calculated, according to the following Equation (1):
H = A E · m ,
where A = peak area (proportional to the energy exchanged by the sample);
E = calibration constant of the instrument (3.89);
m = amount of sample taken in the work (5 mg).
Using the values obtained for the melting energy of the unincorporated ketoprofen, the percentage of inclusion was calculated for the complexes obtained, considering the melting energy of the ketoprofen sample as 100%.

2.3.3. Microstructural Characterization

Microscopic analysis of ketoprofen–HPβCD complexes was performed using a Quanta 200 3D scanning electron microscope (Quanta 200 3D SEM, FEI Company, now part of Thermo Fisher Scientific, Osceola, FL, USA). Before analysis, the powder samples were glued onto supports and then coated with a thin layer of electrically conductive gold. The sample supports were inserted into the microscope chamber under a vacuum of 10−6 Torr and bombarded with accelerated electrons at a voltage of 3.5 kV.

2.3.4. Particles Size Analysis

Particle size and shape are decisive for the flow, compaction, and dissolution behavior of pharmaceutical powders and therefore for the quality of the final solid dosage form. The SEM micrographs of the complexes were imported into AutoCAD (Autodesk Inc., San Rafael, CA, USA), where the contour, projected area, perimeter and orientation angle of each individual particle were determined. The geometric data were then exported to MathCAD Prime, version 3.0 (PTC Inc., Boston, MA, USA), in which the shape descriptors were computed for every particle.
The descriptors used were the form factor (the ratio between the surface area of the particle and the surface area of a sphere of equal volume); the elongation (the ratio of the minimum to the maximum diameter, which tends to 1 for spherical particles and towards 0 for highly elongated ones); the circularity (a function of the perimeter and the area, equal to 1 for a perfect circle and smaller than 1 for irregular profiles); and the compactness factor (a function of the second polar moment of the particle and a circle of equal area A). The predominant particle morphology and its deviation from the spherical reference were estimated from these descriptors [21].

2.3.5. Statistical Analysis of Ketoprofen–HPβCD Complexes

The dimensional parameters of the particles were statistically analyzed using MathCAD Prime soft, version 3.0 and the mean values, medians, standard deviations and asymmetry indices were established on the histograms. To directly compare particle samples, cumulative curves (or cumulative distribution functionsCDFs) were plotted, which clearly showed what percentage of the total particles were below a certain size. The influence of perimeter and area on the circularity of the particles and the influence of the shape factor and orientation on the compaction factor were simulated as response surfaces. These two factors are very important in pharmacotechnical analysis, as they most influence the flow properties and compaction of a powder when it is intended to be used in solid pharmaceutical forms such as tablets.
Mathematically, the second-order polynomial regression model that defines the three-dimensional response surface for experimental data is based on an equation with two independent variables (X1 and X2) and one dependent variable (Y).
In the context of circularity analysis, the variables are defined as follows:
X1 = particle perimeter (µm);
X2 = particle area (µm2);
Y = estimated circularity (response variable).
In the context of compaction factor analysis, the variables are defined as follows:
X1 = particle orientation (grad);
X2 = particle form factor;
Y = estimated compaction factor (response variable).
The full algebraic form of the second-degree polynomial used to approximate the surface is Equation (2):
Y = β 0 + β 1 · X 1 + β 2 · X 2 + β 3 · X 3 + β 4 · X 4 + β 5 · X 5 + ε ,
where we find the following:
β0 is the free term (the intercept), i.e., the theoretical value of Y when both independent variables are zero;
β1 and β2 are the linear coefficients, which measure the direct and proportional effect of the perimeter and area, respectively;
β3 and β4 are the quadratic (squared) coefficients. These are responsible for the curvature of the surface (the “bolus” or “curved slope” effect in the graphs);
β5 is the interaction coefficient (the product of X1 X2), which indicates how the effect of perimeter on circularity changes as the size of the areas changes;
ε is the residual error (the difference between the experimental red points and the smoothed surface generated by the algorithm).
It should be noted that Equation (2) is the expanded form of a full second-degree (quadratic) polynomial in the two independent experimental variables X1 and X2: the terms X3 = X12 and X4 = X22 are the quadratic terms and X5 = X1·X2 is the interaction term, so that β3 and β4 multiply X12 and X22, and β5 multiplies X1·X2. Each βi is a constant regression coefficient estimated by least squares (Equation (4)); β5 is therefore a scalar coefficient and not itself a product of variables. Because X3–X5 are derived from X1 and X2, the design is intrinsically non-orthogonal, which is handled through the (ZTZ)−1 term.
The linear regression algorithm (by the method of least squares) searches for that unique combination of values for the parameter vector β that minimizes the sum of the squares of the residual errors, Σε2.
Matrix-wise, for each data set, the predictor vector X was expanded into a design matrix Z according to Equation (3):
Z = [ 1   X 1   X 2   X 1 2   X 2 2   X 1 · X 2 ] ,
The equation is solved by the standard Equation (4):
β = ( Z T Z ) 1 Z T Y ,
where we find the following:
ZT is the transpose matrix of Z.
This rigid mathematical structure forces the dispersed experimental data to lie on a continuous and smooth geometric “canvas”, eliminating visual noise and highlighting the global trend of the samples [22].

2.3.6. Powder Flowability and Compressibility Analysis

The flow and compaction behavior of the powders were evaluated experimentally through the bulk (untapped) density and the tapped density, from which the Carr compressibility index and the Hausner ratio were calculated, respectively, according to the Equations (5) and (6):
C a r r   i n d e x % = ρ t a p p e d ρ b u l k ρ t a p p e d × 100 ,
H a u s n e r   r a t i o = ρ t a p p e d ρ b u l k ,
Lower values of the Carr index and of the Hausner ratio correspond to better flowability [23].

2.3.7. In Vitro Dissolution Studies

The dissolution test was performed using the SR 8 Plus Dissolution Test Station 73-100-104 dissolution apparatus (Hanson Research, Chatsworth, CA, USA). The dissolution medium was artificial gastric juice prepared from 2 g of sodium chloride, 7 mL of hydrochloric acid, and 1000 mL of distilled water. The apparatus was set at a working temperature of 37 °C ± 0.5 °C and a paddle rotation speed of 100 rpm. Amounts of 100 mg of each ketoprofen–HPBCD complex, 1:1 and 2:1, were added to different vessels in 900 mL of dissolution medium with pH 1.2. At regular intervals of 5, 10, 15, 20, 30, 35, 40, 45, 50, 55 and 60 min, one milliliter of sample was taken from the medium. For each milliliter of sample extracted, the medium was supplemented with another milliliter of freshly prepared medium to maintain the medium volume. The extracted samples were analyzed spectrophotometrically at a wavelength of 260 nm [24].

3. Results and Discussion

3.1. Fourier-Transform Infrared Spectroscopy (FT-IR)

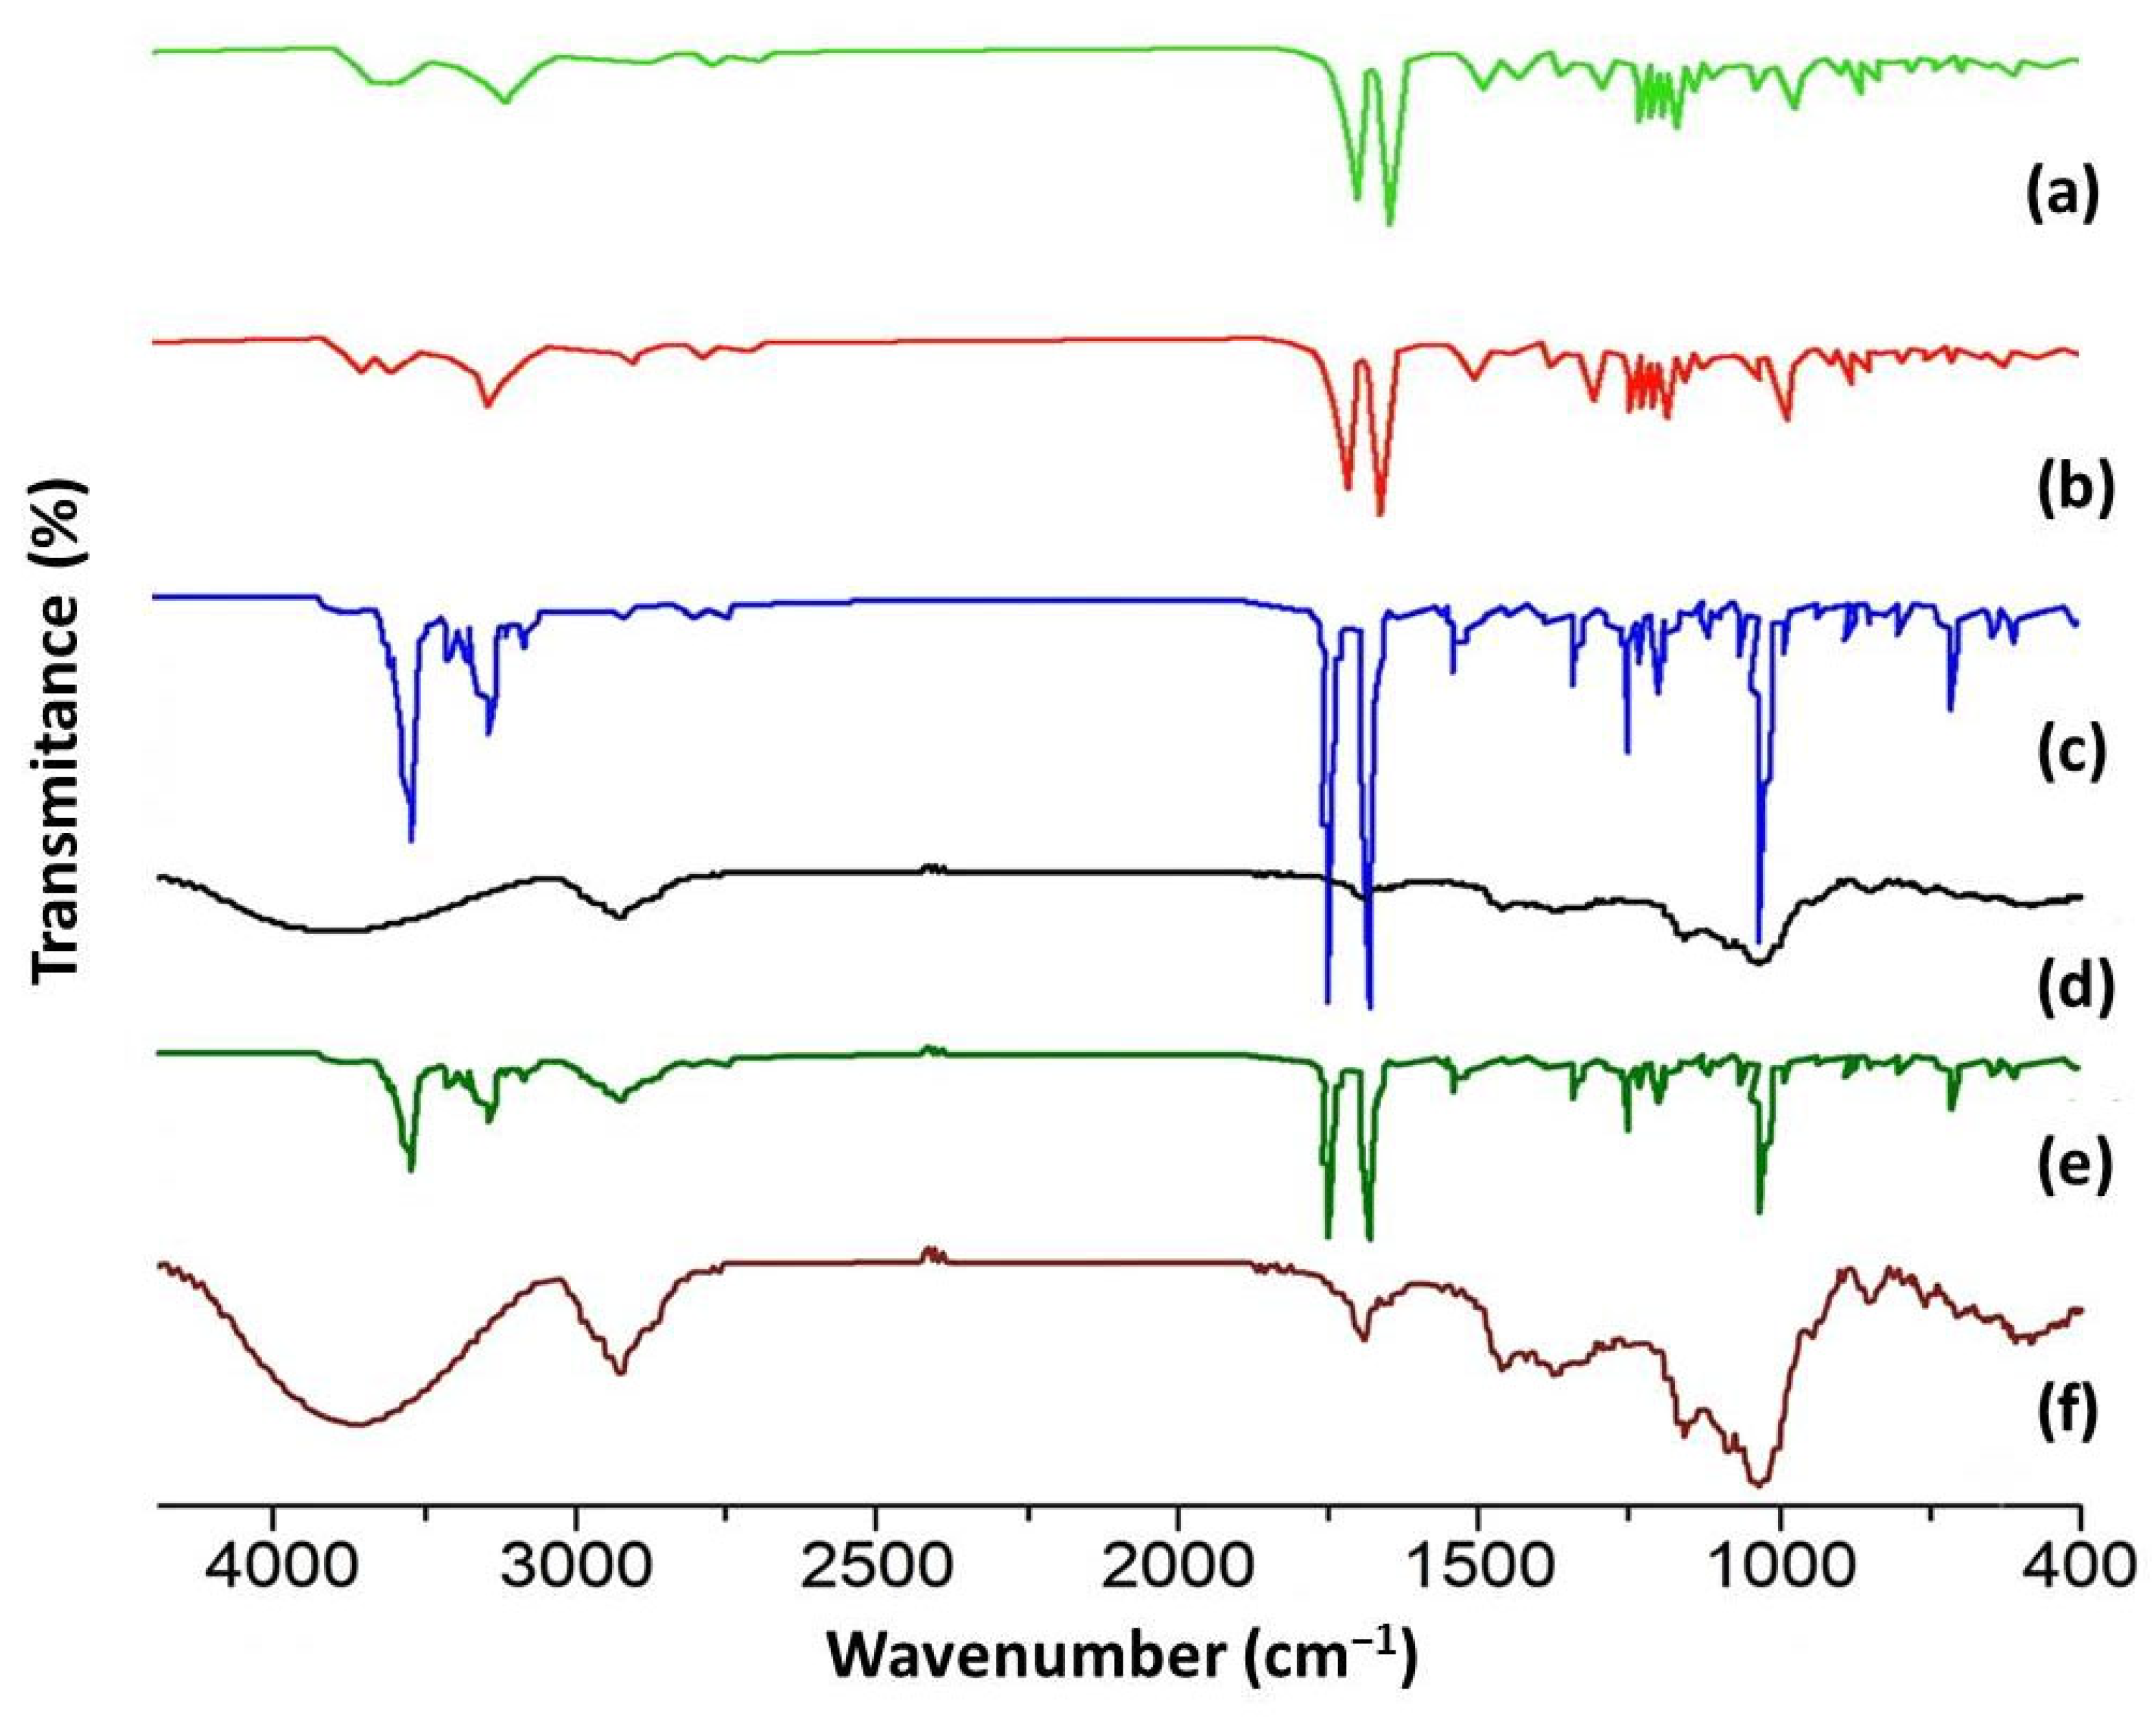
Figure 2 shows the FT-IR spectra of ketoprofen, HPβCD and the complexes obtained. The spectrum of cyclodextrin is characterized by a very broad and intense band in the 3000–3600 cm−1 area (specific to hydroxyl groups) and less intense peaks in the rest of the spectrum. The spectrum of pure ketoprofen is a much more complex spectrum, with numerous sharp and intense peaks across the entire wavelength range, especially in the 1000–1800 cm−1 regions, which are its chemical fingerprint. When ketoprofen and hydroxypropyl beta cyclodextrin are physically mixed in a 1:1 molar ratio, the resulting spectrum is a mathematical combination of the two basic spectra. It can be seen that the spectrum presents both the broad band from the cyclodextrin and the sharp peaks from ketoprofen, but at a reduced intensity. For the physical mixture of ketoprofen and hydroxypropyl beta cyclodextrin in a 2:1 molar ratio, by increasing the amount of ketoprofen the intensity of the ketoprofen peaks increases. The sharp peaks, characteristic of ketoprofen, become much more prominent and higher. This is most visible in the fingerprint region (1000–1800 cm−1). For example, the set of double peaks at ~1700 cm−1 is much better defined. The intensity of the cyclodextrin band, on the other hand, decreases relatively. The broad band at 3400 cm−1, specific to cyclodextrin, is still present, but appears smaller compared with the ketoprofen peaks, which have increased in intensity. Compared with the spectra of ketoprofen and 2-hydroxypropyl beta cyclodextrin, for the complexes it is observed that in the 1550–1750 cm−1 and 2950–3150 cm−1 domains differences appear which are due to the characteristic groups involved in C=C, C=O and –CH bonds. It is worth mentioning that the 1659 cm−1 peak disappears and practically lengthens and the 1655 cm−1 peak appears but reduced in size. The same change occurs in the case of the 3455 cm−1 peak which moves to 3465 cm−1. The peaks specific to the C=C bonds change at the 1599 cm−1 level for all of the complexes. The band at 1647 cm−1, which is present in the HPβCD spectrum, is assigned to adsorbed/crystal water (O–H bending, characteristically appearing in the 1630–1650 cm−1 region) and not to a carbonyl group, as HPβCD contains no C=O functionality; its attenuation in the complexes reflects the lower water content of the dried inclusion product, while the drug carbonyl (C=O) band near 1655 cm−1 is the diagnostic marker of ketoprofen inclusion. The specific –CH bonds are diminished at the 1440 cm−1 and 1003 cm−1 peaks and in the range of 3200–3450 cm−1. The effectiveness of ketoprofen inclusion in HP-β-CD is demonstrated by the fact that most of the peaks specific to C=C, C=O and –CH bonds were reduced. The diminished and merged peaks specific to –CH bonds demonstrate that much more soluble compounds were obtained. Comparable spectral changes have been reported for ketoprofen–HPβCD 1:1 and ketoprofen–HPβCD 2:1, where the reduction and merging of the drug bands are interpreted as a fingerprint of encapsulation and of the resulting increase in solubility [25,26].

3.2. Differential Scanning Calorimetry (DSC)

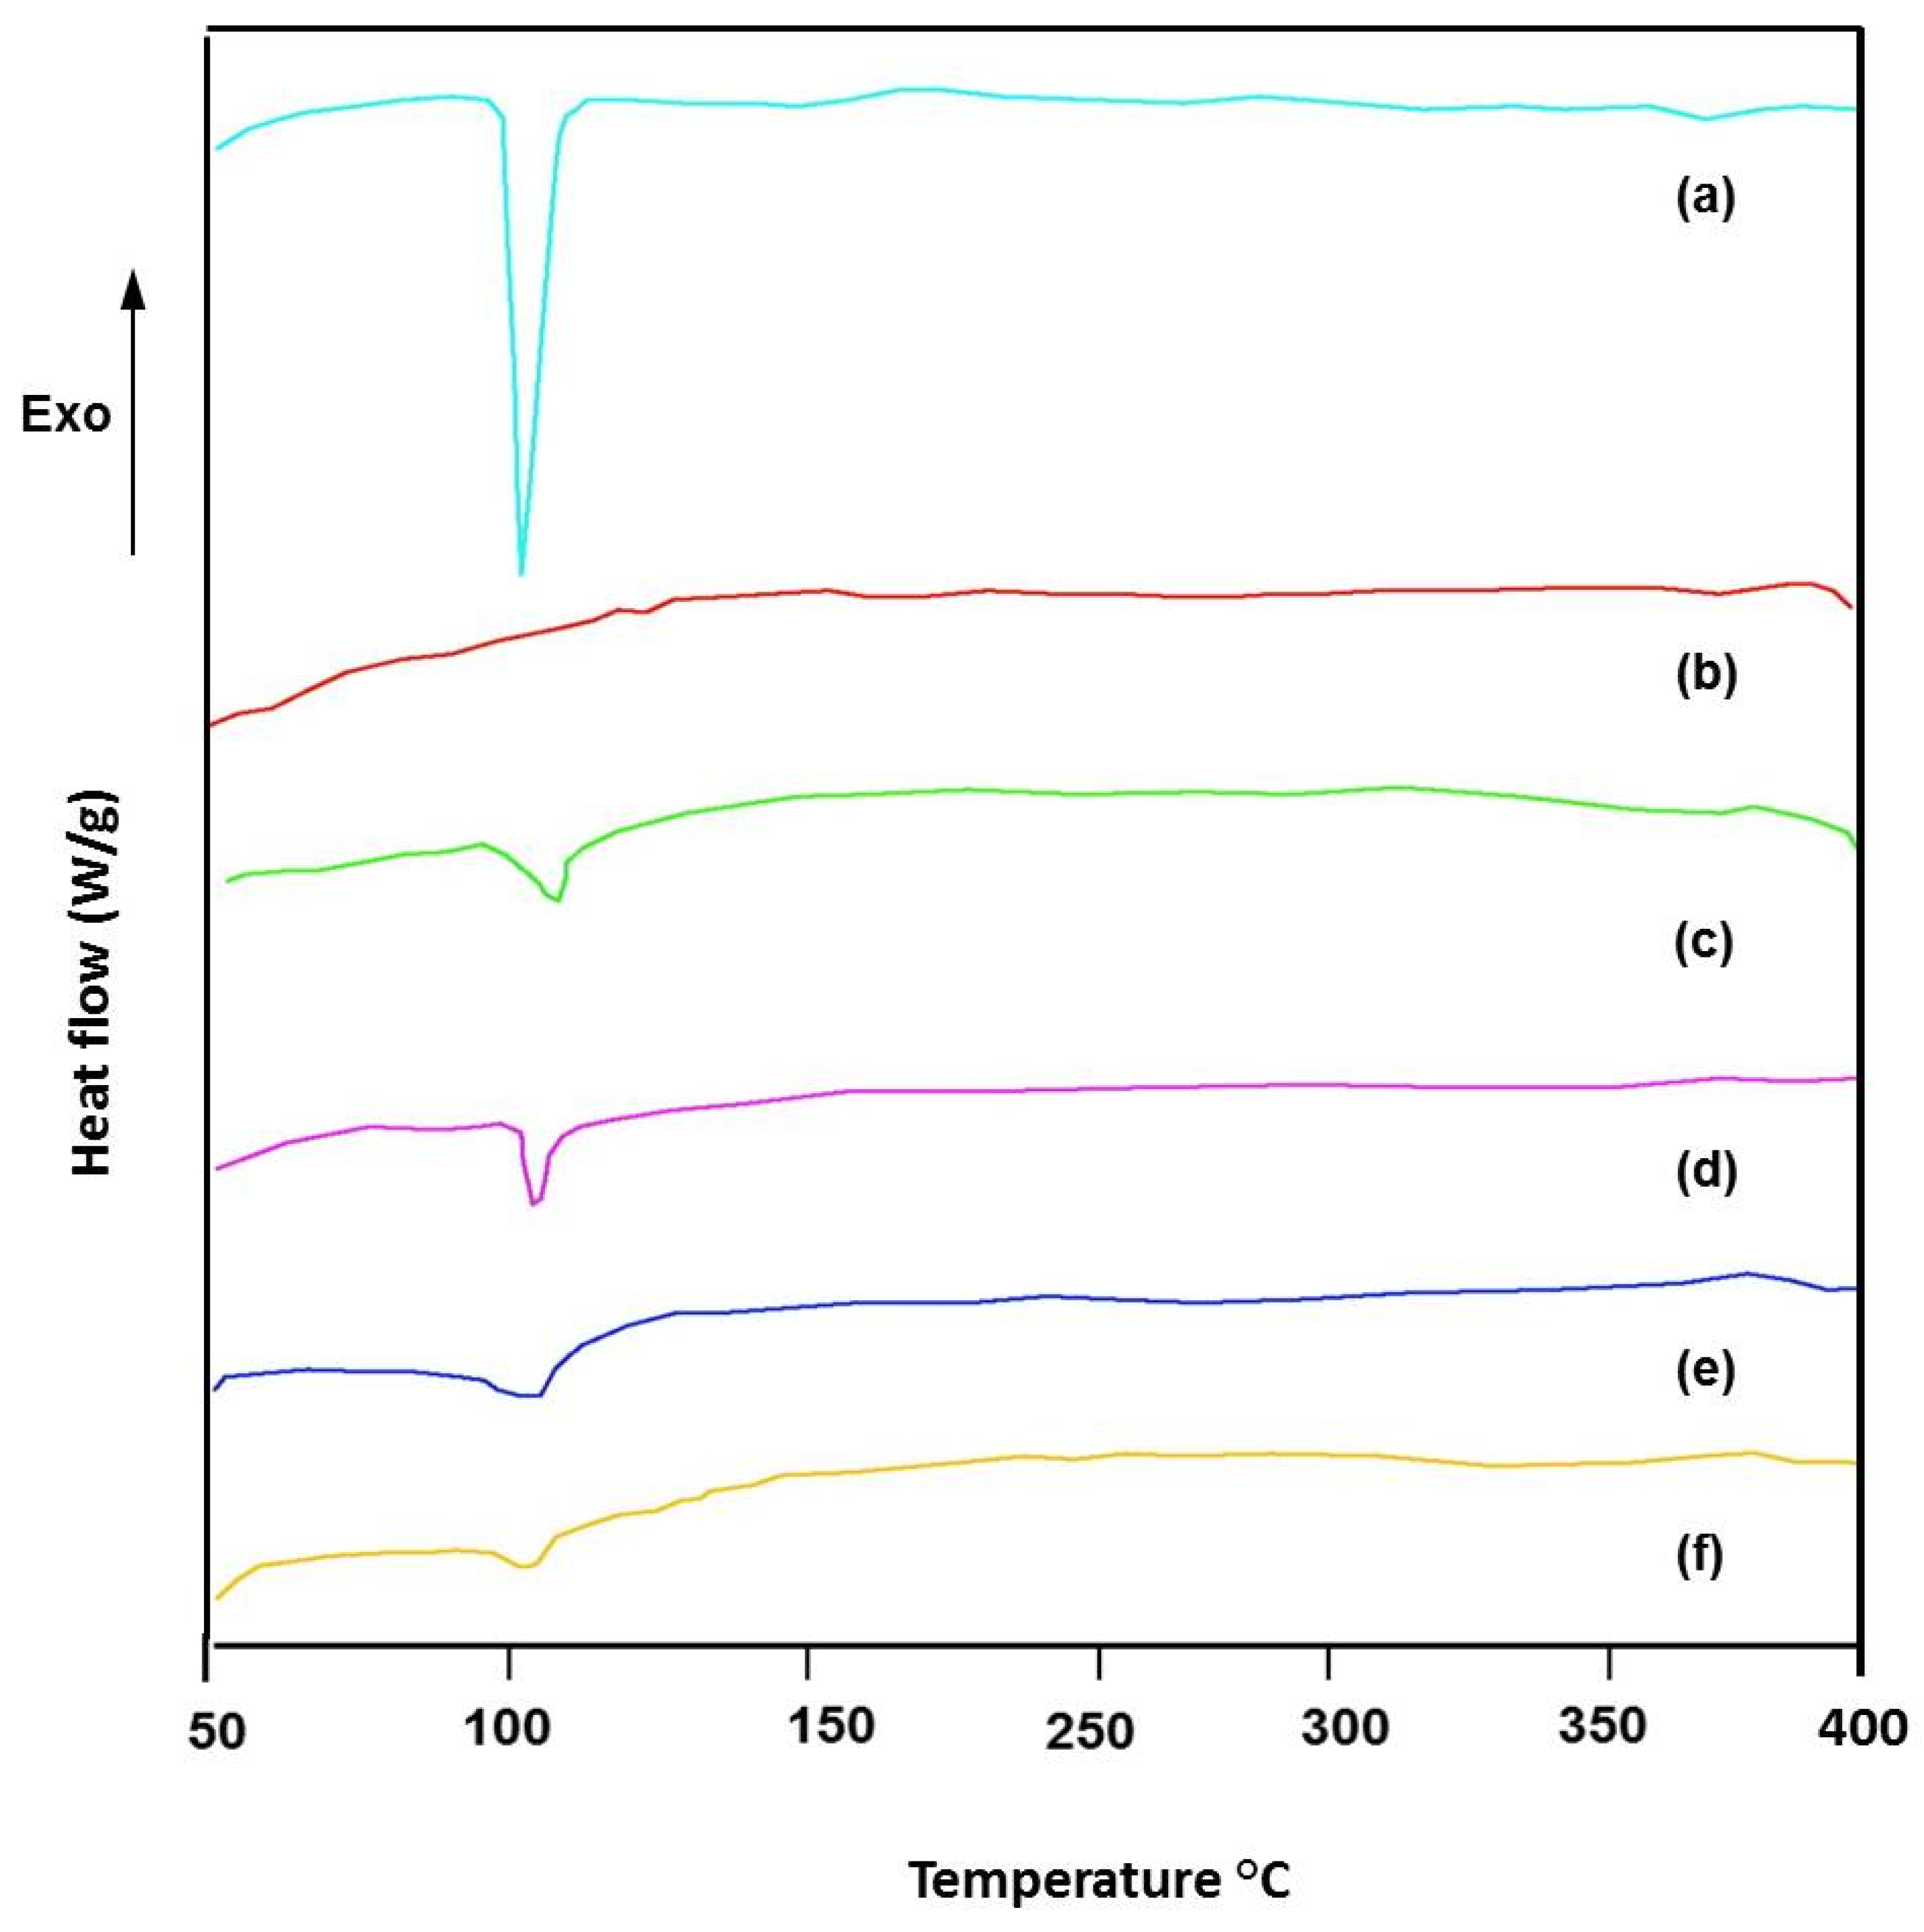
Figure 3 illustrates the results of differential scanning calorimetry (DSC) analysis performed for the individual components and for the ketoprofen–HPβCD complexes obtained by magnetic stirring. The analysis of the pure components highlights that ketoprofen exhibits a behavior specific to a crystalline structure, characterized by an endothermic melting peak at approximately 96 °C. In the case of 2-hydroxypropyl β-cyclodextrin, the DSC curve indicates a thermal effect associated with the melting point located around 278 °C.
In the case of the physical mixture of ketoprofen with hydroxypropyl beta cyclodextrin in a molar ratio of 1:1, the melting peak of ketoprofen remains present at the same temperature (~95.5 °C), but is significantly reduced in depth, because ketoprofen represents a small mass fraction in the mixture. In the case of the physical mixture of ketoprofen with hydroxypropyl beta cyclodextrin in a molar ratio of 2:1, the melting peak at ~95.5 °C is more visible, deeper than that in the 1:1 mixture (because the mass concentration of ketoprofen increases), but still remains much lower compared with the pure substance ketoprofen.
The DSC curves of the ketoprofen–HPβCD complexes show an endothermic peak in the range of 40–130 °C, attributed to the elimination of crystalline or adsorbed water. Residual moisture is associated with temperatures below 110 °C, while the water included in the cyclodextrin cavity is released at temperatures higher than 110 °C. For pure ketoprofen, an endothermic peak characteristic of the melting process is observed, located around the temperature of 96 °C. In comparison, in the case of the analyzed complexes, the endothermic effect associated with the melting of ketoprofen is considerably diminished or even absent. This change in the thermal profile suggests the existence of interactions between ketoprofen and HPβCD, confirming the formation of the inclusion complex [26].
The melting enthalpy of the ketoprofen fraction remaining outside the cyclodextrin cavity, calculated from the area of the endothermic peak (A ketoprofen = 862.42; A ketoprofen–HPβCD 1:1 physical mixture = 340.764; A ketoprofen–HPβCD 2:1 physical mixture = 582.333; A ketoprofen–HPβCD 1:1 complex = A ketoprofen–HPβCD 1:1 complex = 215.50; A ketoprofen–HPβCD 2:1 complex = 327.53), is summarized in Table 1. For both complexes the values are considerably lower than that of pure ketoprofen (44.34 J g−1), indicating a strong interaction between ketoprofen and HPβCD, so that only a small fraction of the drug remains uncomplexed. Taking the melting enthalpy of pure ketoprofen as 100%, the degree of inclusion obtained from the DSC data was 75% for the 1:1 complex and 62% for the 2:1 complex. The loss of the drug melting peak upon cyclodextrin complexation is a widely accepted criterion for inclusion-complex formation and partial amorphisation [26].

3.3. Scanning Electron Microscopy (SEM)

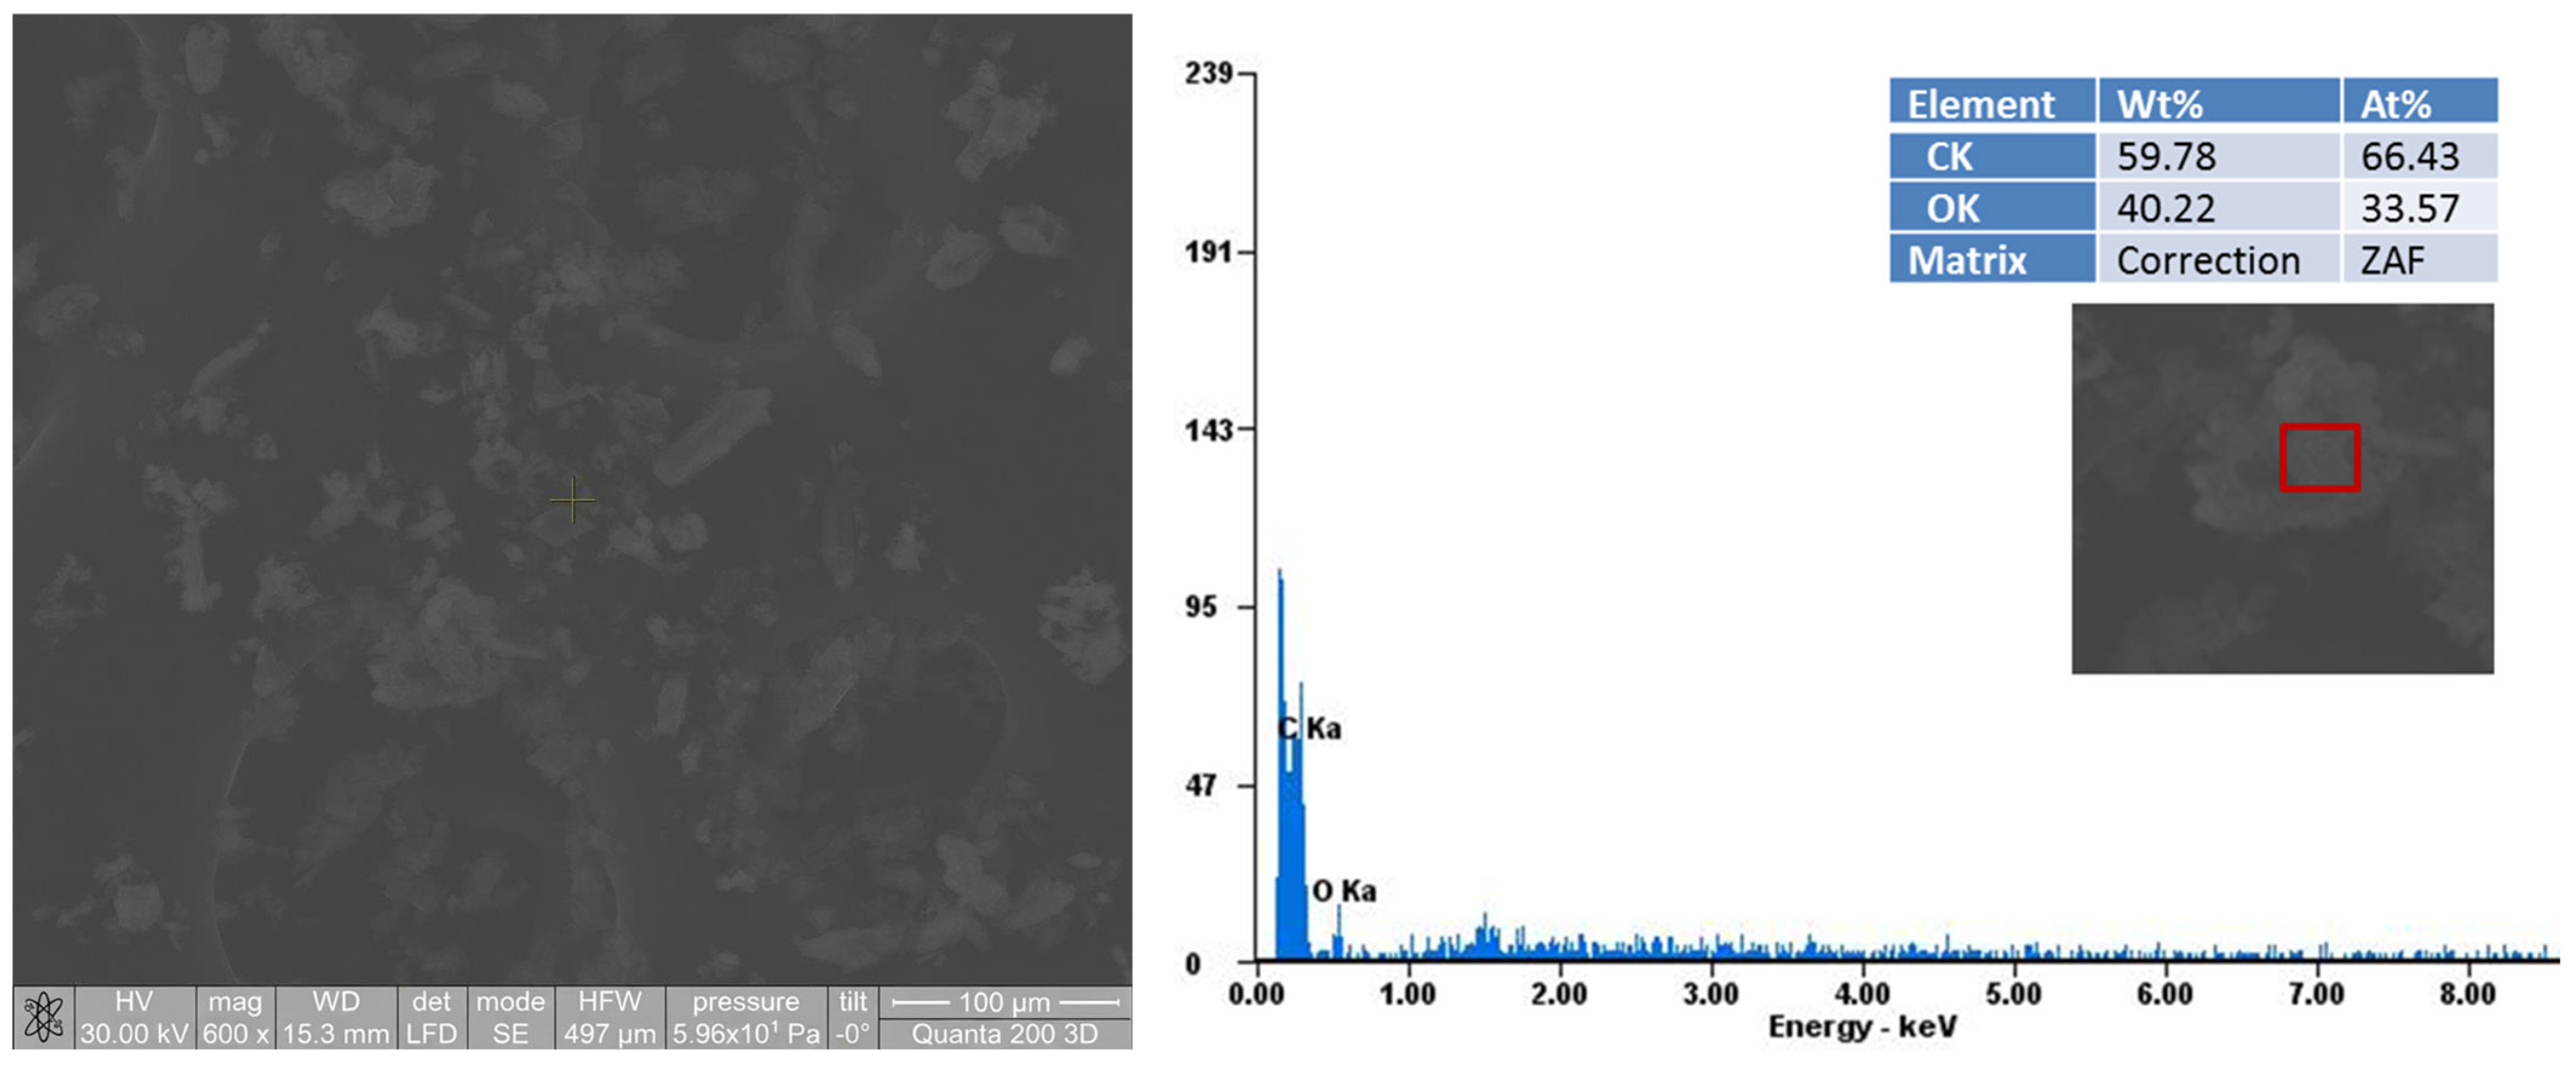
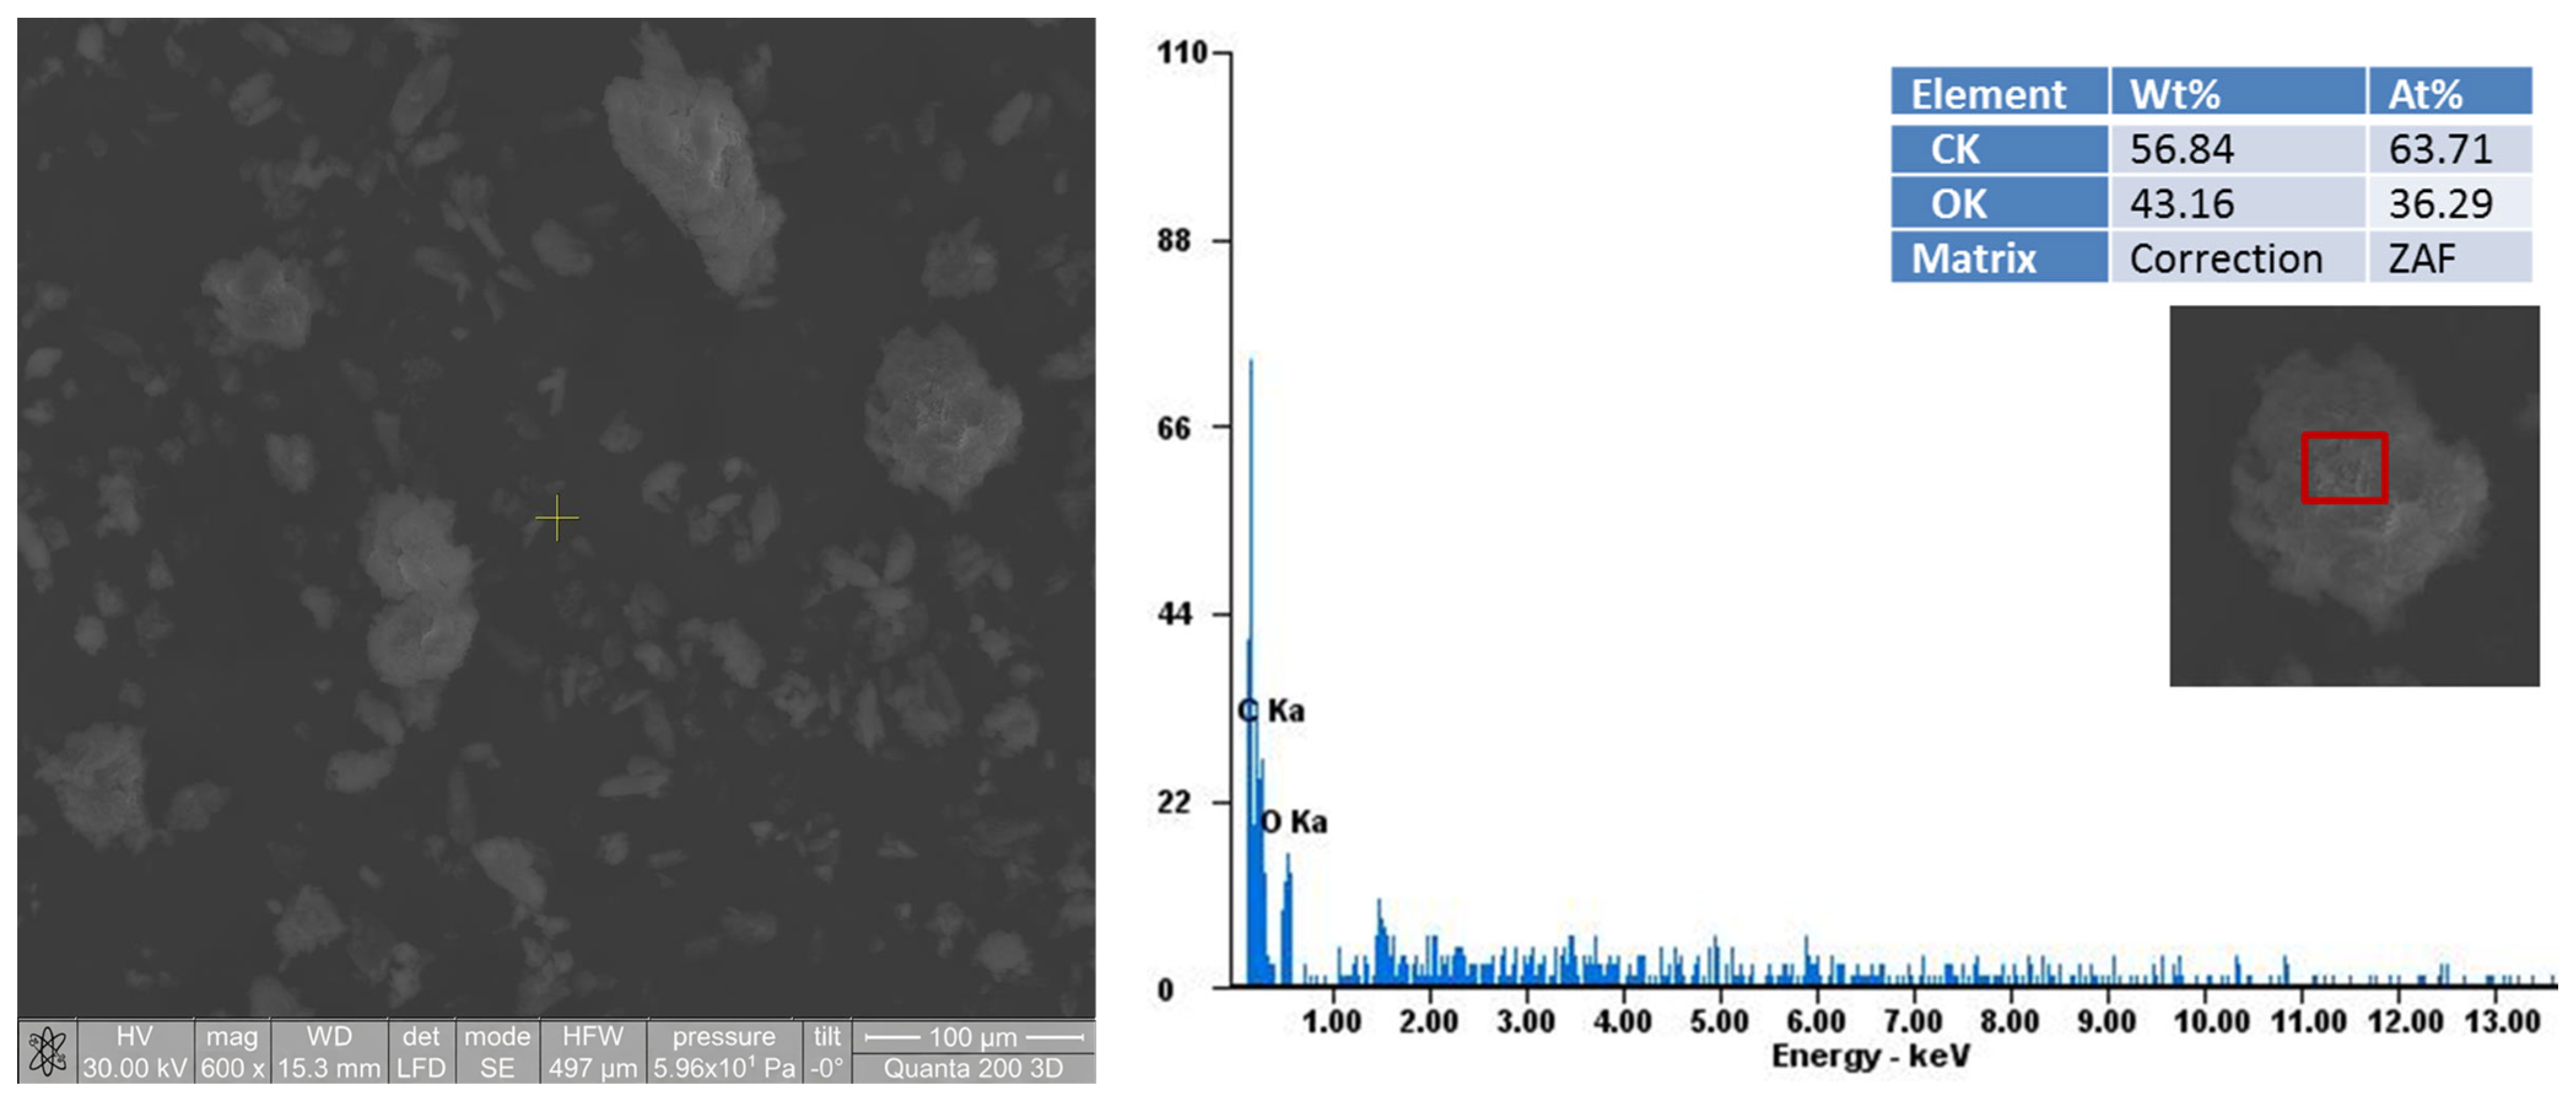
The SEM micrographs of the ketoprofen–HPβCD physical mixtures (1:1 and 2:1) are shown respectively in Figure 4 and Figure 5. In the case of physical mixtures of ketoprofen with hydroxypropyl beta cyclodextrin in a molar ratio of 1:1, numerous agglomerations of particles are observed. This is due to the cyclodextrin which, being in an equal amount to ketoprofen, tends to agglomerate and stick the particles together.
In the case of physical mixtures of ketoprofen with hydroxypropyl beta cyclodextrin in a molar ratio of 2:1, it is observed that the number of agglomerated particles has decreased and numerous individual polyhedral particles of ketoprofen are observed. This is due to the increased amount of ketoprofen, which reduces the tendency of cyclodextrin to agglomerate the particles.
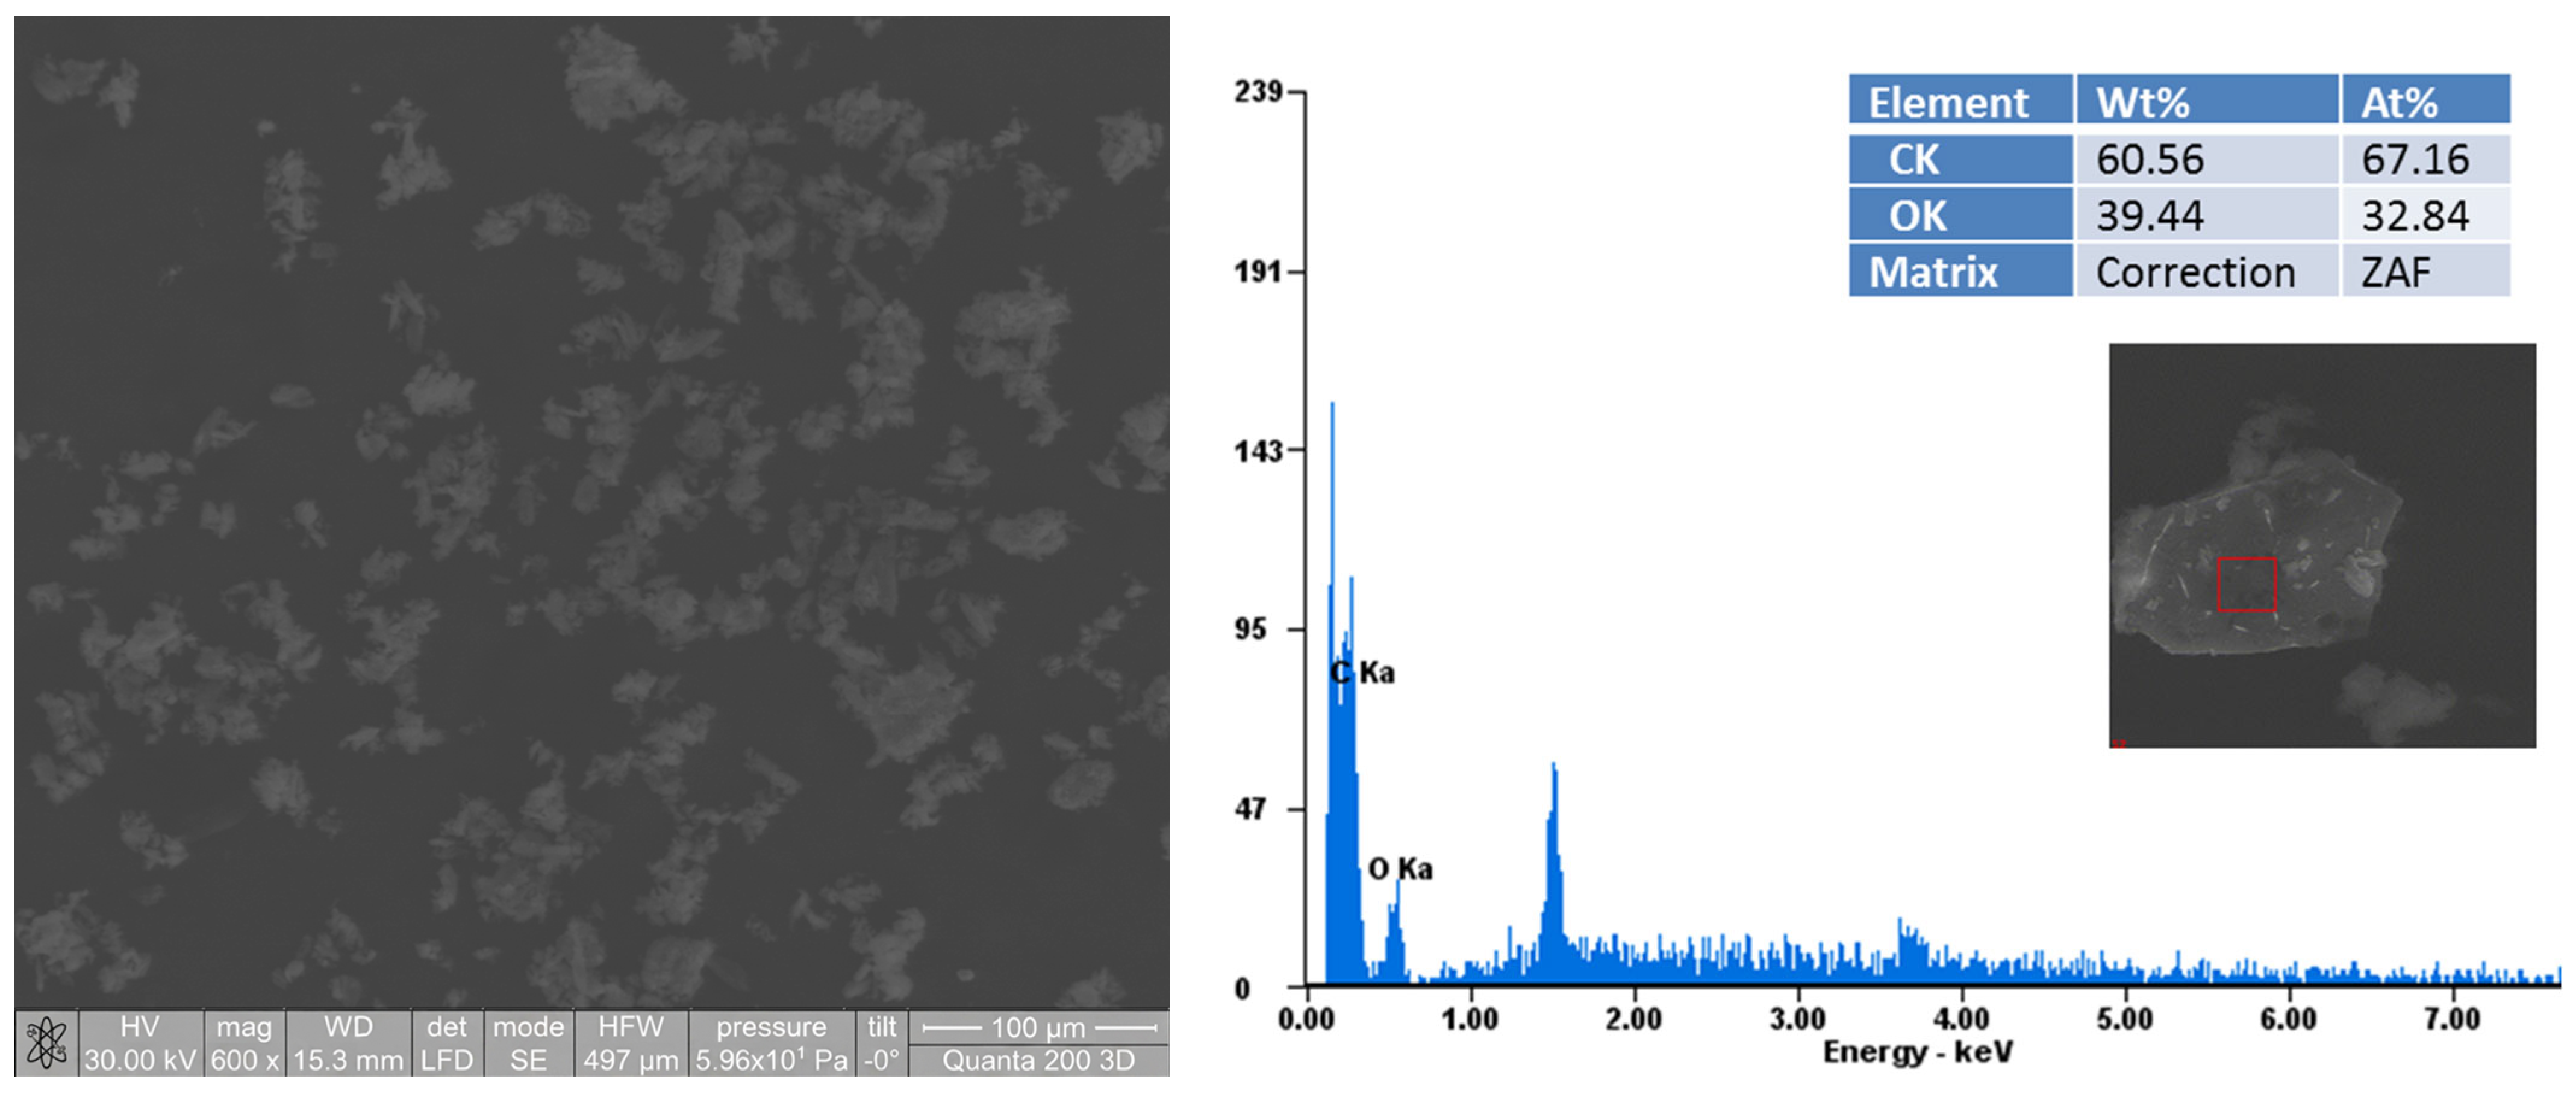
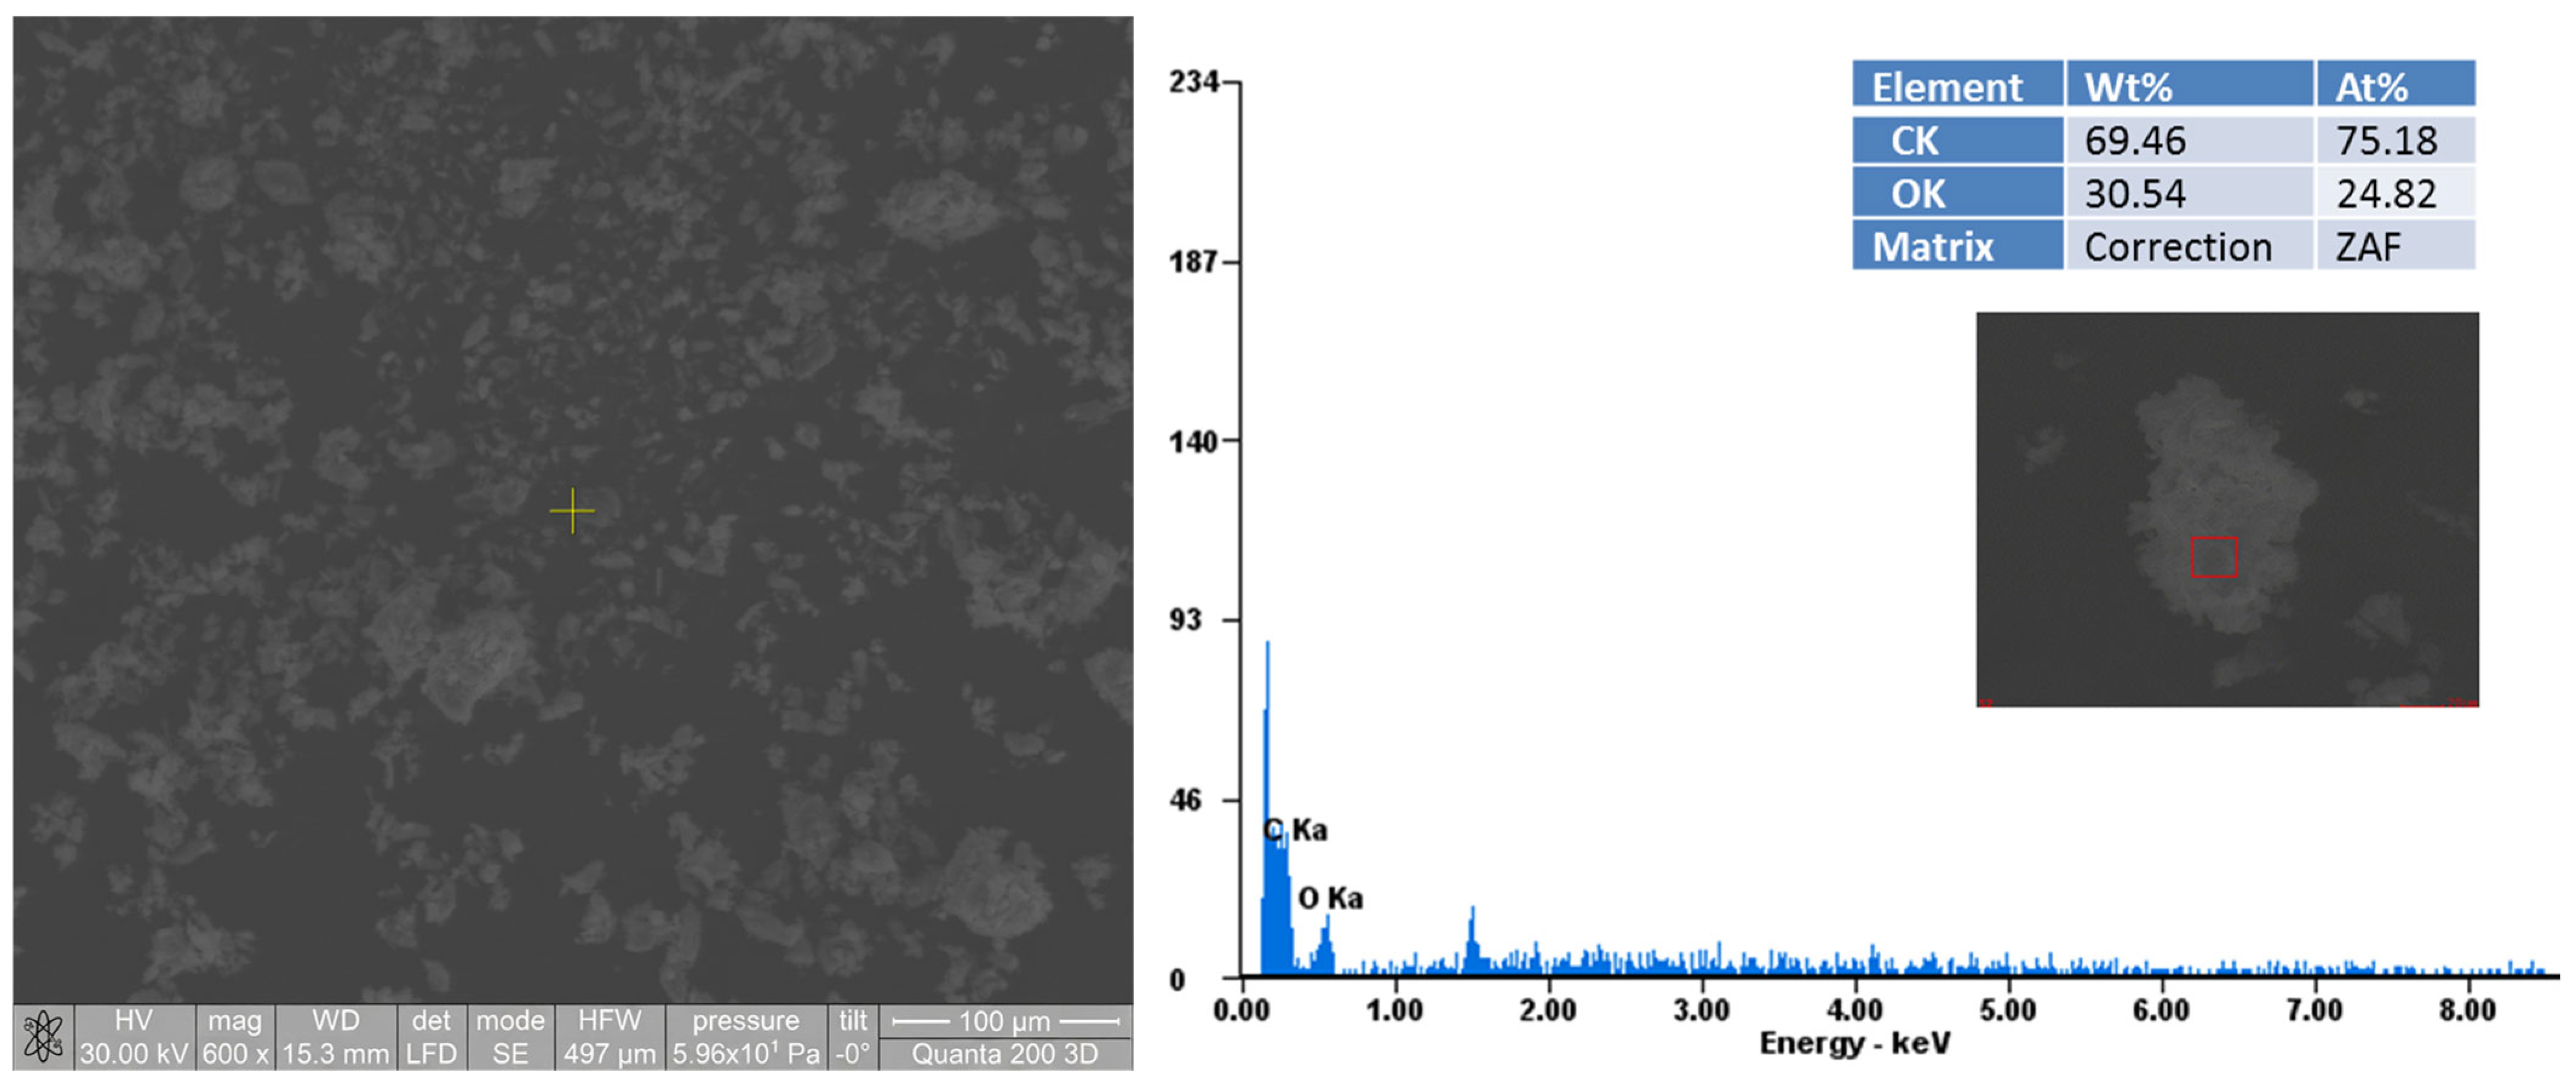
The SEM micrographs of the ketoprofen–HPβCD complexes (1:1 and 2:1) obtained by magnetic stirring are shown respectively in Figure 6 and Figure 7. All of the structures are amorphous, which demonstrates that ketoprofen was effectively incorporated into the cyclodextrin cavity: neither the regular polyhedral crystals characteristic of ketoprofen nor the spherical particles typical of the cyclodextrin are observed. The complexes appear as polyhedral particles, elongated or not, with rounded edges, the latter resulting from the inter-particle friction generated during magnetic stirring.
The elemental composition was determined by energy-dispersive X-ray analysis for ketoprofen–HPβCD inclusion complex 1:1 molar ratio (C ≈ 60.56%, O ≈ 39.44%) and for ketoprofen–HPβCD inclusion complex 2:1 molar ratio (C ≈ 69.46%, O ≈ 30.54%). The micrographs also reveal a tendency of the smallest particles to aggregate; the large proportion of particles smaller than 50 µm (≈60%) favors cohesion and the formation of aggregates [25]. The energy-dispersive X-ray analysis, which detects only carbon and oxygen and hydrogen, confirms the chemical purity of the product.

3.4. Dimensional Analysis of the Particles

The geometric parameters computed for each particle are summarized in Table 2 and Table 3. The particle area sizes for the ketoprofen–HPβCD inclusion complexes with the 1:1 molar ratio range between 46 µm2 and 670 µm2 (Table 2), while those for the ketoprofen–HPβCD inclusion complexes with the 2:1 molar ratio range between 42 µm2 and 755 µm2 (Table 3). The predominant morphology is that of an irregular parallelepiped; no rounded or spherical particles were observed. Form factor values below 1 and elongation factor values above 1 confirm the elongated, irregular-parallelepiped shape, while the orientation index indicates a similar orientation for the majority of the particles. The absence of dendritic branches or extensions, together with the common orientation of most particles, suggests favorable powder flow. The particle-size distribution based on the calculated perimeters for ketoprofen–HPβCD inclusion complexes with the 1:1 molar ratio (Table 2) is dominated by values in the 20–94 µm range and for the ketoprofen–HPβCD inclusion complexes with the 2:1 molar ratio (Table 3) is dominated by values in the 15–81 µm range. Fraction below 50 µm is about ≈60%.
In digital image analysis (particle morphogeometry), each measured shape parameter is subject to residual or absolute instrumental errors, caused by edge pixelation (aliasing) or binarization thresholds (segmentation). Therefore, for each parameter a standardized absolute error (the sum of absolute errors (SAE)) was calculated, denoted by εSAE, representing the typical measurement uncertainty [27,28].

3.5. Statistical Analysis of Ketoprofen–HPβCD Complexes

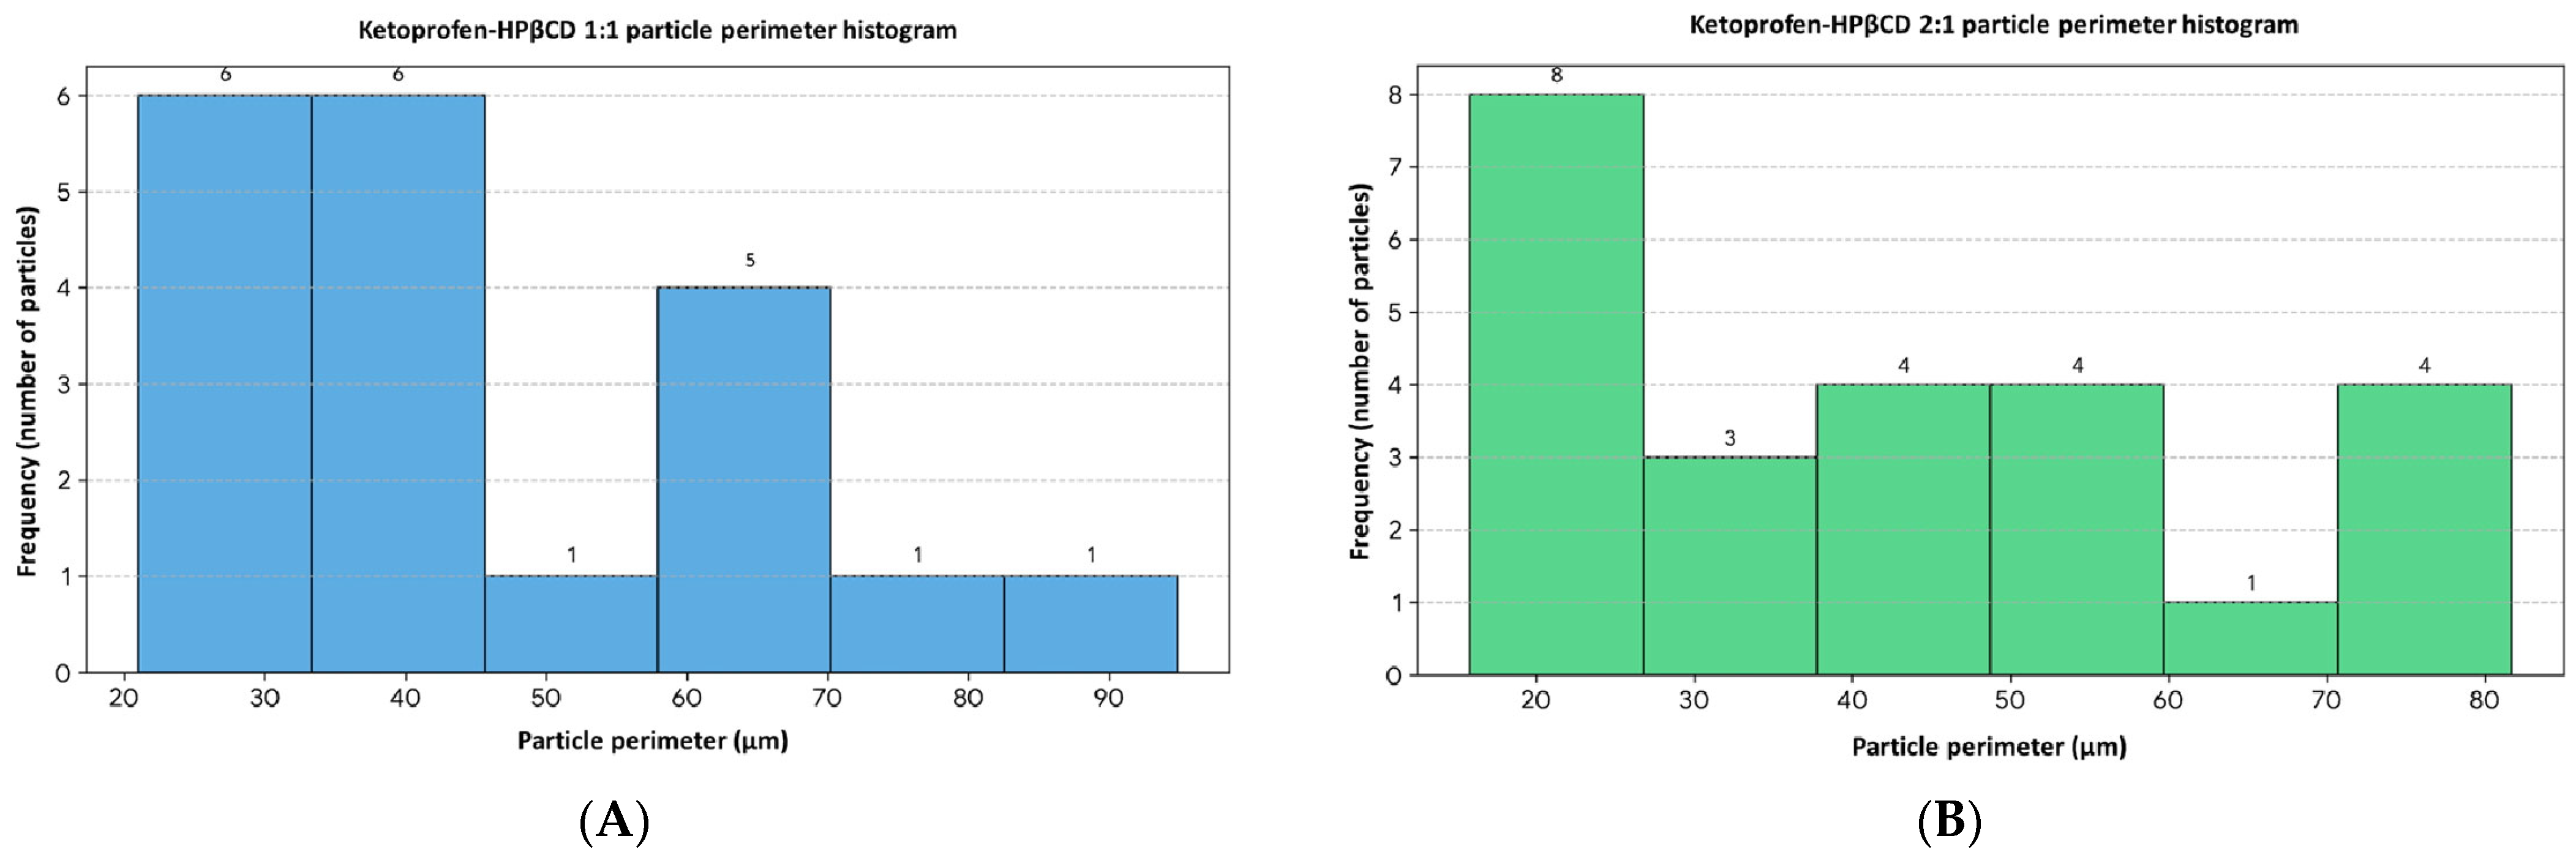
In Figure 8A most particles have a small-to-medium perimeter, clustering in the range of 20–75 µm. The median value is about 41.89 µm, which means that half of the particles have a perimeter smaller than this, and half have a larger one. As the perimeter increases above 45 µm, the number of particles decreases. However, there is a small secondary group of 5 particles in the range of 58–70 µm.
The standard deviation measures is about 19.673 µm and the skewness index is 0.762 µm, a positive value (>0), which shows that the particle distribution is right-skewed (or right-skewed/positive skew). Most particles are concentrated in the small size zone (left), and as the perimeter increases, their number gradually decreases, leaving only a few larger particles on the far right.
In Figure 8B the mean value of the particle perimeters is 43.278 µm and the median value is 40.856 µm, which indicates that the data have a balanced distribution. The standard deviation is 20.604, similar to that of the normal particles in the first batch. The asymmetry has a value of approximately 0.391 µm, which is a positive but also a small value (below 0.5 µm), so the histogram shows a slight to moderate right asymmetry.
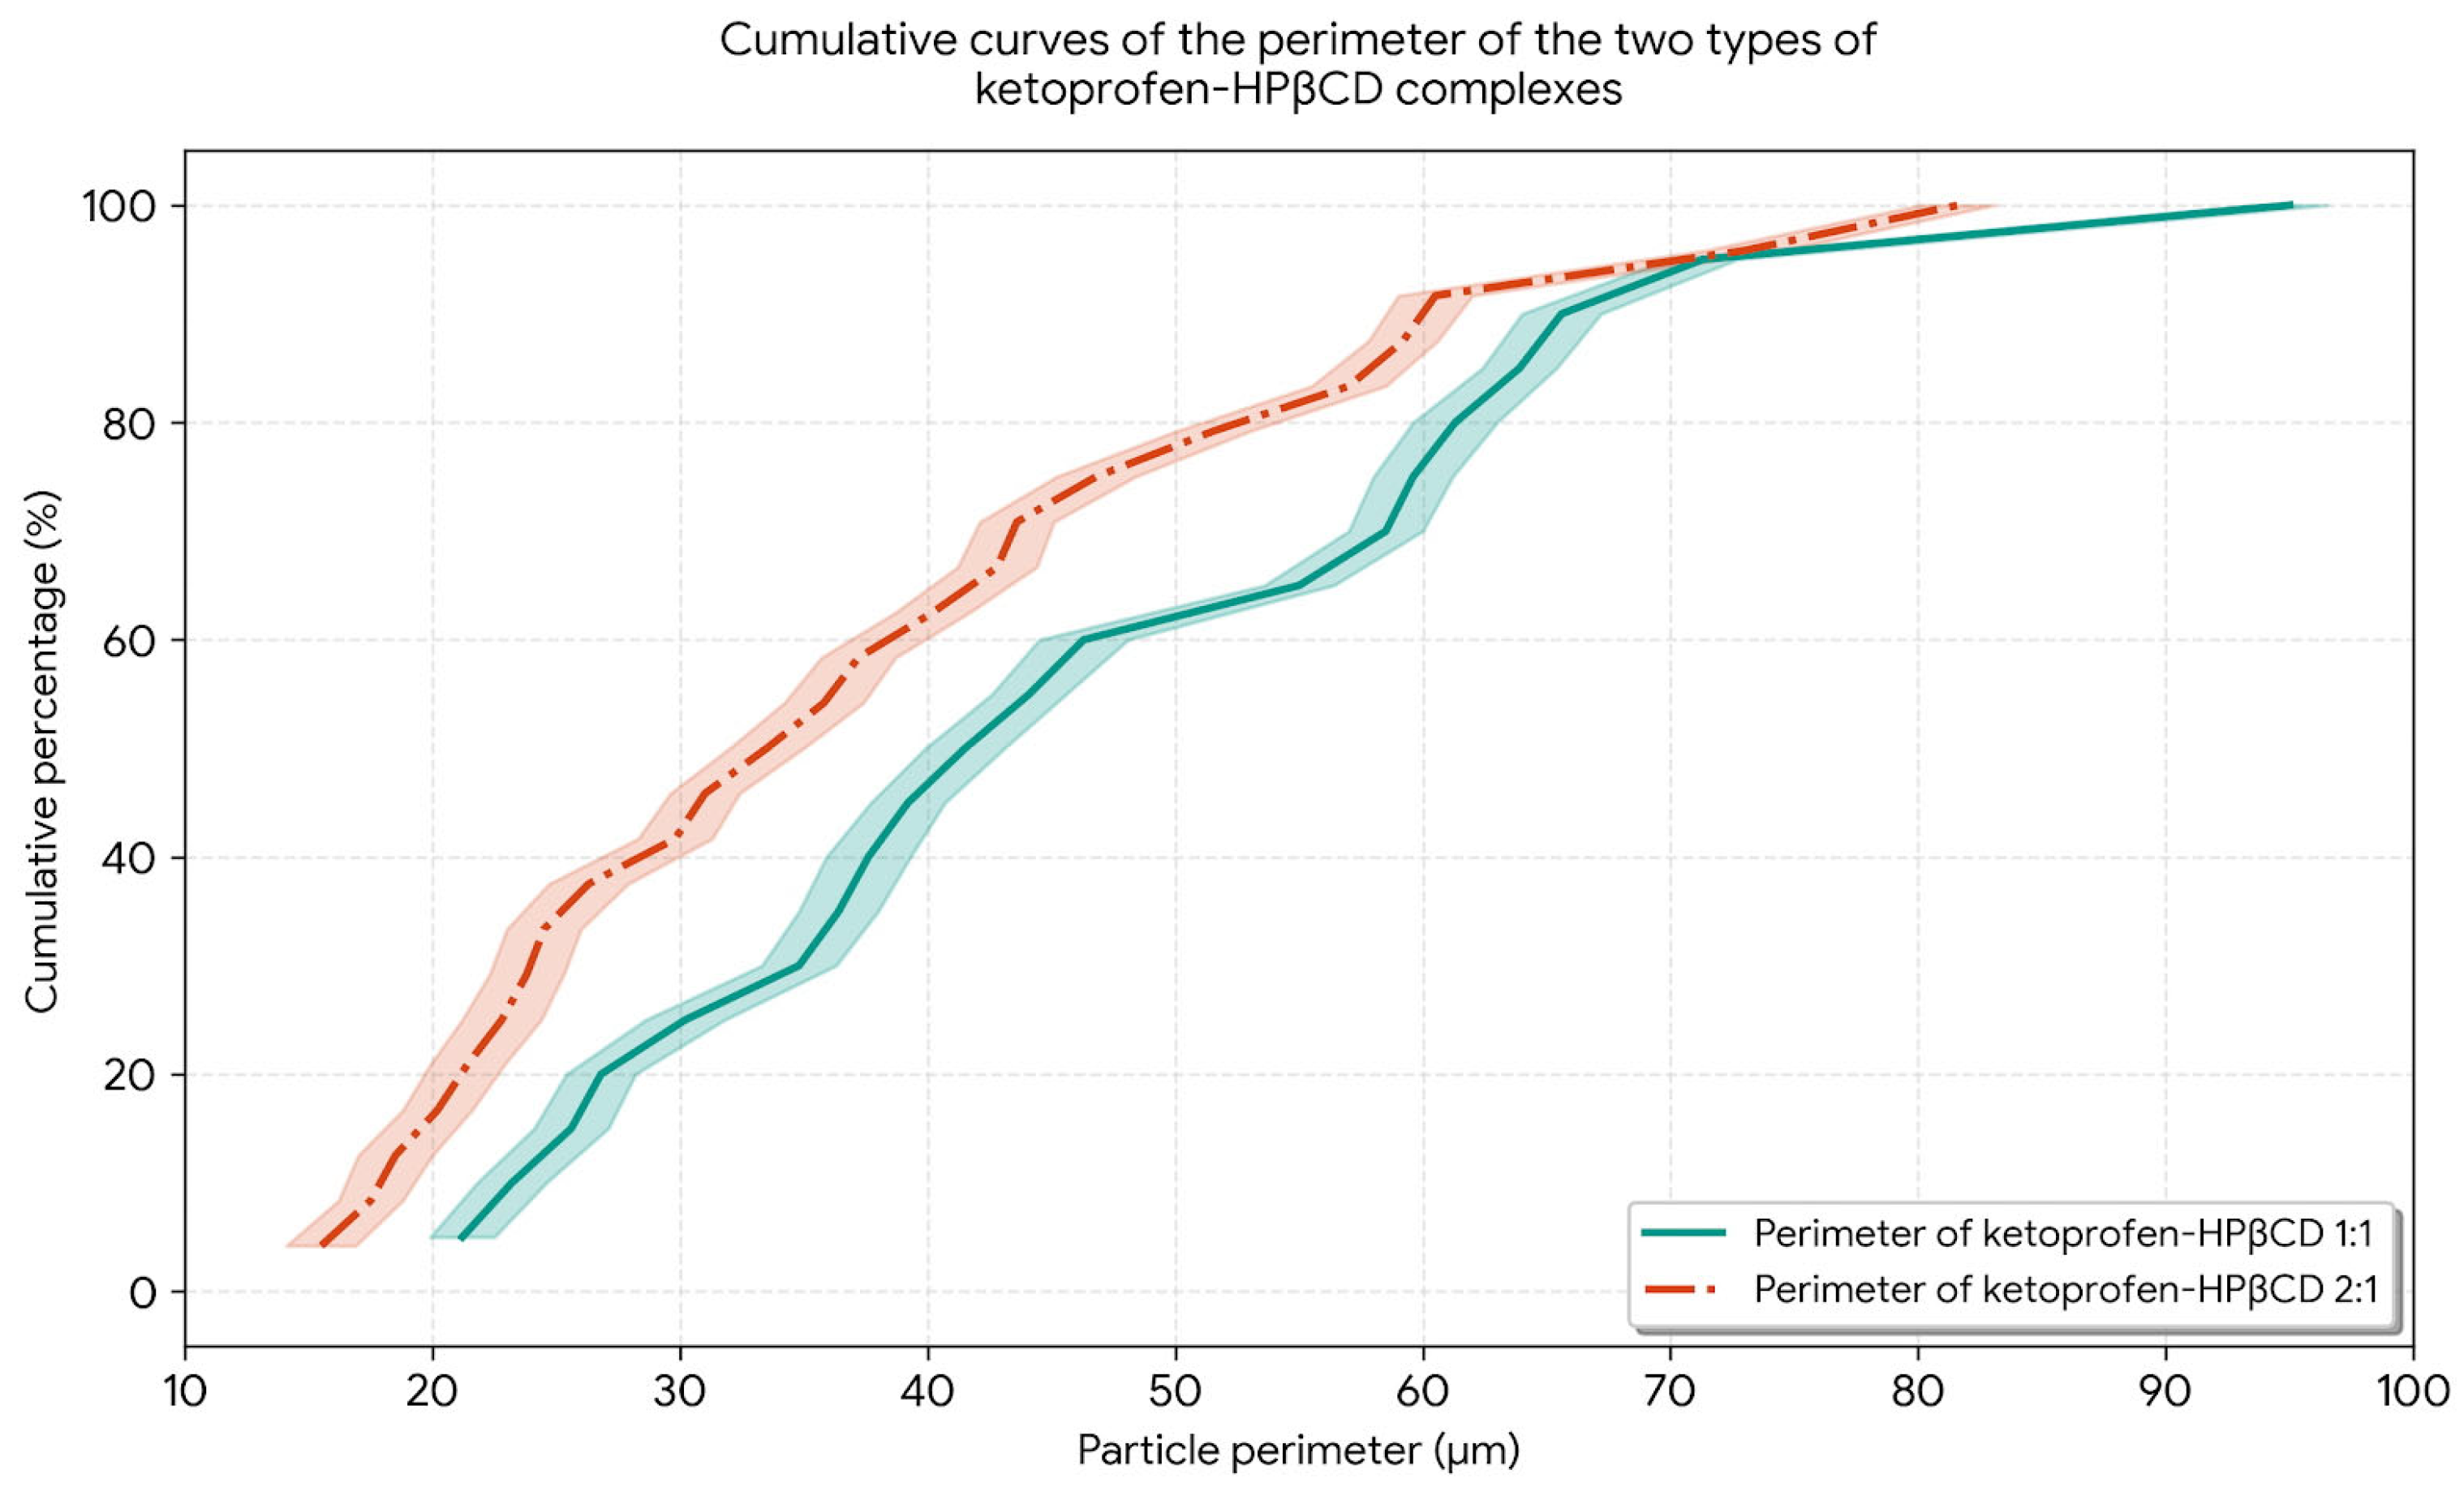
In Figure 9 it is observed that the two curves are close in shape, which confirms that both samples of ketoprofen–HPBCD complexes have a very similar structural behavior in terms of perimeter. From the graph it is observed that, in both sets, exactly 50% of the particles (median) have a perimeter below approximatively 41 µm. As the horizontal distance between the curves is less than or equal to the adopted instrumental error (±1.5 μm), we can state with a high degree of confidence that the two samples come from a population with equivalent perimeter distribution. Modifications or adjustments in the production process did not alter the fundamental perimeter dimensions of the particles, keeping their granularity constant [28].
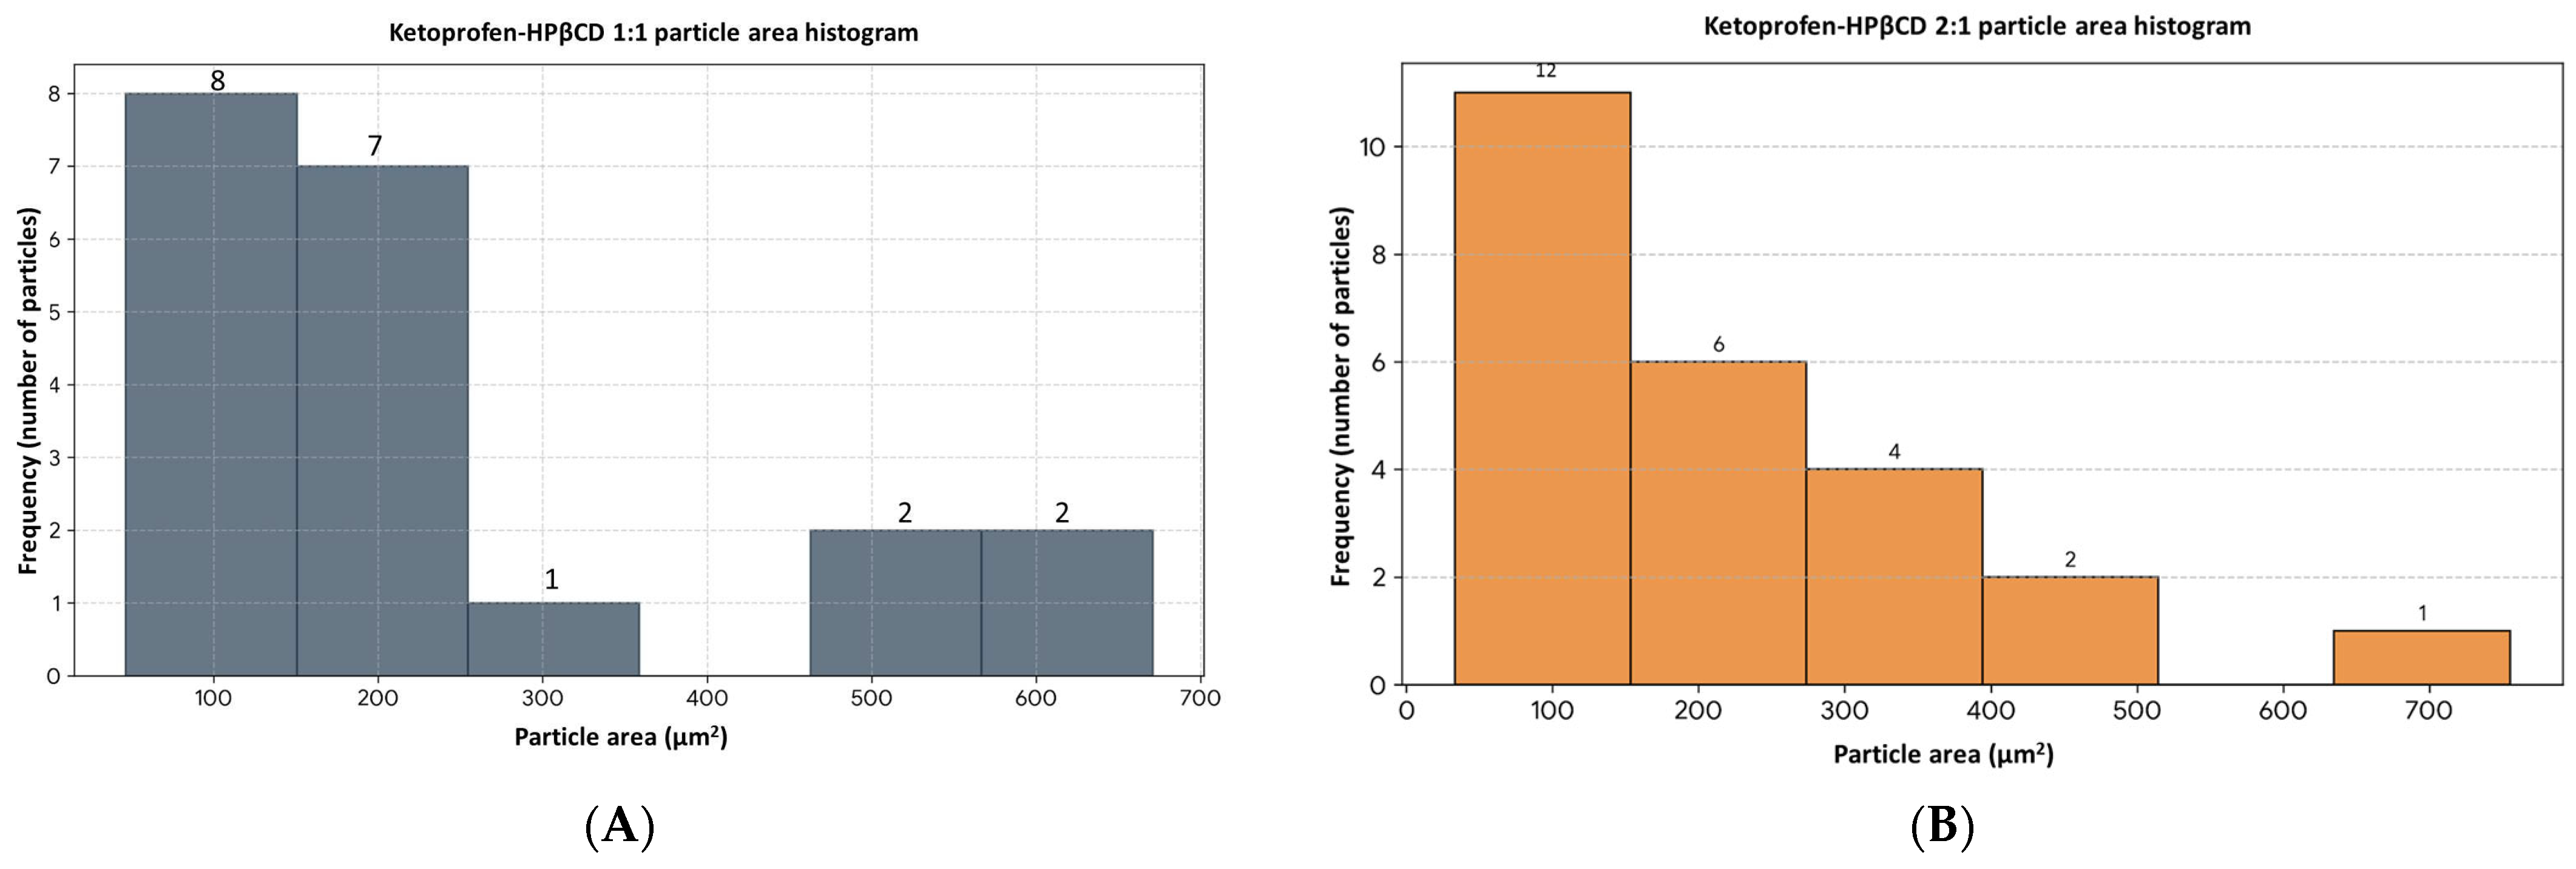
In Figure 10A, particle area distribution shows that the particles are heavily concentrated in the small size range. The first two ranges (between 46.4 µm2 and 251.2 µm2) contain the majority of the sample particles. There is a single particle in the middle (around 355 µm2), followed by a gap in the distribution and a small final group of larger particles located between 516 µm2 and 671 µm2. The standard deviation of 195.422 µm2 shows a fairly large spread and media of 231.134 µm2, which is normal considering the visible difference between the very small particles and the few large particles on the right of the graph. A skewness value of 1.114 µm2 indicates a pronounced positive skewness (strong to the right).
In Figure 10B the statistical profile of the new sample of areas shows, through the distribution by intervals, that almost half of the sample is concentrated in the first interval (between 33.2 µm2 and 153.5 µm2). As the areas increase, the number of particles decreases uniformly and gradually, forming a classic decreasing profile. There is a single larger isolate at the right end 755.122 µm2. The mean value is 217.578 µm2 and the median is 189.267 µm2. The fact that the mean is larger than the median shows an asymmetric distribution. For the calculated statistical parameters, the standard deviation is 177.945 µm2 (showing a fairly consistent variation between the particle sizes in the sample, compared with their average scale), and the asymmetry index (skewness) records a value of 1.331 µm2, indicating a pronounced positive asymmetry (accentuated to the right).
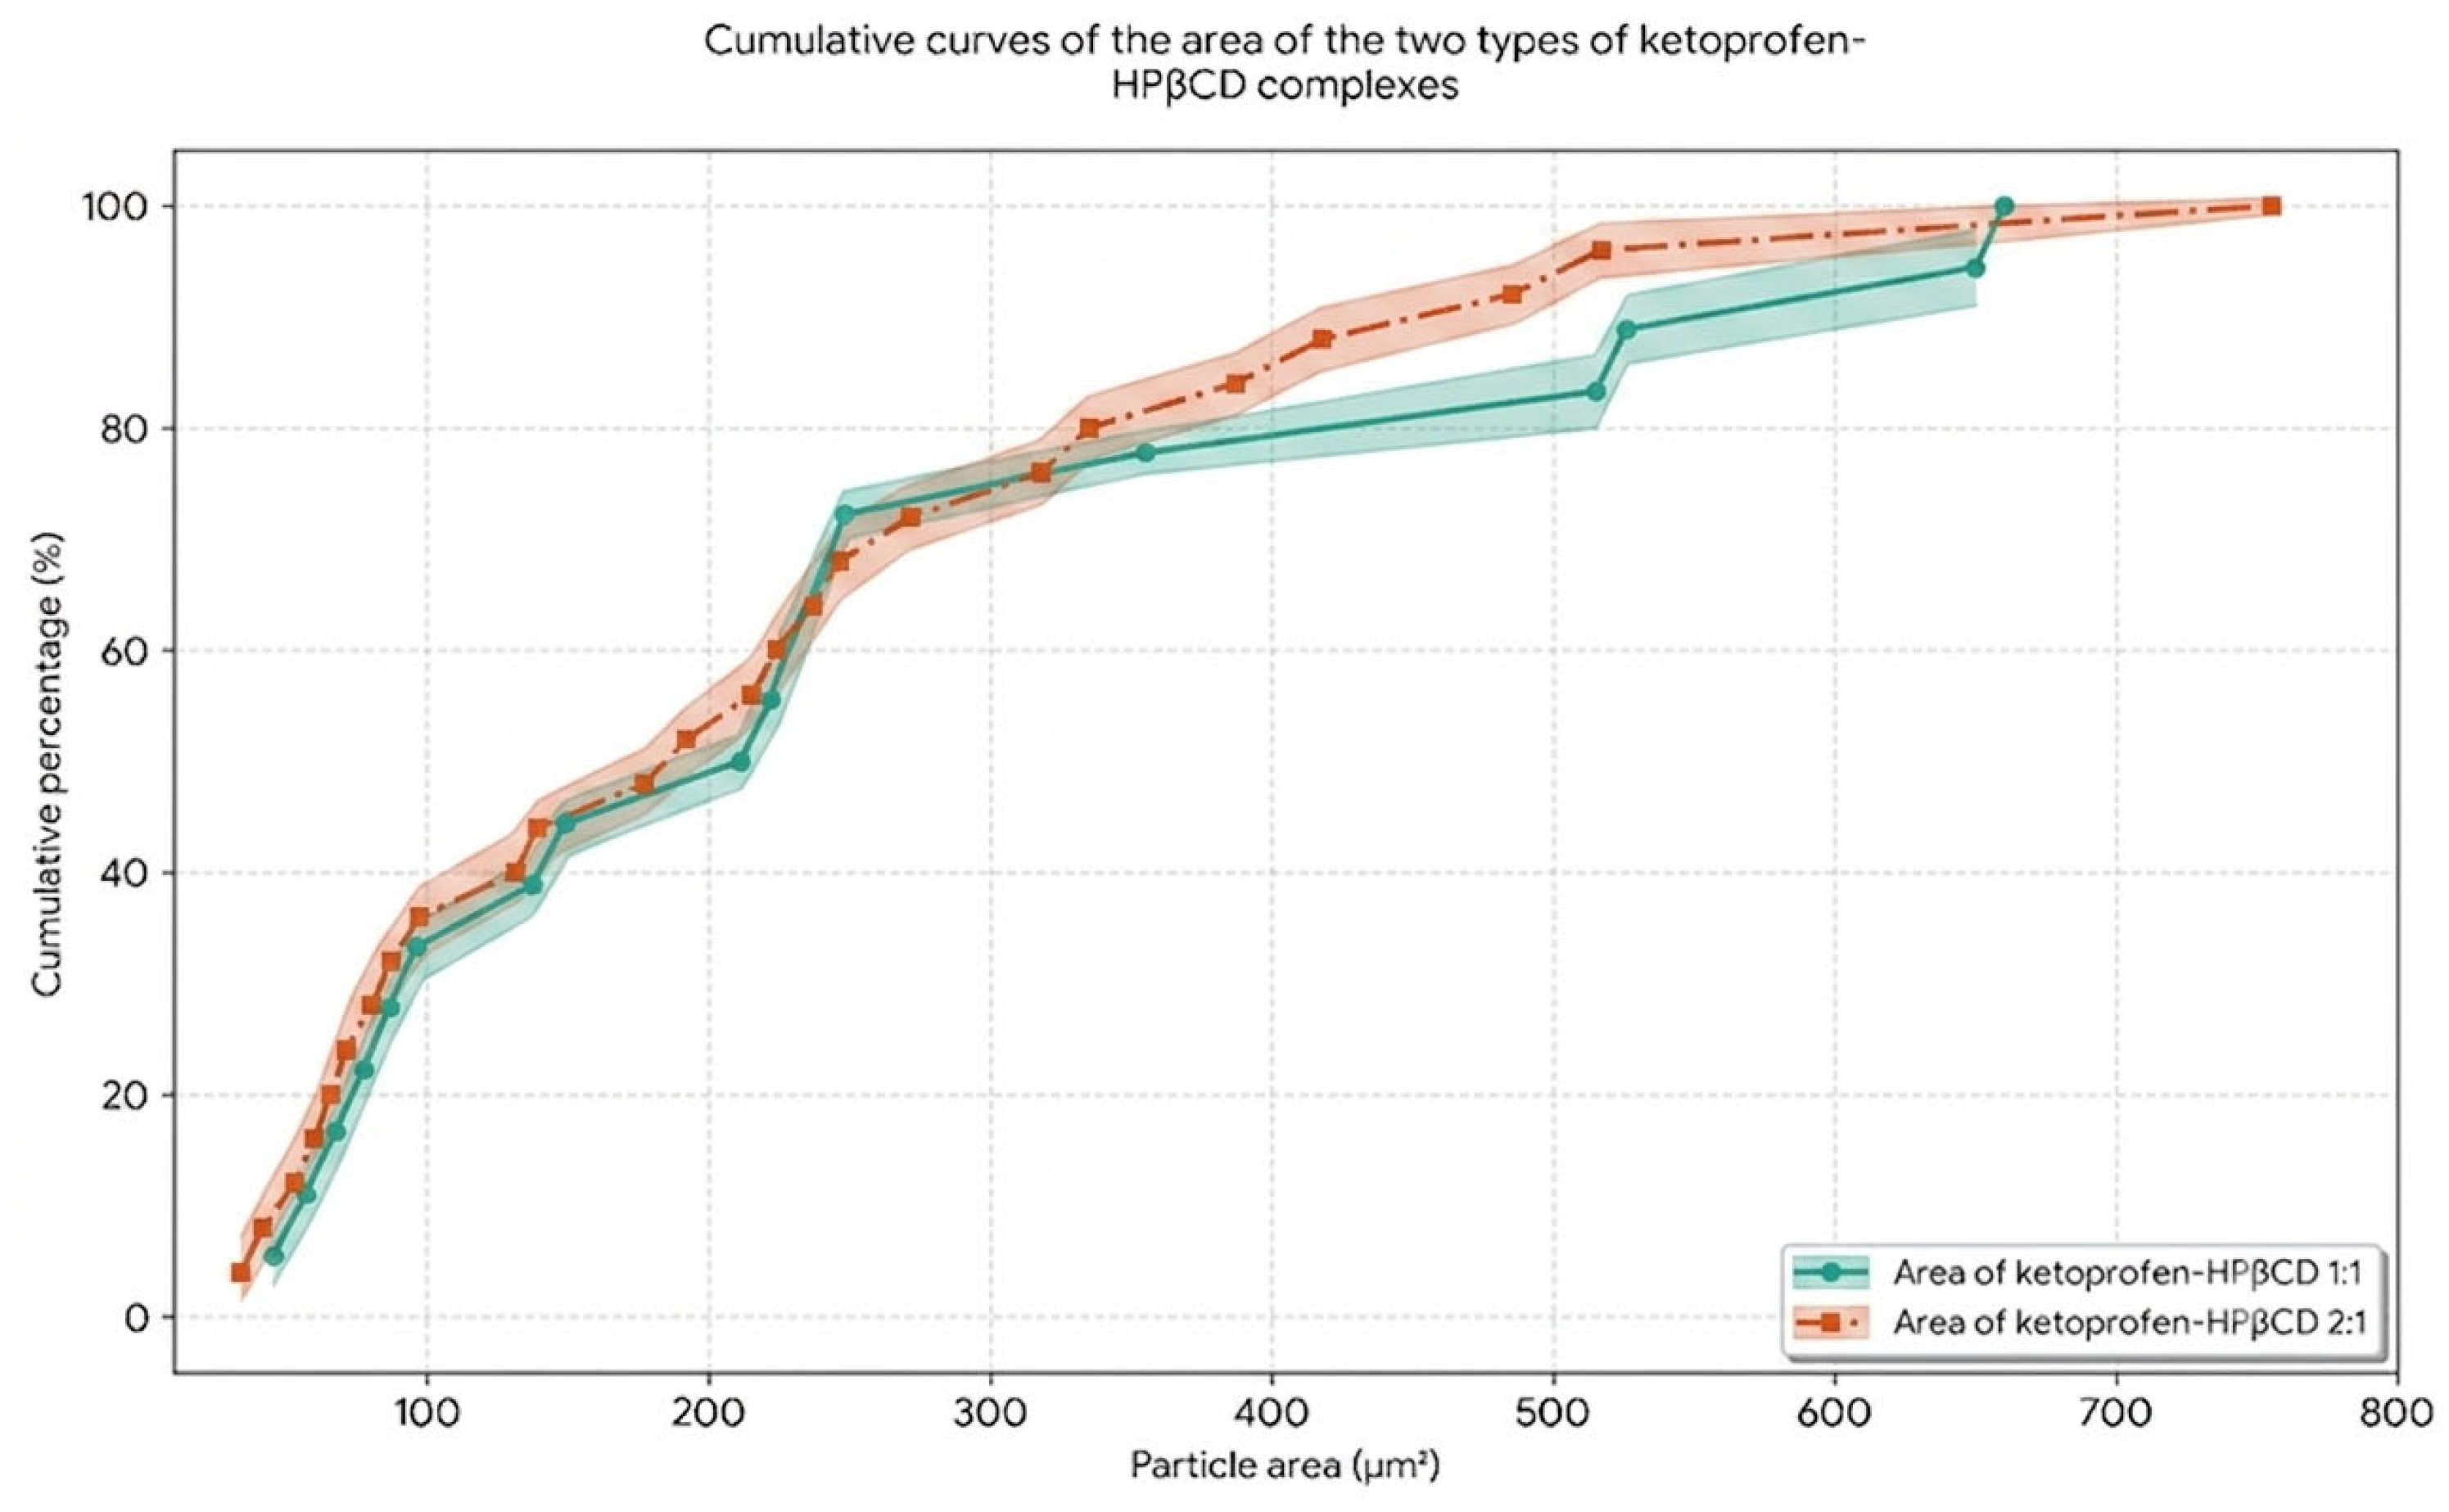
In Figure 11 the graph compares the cumulative distribution of the areas of the two sets of particles of the complexes formed. As in the case of the perimeters, the curves overlap remarkably in the first half. The very steep slope at the beginning (up to around 100–150 µm2) shows the rapid increase in the percentage, demonstrating once again that the samples are dominated by small-sized particles. Both curves reach the 80% threshold around 350–390 µm2. Analyzing the profile of the two curves, we observe that both evolve almost identically, especially in the first half of the samples (particles with small and medium areas up to 300 µm2). In the area of large particles of 400 µm2 towards the end of the distribution, the curves begin to separate slightly, but even there, the horizontal distance between the points tends to remain largely covered by the margins of the error bars [28]. This close visual correlation demonstrates that both experimental batches of particles possess an area profile (and implicitly a three-dimensional particle size distribution) equivalent from a statistical point of view. The powders used in both sets of tests were efficiently sorted, guaranteeing that macroscopic variations in compaction or flow are not caused by massive differences in particle size/area, but rather by textural and orientation factors.
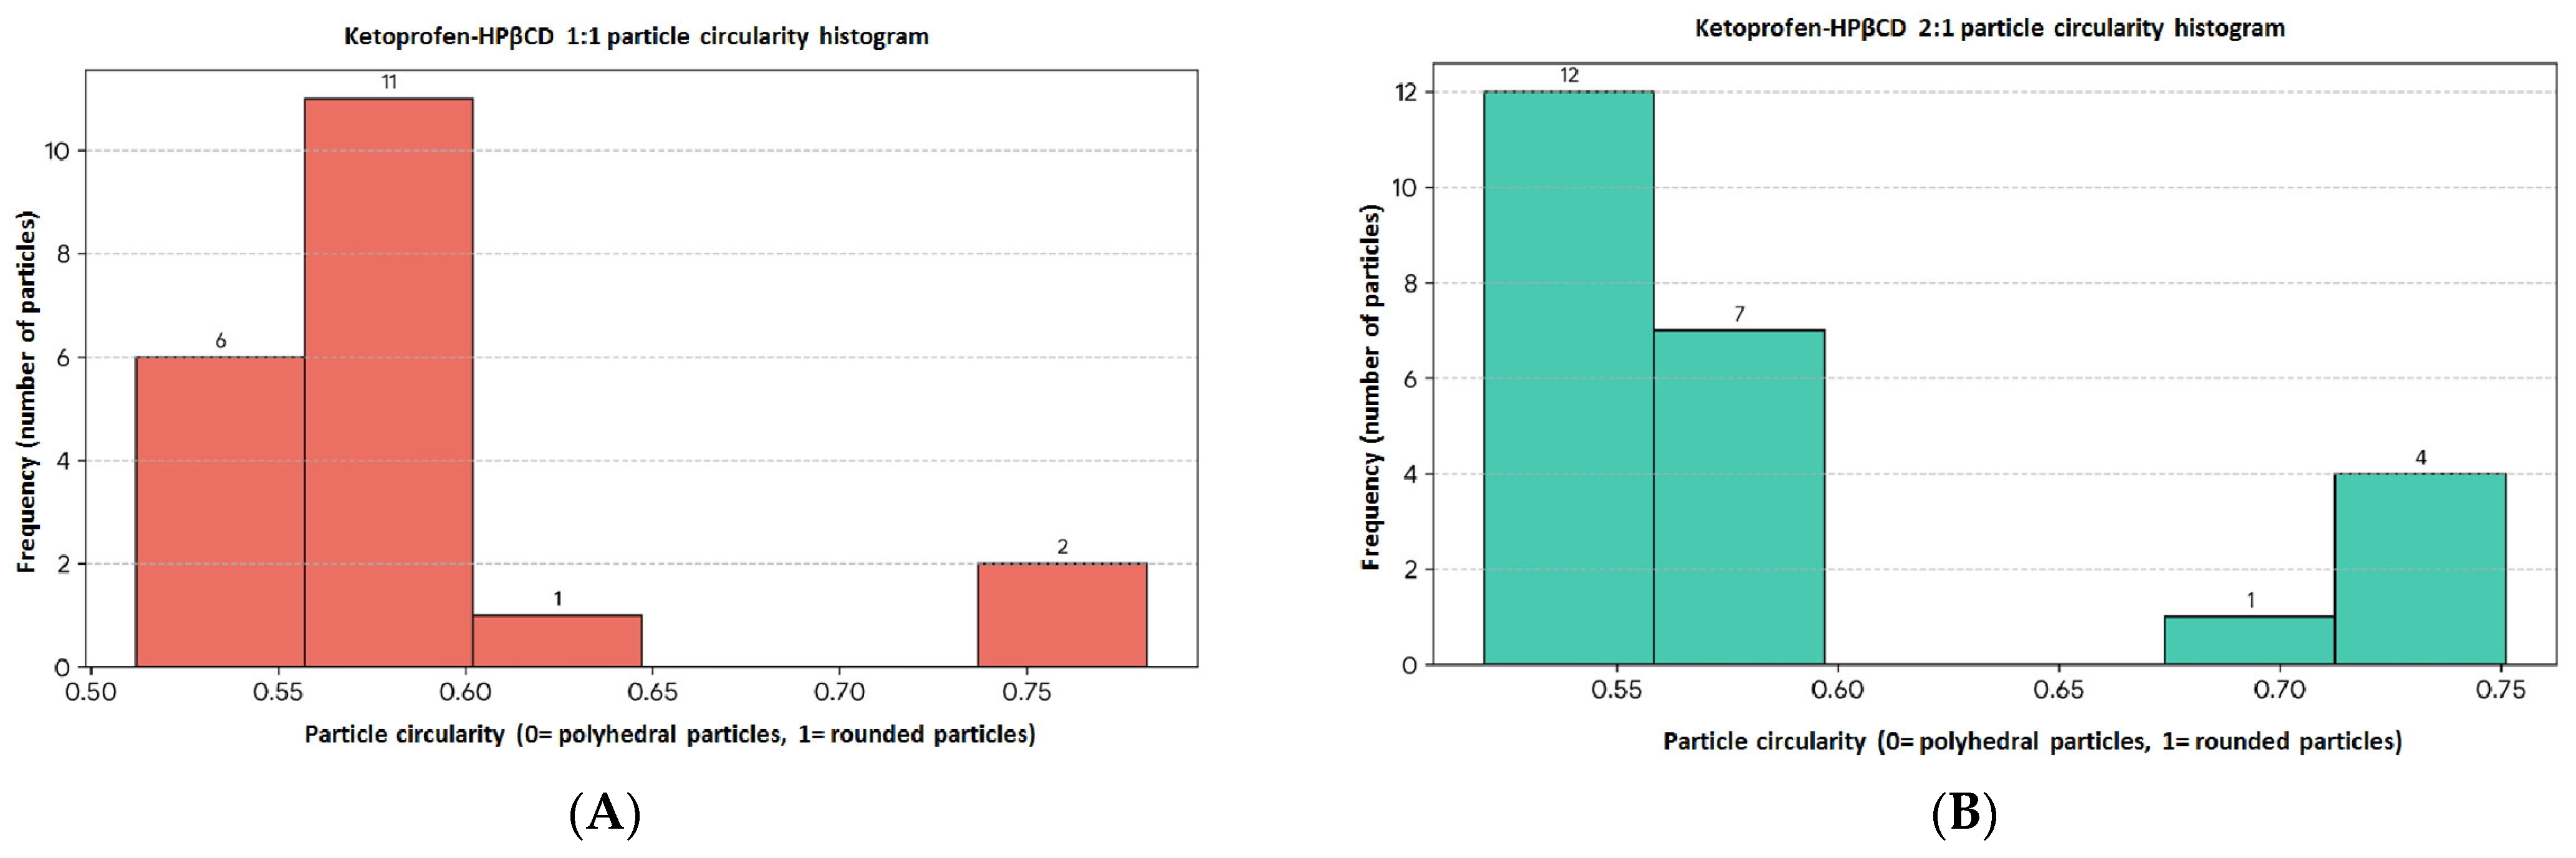
In Figure 12A of the statistical profile of circularity in the interval distribution, a massive concentration is observed in the center-left area. The interval 0.55–0.60 is the most populated, gathering more than half of the particle sample. Together with the first interval, we deduce that 85% of the particles have circularity below 0.60. On the far right we have a small, isolated group formed by two particles with a much higher circularity (0.739 and 0.782), which means that they are significantly closer to the shape of a perfect circle compared with the rest of the sample. The calculated statistical parameters quantified a mean value of 0.5825 and a median value of 0.5675. The calculated standard deviation is approximately 0.0666, a small standard deviation, which indicates that, except for the two very round particles, the vast majority of the shapes are quite similar to each other in geometry. The asymmetry index recorded a value of 2.1454, which shows an extremely strong positive asymmetry to the right.
In Figure 12B the statistical profiles of circularity show a main concentration, as in the previous set, the overwhelming majority of the particles have rather elongated or irregular shapes. The first two intervals together gather almost 80% of the sample, having values below 0.60. The most populated interval is the one at the bottom of the graph in the interval 0.52–0.56. The subgroup of spherical particles is noteworthy, a small distinct group formed by particles that have a high circularity, ranging between 0.71 and 0.75. These are the particles closest to a perfectly round shape in this sample. The calculated statistical parameters recorded a mean value of 0.5870 and a median of 0.5585. The standard deviation of approximately 0.0763 shows a slightly greater spread of the values compared with the first set of particles, explained by the presence of particles on the far right. The asymmetry index with a value of approximately 1.3954 indicates a rightward asymmetry, but the coefficient is smaller than that of the first sample (2.1454), because the transition to high values is made through a larger number of particles, decreasing the “isolation” effect of the graph’s tail [29].
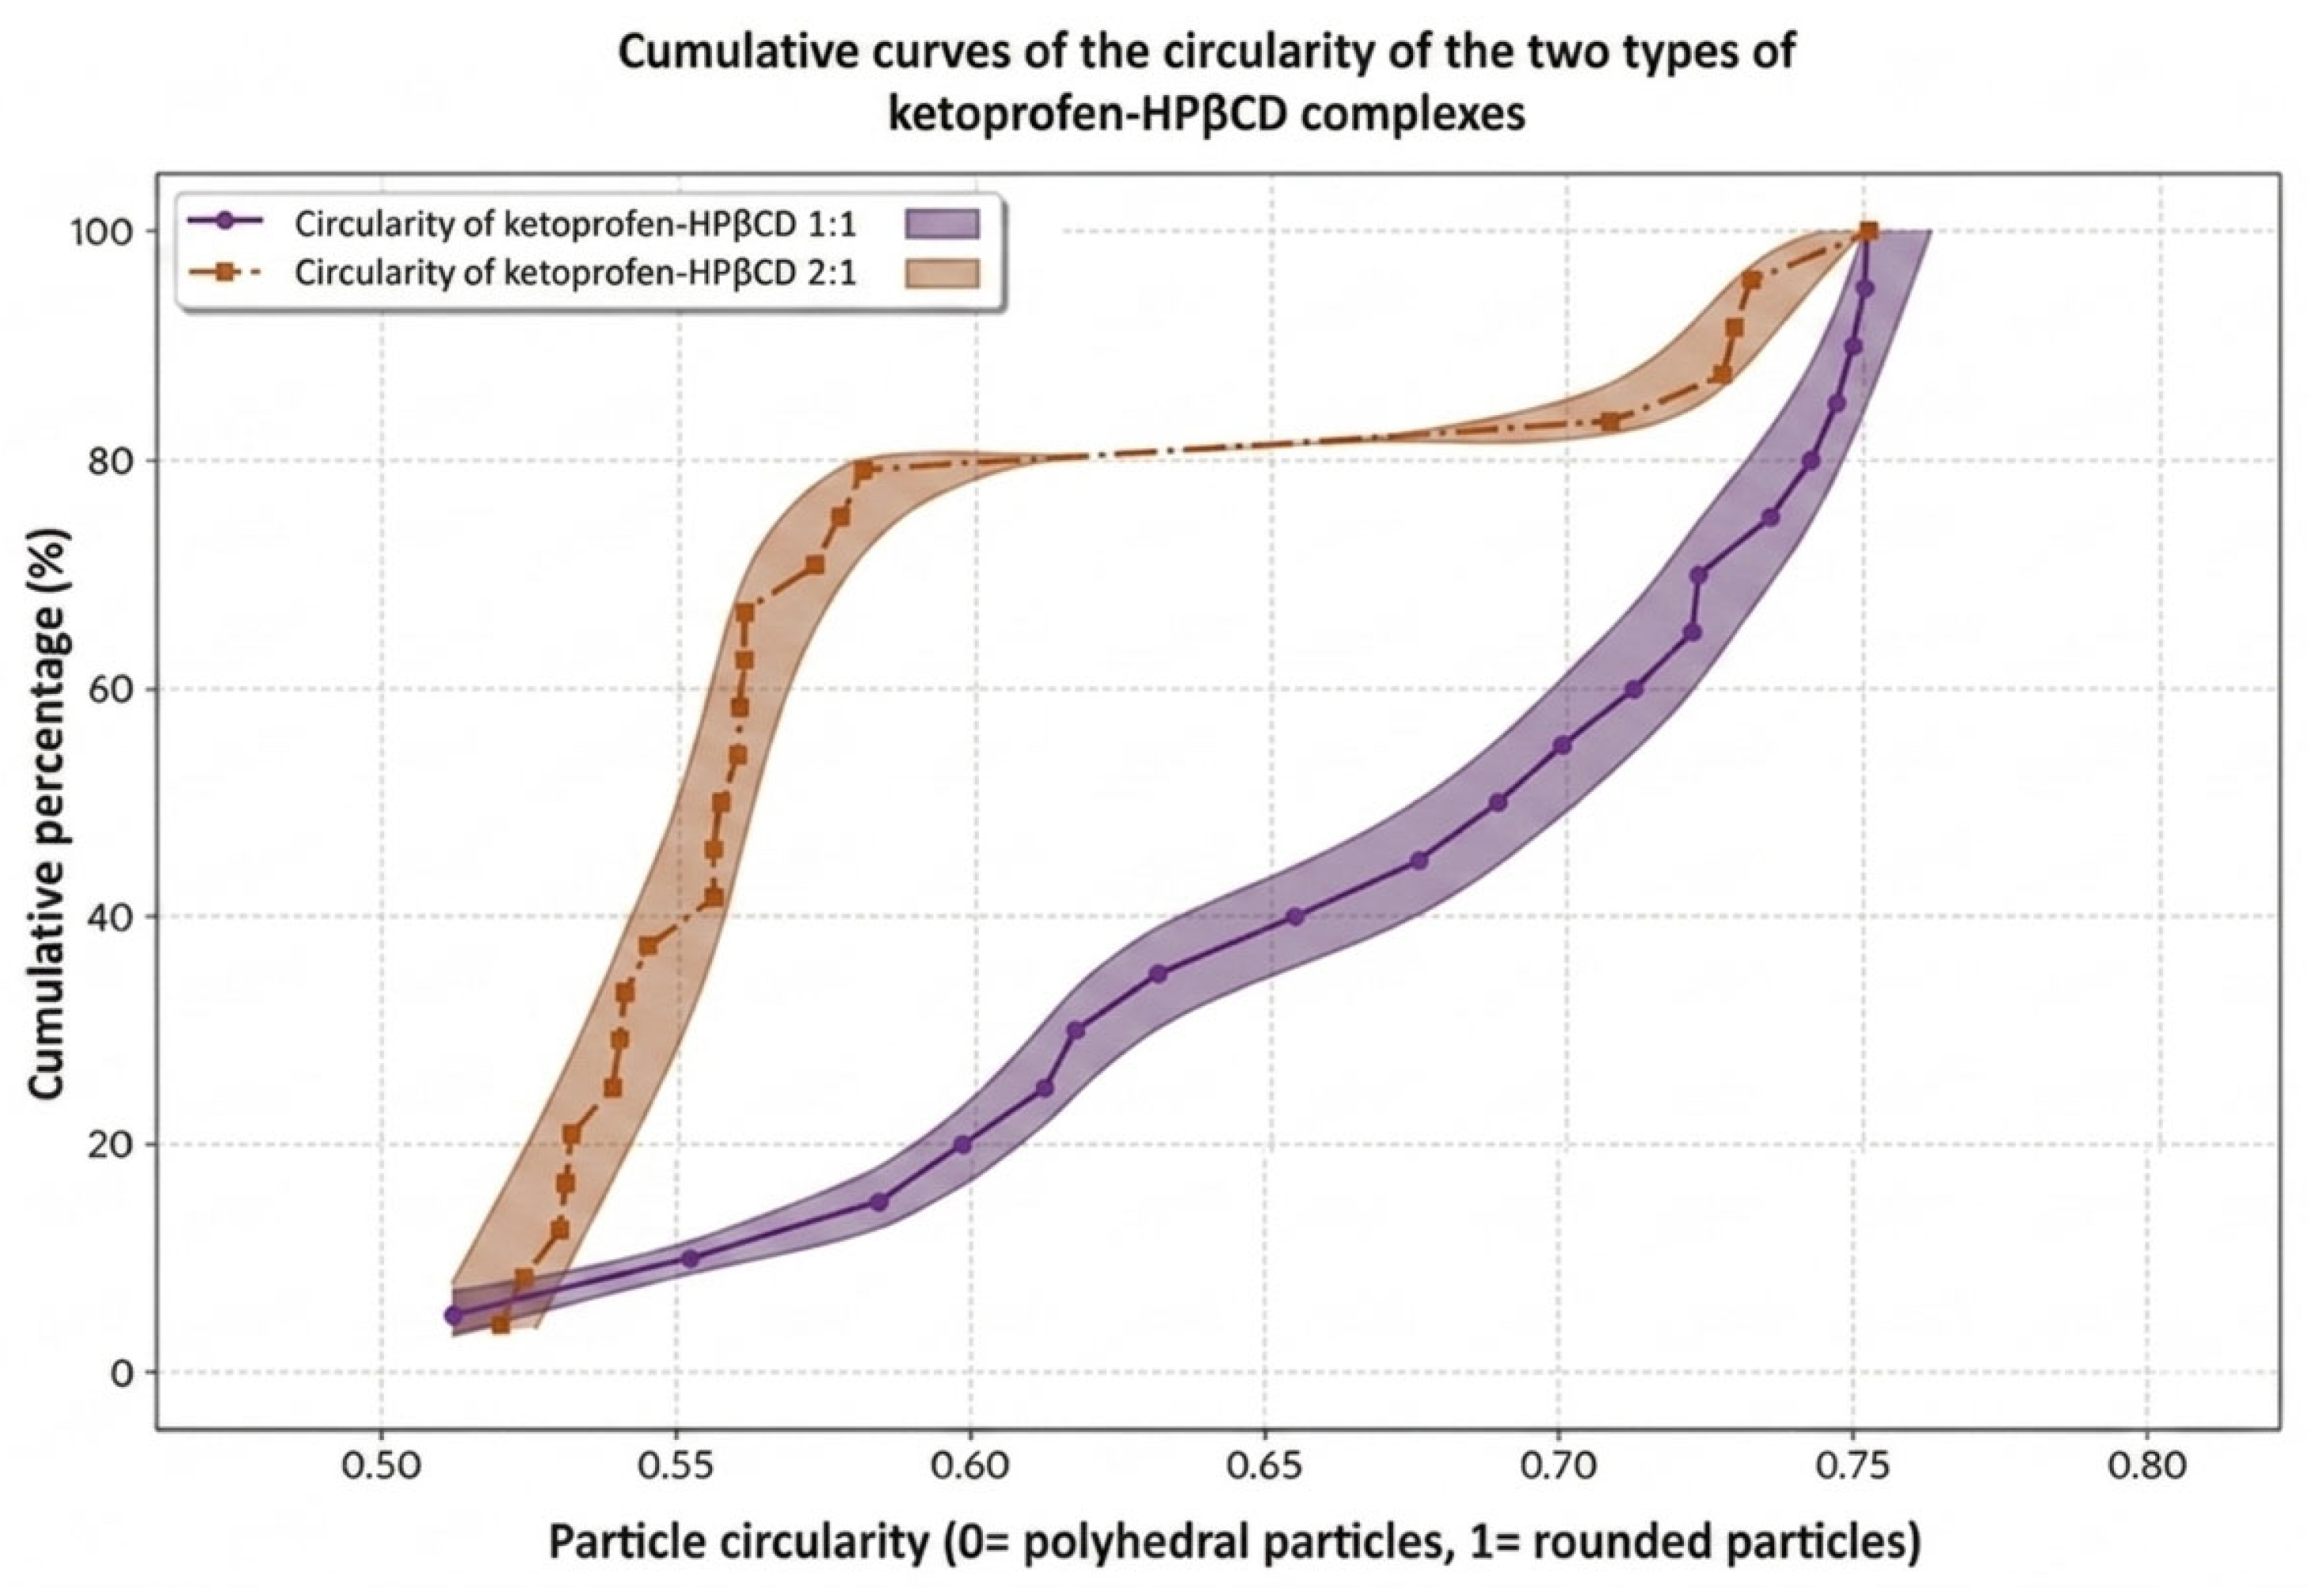
In Figure 13, in order to precisely capture the geometric differences in synthesis or structural behavior between the two particle samples, we have combined both data sets into a single cumulative distribution function (CDF) plot. The graph shows a clear decoupling between the two sets of particles, a clear morphological divergence. The purple curve shows a much steeper profile in the first half of the interval, reflecting that a large part of the sample is tightly packed in the circularity range (0.52–0.58). The median of 0.558 of the second set of the particles indicates that 50% of the ketoprofen–HPBCD 2:1 particles noticeably deviate from the ideal spherical shape. By comparison, the first set of ketoprofen–HPBCD 1:1 particles is considerably more rounded.
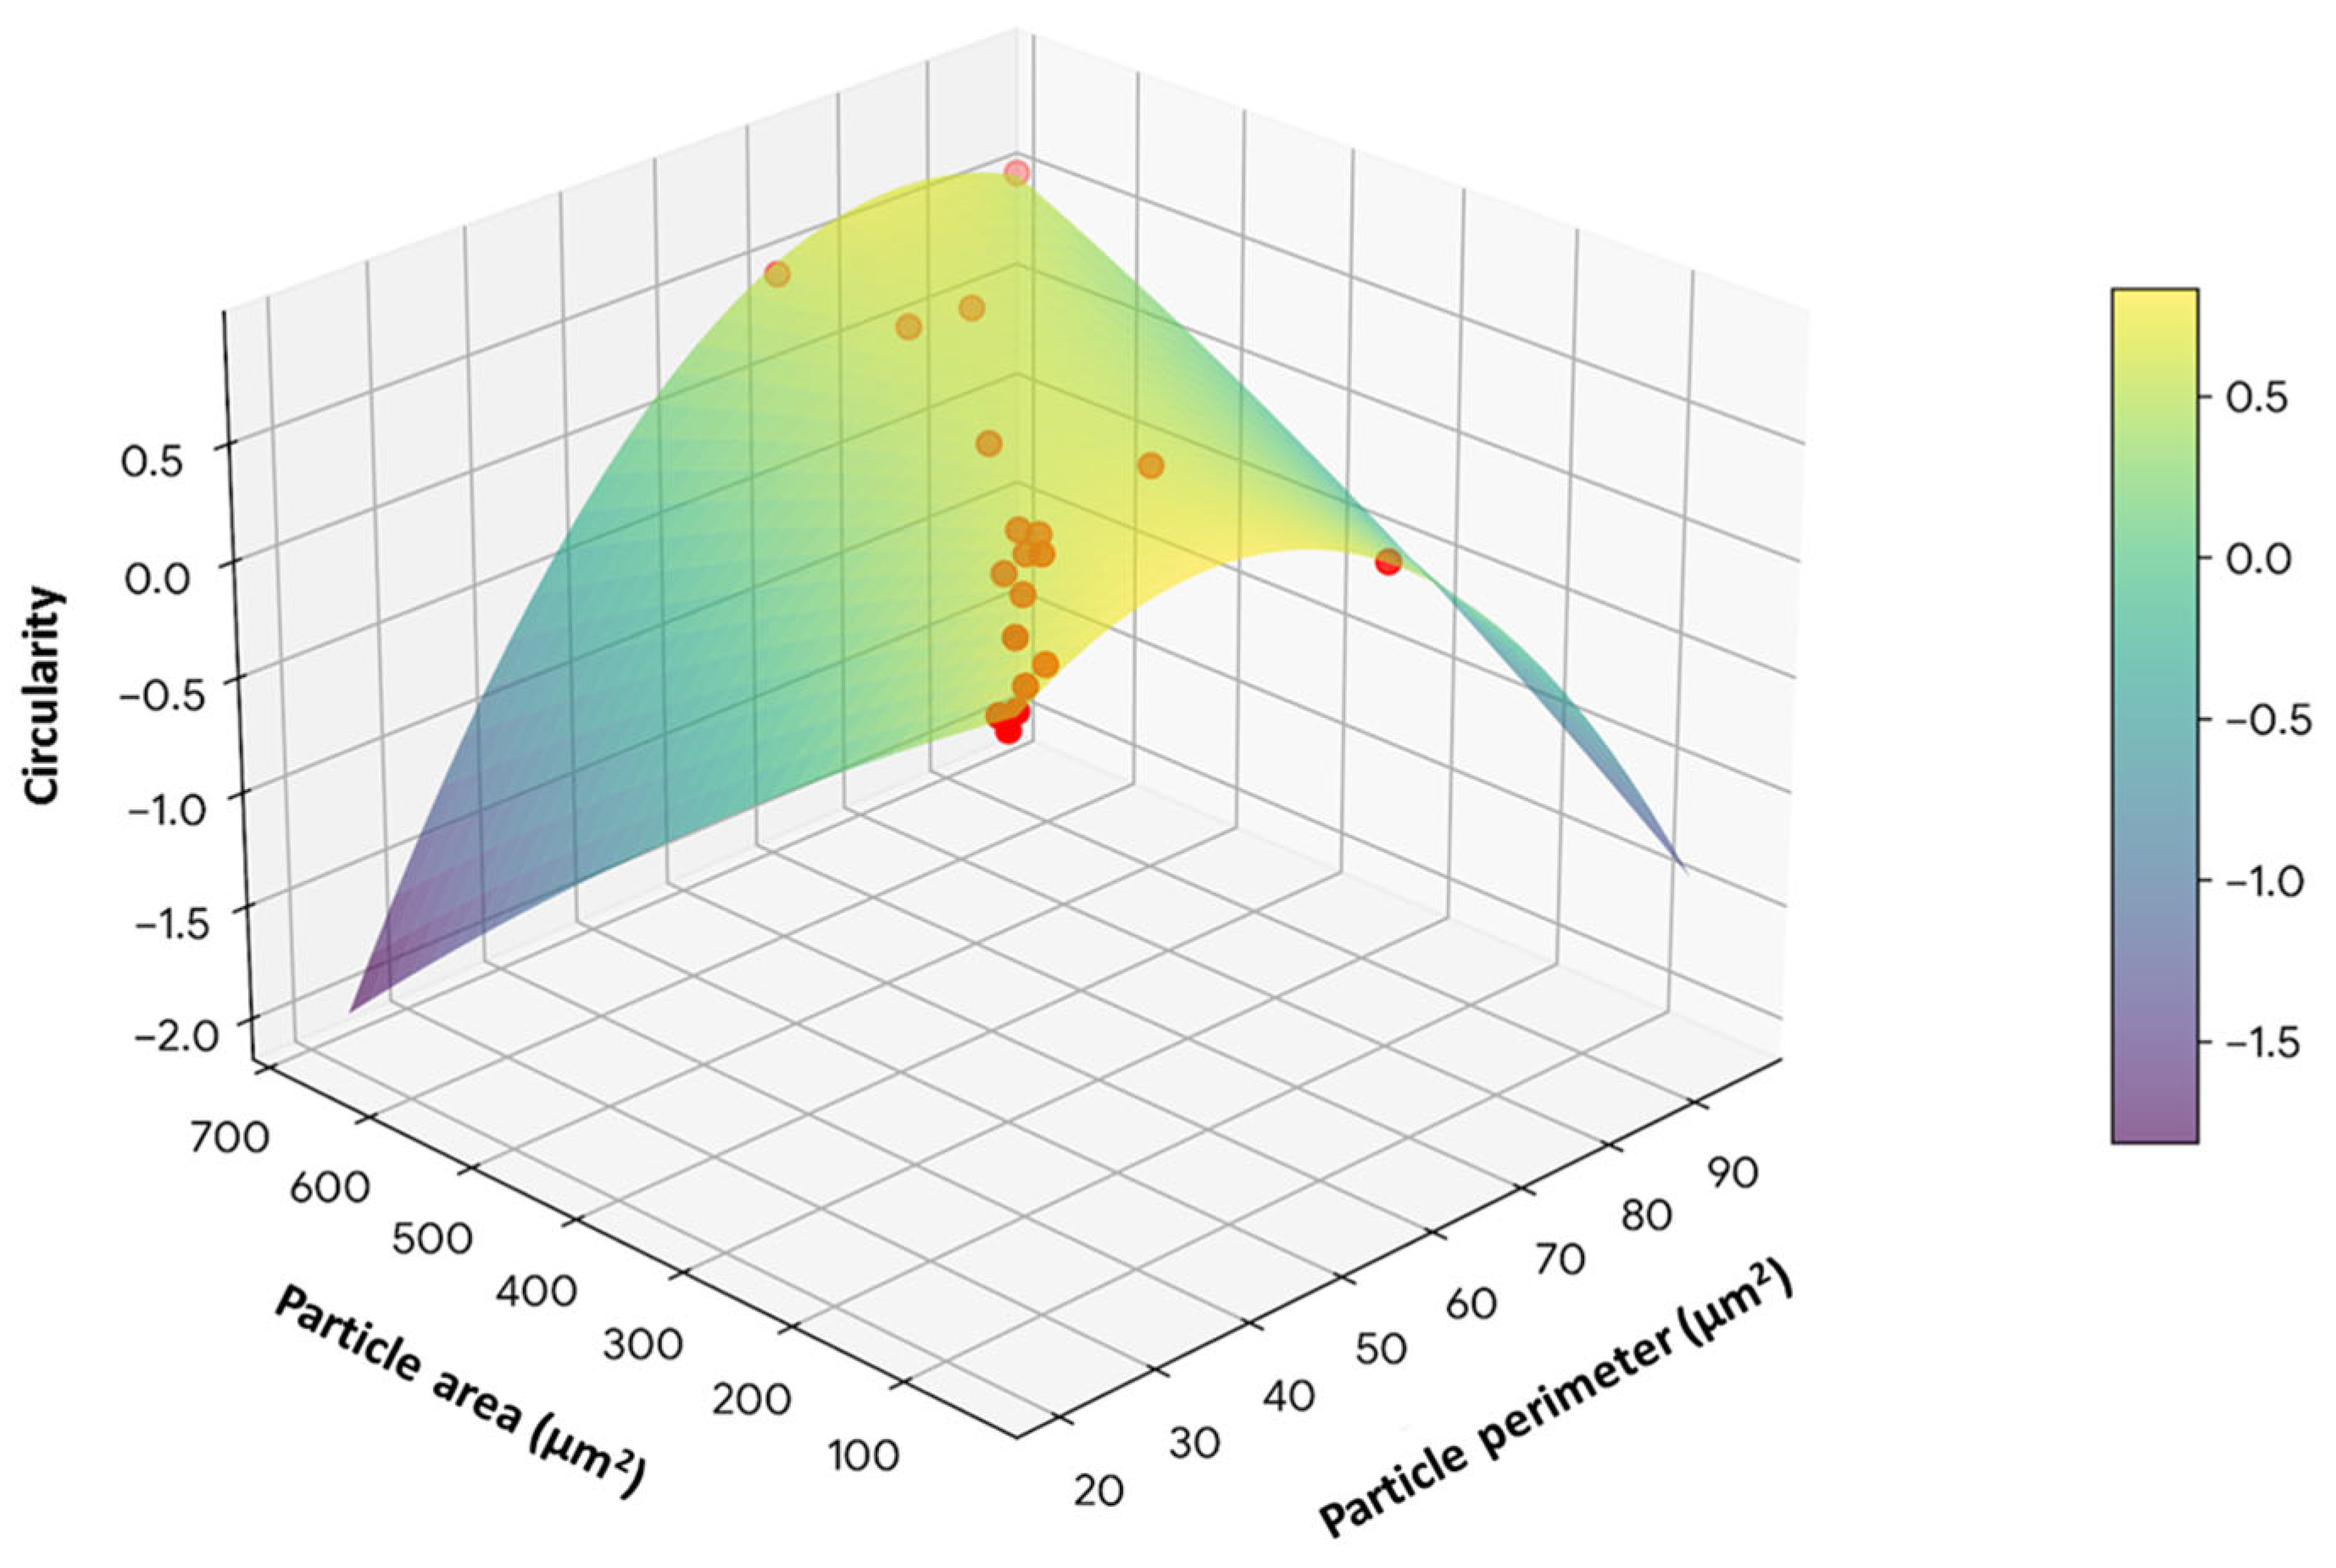
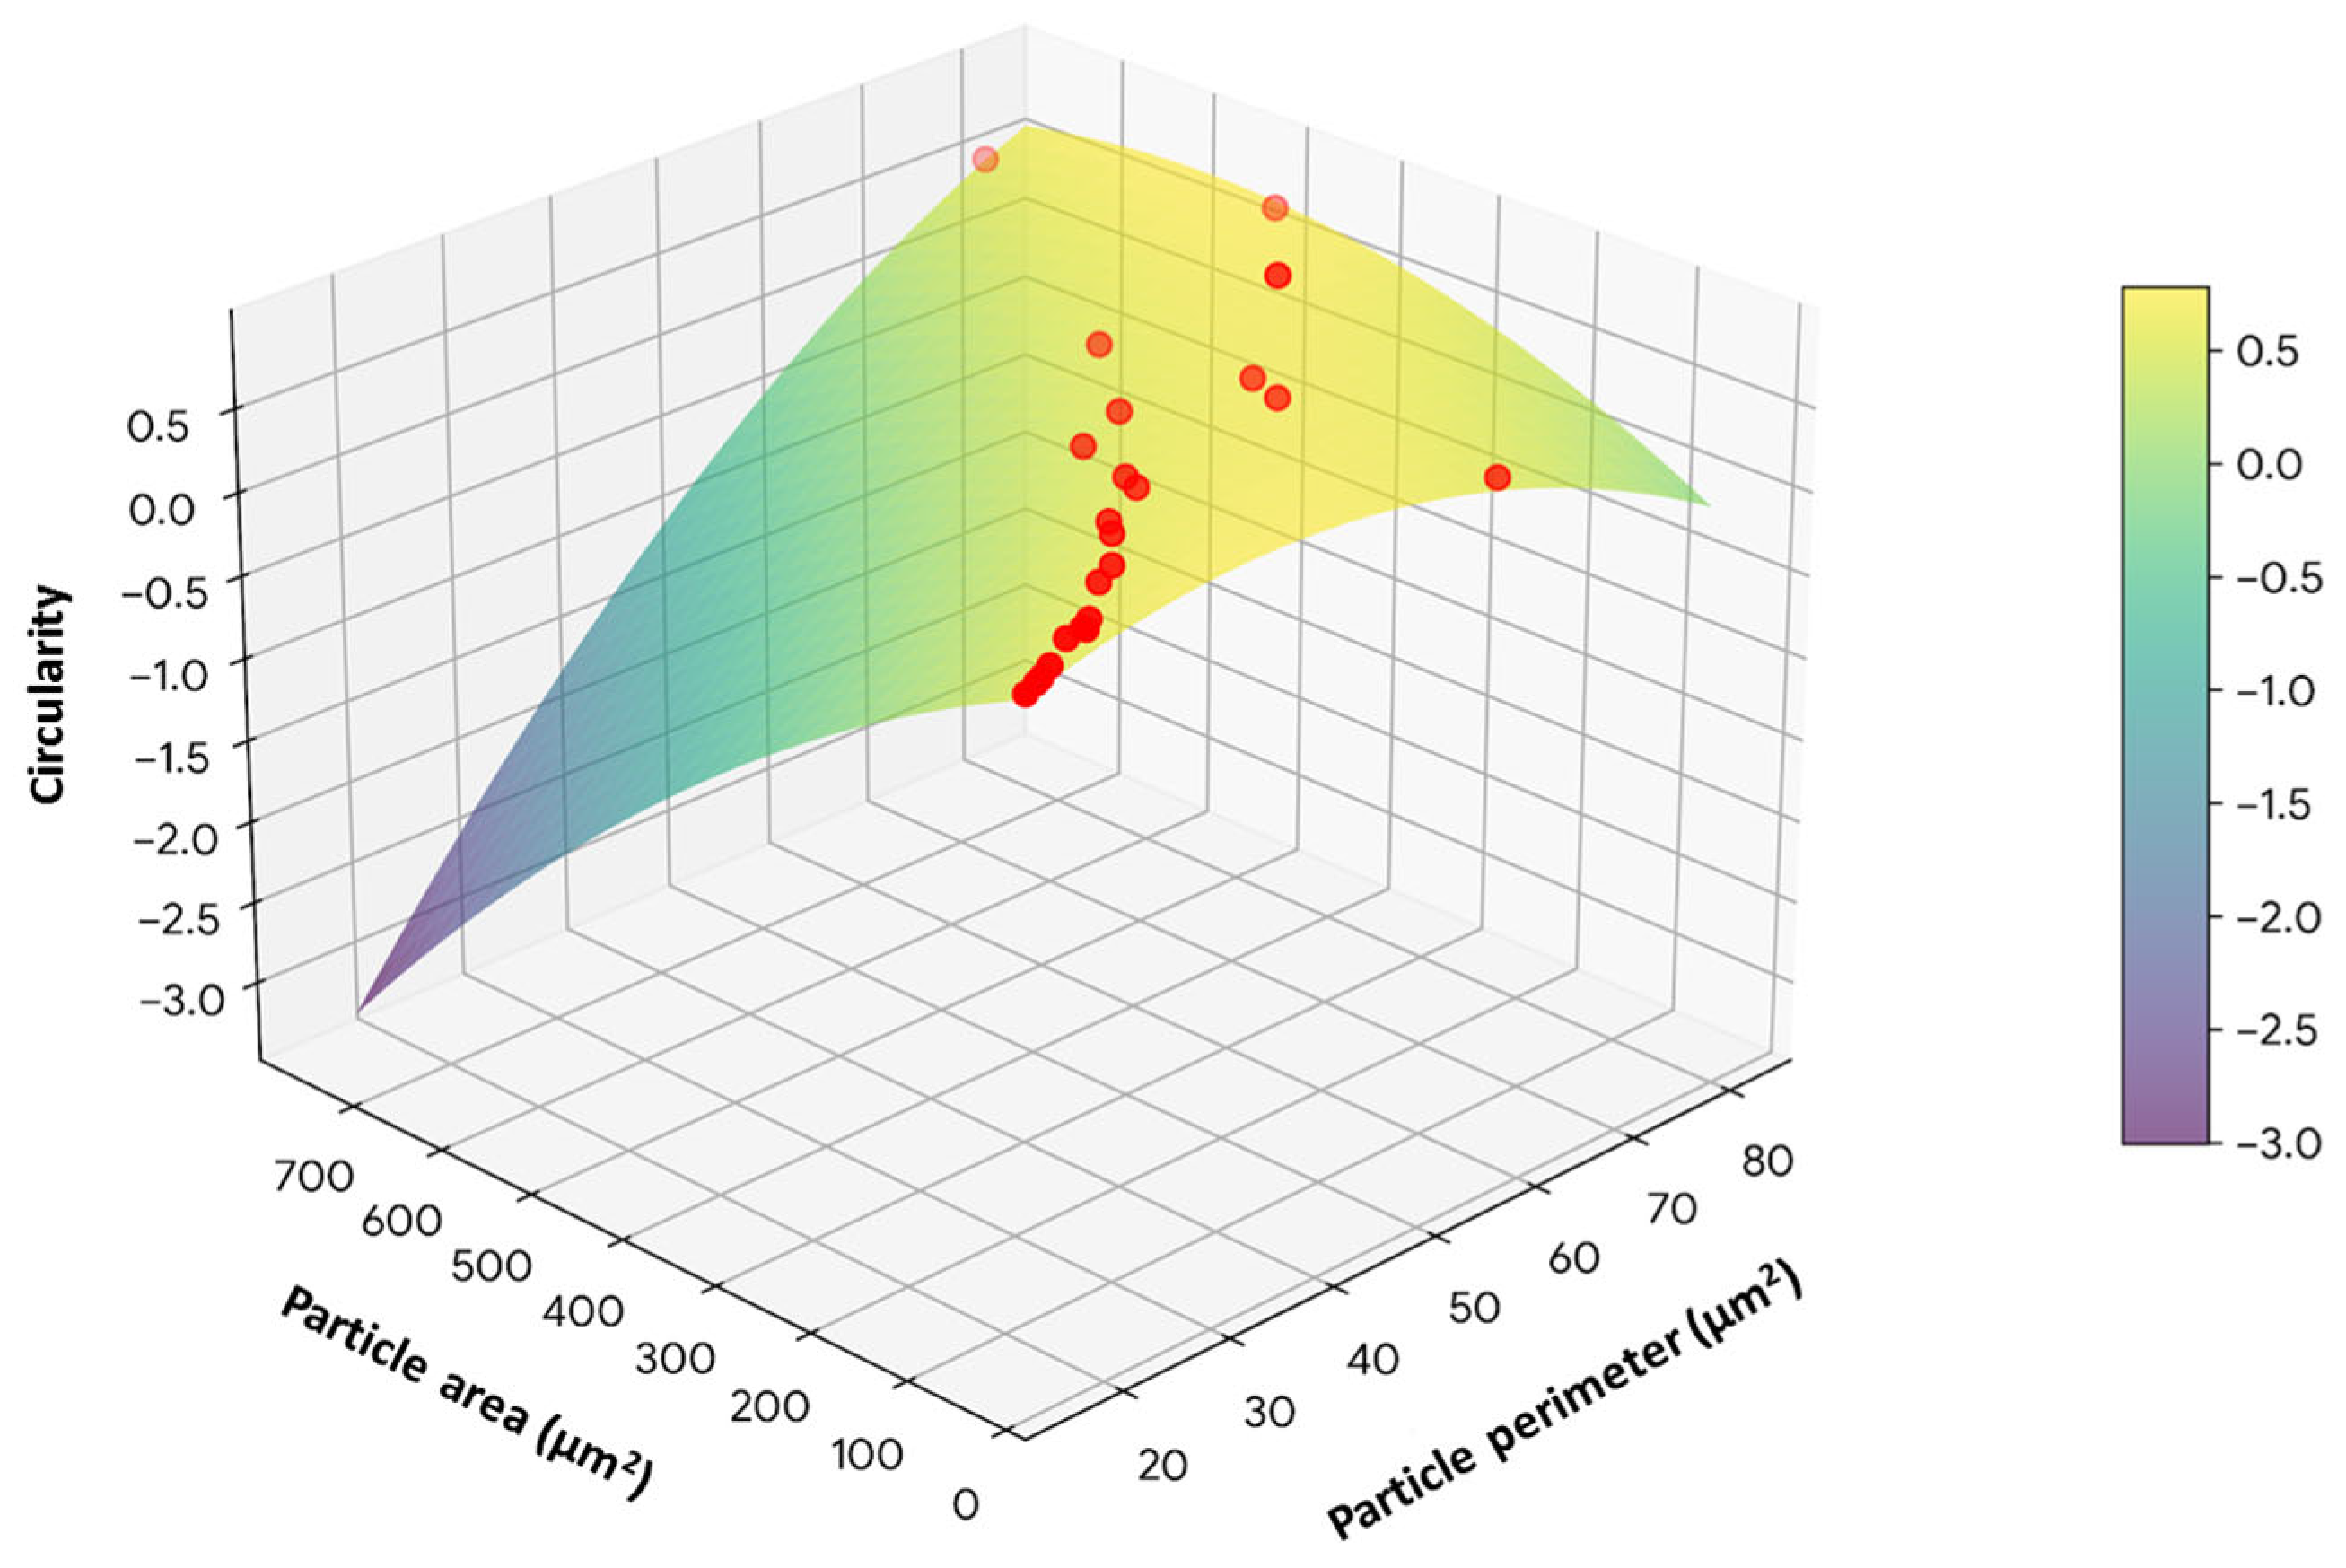
The major difference is observed towards the end where in the case of the second set of particles (violet curve) a more pronounced jump appears (where a subgroup of round particles accumulates in the area 0.71–0.75), while in the first set of particles (red curve) it stretches a little more to the right, reaching the absolute maximum value of circularity (0.782). To show the clear dependence between circularity and the two parameters with which it is calculated, area and perimeter, we chose the representation in the form of response surfaces.
In Figure 14 for the particles of the 1:1 molar ketoprofen–HPβCD complexes the response surface has a clear asymmetric dome shape. It is observed that the maximum circularity (located in the intense yellow area on the ridge) is obtained when the ratio between area and perimeter is geometrically optimized (medium to large areas of the particles are correlated with relatively tight perimeters). The rounded particles are represented like red dots. The edges of the response surface that fall steeply (in blue/purple color) indicate theoretical areas where the particles become extremely irregular, having a very large perimeter for a small area.
In Figure 15 for the particles of the 2:1 molar ketoprofen–HPβCD complexes, the model describes a “curved inclined plane” type surface (or a continuous slope). Since in this case a larger distribution of rounded particles (red dots) grouped in the upper area (circularities of 0.71–0.75) was recorded, the peak of maximum stability (yellow area) extends over a wider range of perimeters. However, the slope drops extremely abruptly in the back left corner towards the area of particles with very large areas but disproportionate perimeters.
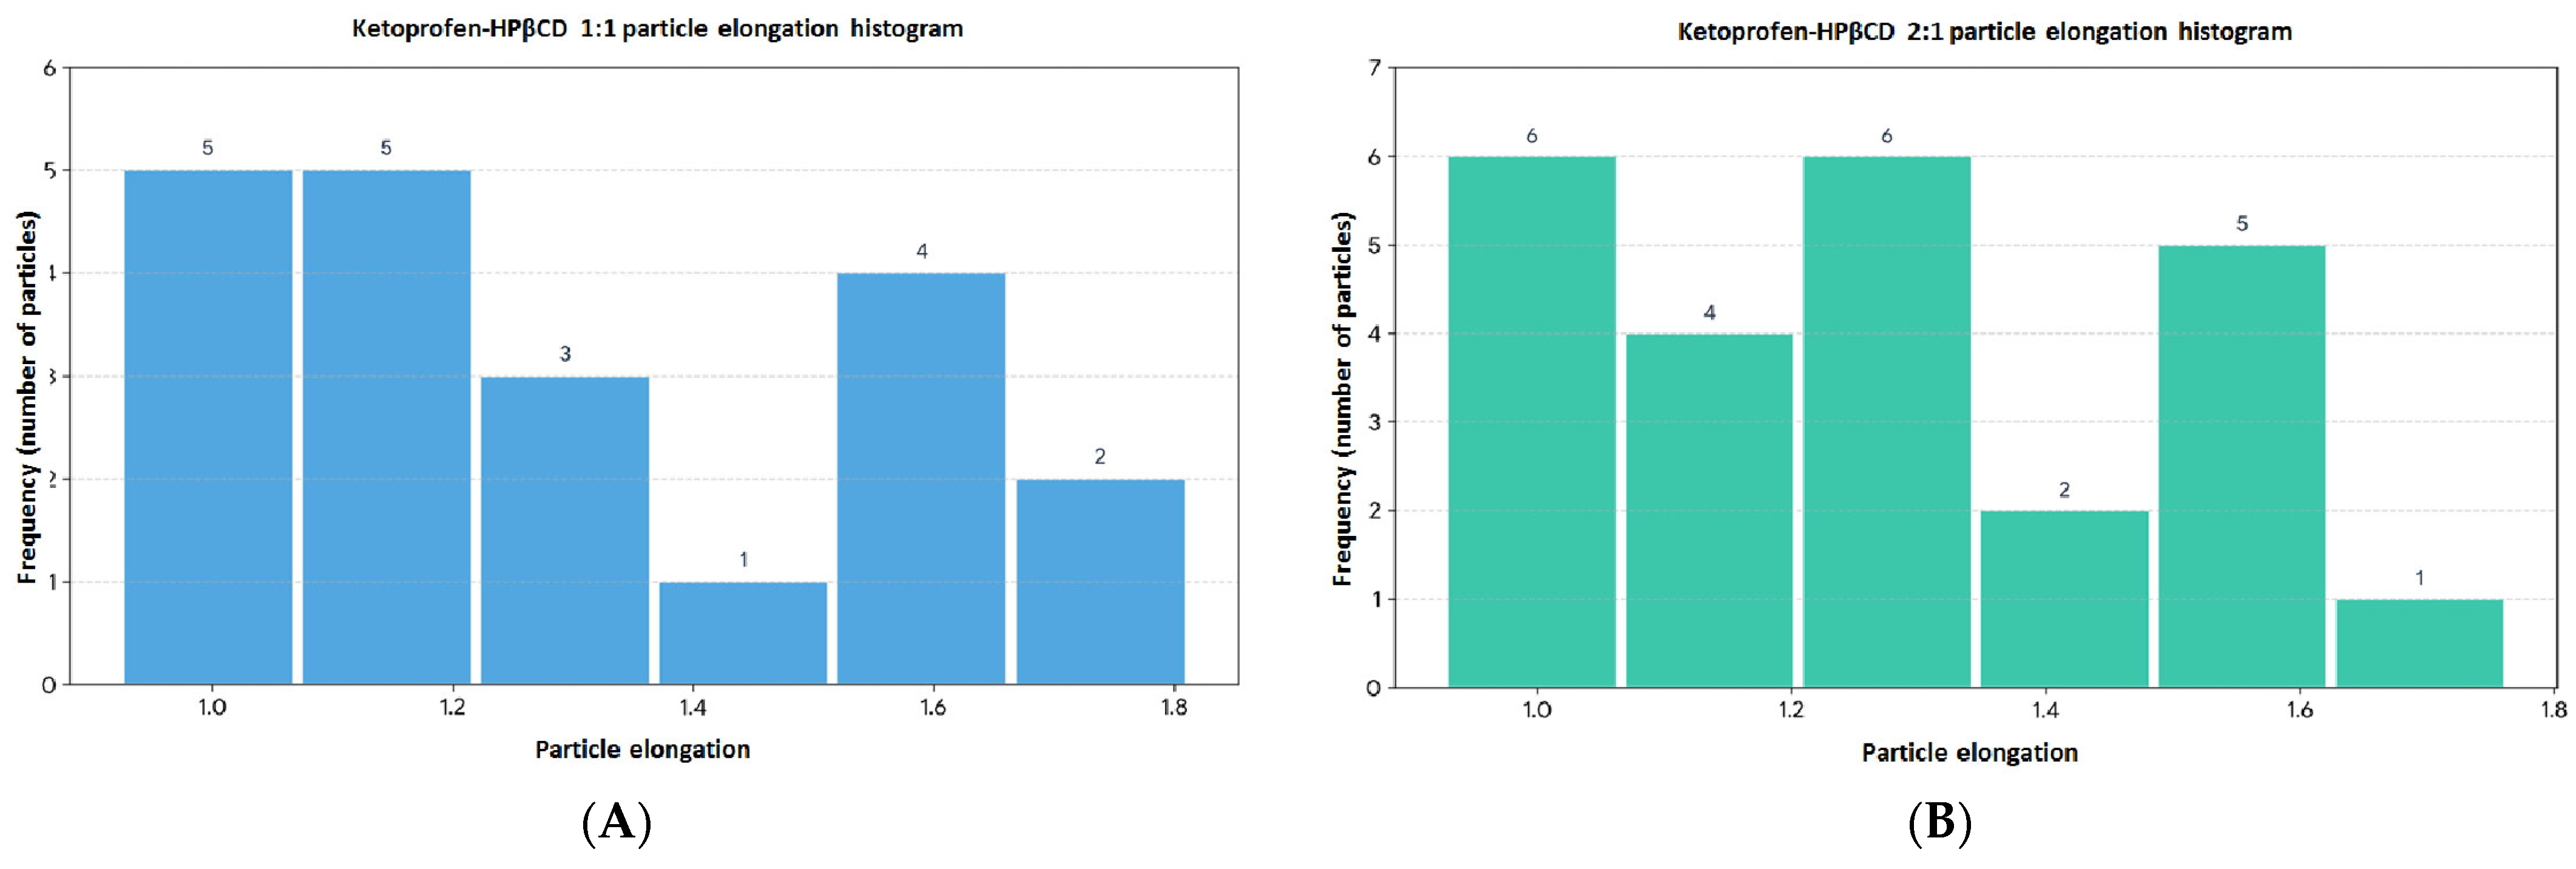
In Figure 16A the largest groups of particles in the first two intervals are located in the range 0.92–1.22. An elongation value close to 1.0 indicates isometric particles (where the length and width are relatively equal, such as spherical or square shapes). Half of the particle sample tends towards this symmetry. The graph shows a bimodal distribution starting with a slight decrease (in the range 1.37–1.52), followed by a new secondary peak of particles in the area 1.52–1.67. This behavior suggests that the particle sample is bimodal, being formed by a mixture of two types of populations: compact/round particles and clearly elongated particles (elongation > 1.5). At the right end of the histogram we have particles that pass the threshold of 1.67 (reaching the maximum value of 1.813). These are extremely elongated, strongly acicular, filamentous or elliptical particles.
In Figure 16B a much more uniform particles elongation distribution can be observed compared with the first set of particles. If the first set had a clear bimodal trend (a gap in the middle and two separate peaks), the second set of particles is much more homogeneous and balanced. The particles are distributed quite symmetrically over the entire range of values, having a stable particle frequency in almost every interval. The mean value is 1.2659, and the median is 1.2300. These values confirm that, on average, the particles in this sample have a length approximately 23–26% greater than their width (moderate elliptical/oval shapes). An asymmetry value of 0.3115 indicates a very weak positive asymmetry (almost symmetrical). This small index mathematically confirms the visual balance in the histogram, with no disproportionate crowding in one part of the graph. The standard deviation of 0.2313 shows a controlled spread of shapes, from almost perfectly round particles (Min = 0.926) to quite long particles (Max = 1.764).
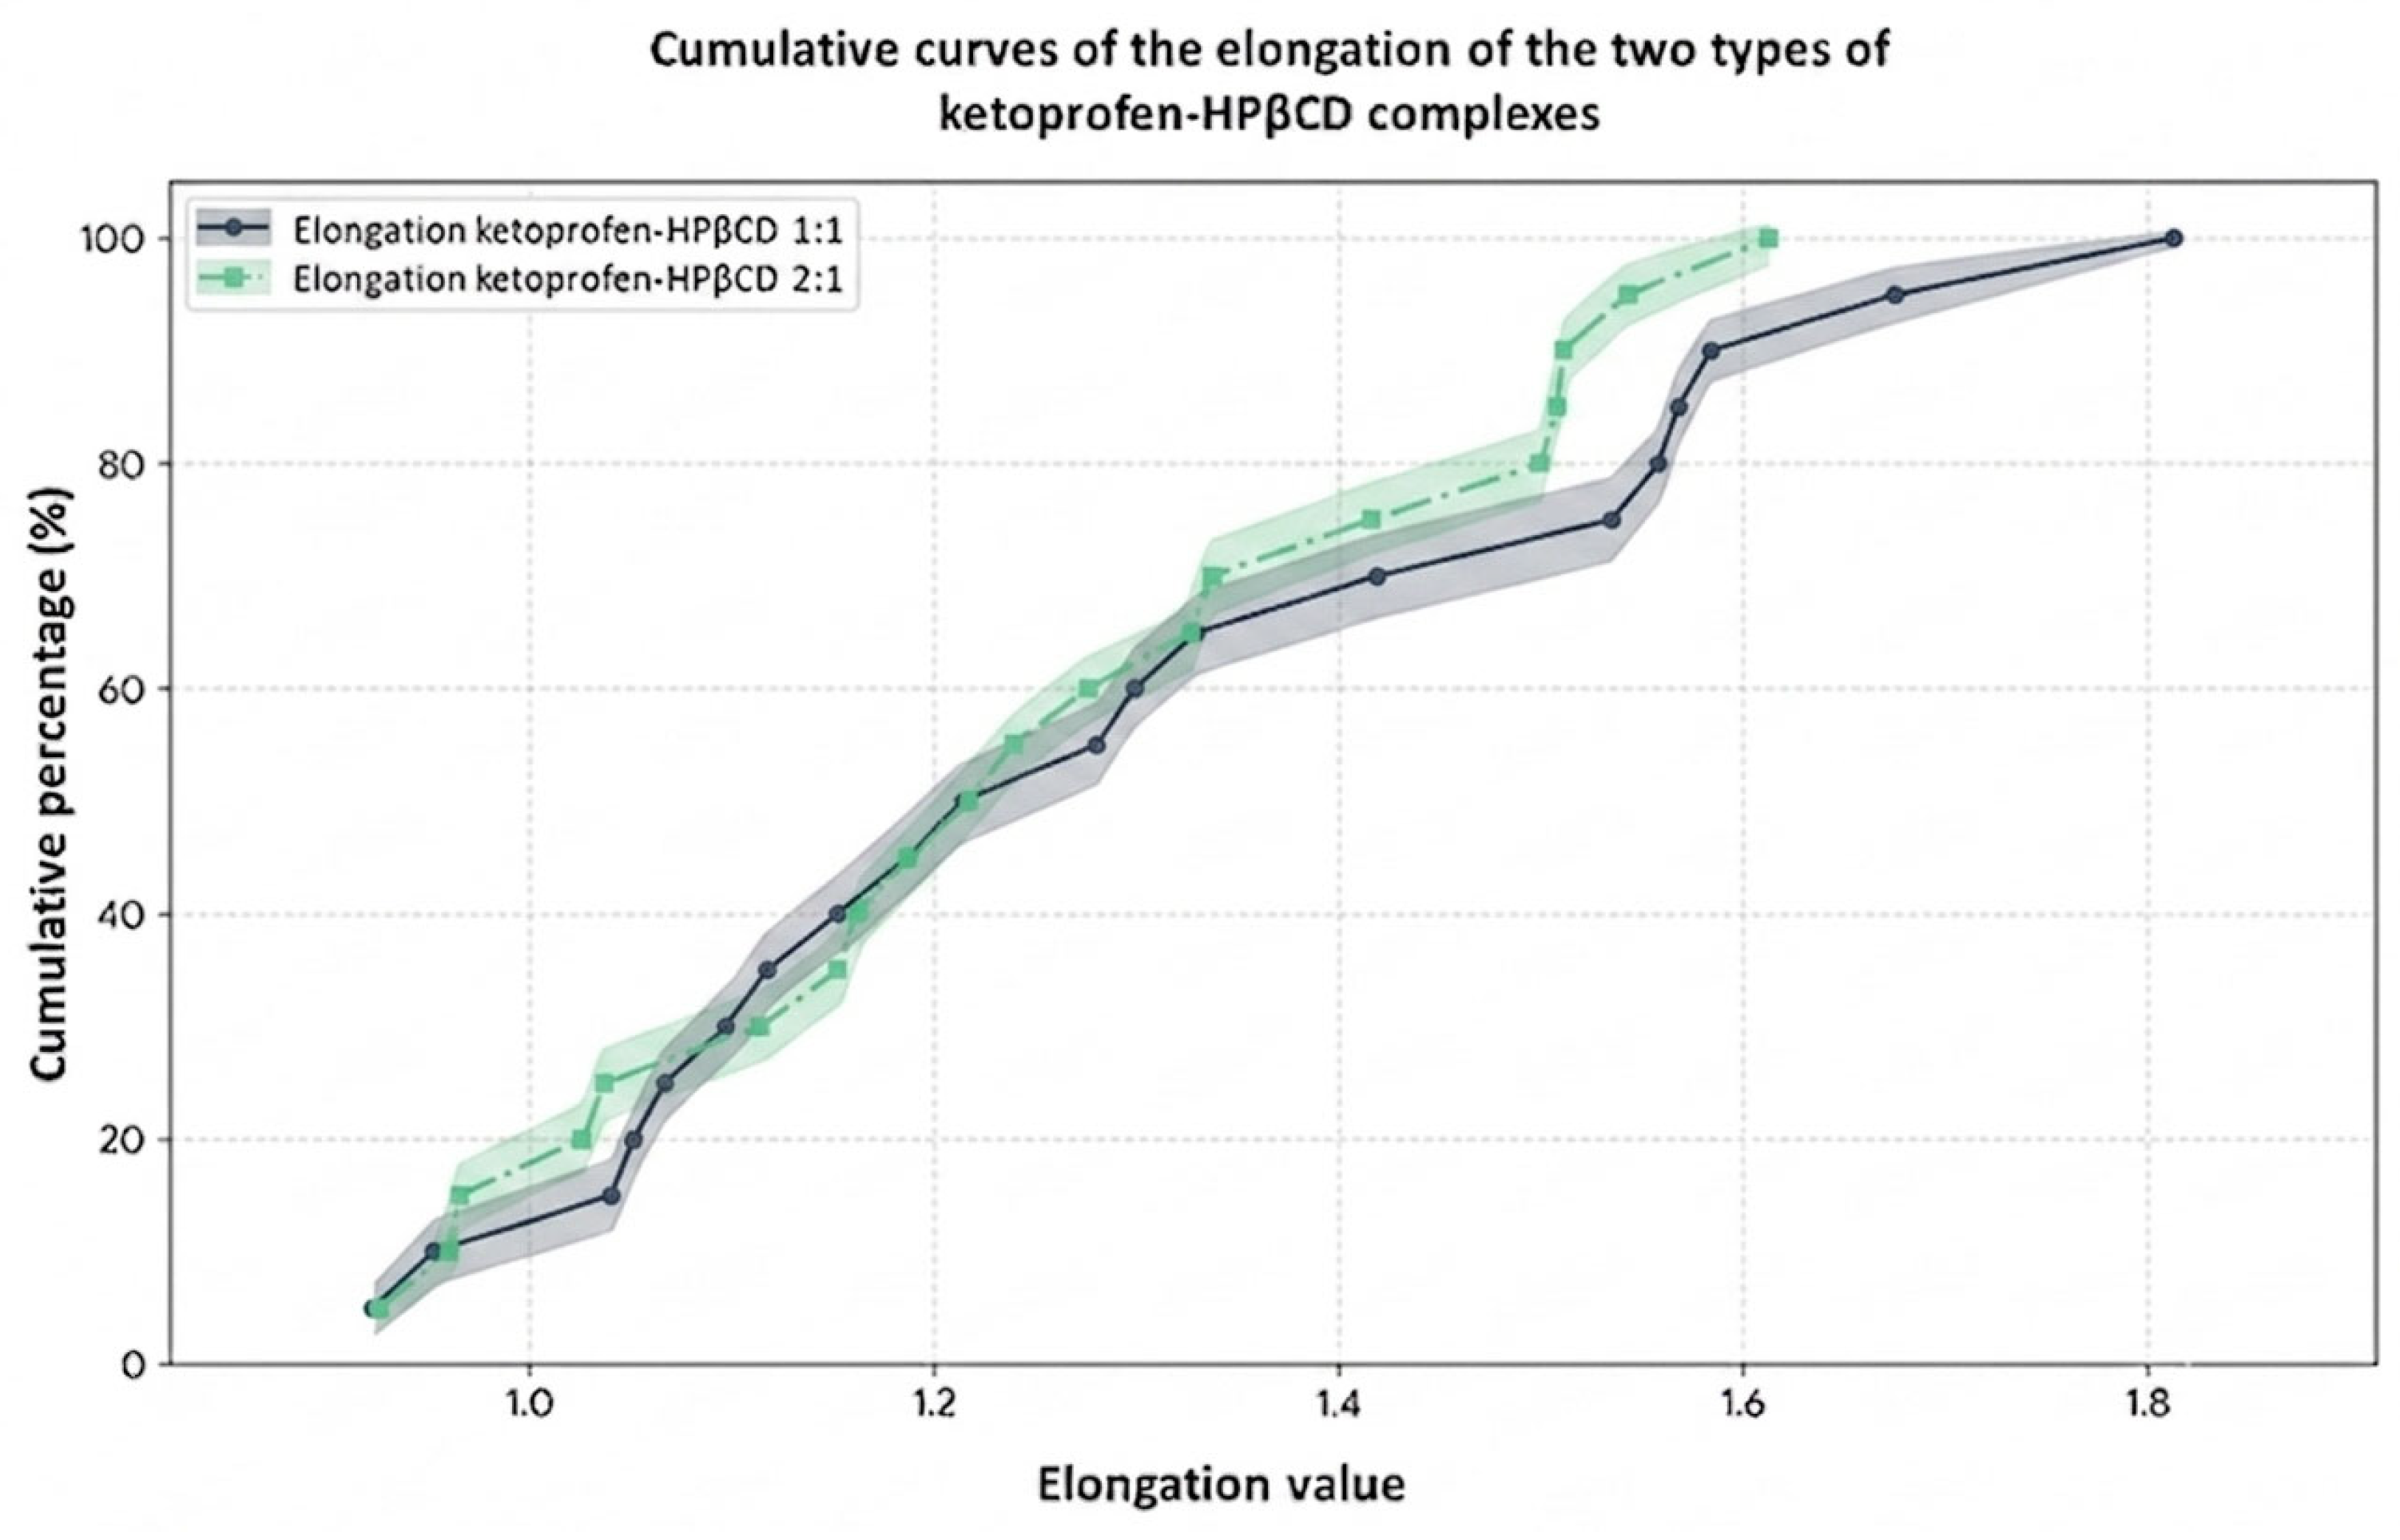
In Figure 17 of the cumulative curve, it can be seen that the green line (particle set 2) rises much more smoothly and steadily, like a diagonal. This clearly demonstrates a gradual and continuous transition from compact to elongated shapes within the synthesis or measurement of ketoprofen–HPβCD 1:1, in contrast to the ketoprofen–HPβCD 2:1, which shows small, steep thresholds caused by the more fragmented mixture of round vs. elongated particles. The figure shows a parallel evolution and geometric equivalence of the curves that faithfully follow each other throughout the entire length of the percentage accumulation process. Interpenetration of the safety intervals occurs at almost every cumulative percentage level. The actual mathematical distance between the curves at any point is lower or at most equal to the calculated instrumental error threshold (±0.030). This certifies from a statistical point of view that there is no significant difference in the degree of elongation between the two batches. The particles have similar macro-geometric profiles in terms of axial aspect ratio, eliminating elongation from the list of disturbing factors that could distort the comparative rheological behavior.
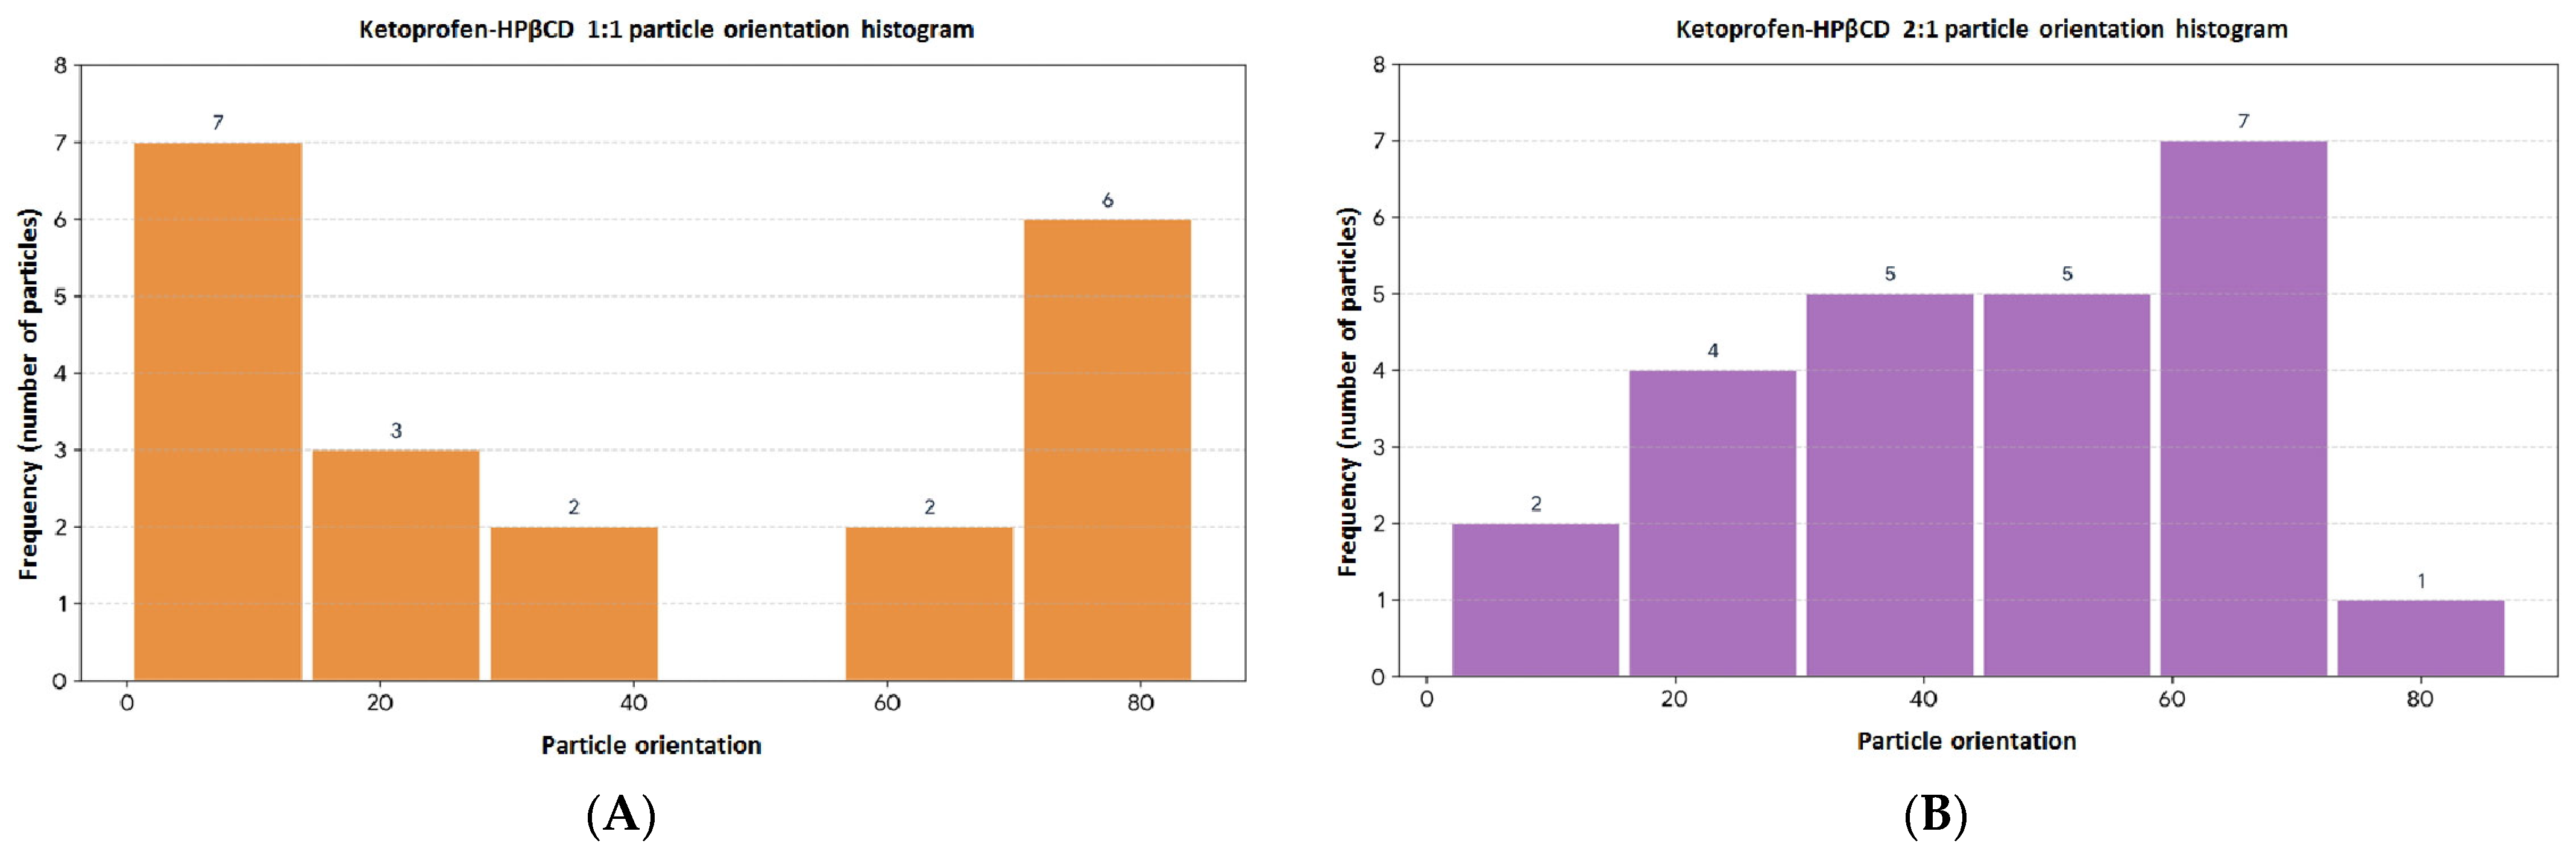
In Figure 18, the histogram (A) of the orientation of ketoprofen–HPβCD particles in a molar ratio of 1:1 highlights a very interesting feature, a bimodal/polarized behavior at the extremes. A large group of less oriented particles (in the range 0.17–14.22) and another large group of well oriented particles (in the range 70.37–84.43) are observed. The middle area is considerably emptier. Due to this structure with two peaks at the extremes, the mean is 39.6771, but the median drops to 28.4390. The standard deviation is approximately 32.3100 and this large value confirms the dispersion of the data towards the edges of the range (particles oriented completely differently from each other). The skewness coefficient of approximately 0.2807 indicates a very weak positive skewness.
In Figure 18, histogram (B), we can observe an almost symmetrical distribution in which the orientation factor of the ketoprofen–HPβCD 2:1 particles from this sample follows a very stable and balanced dynamics. The mean value is 45.6467 and the median is 46.6685. The fact that these two fundamental quantities are almost identical mathematically confirms a clean geometric balance within the sample. The skewness factor is approximately—0.2687, a negative value that confirms that the histogram has a slight shift (to the left). Regarding the clustering of the data, the most populated intervals are those from the medium to the high values (area 30–44 and 58–72). This shows that the large mass of particles tends to have a stable angle/orientation factor around the medium-high values. The standard deviation of approximately 21.8671 measures the degree of dispersion of the orientation of the particle axes in the analysis space, indicating a normal and uniformly distributed variability (without anomalies or sudden clusters in a single point).
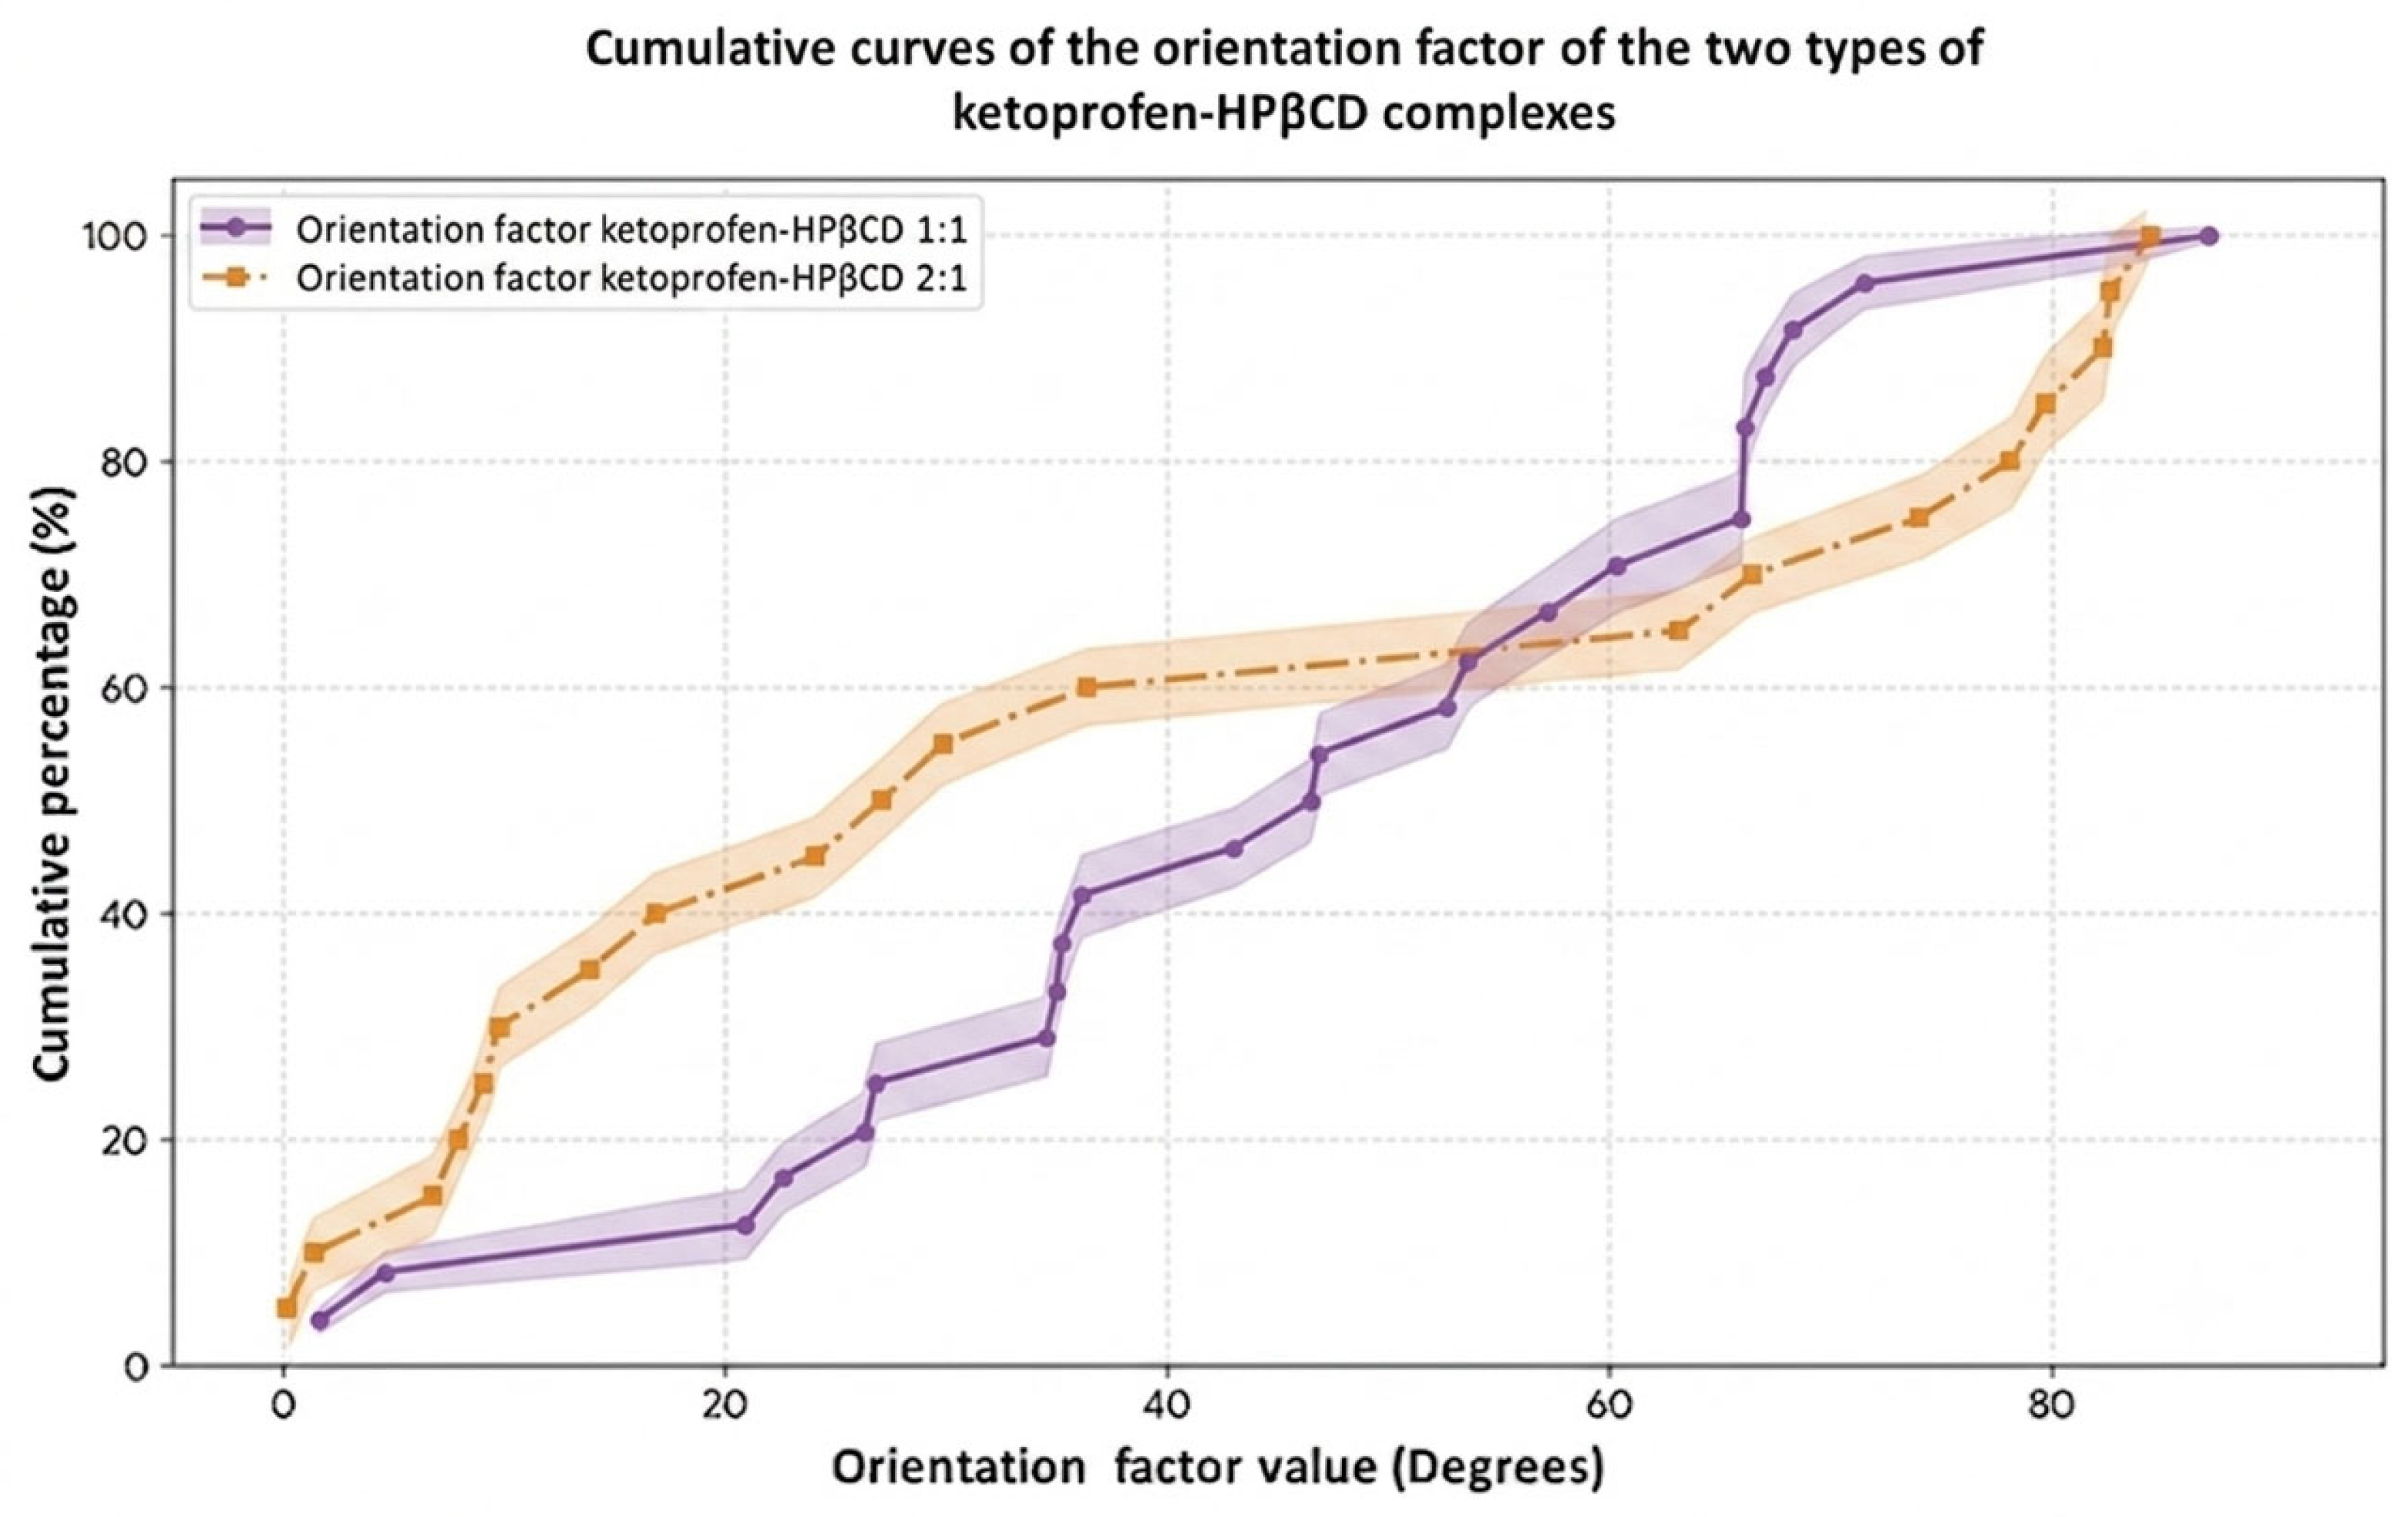
Figure 19 shows a clear separation of the behaviors of the two curves. Statistically, the distance between the two curves in the median area is greater than the instrumental measurement error (2.5). This validates with certainty that the two sets of particles have fundamentally and truly different orientation behaviors. The purple curve has a constant, linear accumulation, indicating a uniform spread of the angles in which the particles are oriented.
The orange curve shows that deformed “S” shape (plateau in the middle), demonstrating a real polarization of the particles towards the extremes (weakly oriented or strongly oriented).
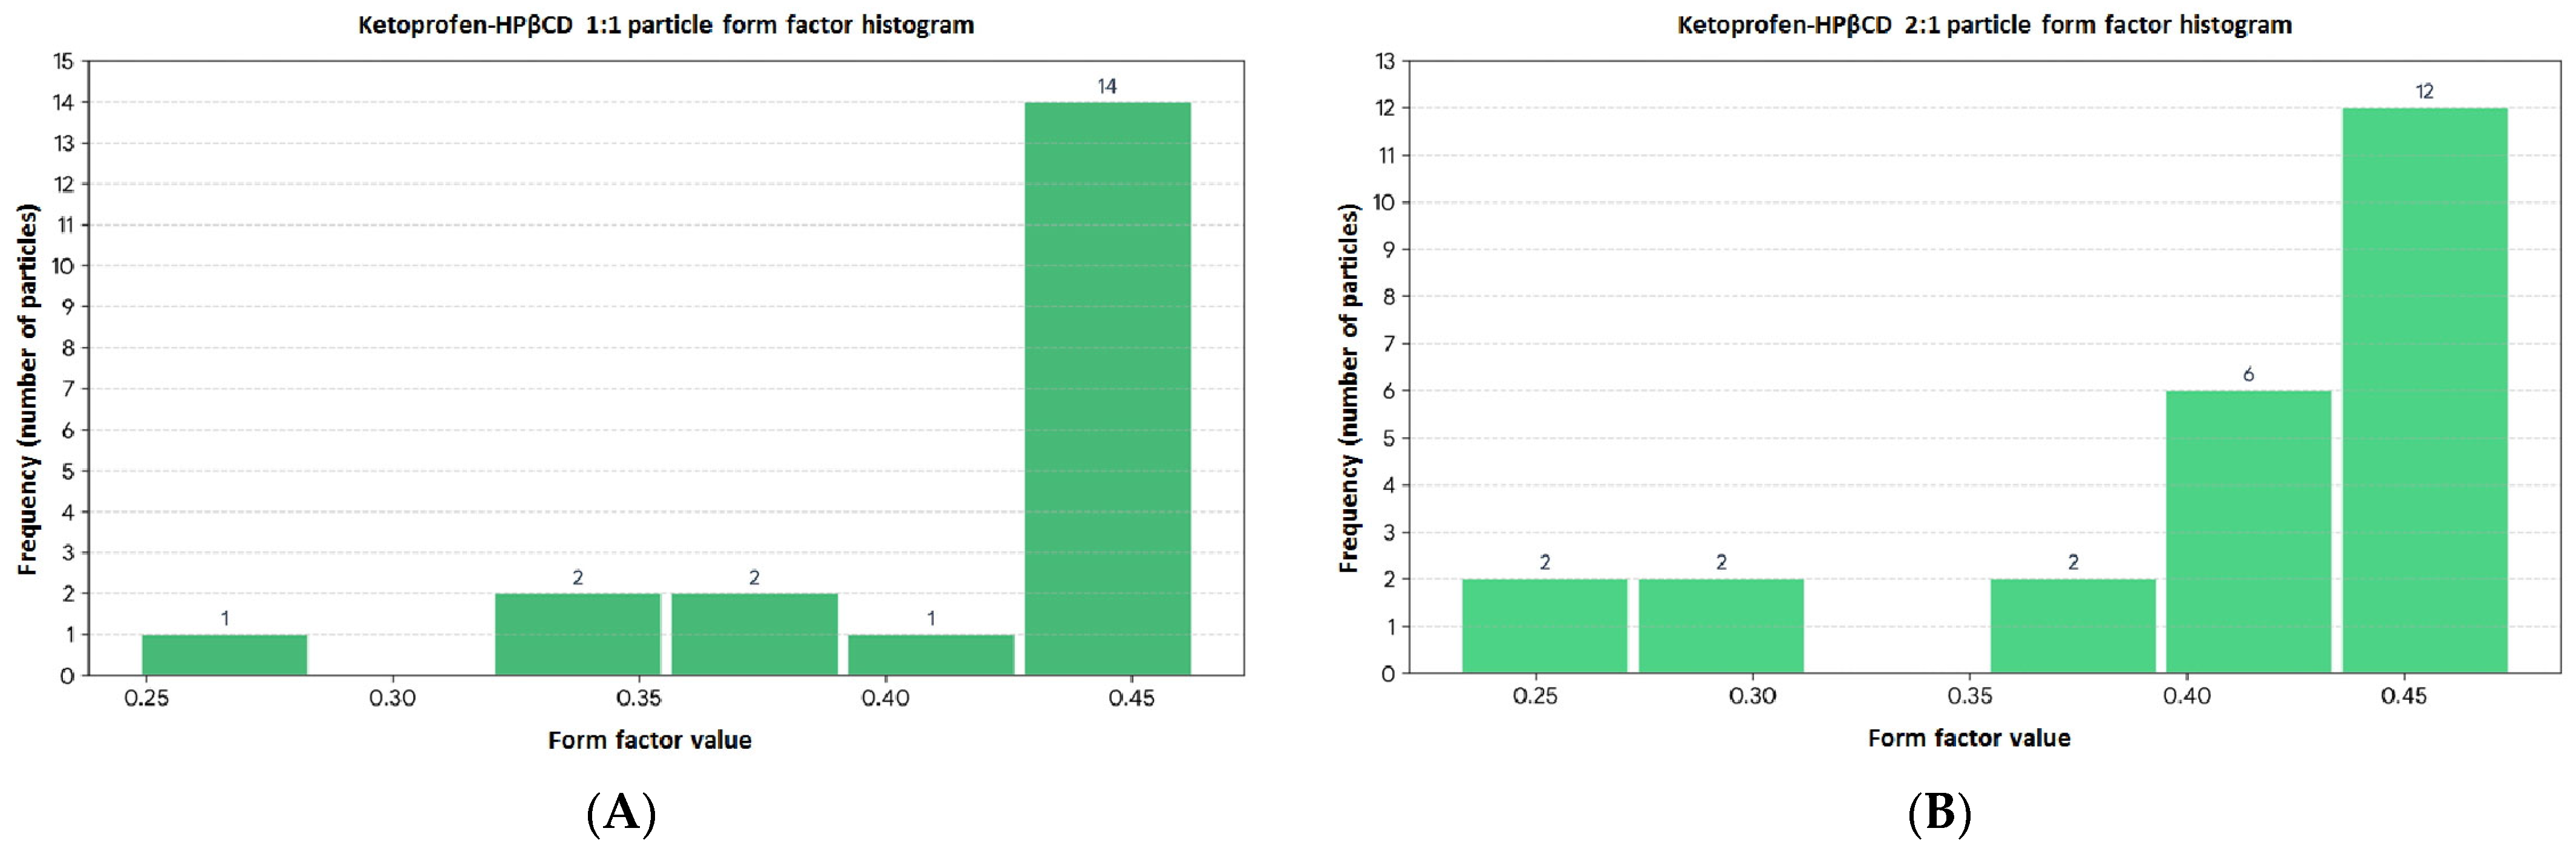
In Figure 20A, we can see a pronounced negative asymmetry translated by a massive concentration of the data towards large values. The histogram reveals a strong asymmetry to the left. Most of the particle shape factor values are crowded into the last econometric interval, between 0.427 and 0.463. An asymmetry coefficient with a value of −1.9968 indicates an extremely severe negative asymmetry in the extreme left (0.248), which traces a long “tail” in the graph. As a direct result of the tail on the left, the mean value is pulled down to 0.4205, while the median remains much higher, at 0.4430. This shift faithfully reflects the pronounced asymmetry in the system. The standard deviation of 0.0550 is small, suggesting that, at a basic level, the particle population has a fairly constant and homogeneous geometry. In a physical sense, the shape factor (often calculated as the ratio of the projection area to the perimeter) measures the complexity of the irregularities on the particle’s contour. The fact that 80% of the ketoprofen–HPβCD 1:1 particles are above the threshold of 0.45 indicates that their shapes are structurally stable, compact and with relatively smooth or regular edges, not affected by dendritic asperities or severe textural ramifications.
In Figure 20B, a strong clustering is noticeable in the upper area. As in the previous case, the overwhelming majority of the particles in this batch are concentrated towards high values. The most populated interval is the last one (0.435–0.475), which gathers exactly half of the entire sample of particles. The asymmetry with a value of −1.5145 indicates a pronounced negative asymmetry (to the left). This long tail on the left side of the graph is directly caused by the small group of particles with low values (such as the two identical particles at 0.232 and the one at 0.275), which deviate from the general behavior of the batch. Due to the asymmetric tail that pulls the model to the left, the calculated mean value is 0.4088, while the median (the value in the geometric center of the ordered series) remains significantly higher, at 0.4395. The standard deviation is approximately 0.0743, which demonstrates that the spread is slightly higher than in the first set where the standard deviation was 0.055, indicating that the ketoprofen–HPβCD 2:1 particles exhibit a marginally more pronounced textural variety on the particle contour.
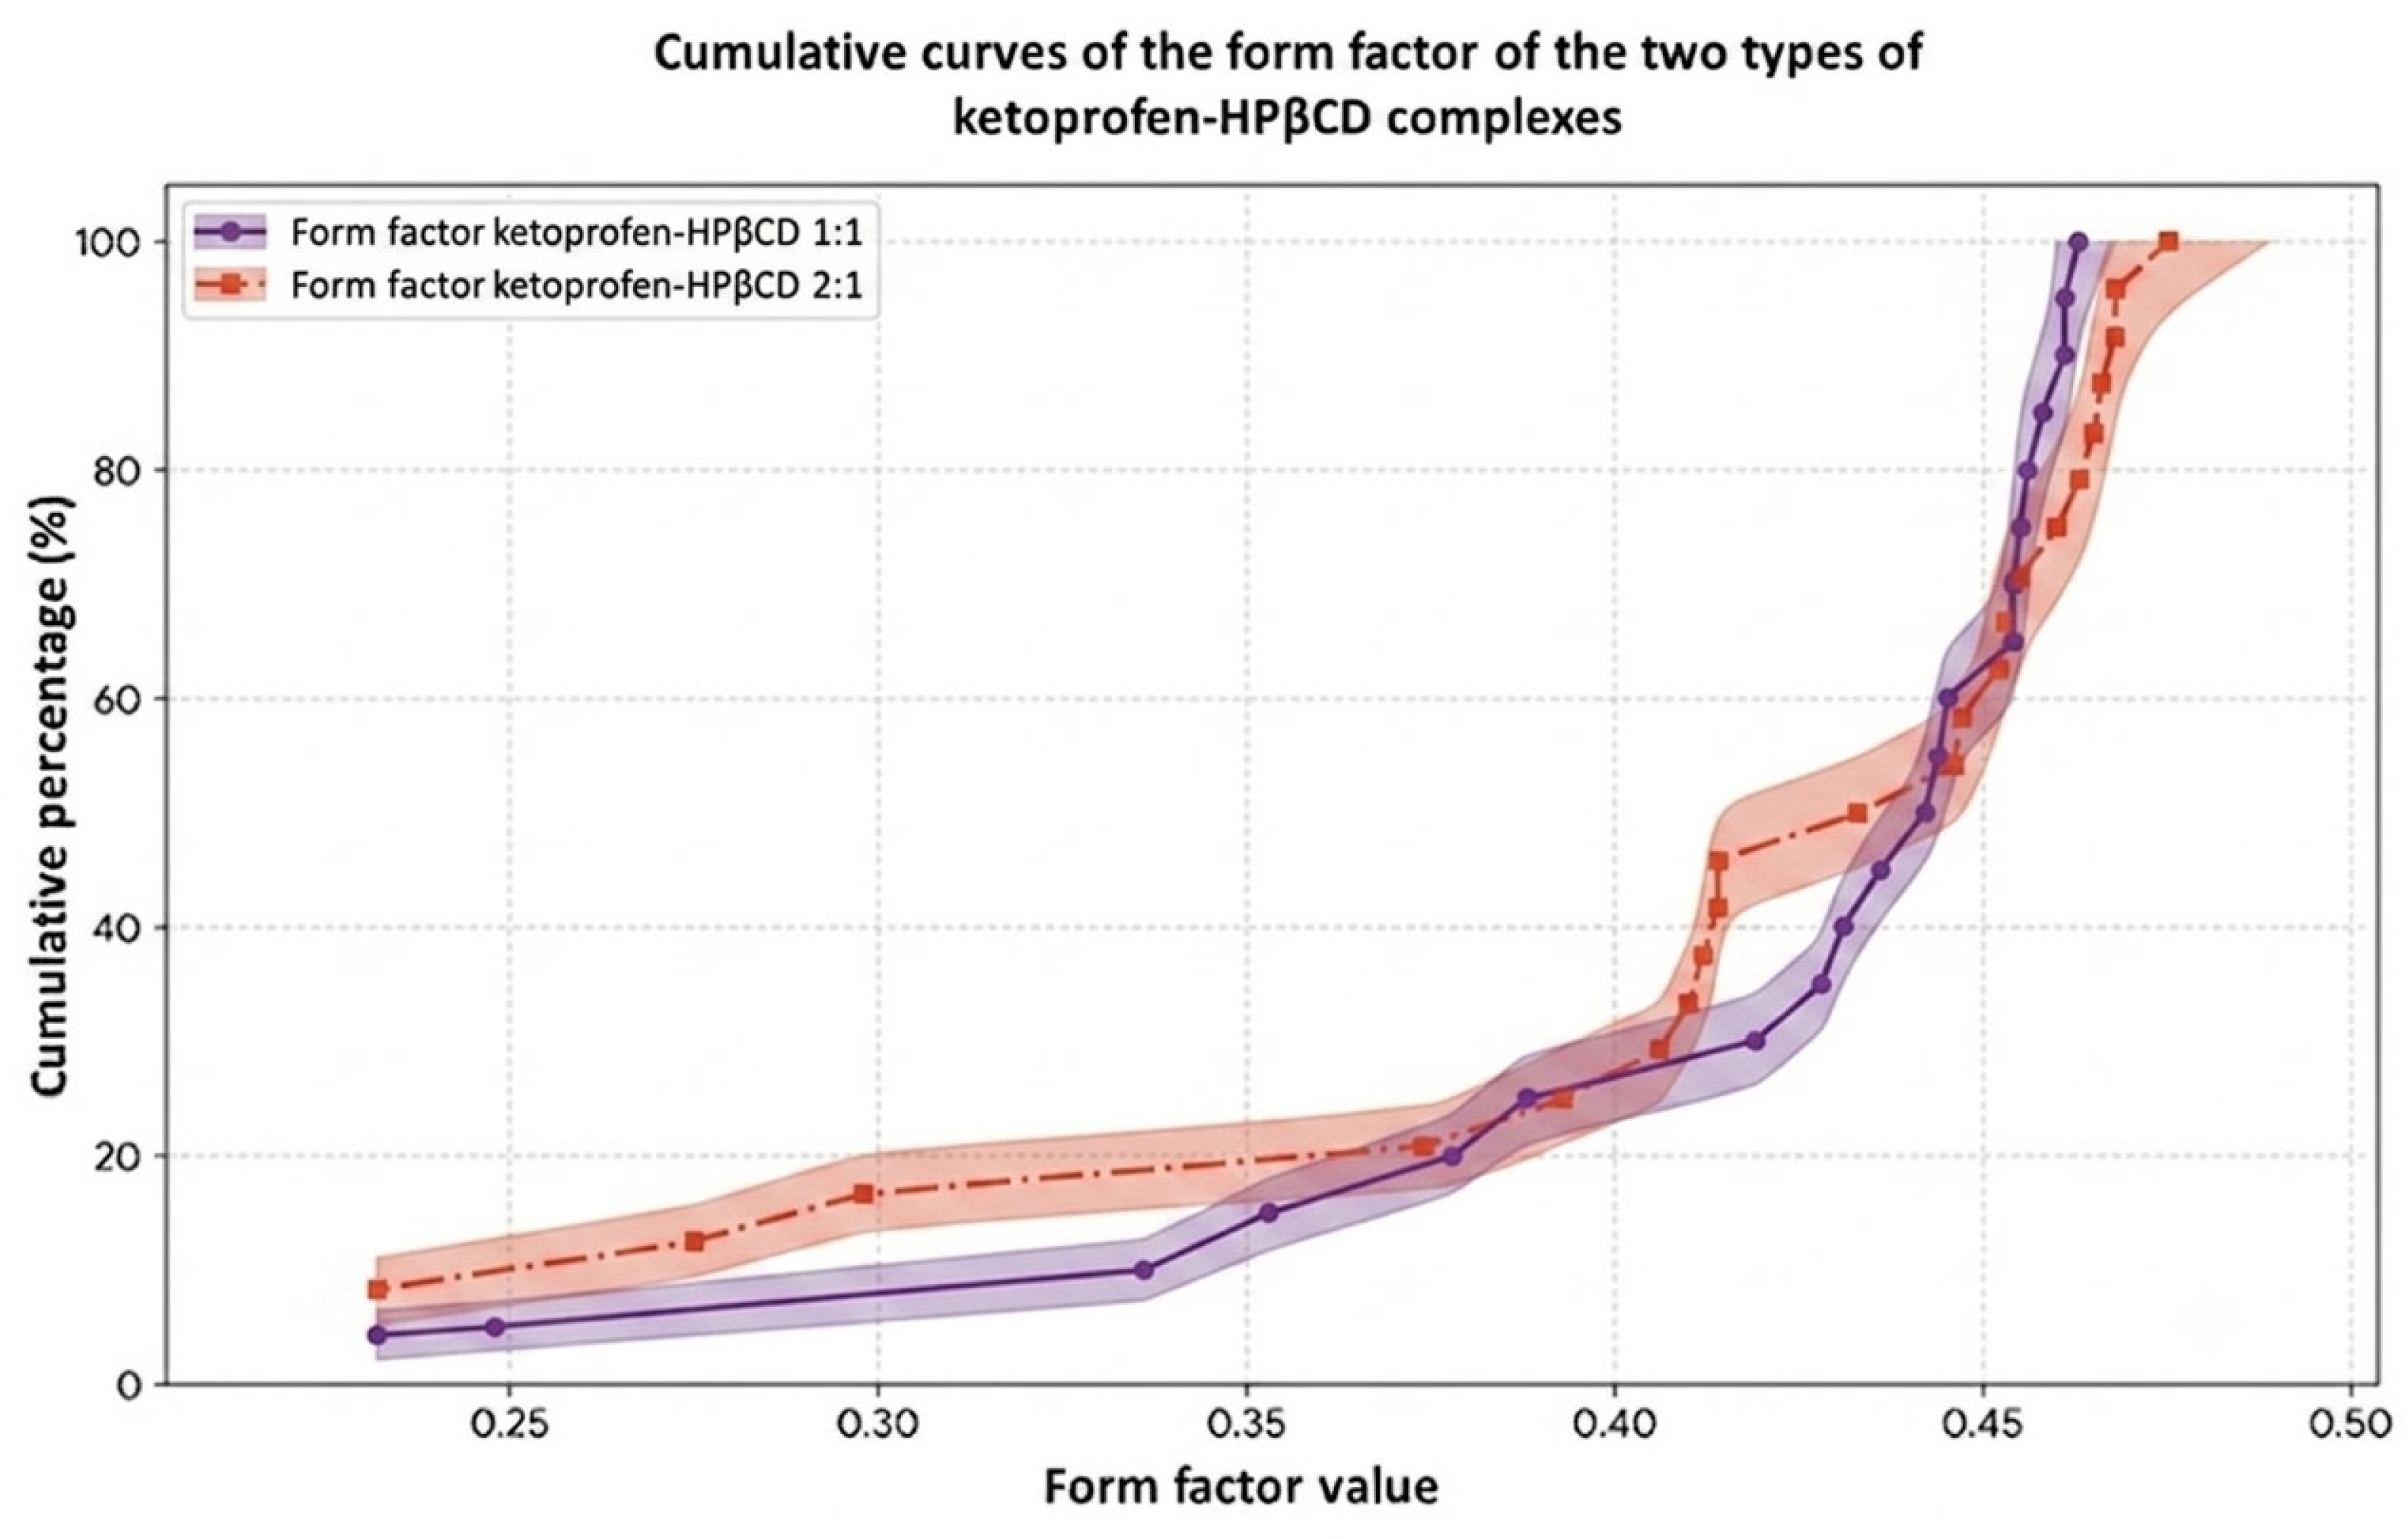
If we look at the cumulative graph in Figure 21, the purple line (ketoprofen–HPβCD 1:1) and the orange line (ketoprofen–HPβCD 2:1) follow almost identical trajectories. Both curves show an extremely steep slope after the 0.40 threshold, rapidly accumulating the last percentages. This visual overlap confirms an excellent physical reproducibility of the experiments: both batches of powders are dominated by a population of compact particles, with minimal roughness on the contour and a stable geometric regularity. The overlap of the safety ranges occurs over almost the entire steep slope of the graph (area 0.40–0.47). From an experimental point of view, this massive overlap of the tolerance ranges demonstrates that the shape differences between the two particle batches are not statistically significant in the area of maximum population density. The two production/synthesis processes deliver particles with equivalent outline geometry within the limits of the accepted error.
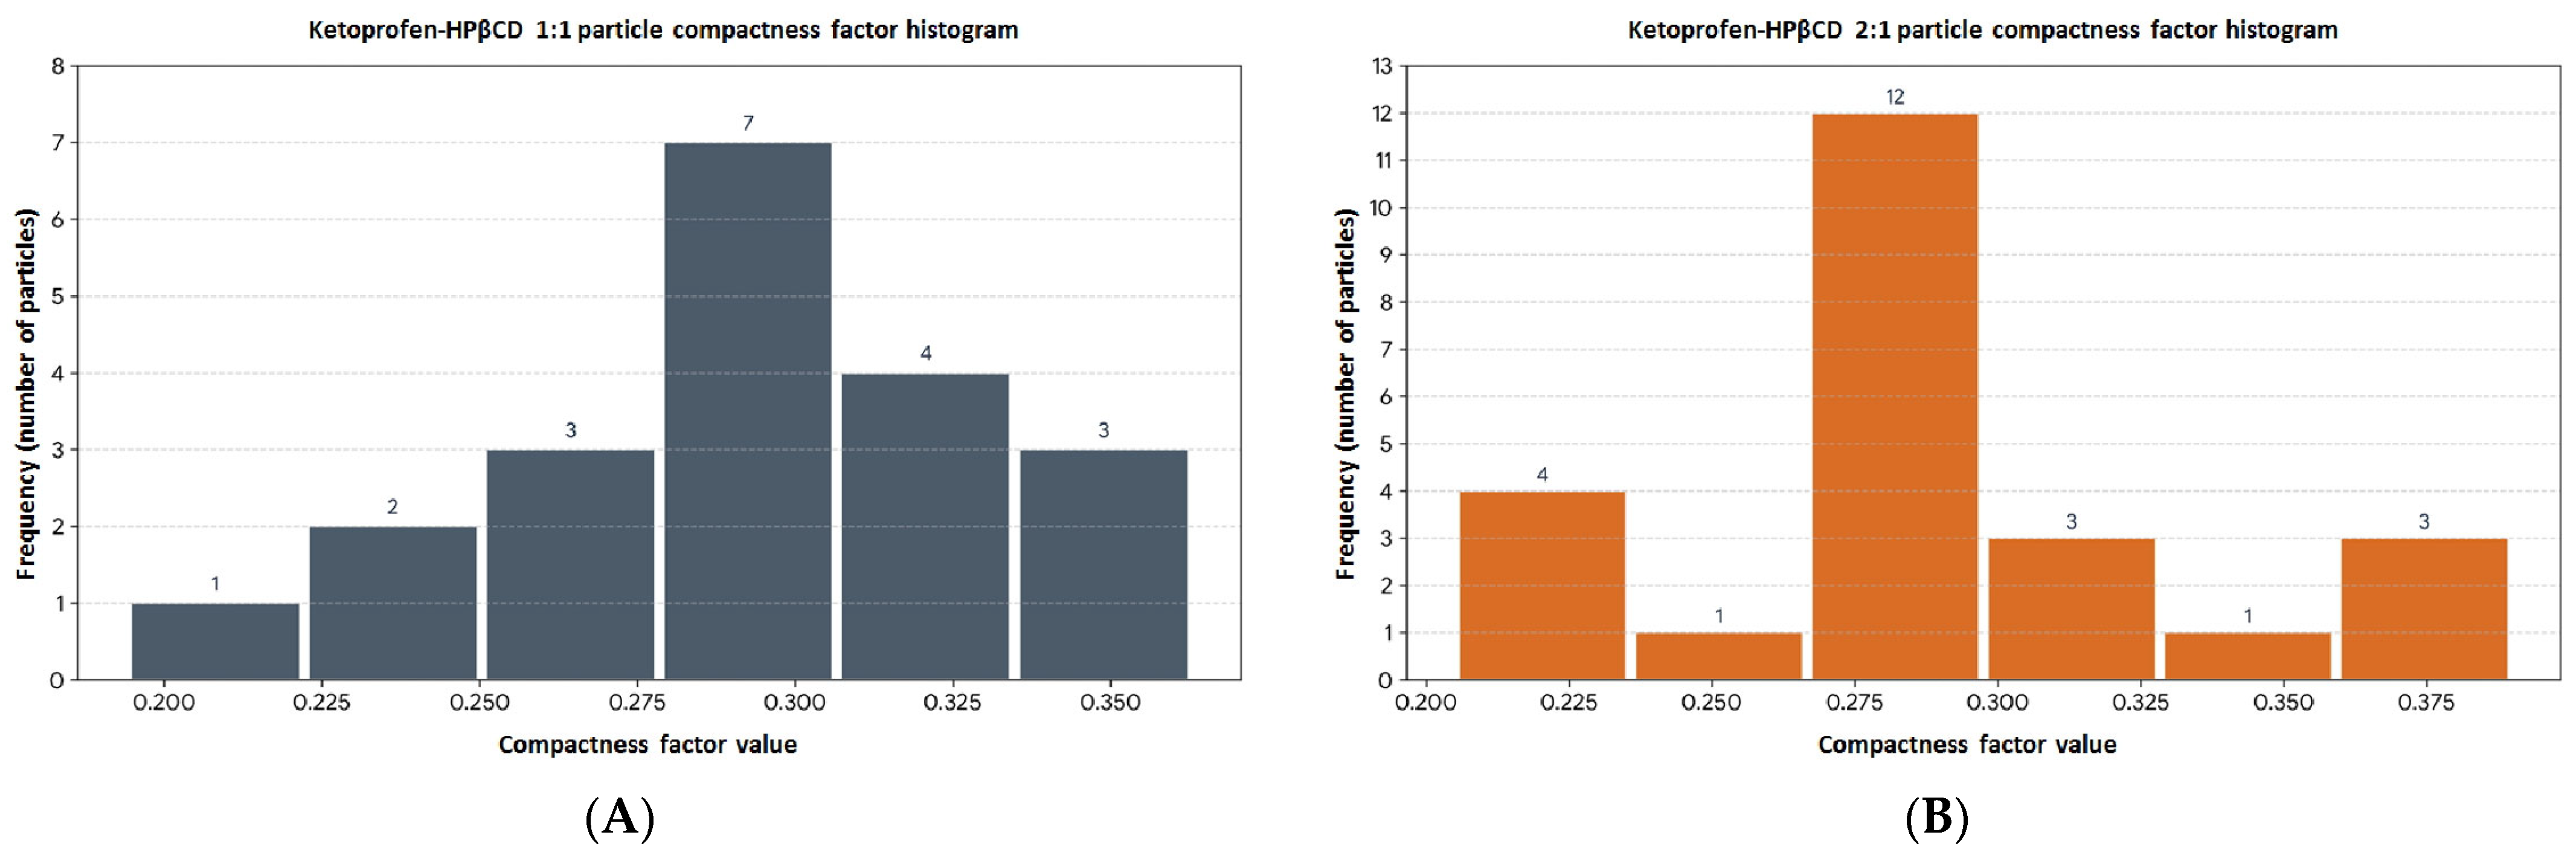
In Figure 22A, the histogram of the particle compactness factor of ketoprofen–HPβCD with a 1:1 molar ratio shows a well-defined, almost normal bell-shaped distribution. From a rheological and physical point of view, this sample looks excellent. The histogram describes a classical centralized shape, where the vast majority of the data are in the perfect central range: 0.278–0.307. The mean value is 0.2932, while the median is 0.2960. The extremely close proximity of these two indicators tells us that the particle sample has a very stable behavior and a clear central tendency around the value of 0.29. The negative value of −0.5327 indicates a moderate asymmetry to the left mainly due to the isolated particle with a minimum value of the packing factor of 0.194, which creates a small “tail” on the left side of the graph.
The standard deviation indicator has a very low value, approximately 0.0397, mathematically confirming that the particles in this batch have extremely tight, constant and homogeneous compaction properties (without chaotic dispersions).
In Figure 22B, a remarkable symmetry can be observed, an almost ideal Gaussian distribution. This second set of particles of ketoprofen–HPβCD with a 2:1 molar ratio presents an excellent statistical profile from an experimental point of view. The central peak is extremely pronounced: exactly half of the particle sample is concentrated in the narrow range of 0.267–0.298. The value of −0.0105 of the asymmetry is the piece de resistance of the sample. A coefficient of −0.01 indicates a perfectly symmetrical distribution. The left and right flanks of the histogram balance mathematically almost to perfection. In full agreement with perfect symmetry, the mean is 0.2902, and the median is 0.2935. Both experimental batches of particles demonstrated an incredible physical constancy, fixing their central tendency around the same value of approximately 0.29. The standard deviation of approximately 0.0493 remains very small, indicating a high degree of structural uniformity at the level of the second powder sample, although the dispersion is imperceptibly higher than in the first set due to the three particles with less compaction (area 0.205). In the study of the rheological behavior of powders, the compaction factor (volume or apparent/tamp density ratio) involves small experimental variations induced by the gravitational settling mode or by the residual errors of the displacement sensors.
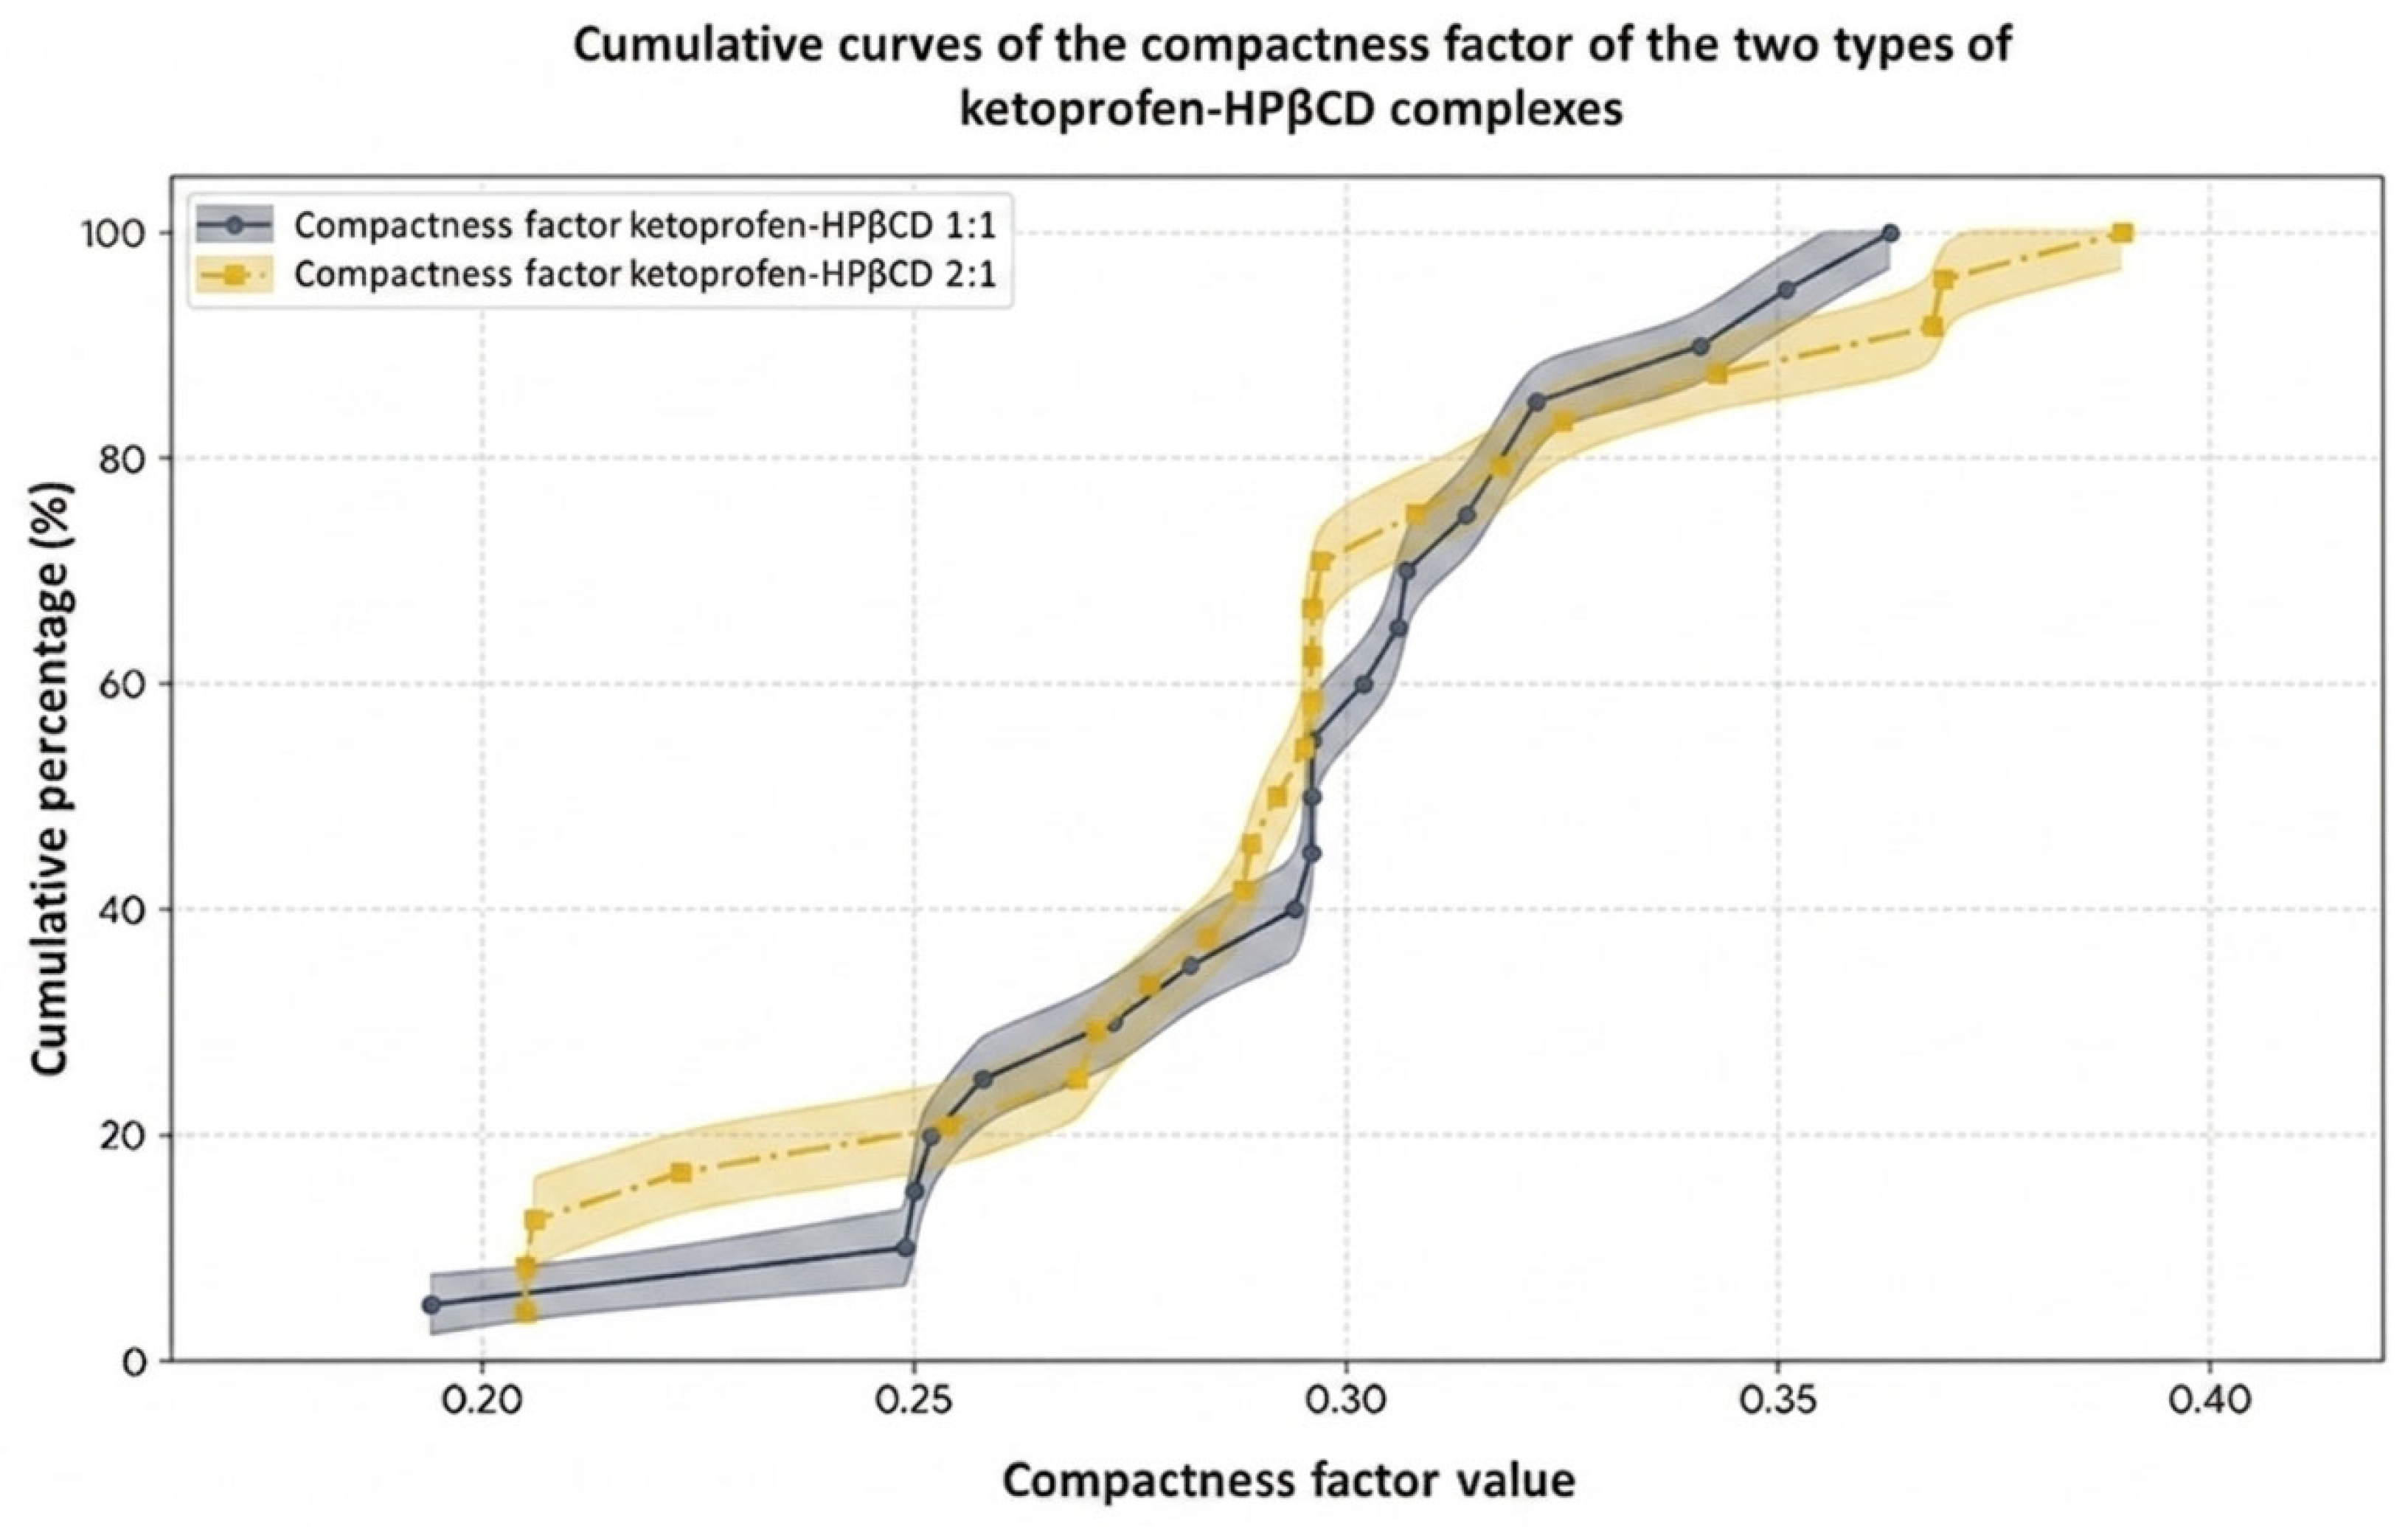
In Figure 23 the cumulative compaction diagram (CDF) with error bars is the most eloquent argument that both batches of powders behave identically during compaction. The dark blue curve and the yellow curve intertwine almost perfectly over the entire central deviation (0.24–0.35). A complete interpenetration of the errors was observed at each percentage level. Any visual micro-deviation between the two paths is much smaller than the experimental measurement error (0.012). Although the ketoprofen–HPβCD 2:1 particles had a different angular (orientation) distribution than the ketoprofen–HPβCD 1:1 particles, the variation in orientation was not critical enough to alter the final macroscopic property. Statistically, the overall rearrangement and compaction capacity of both powder samples is strictly equivalent within laboratory tolerances.
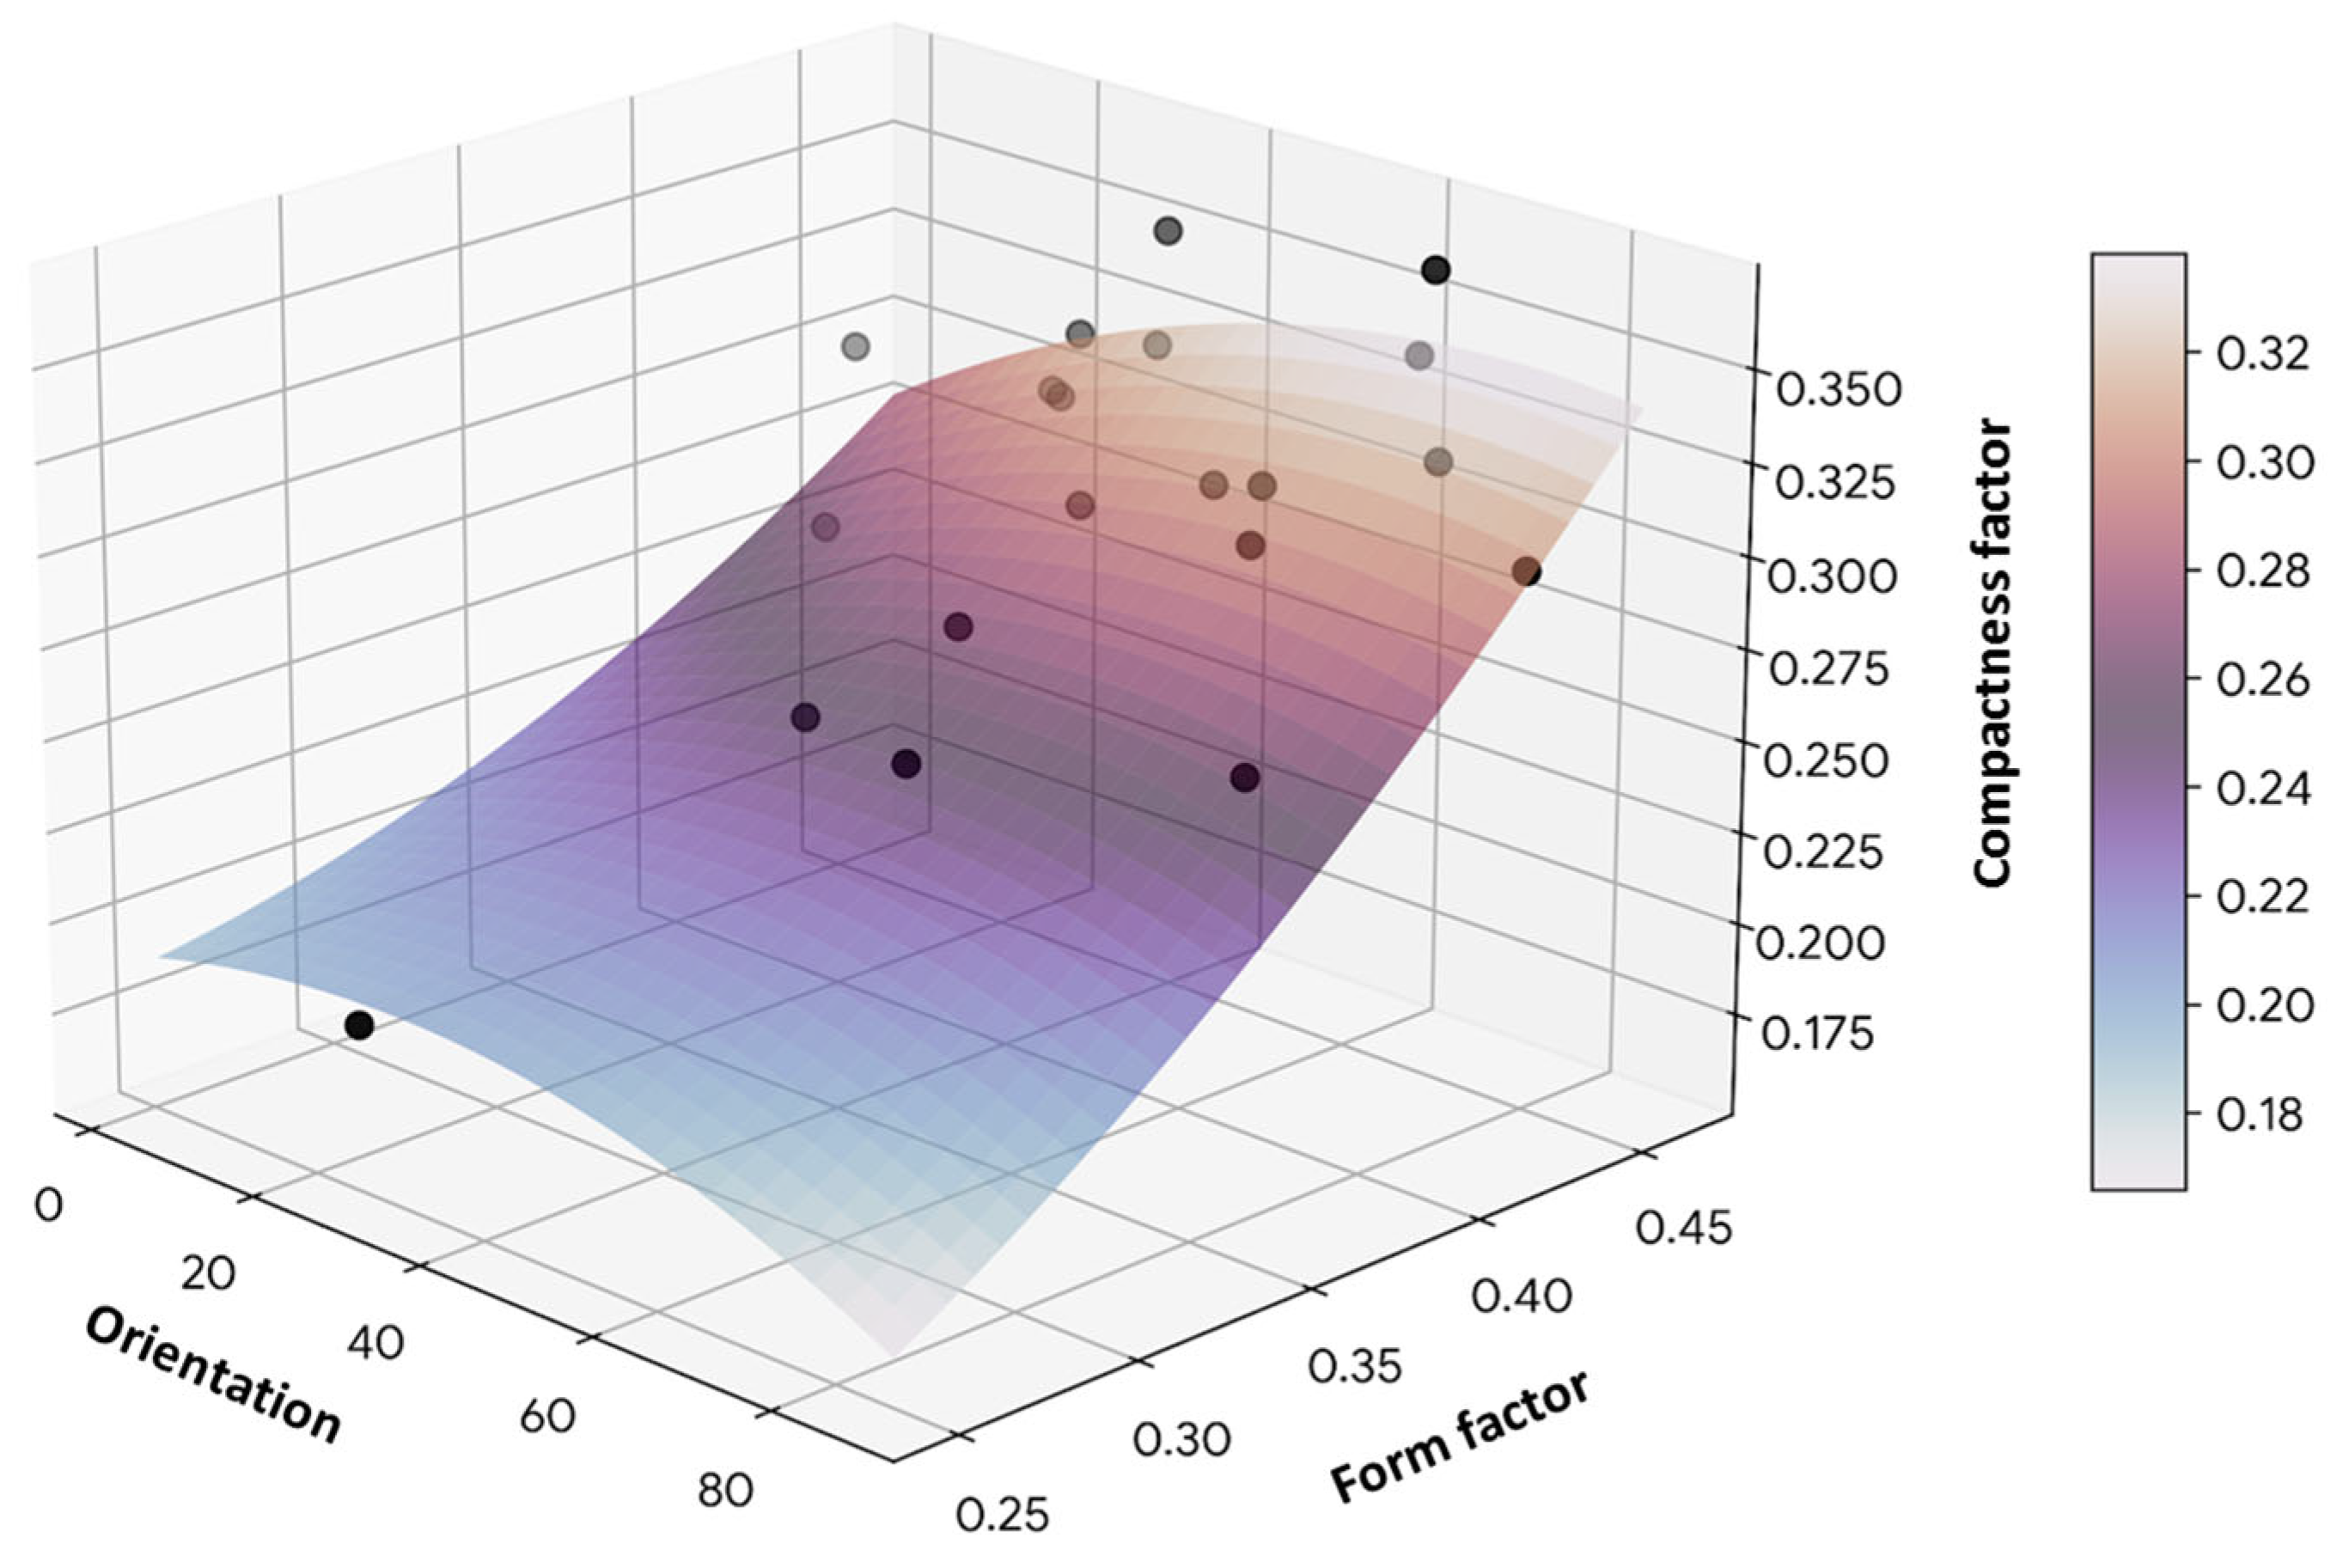
In Figure 24 the response surface shows a relatively stable curved saddle pattern. It is noted that the optimal (highest) values of the compaction factor are located in the area where the form factor is high (>0.44). The orientation of the particles (black dots) has a moderate influence; the maximum compaction is obtained at intermediate values of orientation, suggesting that a partially ordered structural arrangement tends to favor a denser settling of the powder in this first set of particles.
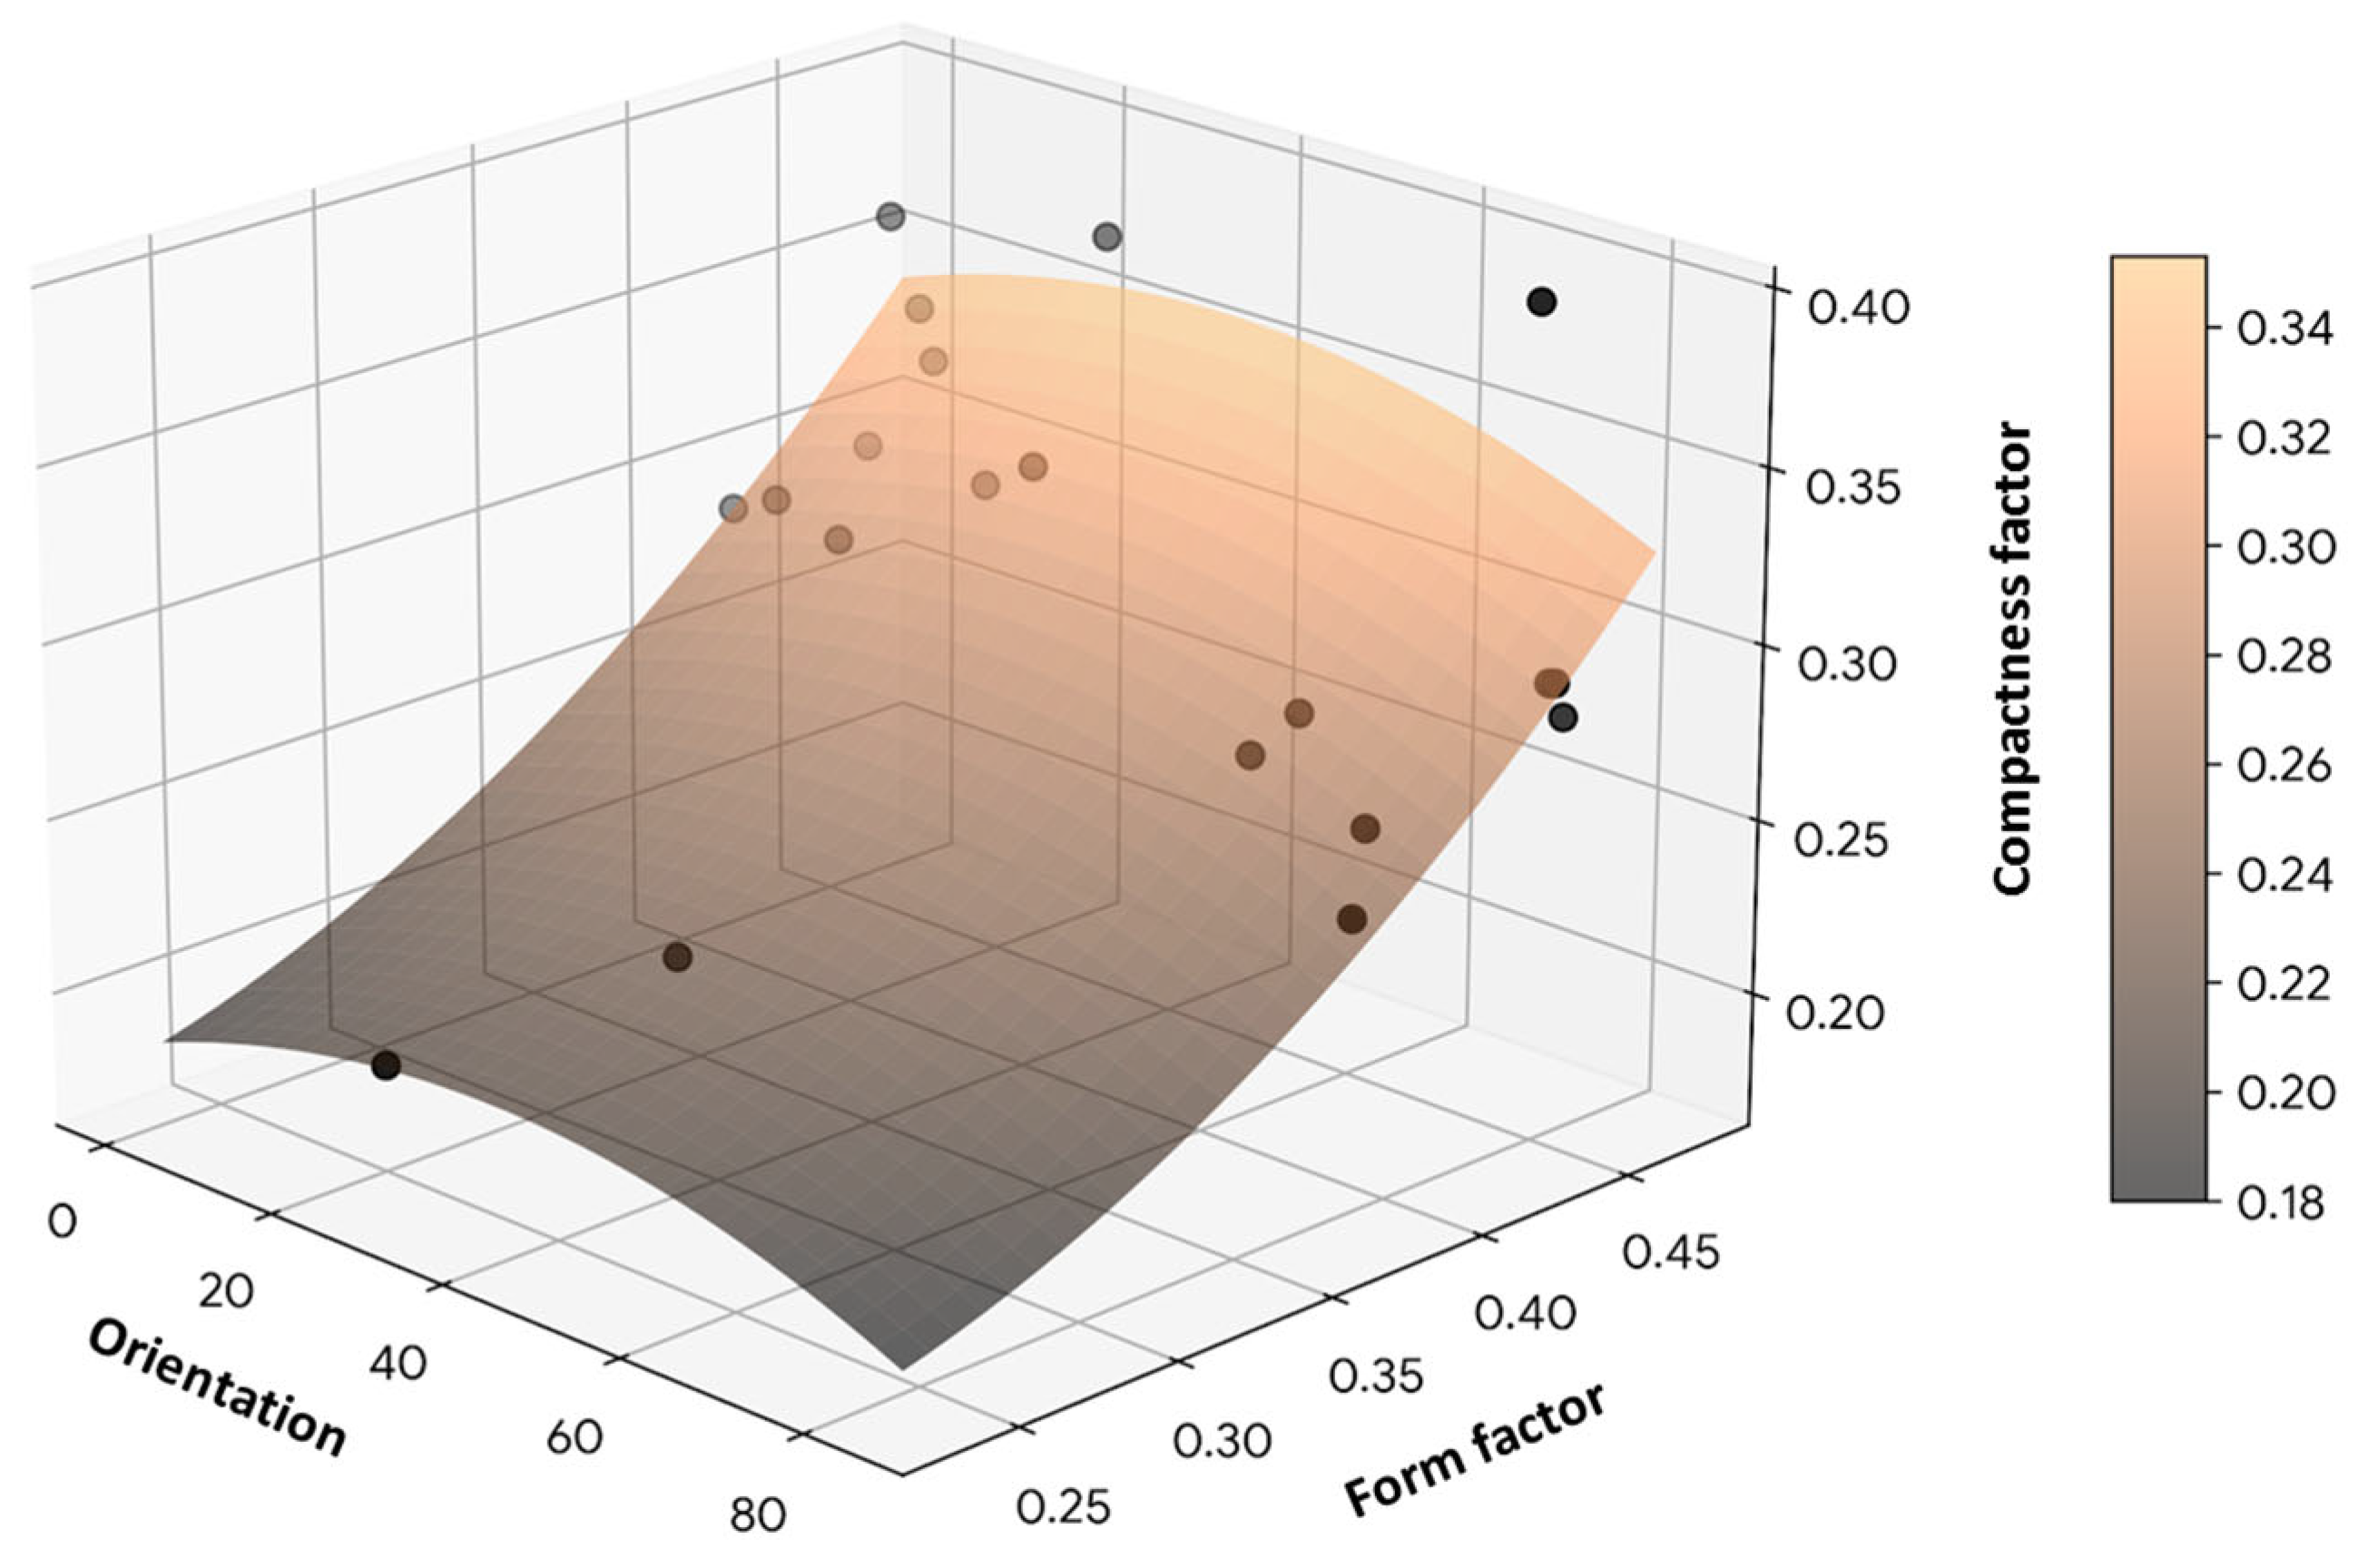
In Figure 25 for the second set of particles (black dots), the profile changes drastically, revealing a steep slope in the form of a descending trough. The sudden decrease in the compaction factor (dark area on the lower left) coincides exactly with particles that have a very low shape factor (about 0.23). This result provides a clear physical conclusion: when the shape factor decreases (particles have very irregular, rough or complex contours), the ability of the powder to compact effectively is drastically reduced, regardless of how the particles are oriented in the analysis space [29,30].

3.6. Pharmacotechnical Properties of the Powders

The bulk and tapped densities, together with the derived Carr index and Hausner ratio [30,31], are presented in Table 4. The Carr index of the complexes (22.6% for the 1:1 and 24.8% for the 2:1 complex) and the corresponding Hausner ratios (1.28 and 1.33) are slightly higher than those of pure ketoprofen (19.3% and 1.24), indicating a passable flow only slightly poorer than pure ketoprofen; this modest reduction is attributable to the cohesion of the fine fraction (≈60% of particles below 50 µm), which tends to form aggregates.
The favorable, preferentially oriented particle geometry nevertheless supports acceptable behavior during direct compression. Taken together, the amorphous character and the favorable particle geometry are expected to translate into an improved dissolution behavior and, ultimately, an enhanced bioavailability of ketoprofen [30,31,32,33,34].

3.7. The Dissolution Study of the Ketoprofen–HPβCD Complexes

The dissolution results are summarized in Table 5. The determinations were performed in triplicate and the values represented in the table are expressed with the standard deviation.
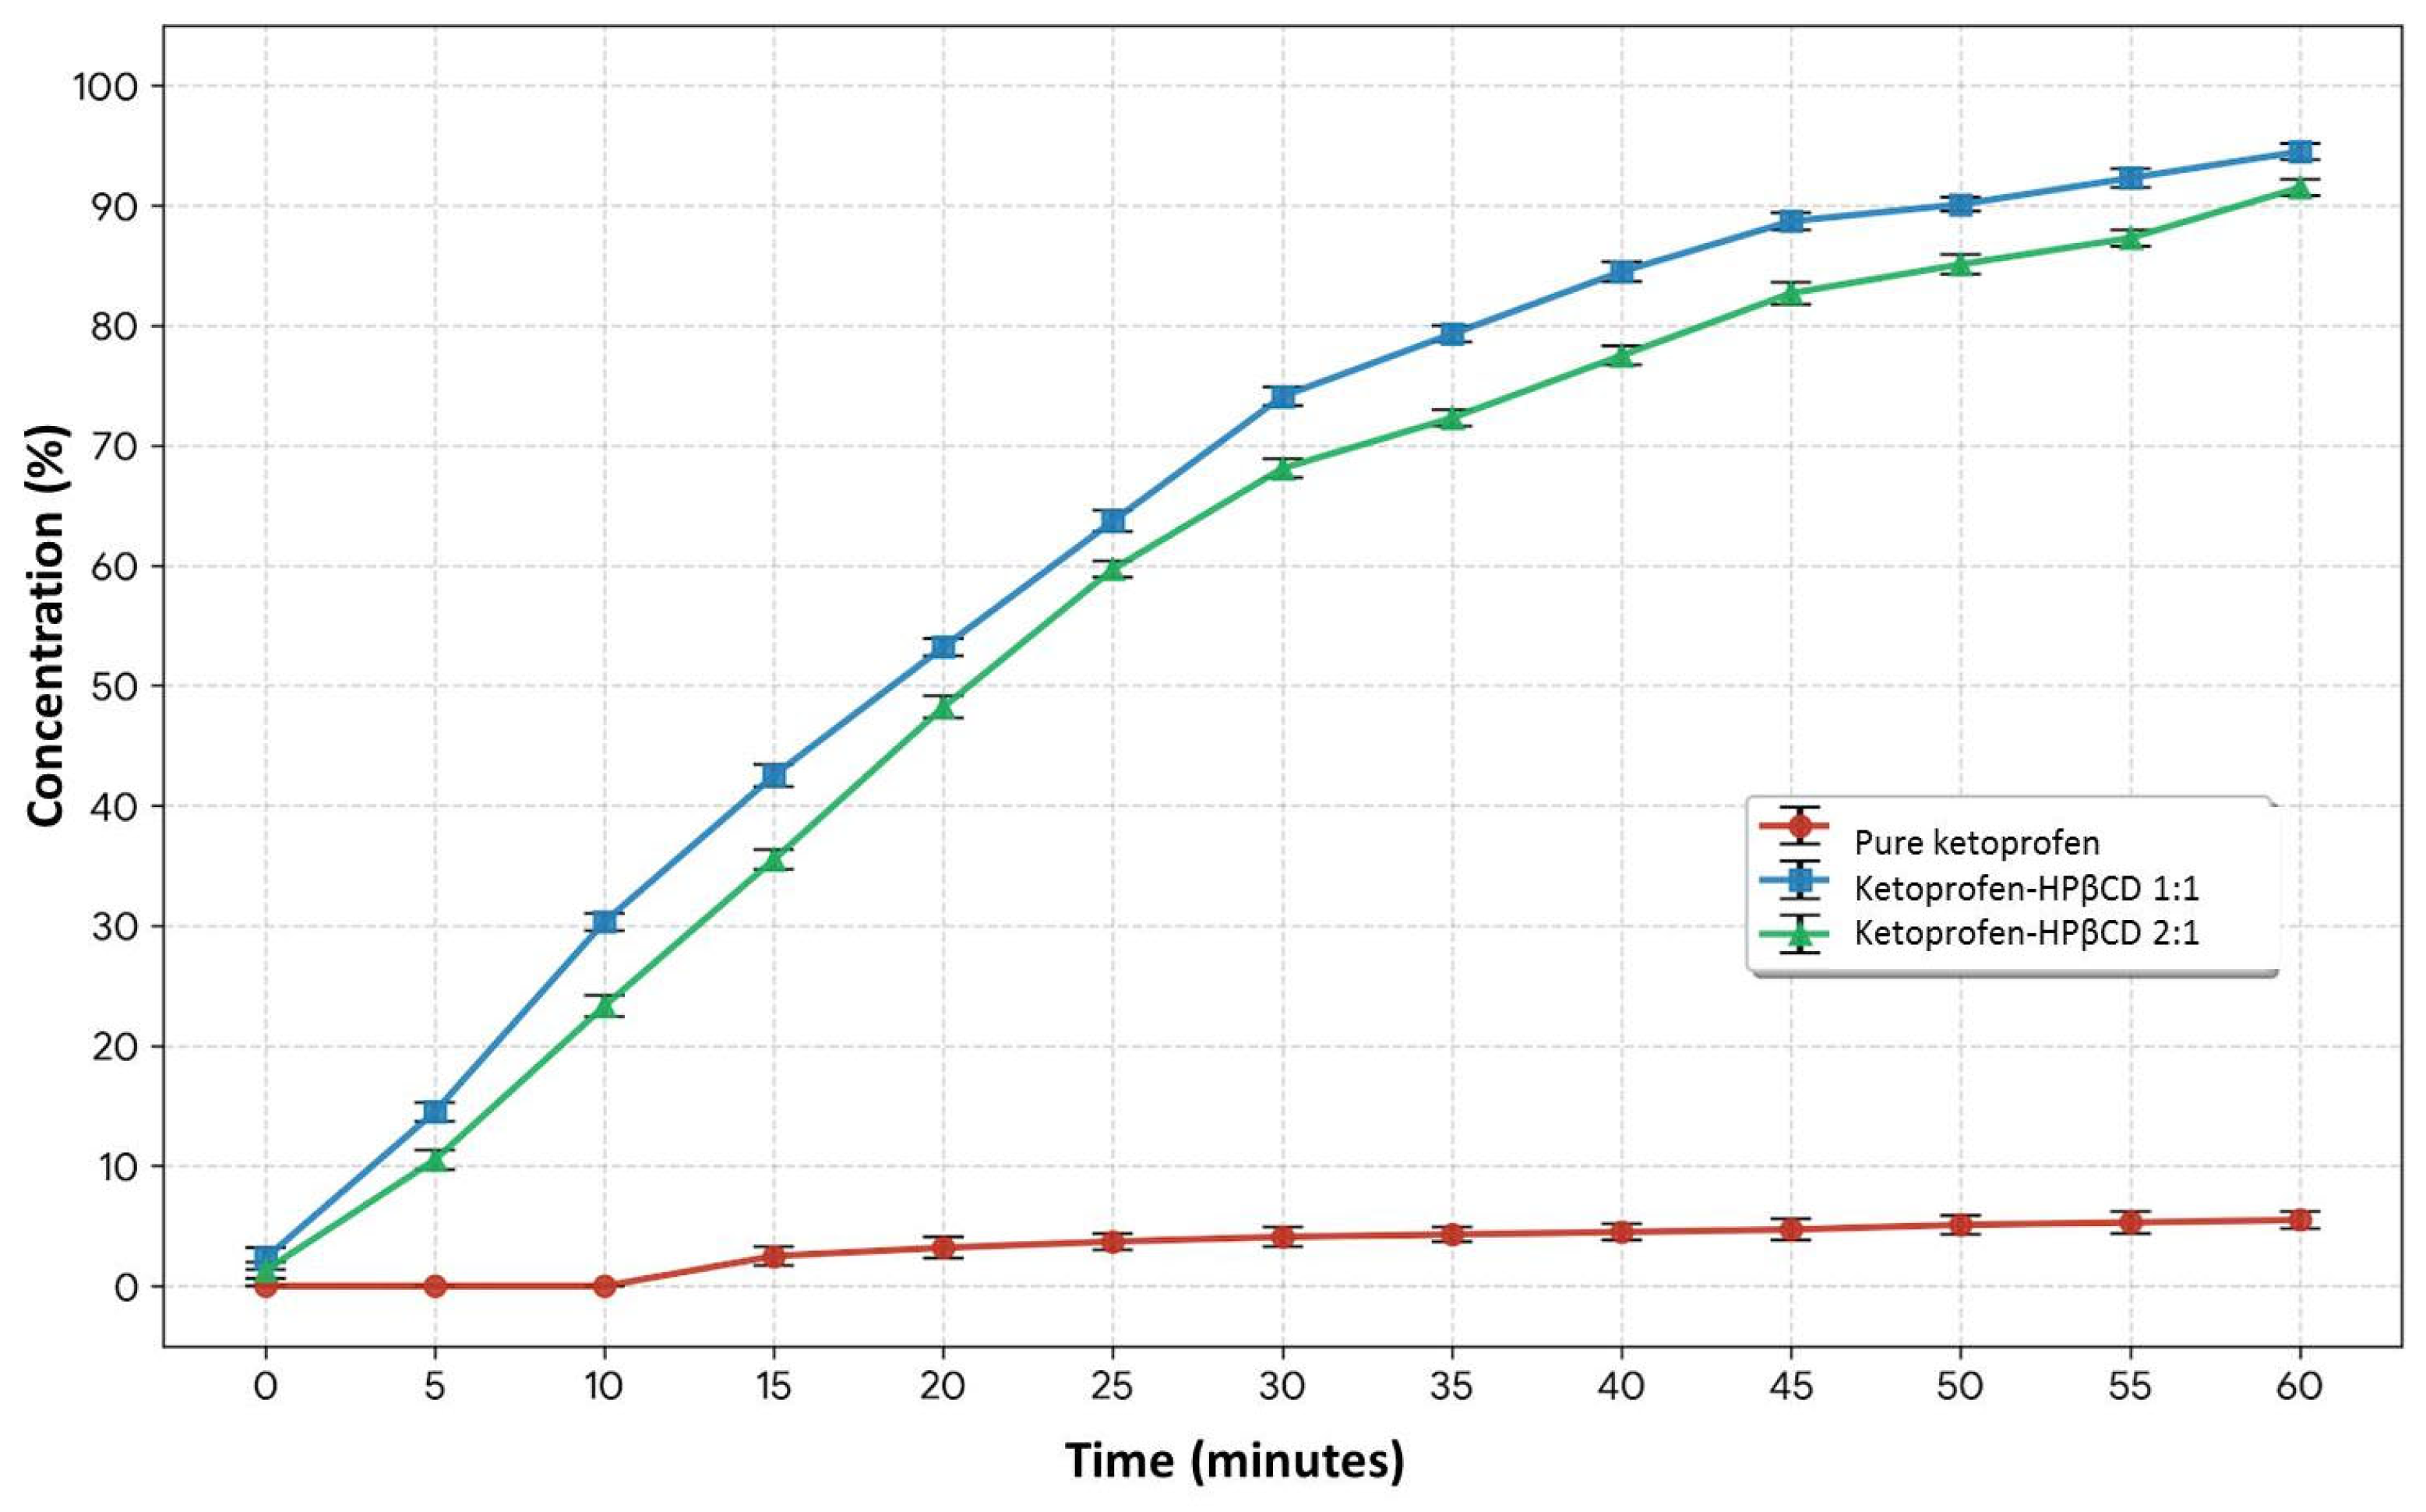
Figure 26 illustrates the comparative profile of the in vitro dissolution kinetics for pure ketoprofen and its inclusion systems (ketoprofen–HPBCD 1:1 and 2:1), determined over a period of 60 min.
A major discrepancy is observed between the profile of the pure active substance and that of the complexes. Thus, while pure ketoprofen presents an extremely low dissolution rate, reaching a maximum of only 5.5% at the end of the monitoring interval, the cyclodextrin-modified systems present a massive acceleration of the release process from the first phases (minute 10). This drastic improvement of the hydrophilic profile is due to the screening effect exerted by HPBCD. By including the hydrophobic ketoprofen molecule in the lipophilic cavity of the cyclodextrin, the crystalline structure of the active principle is destabilized and transferred to an amorphous state, reducing the free energy of dissolution and facilitating instantaneous hydration [34]. Comparing the two molar ratios, the 1:1 system demonstrates superior efficiency in the advanced phases, reaching 94.5% release, compared with 91.5% in the case of the 2:1 ratio. This behavior suggests that the optimal inclusion stoichiometry is monodisperse (1:1), while an excess of complexing agent (2:1 ratio) can generate a steric barrier or a too dense hydrophilic network, which slightly slows down the subsequent diffusion of the dissolved molecules.
The standard deviation in the range of 0.6–0.9% confirms a high reproducibility of the dissolution test. From a statistical point of view, the non-overlapping of the safety intervals between the profiles of the complexes and that of the pure substance throughout the kinetics (5–60 min) demonstrates that the solubility improvement is a significant phenomenon.
The seven complementary techniques used in this study converge on the same conclusion: ketoprofen is effectively included in the cavity of HPβCD when the complexes are prepared by magnetic stirring. This is consistent with the general behavior of cyclodextrins, whose hydrophobic cavity accommodates lipophilic guest molecules and thereby improves their apparent aqueous solubility and dissolution rate [34].

4. Conclusions

Ketoprofen–HPβCD inclusion complexes were successfully prepared by the solution (magnetic-stirring) method at 1:1 and 2:1 molar ratios. FT-IR, DSC and SEM consistently demonstrated the formation of genuine inclusion complexes. The characteristic infrared bands of ketoprofen were attenuated, and the bands assigned to the C=O, C=C and –CH groups were shifted, and, in particular, the shift of the ketoprofen carbonyl band at 1659 cm−1 to 1655 cm−1, the attenuation of the adsorbed-water band at 1647 cm−1 (an HPβCD band, not a carbonyl of the cyclodextrin) and the shift of the band at 3455 cm−1 to 3465 cm−1, indicate that the benzophenone and carboxyl regions of the drug are engaged in the inclusion process.
The endotherm in the 40–130 °C region of ketoprofen was strongly reduced, this region being associated with water loss. The characteristic melting endotherm of crystalline ketoprofen at ≈96 °C is strongly attenuated or absent in the complexes. The pronounced decrease of the ketoprofen melting enthalpy, from 44.34 J g−1 for the pure drug to 11.08 J g−1 and 16.84 J g−1 for the 1:1 and 2:1 complexes, respectively, reflects the conversion of crystalline ketoprofen into an amorphous, included form; only a minor crystalline fraction remains outside the cavity.
The degree of inclusion obtained from the DSC data reached 75% for the 1:1 complex and 62% for the 2:1 complex. The SEM observations are fully coherent with the thermal data. The complexes lack both the regular polyhedral habit of crystalline ketoprofen and the spherical morphology of the cyclodextrin, appearing instead as amorphous, polyhedral particles with rounded edges produced by inter-particle friction during stirring.
The complexes consist of irregular-parallelepiped particles, predominantly 20–100 µm in perimeter size, with a preferential orientation and a passable flow suitable for direct compression. By converting crystalline ketoprofen into an amorphous, cyclodextrin-included form, HPβCD offers a simple and effective route to improve the solubility-related properties of this poorly soluble drug, providing a sound basis for the subsequent development of solid oral dosage forms. The dissolution test validates supramolecular complexation techniques with HPβCD as a successful strategy for overcoming the bioavailability limitations specific to BCS class II drugs.
The use of AutoCAD in particle sizing along with the statistical processing of data obtained using MathCAD are innovative methods that ensure the most accurate particle sizing and correct interpretation of the results.
As the present study focused on the physicochemical and pharmacotechnical characterization of the complexes, the in vitro/in vivo anti-inflammatory evaluation was outside its scope and is planned as the next stage of this work.

Author Contributions

Conceptualization, M.S.C., L.O. and C.S.; methodology, M.S.C., L.O. and C.S., M.S.; software and dimensional analysis, M.S.C., C.S.; validation, C.A.G. and L.O.; formal analysis, C.-E.I.-T.; investigation, M.S.C. and A.B.; resources, M.S.C.; data curation, M.S.C., C.S.; writing—original draft preparation, M.S.C.; writing—review and editing, L.O. and C.S.; visualization, C.S.; supervision, L.O. All authors have read and agreed to the published version of the manuscript.

Funding

This research received no external funding.

Institutional Review Board Statement

Not applicable.

Data Availability Statement

The data presented in this study are available on request from the corresponding author. The complete raw datasets—original FT-IR spectra, DSC thermograms, unprocessed SEM images, the AutoCAD/MathCAD particle-measurement datasets, and the raw dissolution data—have been made available to the editor and reviewers and can be obtained from the corresponding author on request.

Conflicts of Interest

The authors declare no conflicts of interest.

Abbreviations

The following abbreviations are used in this manuscript:
BCSBiopharmaceutics Classification System
NSAIDNon-steroidal anti-inflammatory drug
COXCyclooxygenase
HPβCDHydroxypropyl-β-cyclodextrin
FT-IRFourier-transform infrared spectroscopy
DSCDifferential scanning calorimetry
SEMScanning electron microscopy
EDXEnergy-dispersive X-ray analysis
CDFCumulative distribution functions

References

  1. Loftsson, T.; Brewster, M.E. Pharmaceutical applications of cyclodextrins: Basic science and product development. J. Pharm. Pharmacol. 2010, 62, 1607–1621. [Google Scholar] [CrossRef] [PubMed]
  2. Kumar, B.; Sahani, V.; Patil, S. Review on Ketoprofen (Anti-Inflammatory Drug). J. Res. Appl. Sci. Biotechnol. 2024, 3, 41–50. [Google Scholar] [CrossRef]
  3. Kuczynska, J.; Nieradko-Iwanicka, B. New uses of ketoprofen—A review of studies from 2015 to 2021. Curr. Issues Pharm. Med. Sci. 2022, 35, 16–20. [Google Scholar] [CrossRef]
  4. Stamate, M.I.; Ochiuz, L.; Timofte, D.; Ciuntu, B.; Ghiciuc, C.; Gherman, S.; Stefanache, A.; Stamate, C. Preparation and Pharmaco-Mechanical Characterization of Ketoprofen- Polyvinyl Alcohol Cryogel for Medical Applications. Rev. Chim. 2019, 70, 848–852. [Google Scholar] [CrossRef]
  5. Stamate, M.I.; Stamate, C.; Timofte, D.; Ciuntu, B.; Gafitanu, C.; Stefanache, A.; Ochiuz, L. Effect of Polymers on the Pharmaco-mechanical Properties of Direct Compressed Tablets with Ketoprofen. Mater. Plast. 2019, 56, 239–244. [Google Scholar] [CrossRef]
  6. Gafitanu, C.; Stamate, M.I.; Cojocaru, I.C. Formulation and preparation of omeprazol and ketoprofen bi-layer tablets by direct compression method. Farmacia 2015, 63, 672–678. [Google Scholar]
  7. Davis, M.E.; Brewster, M.E. Cyclodextrin-based pharmaceutics: Past, present and future. Nat. Rev. Drug Discov. 2004, 3, 1023–1035. [Google Scholar] [CrossRef] [PubMed]
  8. Loftsson, T.; Duchêne, D. Cyclodextrins and their pharmaceutical applications. Int. J. Pharm. 2007, 329, 1–11. [Google Scholar] [CrossRef] [PubMed]
  9. Jansook, P.; Ogawa, N.; Loftsson, T. Cyclodextrins: Structure, physicochemical properties and pharmaceutical applications. Int. J. Pharm. 2018, 535, 272–284. [Google Scholar] [CrossRef] [PubMed]
  10. Pettersen, E.F.; Goddard, T.D.; Huang, C.C.; Meng, E.C.; Couch, G.S.; Croll, T.I.; Morris, J.H.; Ferrin, T.E. UCSF ChimeraX: Structure visualization for researchers, educators, and developers. Protein Sci. 2021, 30, 70–82. [Google Scholar] [CrossRef] [PubMed]
  11. Mazurek, A.H.; Szeleszczuk, L. Current status of quantum chemical studies of cyclodextrin host–guest complexes. Molecules 2022, 27, 3874. [Google Scholar] [CrossRef] [PubMed]
  12. Pitha, J.; Milecki, J.; Fales, H.; Pannell, L.; Uekama, K. Hydroxypropyl-β-cyclodextrin: Preparation and characterization; effects on solubility of drugs. Int. J. Pharm. 1986, 29, 73–82. [Google Scholar] [CrossRef]
  13. Gould, S.; Scott, R.C. 2-Hydroxypropyl-β-cyclodextrin (HP-β-CD): A toxicology review. Food Chem. Toxicol. 2005, 43, 1451–1459. [Google Scholar] [CrossRef] [PubMed]
  14. Rajamohan, R.; Kamaraj, E.; Muthuraja, P.; Murugavel, K.; Govindasamy, C.; Prabakaran, D.S.; Malik, T.; Lee, Y.R. Enhancing ketoprofen’s solubility and anti-inflammatory efficacy with safe methyl-β-cyclodextrin complexation. Sci. Rep. 2024, 14, 21516. [Google Scholar] [CrossRef] [PubMed]
  15. Stella, V.J.; He, Q. Cyclodextrins. Toxicol. Pathol. 2008, 36, 30–42. [Google Scholar] [CrossRef] [PubMed]
  16. Kim, D.H.; Lee, S.E.; Pyo, Y.C.; Tran, P.; Park, J.S. Solubility enhancement and application of cyclodextrins in local drug delivery. J. Pharm. Investig. 2020, 50, 17–27. [Google Scholar] [CrossRef]
  17. Tayade, P.T.; Vavia, P.R. Inclusion complexes of ketoprofen with β-cyclodextrins: Oral pharmacokinetics of ketoprofen in human. Indian J. Pharm. Sci. 2006, 68, 164–170. [Google Scholar] [CrossRef]
  18. Guzzo, T.; Mandaliti, W.; Nepravishta, R.; Aramini, A.; Bodo, E.; Daidone, I.; Allegretti, M.; Topai, A.; Paci, M. Conformational Change in the Mechanism of Inclusion of Ketoprofen in β-Cyclodextrin: NMR Spectroscopy, Ab Initio Calculations, Molecular Dynamics Simulations, and Photoreactivity. J. Phys. Chem. B 2016, 120, 7913. [Google Scholar] [CrossRef] [PubMed]
  19. Rajamohan, R.; Kamaraj, E.; Muthuraja, P.; Murugavel, K.; Prabakaran, D.S.; Govindasamy, C.; Almutairi, K.M.; Sun, S. Supramolecular interaction of ketoprofen with native and hydroxypropyl beta-cyclodextrin: Improved solubility and anti-inflammatory. Spectrochim. Acta Part A Mol. Biomol. Spectrosc. 2025, 333, 125904. [Google Scholar] [CrossRef] [PubMed]
  20. Woldum, H.S.; Larsen, K.L. Cyclodextrin Controlled Release of Poorly Water-Soluble Drugs from Hydrogels. Drug Deliv. 2008, 15, 69–80. [Google Scholar] [CrossRef] [PubMed]
  21. Mura, P. Analytical techniques for characterization of cyclodextrin complexes in the solid state: A review. J. Pharm. Biomed. Anal. 2015, 113, 226–238. [Google Scholar] [CrossRef] [PubMed]
  22. Das, S.; Subuddhi, U. Studies on the complexation of diclofenac sodium with beta-cyclodextrin: Influence of method of preparation. J. Mol. Struct. 2015, 1099, 482–489. [Google Scholar] [CrossRef]
  23. Sarabia-Vallejo, Á.; Caja, M.d.M.; Olives, A.I.; Martín, M.A.; Menéndez, J.C. Cyclodextrin Inclusion Complexes for Improved Drug Bioavailability and Activity: Synthetic and Analytical Aspects. Pharmaceutics 2023, 15, 2345. [Google Scholar] [CrossRef] [PubMed]
  24. Stamate Cretan, M.; Ochiuz, L.; Ghizdovat, V.; Molcalut, M.; Agop, M.; Gafitanu, C.A.; Barsan, A.; Sha’at, M.; Stamate, C. Formulation and In Vitro Evaluation of Matrix Tablets Containing Ketoprofen–Beta Cyclodextrin Complex for Enhanced Rheumatoid Arthritis Therapy: Experimental and Computational Insights. Pharmaceutics 2025, 17, 474. [Google Scholar] [CrossRef] [PubMed]
  25. Cirri, M.; Maestrelli, F.; Mennini, N.; Mura, P. Physical–chemical characterization of binary and ternary systems of ketoprofen with cyclodextrins and phospholipids. J. Pharm. Biomed. Anal. 2009, 50, 683–689. [Google Scholar] [CrossRef] [PubMed]
  26. Cirri, M.; Maestrelli, F.; Mennini, N.; Mura, P. Influence of the preparation method on the physical–chemical properties of ketoprofen–cyclodextrin–phosphatidylcholine ternary systems. J. Pharm. Biomed. Anal. 2009, 50, 690–694. [Google Scholar] [CrossRef] [PubMed]
  27. Obaid, A.; Jamil, A.K.M.; Prabu, S.; Saharin, S.M.; Mohamad, S. Spectroscopic studies for the inclusion complexation of ketoprofen enantiomers with β-cyclodextrin. Spectrochim. Acta A Mol. Biomol. Spectrosc. 2020, 241, 118674. [Google Scholar] [CrossRef] [PubMed]
  28. Betlejewska-Kielak, K.; Bednarek, E.; Budzianowski, A.; Michalska, K.; Maurin, J.K. Comprehensive characterisation of the ketoprofen–β-cyclodextrin inclusion complex using X-ray techniques and NMR spectroscopy. Molecules 2021, 26, 4089. [Google Scholar] [CrossRef] [PubMed]
  29. Jorgensen, T.D. How to Estimate Absolute-Error Components in Structural Equation Models of Generalizability Theory. Psych 2021, 3, 113–133. [Google Scholar] [CrossRef]
  30. Hoda, K.; Ratish, R.P.; Amir, R.; Mehdi, K. A critical review on selecting performance evaluation metrics for supervised machine learning models in wastewater quality prediction. J. Environ. Chem. Eng. 2025, 13, 11975. [Google Scholar] [CrossRef]
  31. D’Aria, F.; Pagano, B.; Giancola, C. Thermodynamic properties of hydroxypropyl-β-cyclodextrin/guest interaction: A survey of recent studies. J. Therm. Anal. Calorim. 2022, 147, 4889–4897. [Google Scholar] [CrossRef]
  32. Rakhi, B.S.; Mobin, A.T.; Mansoor, A.K. Comparative Evaluation of Flow for Pharmaceutical Powders and Granules. AAPS PharmSciTech 2008, 9, 250–258. [Google Scholar] [CrossRef] [PubMed]
  33. Fitzpatrick, J.J. Powder properties in food production systems. In Handbook of Food Powders; Bhesh, B., Nidhi, B., Min, Z., Pierre, S., Eds.; Woodhead Publishing: Cambridge, UK, 2013; pp. 285–308. Available online: https://www.sciencedirect.com/science/chapter/edited-volume/abs/pii/B9780857095138500121?via%3Dihub (accessed on 25 March 2026).
  34. Gobbo, D.; Ballone, P.; Decherchi, S.; Cavalli, A. The Solubility Advantage of Amorphous Ketoprofen. Thermodynamic and Kinetic Aspects by Molecular Dynamics and Free Energy Approaches. J. Chem. Theory Comput. 2020, 16, 4126–4140. [Google Scholar] [CrossRef] [PubMed]
Figure 1. (A) Generic structure of hydroxypropyl-β-cyclodextrin (HPβCD), where blue labels indicate the variable substitution sites R = H or −CH2CH(OH)CH3. Each hydroxyl position may be either unsubstituted or hydroxypropyl-substituted; the substitution pattern is partial and variable and does not indicate simultaneous substitution at all positions. (B) Chemical structure of ketoprofen. (C) Schematic representation of the ketoprofen–HPβCD inclusion complex. The yellow cavity represents the hydrophobic cavity of HPβCD (the colors are used for visualization purposes only). Chemical structures were drawn using ChemDraw Ultra version 12.0.2.1076 (CambridgeSoft, Cambridge, MA, USA).
Macromol 06 00058 g001
Figure 2. FT-IR spectra of (a) ketoprofen–HPβCD (1:1) physical mixture; (b) ketoprofen–HPβCD (2:1) physical mixture; (c) ketoprofen; (d) HPβCD; (e) ketoprofen–HPβCD (1:1) complex; and (f) ketoprofen–HPβCD (2:1) complex.
Macromol 06 00058 g002
Figure 3. DSC thermograms: (a) ketoprofen; (b) HPβCD; (c) ketoprofen–HPβCD 1:1 physical mixture; (d) ketoprofen–HPβCD 2:1 physical mixture; (e) ketoprofen–HPβCD 1:1 complex; (f) ketoprofen–HPβCD 2:1 complex.
Macromol 06 00058 g003
Figure 4. SEM micrographs and energy-dispersive X-ray analysis of the ketoprofen–HPβCD 1:1 molar ratio, physical mixture (the symbol + represents the center of the image and the red square represent the surface of X-ray analysis).
Macromol 06 00058 g004
Figure 5. SEM micrographs and energy-dispersive X-ray analysis of the ketoprofen–HPβCD 2:1 molar ratio, physical mixture (the symbol + represents the center of the image and the red square represent the surface of X-ray analysis).
Macromol 06 00058 g005
Figure 6. SEM micrographs and energy-dispersive X-ray analysis of the ketoprofen–HPβCD inclusion complexes obtained at the 1:1 molar ratio (the red square represents the surface of X-ray analysis).
Macromol 06 00058 g006
Figure 7. SEM micrographs and energy-dispersive X-ray analysis of the ketoprofen–HPβCD inclusion complexes obtained at the 2:1 molar ratio (the symbol + represents the center of the image and the red square is the surface of X-ray analysis).
Macromol 06 00058 g007
Figure 8. Distribution of particle perimeter sizes of the obtained complexes: (A) ketoprofen–HPβCD 1:1, (B) ketoprofen–HPβCD 2:1 (histograms created by the authors using PTC Mathcad Express Prime, version 3.0).
Macromol 06 00058 g008
Figure 9. Comparative graph of the cumulative perimeter curves of the particles of the obtained complexes (graphical representation with continuous shaded error bands created by the authors using PTC Mathcad Express Prime, version 3.0).
Macromol 06 00058 g009
Figure 10. Distribution of particle area sizes of the obtained complexes: (A) ketoprofen–HPβCD 1:1, (B) ketoprofen–HPβCD 2:1 (histograms created by the authors using PTC Mathcad Express Prime, version 3.0).
Macromol 06 00058 g010
Figure 11. Comparative graph of the cumulative area curves of the particles of the obtained complexes (graphical representation with continuous shaded error bands created by the authors using PTC Mathcad Express Prime, version 3.0).
Macromol 06 00058 g011
Figure 12. Distribution of particle circularity sizes of the obtained complexes: (A) ketoprofen–HPβCD 1:1, (B) ketoprofen–HPβCD 2:1 (histograms created by the authors using PTC Mathcad Express Prime, version 3.0).
Macromol 06 00058 g012
Figure 13. Comparative graph of the cumulative circularity curves of the particles of the obtained complexes (graphical representation with continuous shaded error bands created by the authors using PTC Mathcad Express Prime, version 3.0).
Macromol 06 00058 g013
Figure 14. Response surface of the dependence of circularity on area and perimeter, simulated for 1:1 molar ketoprofen–HPβCD particles (surface plot created by the authors using PTC Mathcad Express Prime, version 3.0).
Macromol 06 00058 g014
Figure 15. Response surface of the dependence of circularity on area and perimeter, simulated for 2:1 molar ketoprofen–HPβCD particles (surface plot created by the authors using PTC Mathcad Express Prime, version 3.0).
Macromol 06 00058 g015
Figure 16. Distribution of particle elongation sizes of the obtained complexes: (A) ketoprofen–HPβCD 1:1, (B) ketoprofen–HPβCD 2:1 (histograms created by the authors using PTC Mathcad Express Prime, version 3.0).
Macromol 06 00058 g016
Figure 17. Comparative graph of the cumulative elongation curves of the particles of the obtained complexes (graphical representation with continuous shaded error bands created by the authors using PTC Mathcad Express Prime, version 3.0).
Macromol 06 00058 g017
Figure 18. Distribution of particle orientation: (A) ketoprofen–HPβCD 1:1, (B) ketoprofen–HPβCD 2:1 (histograms created by the authors using PTC Mathcad Express Prime, version 3.0).
Macromol 06 00058 g018
Figure 19. Comparative graph of the cumulative orientation factor curves (graphical representation with continuous shaded error bands created by the authors using PTC Mathcad Express Prime, version 3.0).
Macromol 06 00058 g019
Figure 20. Distribution of particle form factor: (A) ketoprofen–HPβCD 1:1, (B) ketoprofen–HPβCD 2:1 (histograms created by the authors using PTC Mathcad Express Prime, version 3.0).
Macromol 06 00058 g020
Figure 21. Comparative graph of the cumulative form factor curves for the ketoprofen–HPBCD 1:1 and the ketoprofen–HPBCD 2:1 particles (graphical representation with continuous shaded error bands created by the authors using PTC Mathcad Express Prime, version 3.0).
Macromol 06 00058 g021
Figure 22. Distribution of particle compactness factor sizes of the obtained complexes: (A) ketoprofen–HPβCD 1:1, (B) ketoprofen–HPβCD 2:1 (histograms created by the authors using PTC Mathcad Express Prime, version 3.0).
Macromol 06 00058 g022
Figure 23. Comparative graph of the cumulative compactness factor curves of the particles of the obtained complexes (graphical representation with continuous shaded error bands created by the authors using PTC Mathcad Express Prime, version 3.0).
Macromol 06 00058 g023
Figure 24. Response surface of the dependence of compactness factor on form factor and orientation, simulated for 1:1 molar ketoprofen–HPβCD particles (surface plot created by the authors using PTC Mathcad Express Prime, version 3.0).
Macromol 06 00058 g024
Figure 25. Response surface of the dependence of compactness factor on form factor and orientation, simulated for 2:1 molar ketoprofen–HPβCD particles (surface plot created by the authors using PTC Mathcad Express Prime, version 3.0).
Macromol 06 00058 g025
Figure 26. In vitro dissolution profiles of ketoprofen and its complexes with cyclodextrin at pH 1.2.
Macromol 06 00058 g026
Table 1. Melting enthalpy (ΔH) of ketoprofen, of the ketoprofen–HPβCD physical mixture and ketoprofen–HPβCD inclusion complexes determined by DSC.
SampleΔH * (J g−1)
Ketoprofen44.34
Ketoprofen–HPβCD 1:1 physical mixture17.52
Ketoprofen–HPβCD 2:1 physical mixture29.94
Ketoprofen–HPβCD 1:1complex11.08
Ketoprofen–HPβCD 2:1complex16.84
* ΔH is the melting enthalpy of the active substance fraction.
Table 2. Dimensional characteristics of the ketoprofen–HPβCD inclusion complexes obtained at the 1:1 molar ratio, determined by image analysis (table created by the authors based on AutoCAD data).
Particle NoParameters
Perimeter (µm) Area * (µm2)Orientation Elongation FactorCompactness FactorCircularity
Factor
Form Factor
εSAE = ±1.5 µmεSAE = ±12.0 µm2εSAE = ±2.5°εSAE = ±0.003εSAE = ±0.012εSAE = ±0.020εSAE = ±0.015
122.20271.70727.0641.0510.3410.5160.454
239.331212.6829.7751.0670.3220.5310.455
363.714143.41666.4390.9220.2820.5840.436
459.456251.21963.1461.5350.1940.7390.248
525.69187.3176.7381.2990.2960.5410.461
637.371179.51284.4261.0400.3630.5490.458
729.67295.12116.8531.8130.2580.5990.336
843.559235.60929.8141.2800.3060.5590.431
954.588355.6099.0391.2130.2490.5700.442
1059.59546.4391.3471.0970.2960.5440.463
1166.929660.97573.9460.9520.3510.5120.461
1221.02553.65824.0431.1520.2940.5650.445
1345.106230.7317.9051.5680.2960.5850.419
1471.568516.09778.0881.5840.2730.6200.378
1540.228200.97536.3261.3300.3140.5590.454
1622.32257.56082.6071.5580.3020.5790.444
1725.16274.14613.8441.6750.2520.5750.388
1865.748525.3650.1781.1870.3180.5650.456
1994.832670.73182.2871.1170.2500.7820.353
2036.009151.70779.6771.4190.3070.5760.428
* 2D projected (silhouette) area of the particle, measured from the SEM micrographs and used as a morphometric size descriptor; this is not the true 3D surface area, which cannot be quantified from a 2D SEM projection without stereological reconstruction.
Table 3. Dimensional characteristics of the ketoprofen–HPβCD inclusion complexes obtained at the 2:1 molar ratio, determined by image analysis (table created by the authors based on AutoCAD data).
Particle NoParameters
Perimeter (µm)Area * (µm2)Orientation Elongation FactorCompactness FactorCircularity
Factor
Form Factor
εSAE = ±1.5 µmεSAE = ±12.0 µm2εSAE = ±2.5°εSAE = ±0.003εSAE = ±0.012εSAE = ±0.020εSAE = ±0.015
172.872388.78065.9481.4160.2050.7280.232
262.06355.29236.1090.9260.3430.5320.453
322.77369.51234.5321.5430.2840.5810.412
426.30585.36526.3541.5080.2710.5600.406
515.79533.17022.5721.1620.3680.5400.452
658.938427.80466.1511.3260.2540.5610.374
717.57842.43953.5911.0370.2960.5310.455
838.567198.04857.1071.2170.3180.5390.433
951.645328.2921.6891.3370.3250.5610.460
1037.222180.48720.8651.1860.2880.5450.414
1118.44046.82934.9831.0260.3900.5300.468
1246.574310.73146.4930.9650.3690.5200.475
1377.605755.12260.3271.2760.2970.5560.410
1425.12479.02442.9671.1140.2770.5560.465
1556.832221.95168.2491.6130.2230.7510.298
1643.146219.5124.6171.5110.2960.5730.447
1733.372139.02471.4781.2390.2890.5570.414
1831.210128.78026.7550.9600.2920.5410.463
1924.72471.21935.1811.5000.2960.5770.446
2059.010269.75687.1311.1520.2690.7070.393
2144.129240.97546.8441.2210.3080.5600.466
2220.21457.56052.5950.9670.2950.5240.468
2381.666483.41467.0351.7640.2060.7310.275
2472.871388.77965.9461.4140.2040.7260.230
* 2D projected (silhouette) area of the particle, measured from the SEM micrographs and used as a morphometric size descriptor; this is not the true 3D surface area, which cannot be quantified from a 2D SEM projection without stereological reconstruction.
Table 4. Bulk and tapped densities, Carr index, and Hausner ratio of ketoprofen and of the ketoprofen–HPβCD complexes.
SampleBulk Density (g mL−1)Tapped Density (g mL−1)Carr Index (%)Hausner Ratio
Ketoprofen *0.5560.68919.31.24
Ketoprofen–HPβCD 1:10.4230.54722.61.28
Ketoprofen–HPβCD 2:10.5340.71124.81.33
* Standard substance for comparing complexes.
Table 5. The dissolution values * of the ketoprofen and its complexes.
Time (minutes)Ketoprofen (%)Ketoprofen–HPβCD
1:1 (%)
Ketoprofen–HPβCD 2:1 (%)
002.3 ± 0.91.3 ± 0.7
52.5 ± 0.814.5 ± 0.810.5 ± 0.8
103.2 ± 0.930.3 ± 0.723.3 ± 0.9
153.7 ± 0.742.5 ± 0.935.5 ± 0.8
204.1 ± 0.853.2 ± 0.748.2 ± 0.9
254.3 ± 0.663.7 ± 0.959.7 ± 0.7
304.5 ± 0.774.1 ± 0.868.1 ± 0.8
354.7 ± 0.979.3 ± 0.772.3 ± 0.7
405.1 ± 0.884.5 ± 0.877.5 ± 0.8
455.3 ± 0.988.7 ± 0.782.7 ± 0.9
505.5 ± 0.790.1 ± 0.685.1 ± 0.8
555.5 ± 0.792.3 ± 0.887.3 ± 0.7
605.5 ± 0.794.5 ± 0.791.5 ± 0.7
* Values are expressed as the mean ± SD.
Disclaimer/Publisher’s Note: The statements, opinions and data contained in all publications are solely those of the individual author(s) and contributor(s) and not of MDPI and/or the editor(s). MDPI and/or the editor(s) disclaim responsibility for any injury to people or property resulting from any ideas, methods, instructions or products referred to in the content.