1. Introduction
Adhesion refers to the interatomic and intermolecular interactions occurring at the interface between two surfaces. Various adhesion mechanisms—such as diffusion, mechanical interlocking, molecular and chemical bonding, and thermodynamic effects—are actively debated in the literature [
1,
2,
3]. Understanding these mechanisms requires knowledge of the physical and chemical properties of the surfaces involved, as well as the characteristics of delaminated surfaces in cases where adhesion has failed, either during use or mechanical testing.
The ability of inks to adhere to different substrates is crucial in various industrial applications. This adhesion can be evaluated indirectly through thermodynamic analysis of the surface or directly using peel tests with laminated paper or adhesive tapes [
1].
The adhesion strength between a polymer and a paper surface is largely determined by their physical and chemical properties. One key factor is the polarity of the polymer, which is influenced by its carboxyl content. A higher carboxyl concentration enhances the bond strength between cellulose and the polymer, as reflected in increased peel strength. Additionally, the critical surface tension of both the paper and the ink plays a crucial role in adhesion. Papers with critical surface tension lower than that of the ink tend to exhibit poor adhesion, whereas those with higher values promote stronger bonding. Pure cellulose has relatively high critical surface tension (44–60 mN/m), whereas papers containing lignin or sizing agents tend to have lower values [
4].
The adhesion of printing inks to substrates is influenced by surface energy, wettability, and chemical interactions between the ink and substrate. Surface energy and polarity of polymer films significantly affect the spreading and adhesion of UV–flexo inks [
5]. In addition, the composition of the ink itself, such as the choice of colorants, solvents, and binders influence ink adhesion. The compatibility of colorants with the binder system, their type, concentration, and dispersion all play a role in determining adhesion quality. For absorbent substrates like paper, adhesion is influenced by how deeply the binder penetrates, whereas for non-absorbent surfaces, it depends on the resin’s ability to form a continuous film and its molecular interaction with the substrate [
6,
7]. Solvents impact adhesion in two key ways: improving wettability and enhancing penetration. Proper wetting is essential to ensure uniform ink coverage and film formation, while increased penetration aids in both physical and chemical bonding with the substrate. Additionally, small amounts of additives can be introduced during ink production to enhance chemical bonding between the ink and the printing surface [
6].
Borch (1991) and Forsström et al. (2005) identified that thermodynamic properties (dispersion and polar interactions between the ink and paper), molecular contact area and surface texture, fusing conditions are the key factors that influence the adhesion between ink and the printing substrate [
4,
8]. Surface energy is a key factor, as effective ink spreading on cellulose is essential for strong adhesion. Paper roughness influences bonding, i.e., higher roughness in electrophotographic and thermal printing potentially reduce toner adhesion. A similar effect has been observed in polymer coatings when applied in smaller amounts. The extent of contact determines the degree of interdiffusion between ink components and the amorphous regions of cellulose. Adhesion quality is also affected by temperature, duration, and applied pressure during the fusing process [
4,
8].
For the printing substrates with low surface tension, ink dispersion and resin selection are crucial factors in improving adhesion [
9]. Water-based inks may face challenges on nonpolar polymer surfaces, but surface treatments and ink modifications can enhance wettability and adhesion [
7]. In LEP printing, the polar content of paper and ink surfaces, as well as interfacial acid–base interactions, play a role in ink-substrate adhesion. ATR-FTIR measurements can directly observe these interactions, with the C-O stretching band around 1152 cm
−1 indicating acid–base interaction strength [
10]. Understanding these factors is essential for optimizing ink adhesion in various printing processes. Paper ink interactions and adhesion parameters were studied using contact angle measurements [
11,
12,
13,
14,
15,
16].
Thermochromism is a physical process that causes a compound to undergo either irreversible or reversible color changes when exposed to heat. Within a specific temperature range, these inks can reversibly change color, either becoming colorless or shifting from one color to another [
17]. Thermochromic printing inks change color in response to temperature, making them useful for textile applications, security markings, interactive packaging, and decorative effects [
18,
19]. However, their application in printing presents certain challenges. One of the main issues is their sensitivity to external factors such as UV radiation and chemicals, which can reduce the durability of the print [
20,
21]. Good adhesion is crucial as it ensures even application and stability of the ink during use. Poor adhesion can lead to peeling, uneven color changes, and reduced print quality, limiting their long-term application.
In order to gain better understanding of the behavior of screen-printing thermochromic inks, in this research paper–ink interactions were studied using the thermodynamic work of adhesion.
2. Materials and Methods
2.1. Printing Materials and Printing Process
In this study, three printing substrates were used: polypropylene-based (hereinafter as synthetic or S) (73 g/m2), fiber-based recycled paper containing 33% of recycled cellulose fibers (80 g/m2), and bulky paper containing wood-free pulp and more than 10% mechanical wood pulp (80 g/m2). The printing substrates used differ in their chemical composition and absorption capacities. One leuco dye-based, commercially available UV-curable screen-printing thermochromic (TC) ink with the activation temperature of thermochromic ink is 31 °C, was used in printing trials. Below 31 °C, the thermochromic UV-curable screen print (hereinafter UV print) was colored in purple while above this temperature, the print was colored in pink.
The printing process was conducted using a screen-printing device (Holzschuher K.G., Wuppertal, Germany) employing 60/64 mesh. The printed samples were dried under the UV irradiance (30 W/cm) using Technigraf Aktiprint L 10-1 device (Hessen, Germany). All the samples were printed in the full tone.
2.2. Determination of Paper and Print Thickness and Roughness
The thickness of unprinted paper samples was determined according to ISO 534:2005 standard using Enrico Toniolo DGTB001 (Milano, Italy) Thickness Gauge. Print thickness values were obtained by subtracting the measured values of the thickness of unprinted paper from the measured values of thickness of paper with print. Average values of twenty measurements are presented as mean ± SD.
The roughness of a paper and printed paper (UV print) was determined using a Surface roughness tester TR200 (Frechen, Germany).
2.3. Determination of Surface Free Energy γ
Evaluation of surface free energy of paper and paper printed with ink were carried out by contact angle measurements on DataPhysics OCA 30 Goniometer (DataPhysics, Filderstadt, Germany), using Sessile Drop method. By measuring contact angles of standard test liquids (demineralized water, diiodometane, and glycerol) whose surface tensions are known (
Table 1), it is possible to determine the total solid surface free energy and its dispersive and polar component [
11,
12,
13,
14,
15]. Measurements were performed at room temperature 23.0 ± 0.2 °C. The volume of droplet was 1 µL. Contact angle was captured by CCD camera and measured 2 s after the droplet was formed. Average values of ten drops on different places of the same sample were taken and presented as mean ± SD.
The Owens–Wendt calculation method was applied to the contact angle data of test liquids in order to evaluate the parameters of surface free energy (
γ) and its dispersive (
γd) and polar (
γP) components [
12,
13,
14]. The conducted calculation method is integrated in the software (SCA20, Version 2.01) and automatically carried out. From the obtained
γ, adhesion parameters (surface free energy of the interphase (
γ12), work of adhesion (
W12) and wetting coefficient (
S12)) were calculated [
11,
14]. Owens–Wendt model includes the assumption according to which both the dispersive and polar interactions between two phases are equal to the geometric mean expression of
γ of the individual phase which are in contact with each other, according to Equation (1) [
22]:
where the subscript refers to surface free energy of the each solid, in our case paper and ink print, and the
γ12 denotes their
γ of the interphase. Adsorption theory, according to the Dupré approach, which presents the thermodynamic work of adhesion
W12 between two phases is equal to Equation (2) [
22]:
The wetting coefficient
S12 is equal to Equation (3) and indicates spontaneously wetting and spreading on the solid surface if the value is positive or equal to zero, while the negative value implies the lack of spontaneous wetting.
2.4. Scanning Electron Microscopy and Optical Microscopy
The printed thermochromic surface were monitored using a FE-SEM Jeol 7000 (Peabody, MA, USA) field emission scanning electron microscope. The micrographs were taken under a magnification of 1000× and 5000×.
Microscopic image of thermochromic ink was taken using Olympus BX51 System Microscope (Olympus, Tokyo, Japan).
2.5. Determination of Color
The colorimetric properties of printed samples were assessed using the Ocean Optics USB2000+ spectrophotometer (Ocean Optics, Orlando, FL, USA) and Ocean Optics SpectraSuite software (Ocean Optics, Orlando, FL, USA). CIELAB values (L*, a*, b*) were calculated based on reflectance measurements across the full spectral range (380–730 nm, in 1 nm increments). The calculations utilized the D50 illuminant and a 2° standard observer. To maintain temperature control, all samples were thermostated using the Full Cover water block (EK Water Blocks, EKWB d.o.o., Komenda, Slovenia). The temperature of the copper plate surface was regulated by circulating thermostatically controlled water through internal channels, ensuring an accuracy of up to ±1 °C. All the samples were heated (cooled) and measured at different temperatures: 15, 20, 25, 31, 35, 40 and 42 °C.
3. Results
3.1. Determination of Print Thickness
Table 2 shows the thickness of the UV print on used printing substrates. The thickness of printed bulky paper is the smallest while for synthetic paper is the highest. The measured values of thickness of UV print presented in
Table 2 may indicate that different ink absorption into the paper structure results from physio-chemical composition of paper substrates and different absorption capacities and ink affinity. Previous results showed that synthetic paper is not absorbent (air permeance is 0 µm/Pas), unlike recycled and bulky paper [
23]. In the case of printing synthetic paper, there is no penetration of the ink into the structure while, in the case of recycled and bulky paper penetration of ink binder into the paper structure occurs.
Table 2 also shows the results of surface roughness of both printing substrates and the UV print obtained on printing substrates. The results indicate the very smooth surface of S paper. Bulky paper has the highest value of surface roughness.
3.2. Determination of Surface Free Energy
The heterogeneity of the paper surface significantly affects its surface properties, as different areas of the surface may exhibit varying chemical and physical characteristics. For example, the distribution of fibers, the presence of fillers, and variations in roughness create an uneven surface that alters how liquids interact with the paper [
12,
16,
24]. This heterogeneity can lead to local differences in wettability and adhesion, which is especially important in printing and coating processes.
All used paper substrates show hydrophobic surface (water contact angle is greater than 90°) (
Table 3). The highest hydrophobicity shows bulky paper (120°) due to the presence of hydrophobic lignin in paper, additives or finishing processes [
24], while the lowest hydrophobic character was achieved for recycled paper (91°). Comparing the characters of UV prints, it can be seen that UV print on recycled and bulky paper are hydrophobic while for the UV print on synthetic paper, obtained water contact angle (73°) indicates a hydrophilic surface. Different prints surface properties can be attributed to the absorption of ink into the paper structure. Synthetic paper is not absorbent, and all the components of the printing ink remain on the surface. Due to the hydrophilic character of the polyurethane acrylate used in the composition of printing ink [
23], which remains on the surface of synthetic paper, the hydrophilic properties of the UV print on synthetic paper are greater. Due to heterogeneous surface of samples in the chemical and physical meaning, a greater deviation of contact angels can be seen.
Table 4 provides the calculated values of the surface free energy (
γ) of unprinted and printed samples and its components. The
γ values of unprinted paper samples are approximately the same, especially for recycled (23.87 mJ m
−2) and synthetic paper (23.10 mJ m
−2), slightly higher value has bulky paper (26.44 mJ m
−2). The surface free energy (
γ) of all unprinted paper samples mostly originate from dispersive components, which is the highest in the case of bulky paper. Surface-free energies of recycled and bulky paper have small values of polar components, but are still higher than polar component of synthetic paper due to its chemical structure. Bulky paper has slightly higher polar components than recycled paper.
Comparing the results of γ for printed samples, it can be seen that the highest value of polar component is on UV print on synthetic paper, followed by UV print on recycled paper. The smallest polar component was obtained on UV print on bulky paper. Accordingly, the larger the polar component of the paper, the smaller the polar component of the print is.
This can be explained by the fact that polar component of the thermochromic printing ink and the surface of paper form polar interactions. The polyurethane acrylate, which is used in composition of the ink [
23], is partially hydrophilic due to the presence of C=O and N-H groups. By increasing the polar component of the paper, the attractive polar interactions between the paper and the polyurethane acrylate resin also increase.
Table 5 shows the calculated adhesion parameters. The best adhesion performance is achieved if the following conditions are met:
γ12 = 0, W
12 = maximal and S
12 ≥ 0. The adhesion can be expressed as the sum of works of adhesion for polar and dispersive interaction, giving as a result the overall thermodynamic work of adhesion [
5].
On the bulky paper, the lowest γ12, the highest W12, and better spreading (wettability) were achieved, followed by recycled paper and then by synthetic paper. Bulky paper has the highest γ, but also it has the highest value of polar and dispersive components. Synthetic and recycled papers have similar γ values. However, better adhesion property was achieved on the recycled paper, which contains higher value of polar component. The interactions between the thermochromic ink and the surface of the synthetic paper were achieved only by dispersion forces due to the very small share of polar components on the surface of paper, which resulted in formation of the hydrophilic surface of the UV print due to presence of unbounded polar group of polyurethane acrylate resin. Based on the results obtained, it can be concluded that the surface of the paper besides large surface-free energy should have the optimal polarity in order to achieve better adhesion properties of used thermochromic ink.
3.3. SEM Microscopy
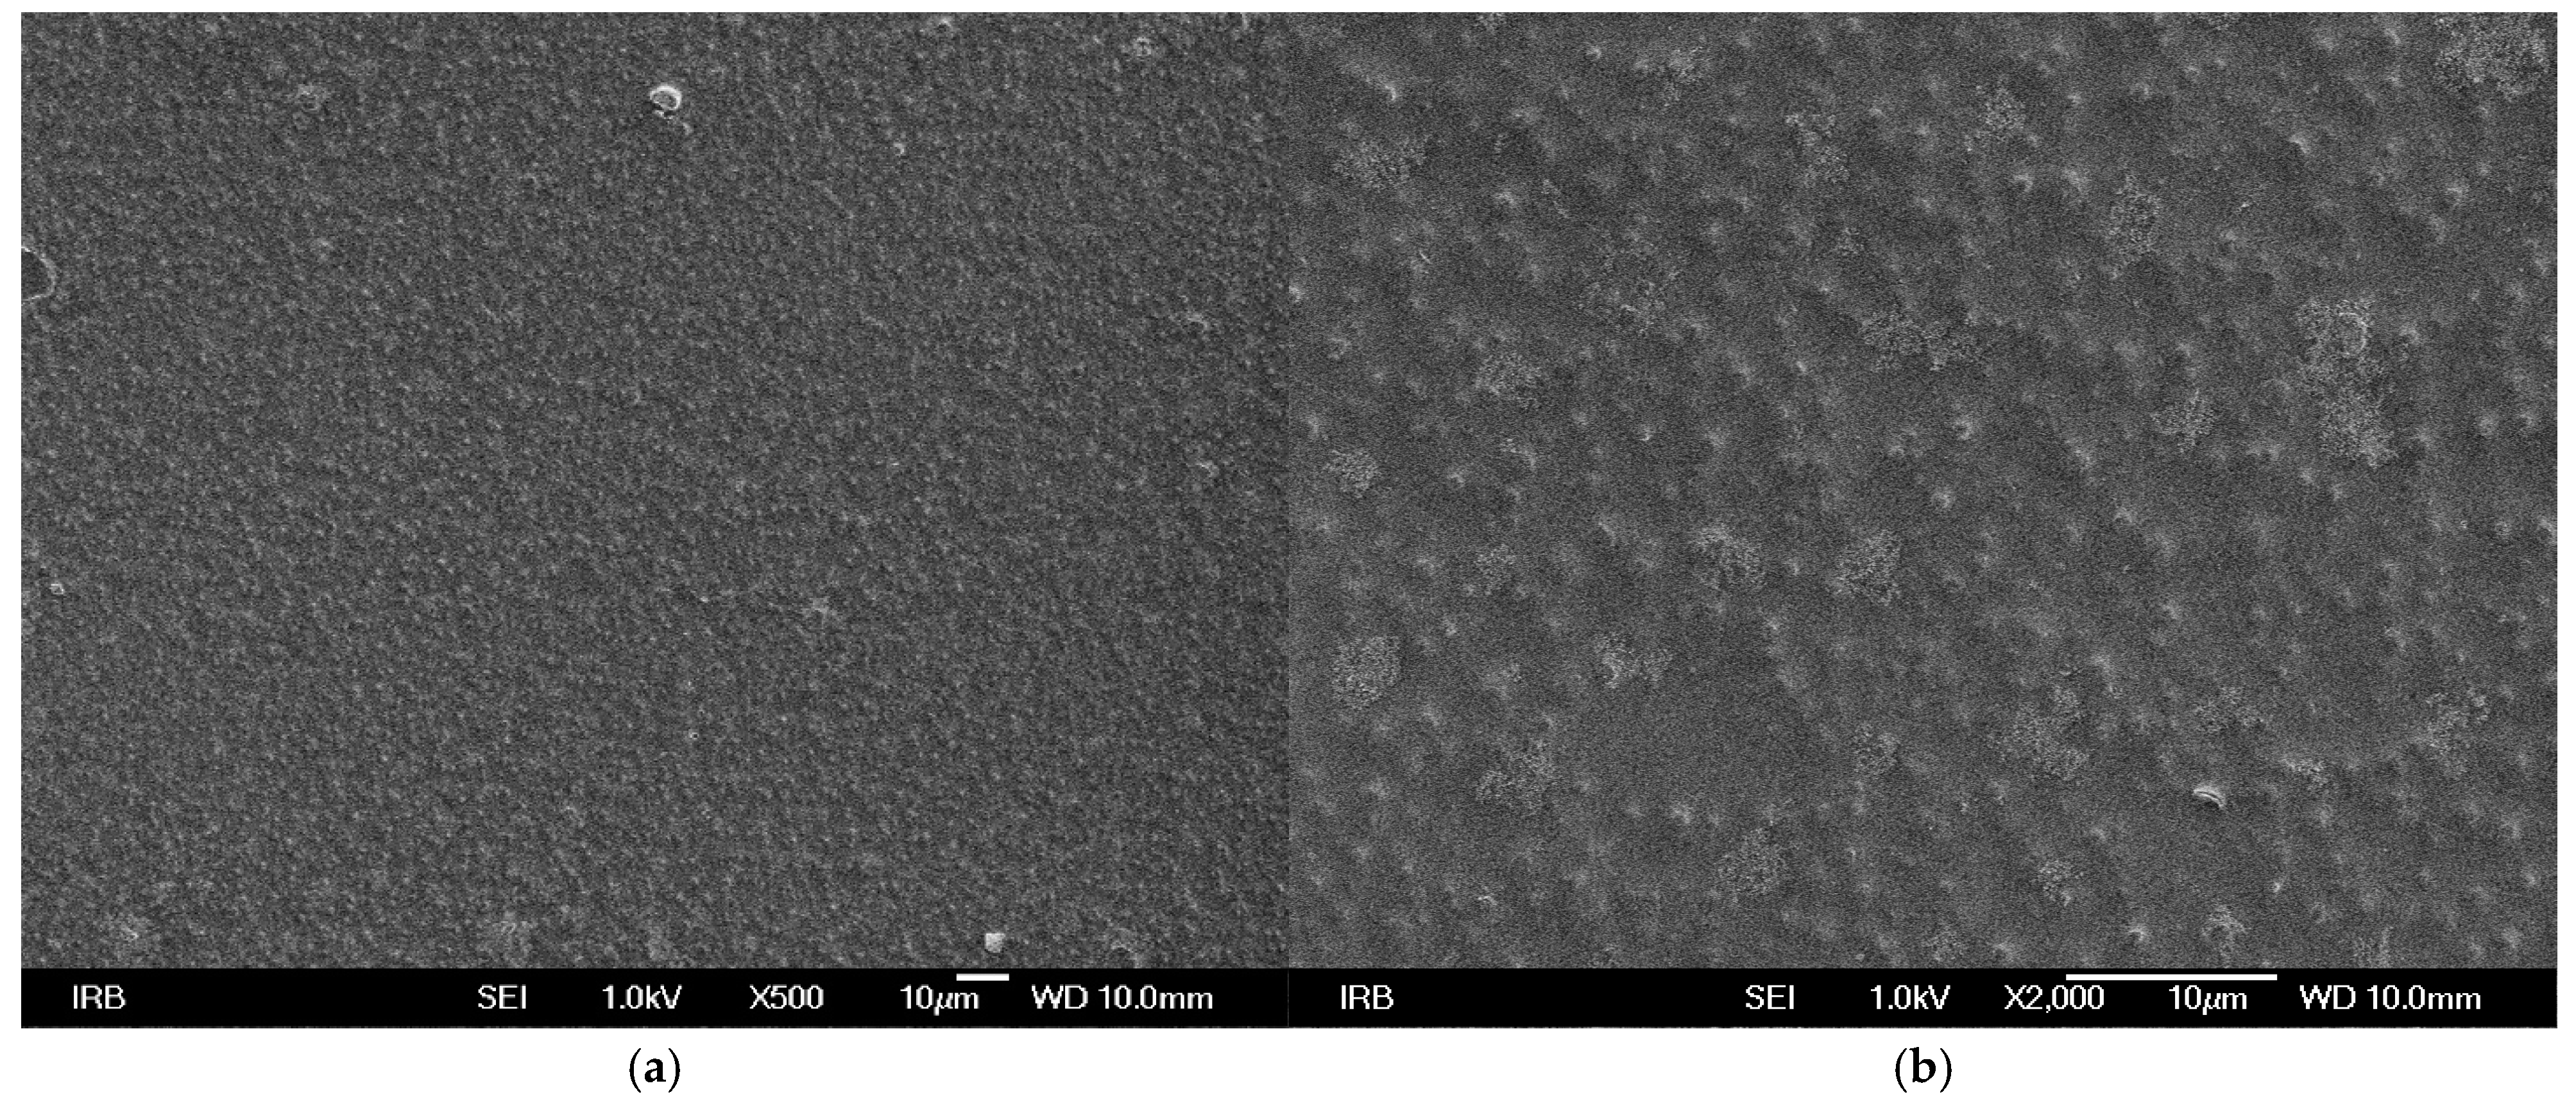
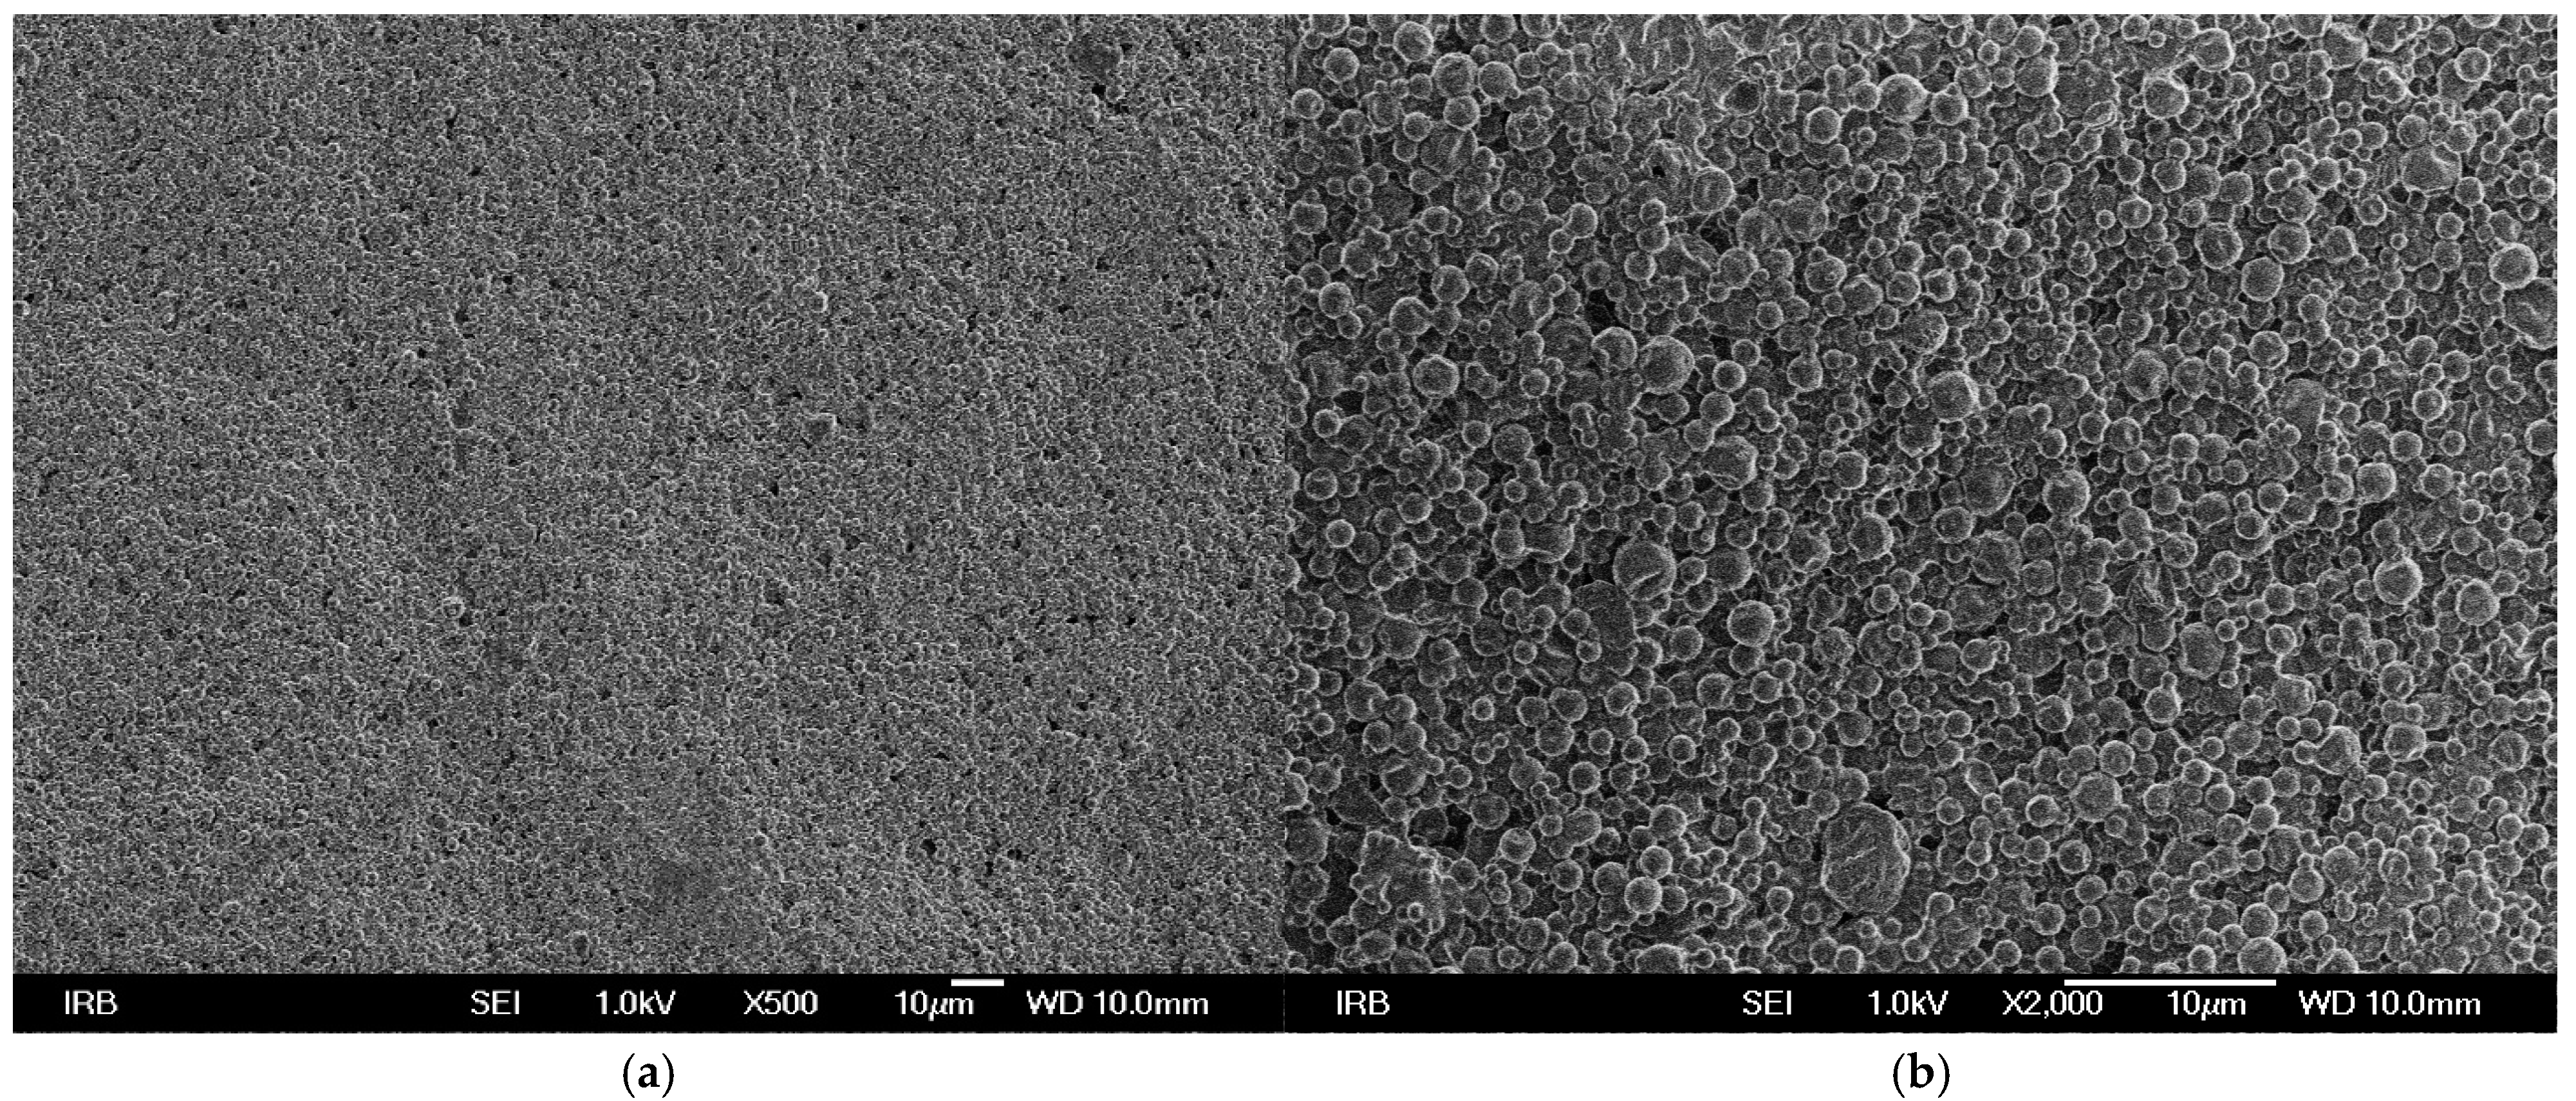
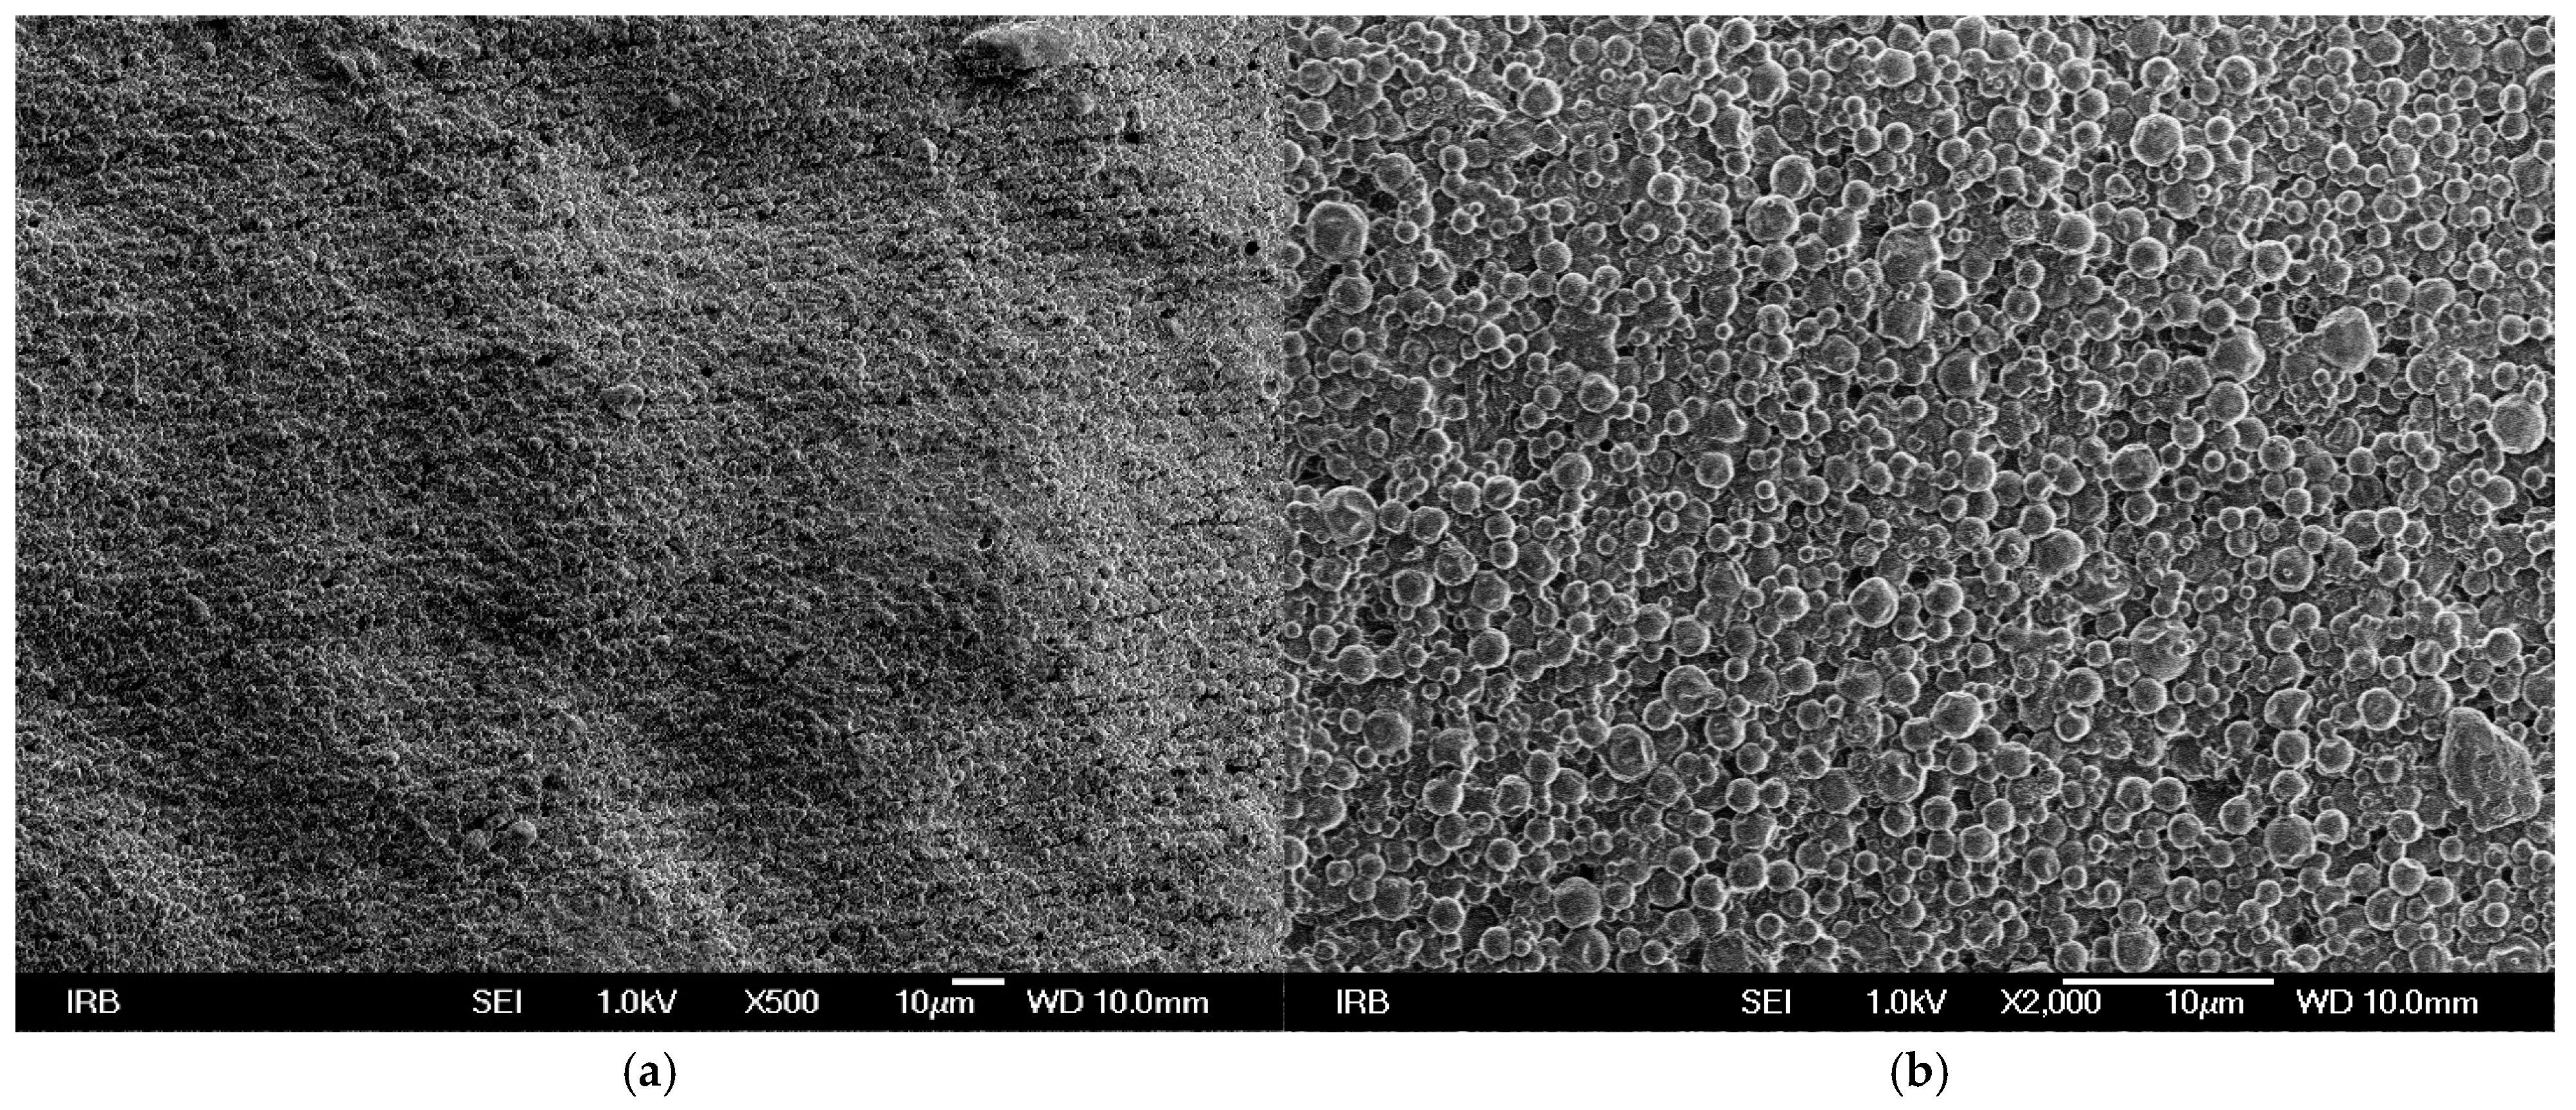
SEM micrographs of UV prints on used printing substrates show that TC microcapsules are covered with binder (
Figure 1,
Figure 2 and
Figure 3). In the case of UV prints on recycled (
Figure 2) and bulky paper (
Figure 3), the microcapsules are more visible since they are covered with thinner layer of binder in comparison to UV print on synthetic printing substrate (
Figure 1). From the SEM micrographs it can be assumed that ink binder penetrates more into the structure of fibrous printing substrates (recycled and bulky paper) than in comparison to synthetic paper where it stays on surface since penetration of ink binder is not possible. The SEM images confirm the results of print thickness, where thicker ink film for the synthetic paper corresponds to higher content of ink binder on surface and in accordance with another study [
23].
Synthetic paper is made of polypropylene, which does not have a fibrous structure but rather a homogeneous, smooth surface. This was confirmed by the previous research where SEM images show that S paper lacks the typical fibrous structure seen in paper-based materials, indicating that it is a non-woven polypropylene sheet, i.e., a synthetic paper without the porosity characteristic of conventional paper [
16]. S paper is a material without a fibrous structure, resulting in smooth surface and different interaction with ink compared to paper substrates.
3.4. Optical Microscopy
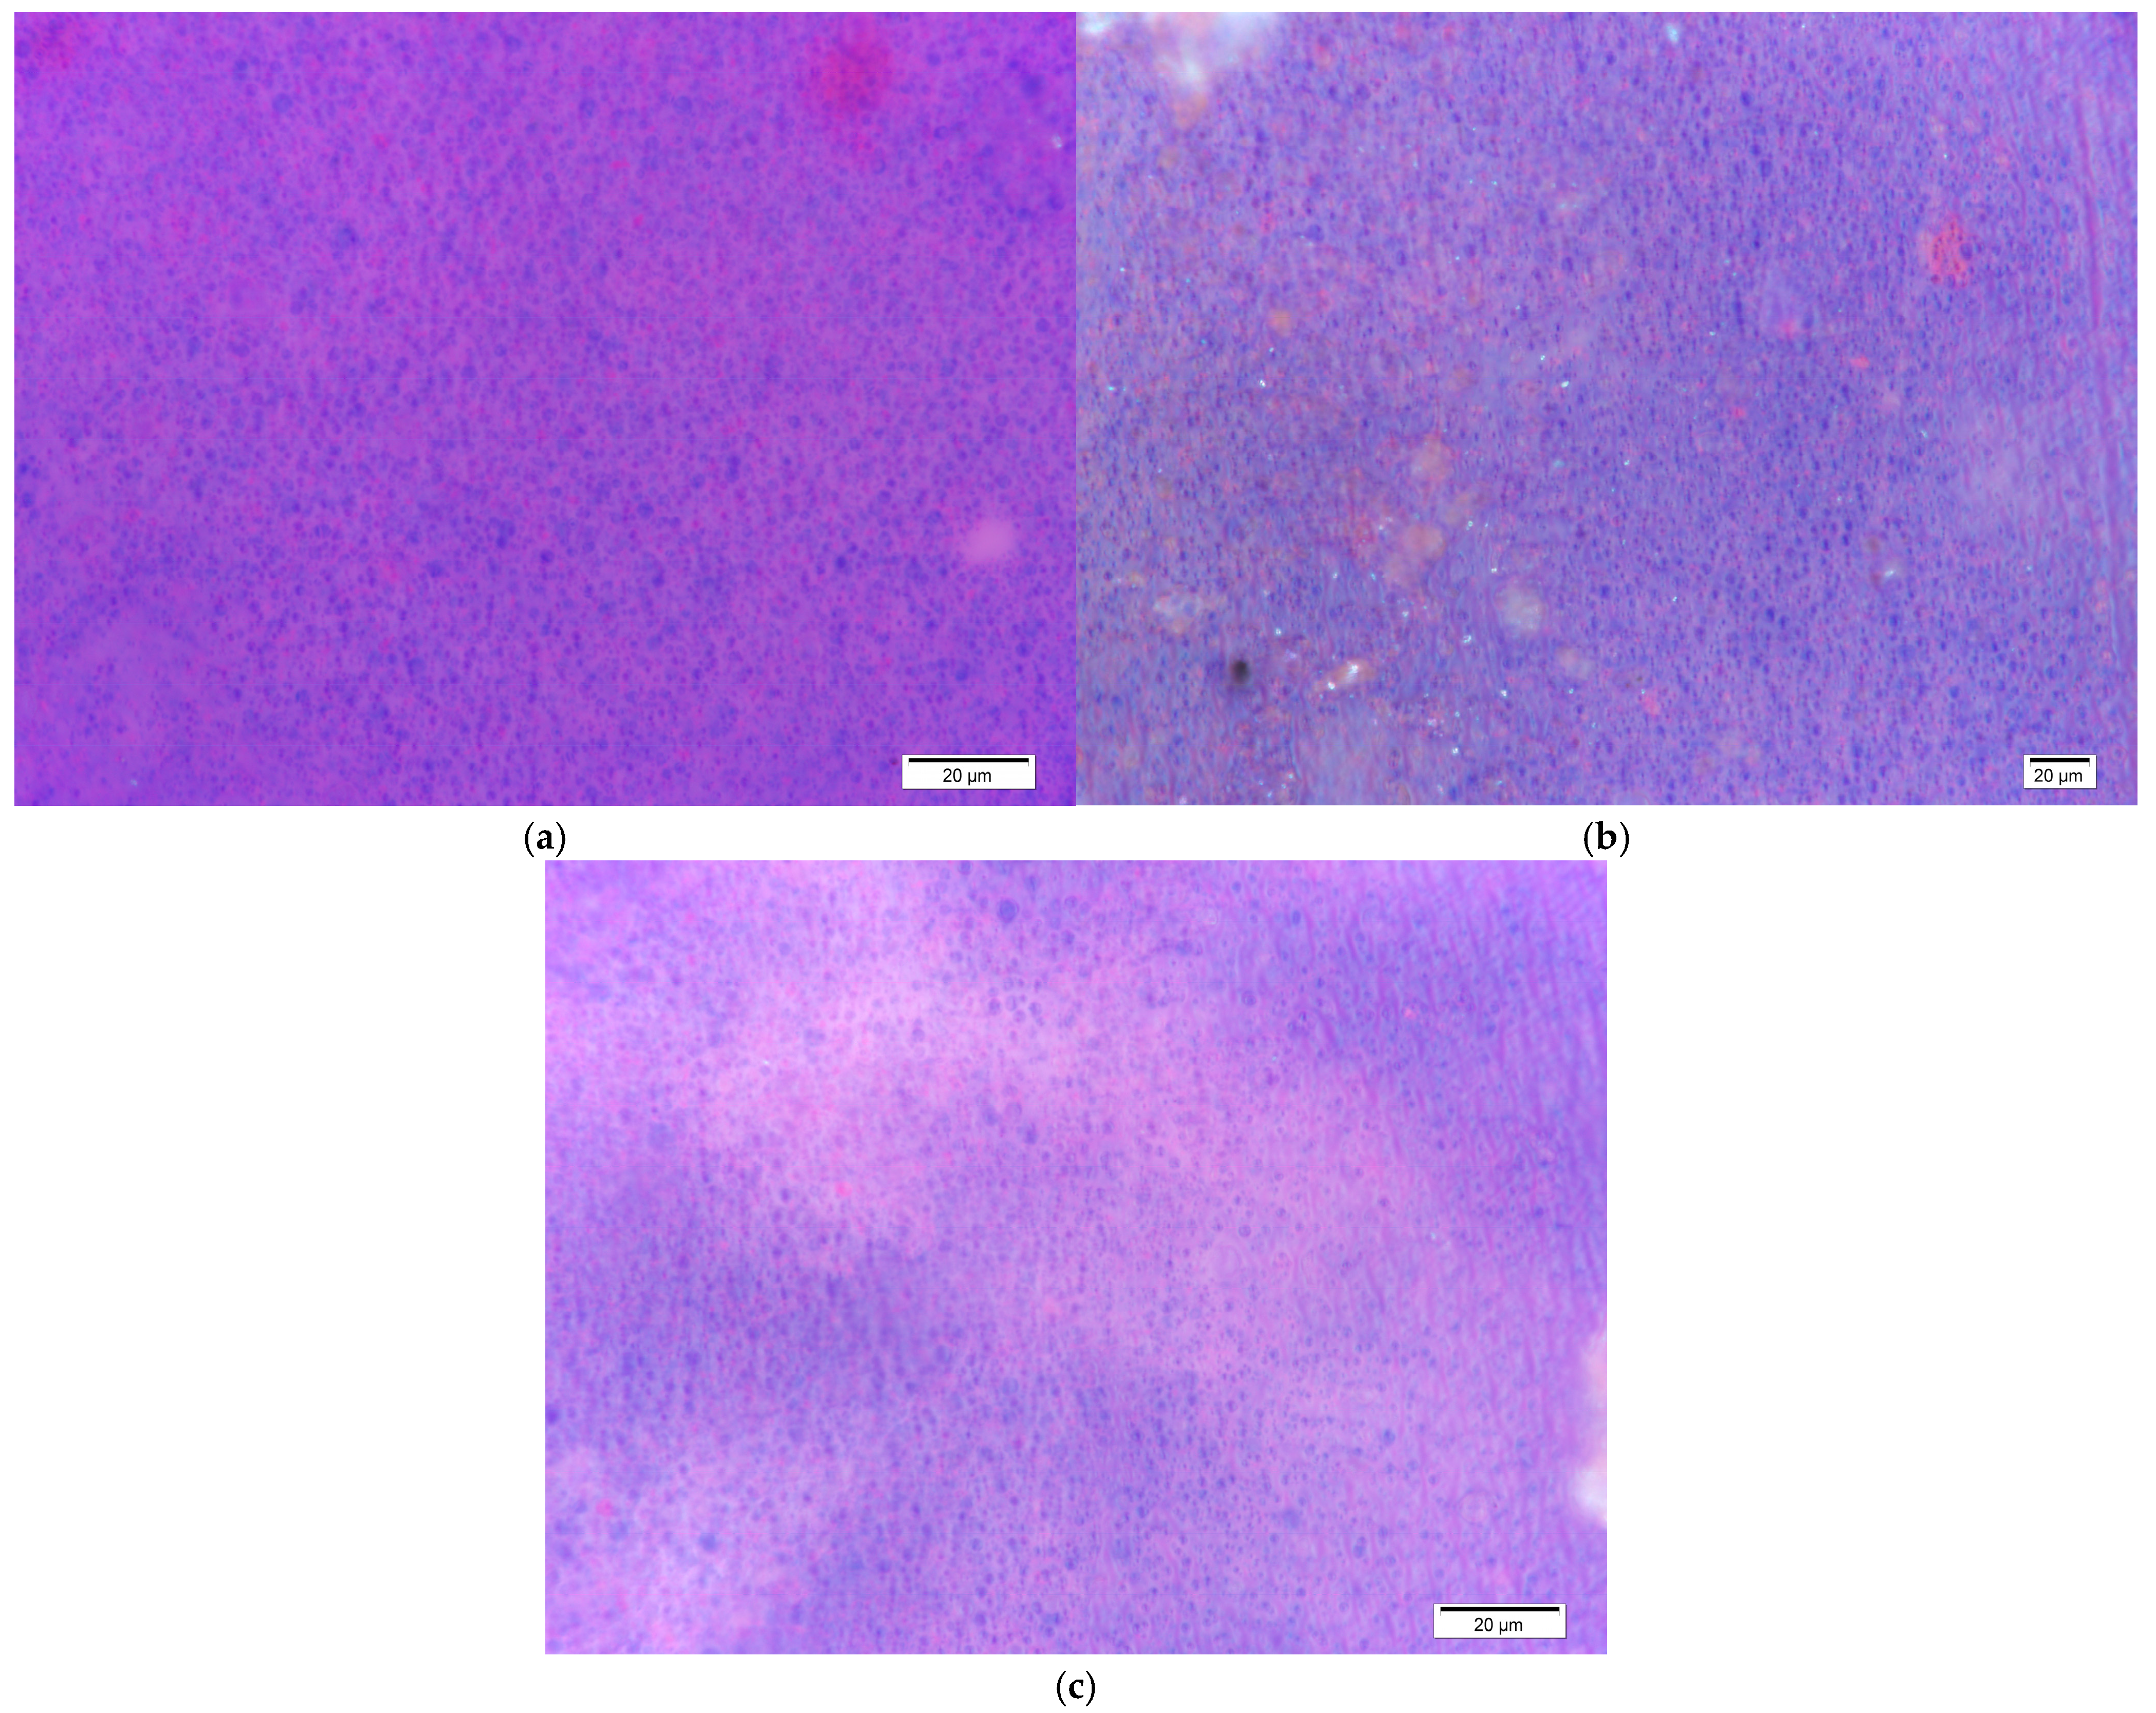
The optical microscope images (
Figure 4) provide visual information on the structure and distribution of the sample components at a microscopic level. The images show small, round, dispersed components throughout the observed samples. These results indicate the presence of small, round pigment particles, in this case, TC pigments, which appear as blue spots. The size of the TC pigments is significantly larger than that of conventional pigments, with a medium particle size of a few micrometers [
19].
It is evident that, in sample S (
Figure 4a), the distribution is homogeneous. In this case, the sample’s surface is entirely covered with a layer of dried TC ink. In the other two samples, shadows are visible, along with differences in brightness, which can be interpreted as ink penetration into the paper structure. These shadows originate from the cellulose fibers.
3.5. Colorimetric Properties
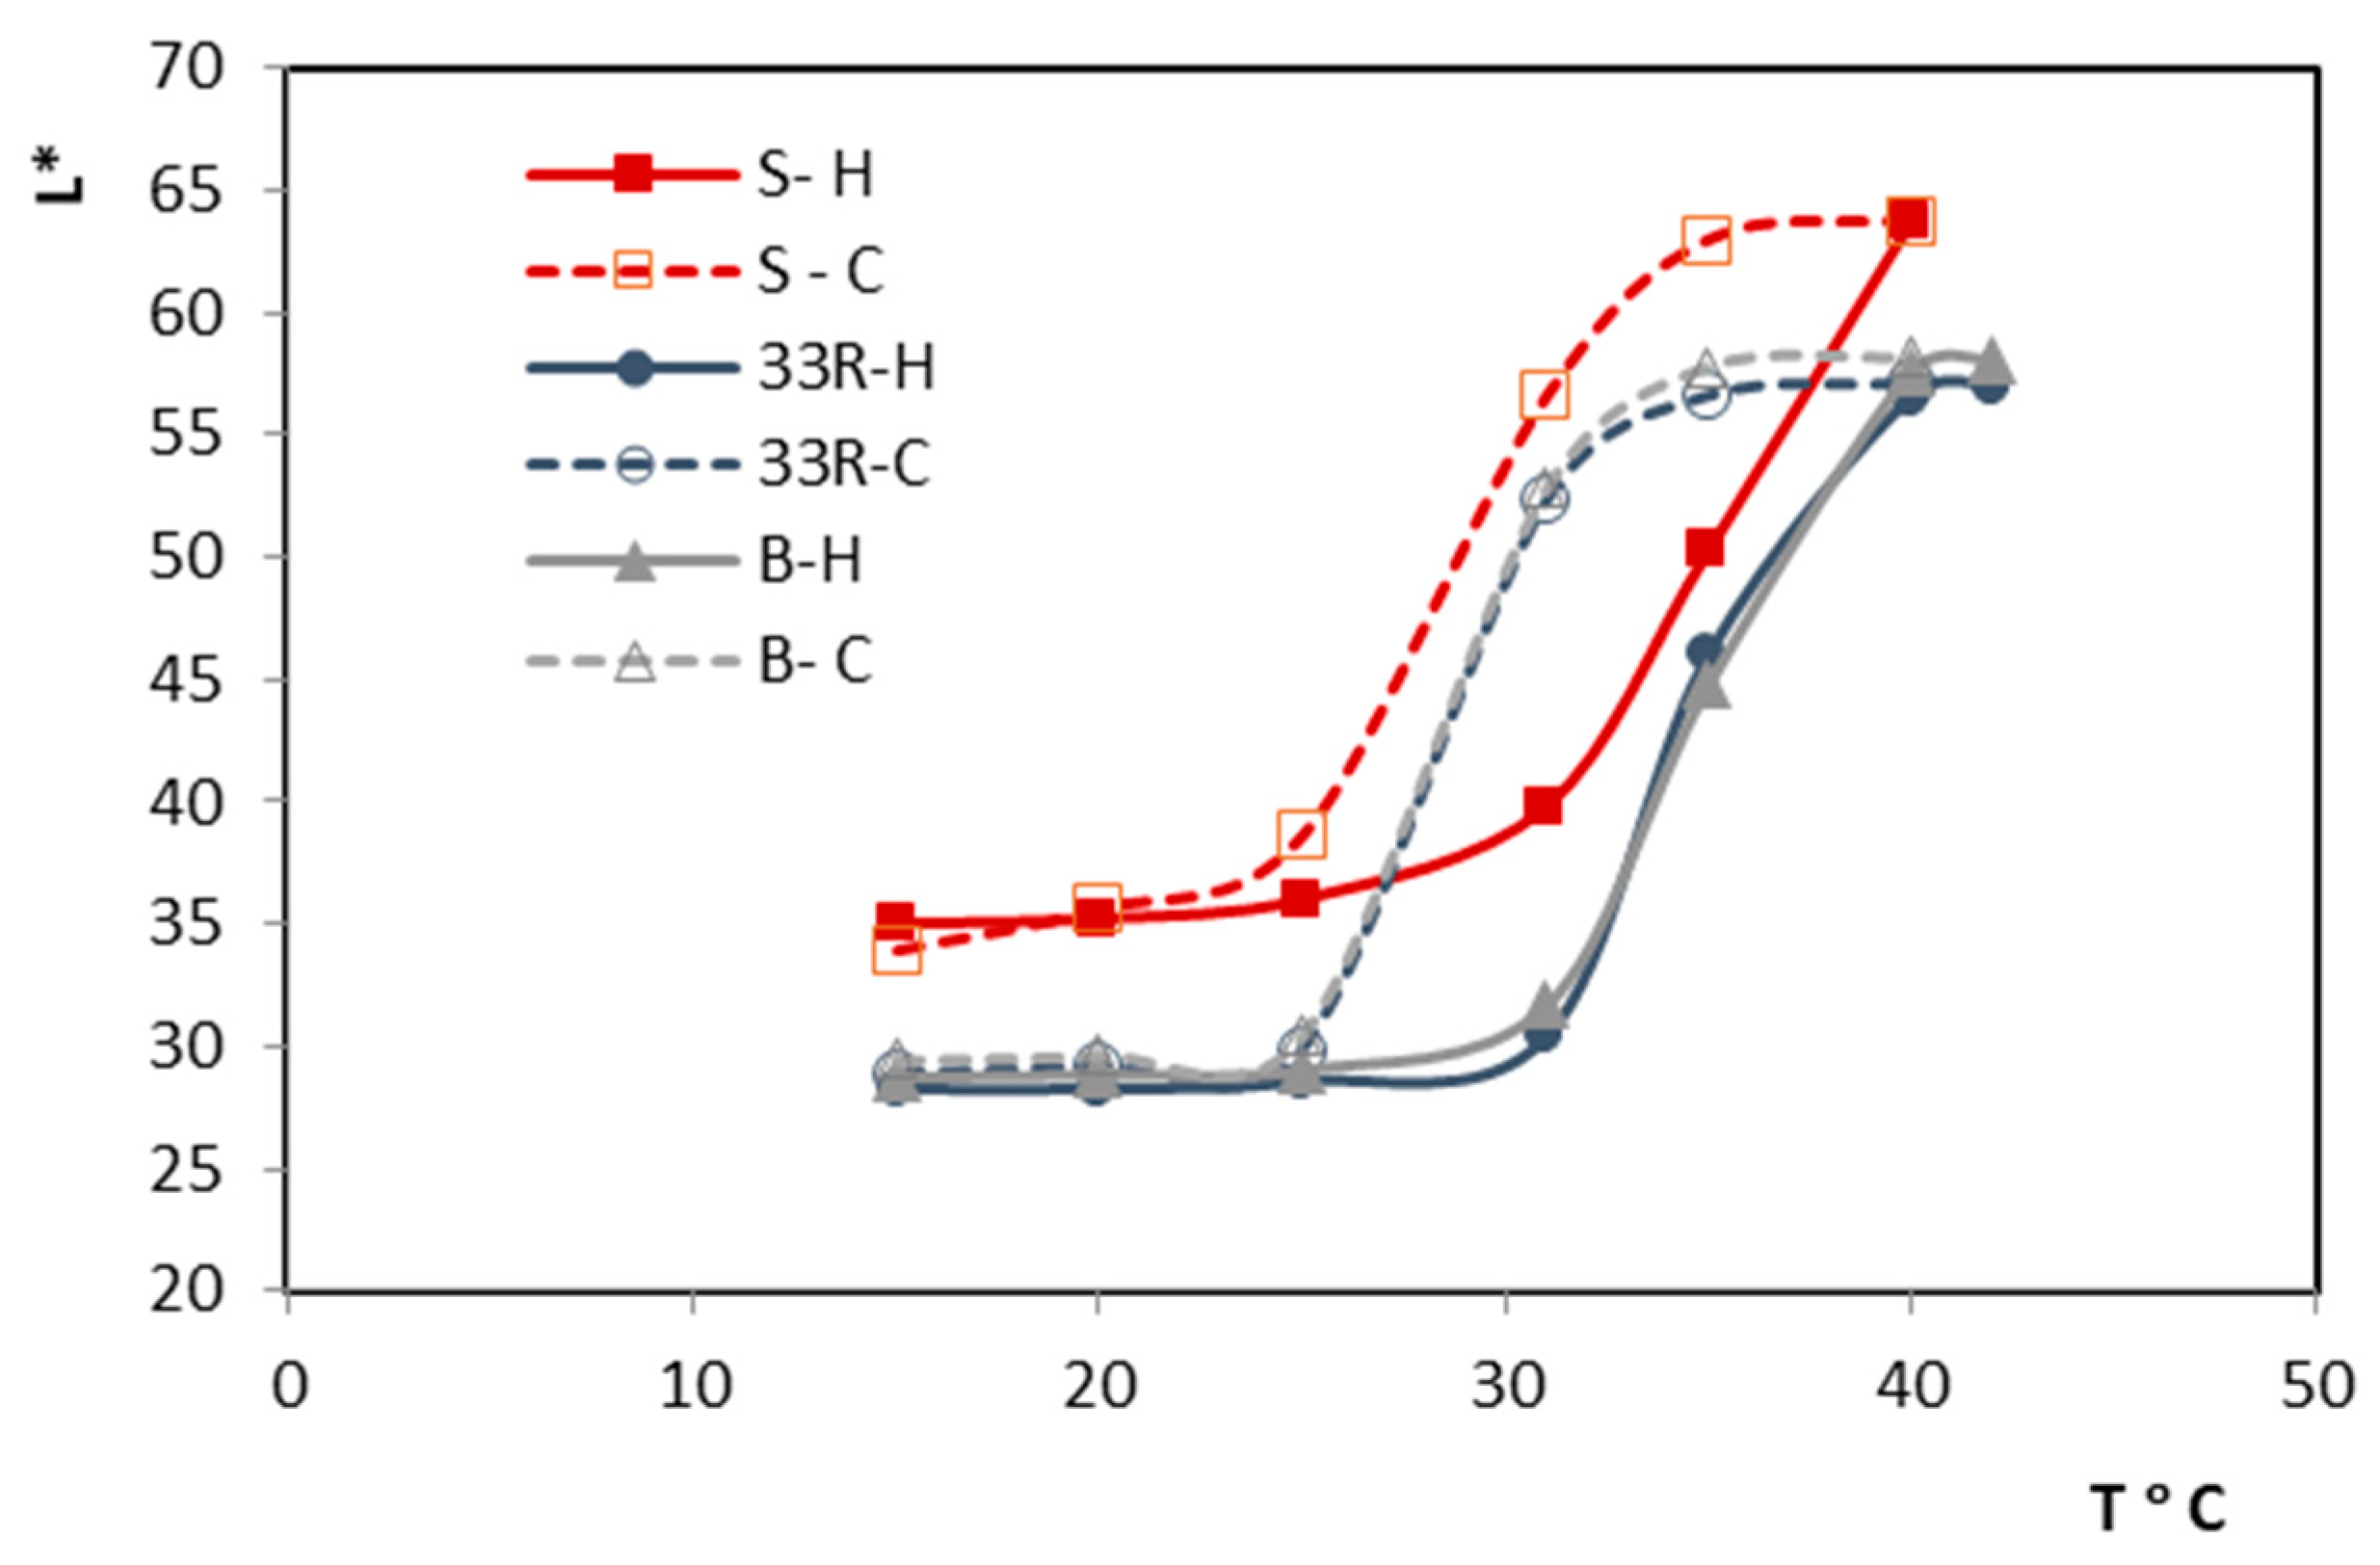
Figure 5 shows the hysteresis of thermochromic ink during heating and cooling process, specifically the changes in lightness (
L*) of the print in relation to temperature (T °C). The temperature-dependent change shows a clear transition to a lighter color when heating, while during cooling, the color returns to darker values, creating a characteristic hysteresis loop. When printed sample is heated above 31 °C, decolorization of blue TC microcapsules occurs. The reverse process occurs during cooling at lower temperatures. The used printing ink contains thermochromic microcapsules that appear blue when the temperature is below 31 °C. These microcapsules, known as TC pigment, are dispersed within a pink colored conventional screen-printing ink that remains pink regardless of the ambient temperature [
23]. As a result, when the TC ink is exposed to temperatures above its activation threshold (31 °C), the printed color shifts from purple to pink. As can be seen from
Figure 5, sample S shows the higher value of lightness, through the whole measuring cycle which indicates a lighter color tone. This can be attributed to the higher amount of binder on the paper surface, which covers the TC pigment. The prints on recycled and bulky paper show similar behavior, i.e., similar hysteresis. The coloration of the UV prints in this particular case is also influenced by the ink binder penetration into the structure of paper. It is important to emphasize that the ink layer was sufficiently thick (
Table 2) to mask any potential influence of the printing substrate color, ensuring that the final print coloration was primarily determined by the color of the ink and not the color of the paper substrate.
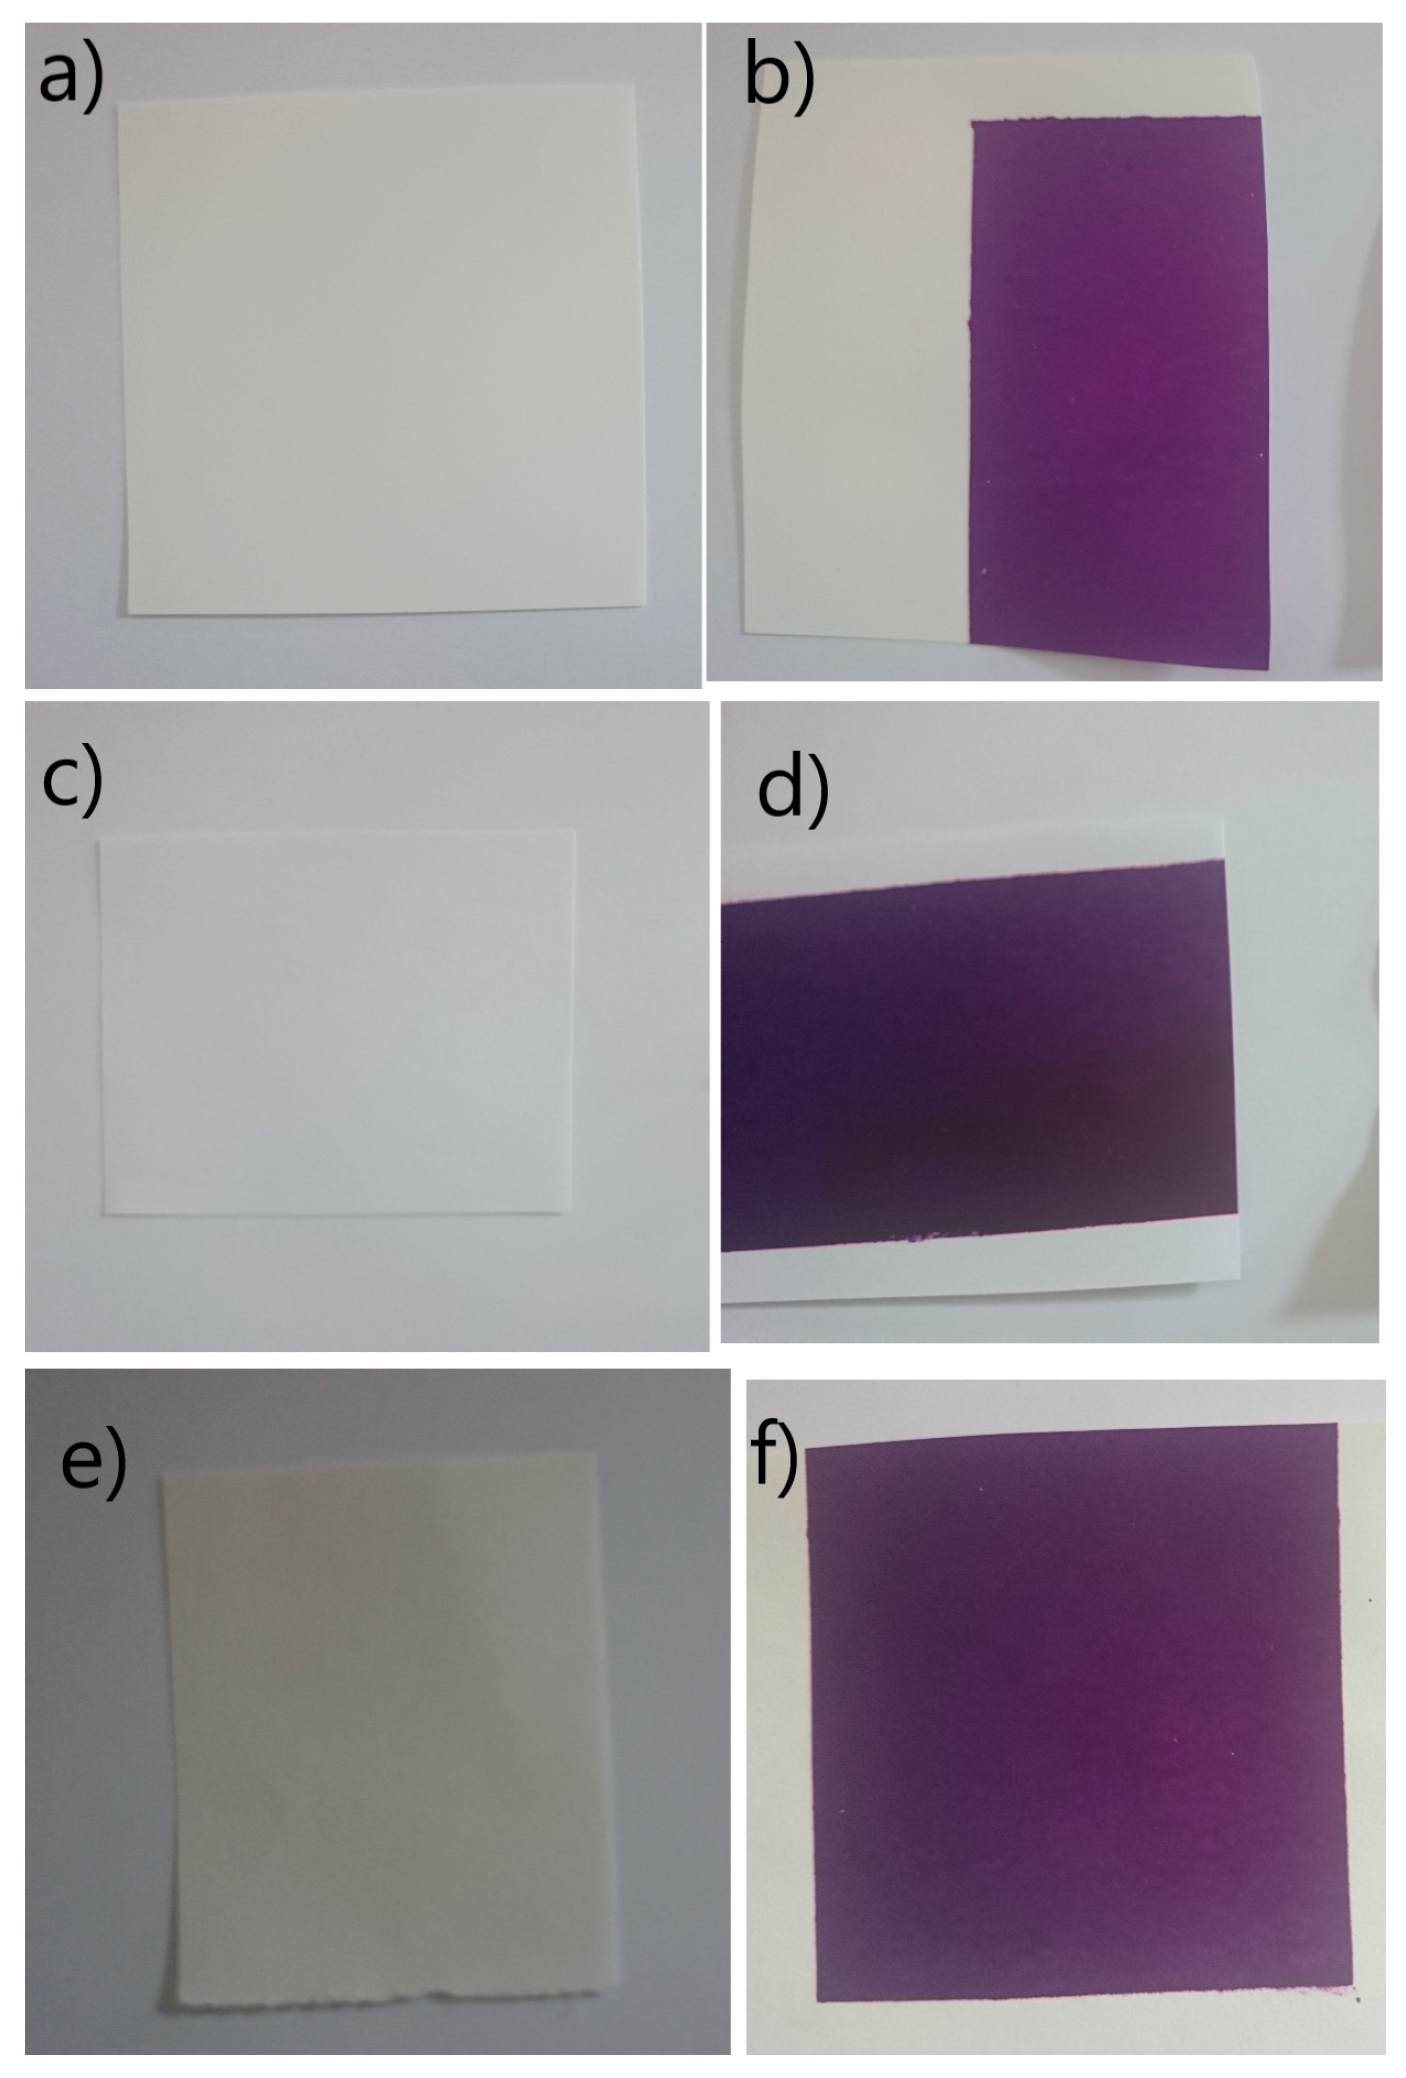
The visual appearance of the papers and the prints shows that synthetic paper (
Figure 6a) displays a smooth, uniform surface, and the printed area exhibits consistent ink coverage (
Figure 6b), indicating low absorbency and high surface smoothness. The recycled paper (
Figure 6c) has a slightly rougher texture, and the print reveals uneven ink distribution (
Figure 6d), with a visible gradient that suggests variable ink absorption. The bulky paper (
Figure 6e) appears thicker and more porous, with a warmer white tone. The print (
Figure 6f) on this substrate shows relatively even coverage, although subtle differences in ink density may be observed due to its higher absorbency. These visual differences highlight how paper composition and surface properties influence the appearance and quality of the printed image.
Both porosity and surface-free energy (SFE) significantly affect ink adhesion, but they act through different mechanisms. Surface-free energy plays a more direct role, as it governs the wettability of the substrate and facilitates physical and, in some cases, chemical bonding of the ink. This parameter is particularly relevant for non-absorbent or synthetic materials. In contrast, porosity primarily influences ink absorption and mechanical anchoring, which is crucial for absorbent substrates such as uncoated papers. However, excessive porosity may reduce surface ink coverage and color intensity.
4. Conclusions
The adhesion of printing ink, particularly UV screen-printing ink, to different paper substrates is a complex process influenced by both the physical properties of the paper and the chemical composition of the printing ink. In the case of UV-curable TC print on synthetic paper, the TC microcapsules are covered by a thicker polymer resin layer, which makes them less visible and leads to a more uniform and stable ink film. This in addition, leads to changes in coloration of print where lighter color is observed. Synthetic paper is a polymer, with no absorption capability. This prevents excessive interaction between the ink and the substrate, resulting in relatively lower adhesion values. In contrast, when UV-curable TC printing ink is applied to bulky and recycled paper, which are characterized by their porous structure, the interaction between the ink, and the paper becomes more dynamic. The polymer resin in UV ink can penetrate the pores of the paper, facilitating a stronger bond between the ink and the paper fibers. This penetration influences the overall adhesion quality. The surface roughness of printing substrates significantly affects ink adhesion as well. Rough surfaces increase the surface contact between the ink and paper, improving mechanical adhesion by allowing the ink to better “lock” into the pores and irregularities. This can lead to stronger ink bonding to the paper, especially on porous surfaces. According to adhesion theories, the contact between two surfaces is governed by molecular interactions, such as van der Waals forces, hydrogen bonding, and mechanical interlocking. In porous papers, the rough surface and internal porosity can enhance mechanical bonding, allowing the ink to physically embed itself into the paper matrix. Furthermore, the minimum surface energy (SFE) of the interphase between bulky paper and UV print plays a significant role in determining the extent of ink absorption. A low SFE at the interphase indicates that the paper allows better wetting and bonding of the ink, leading to improved absorption of the binder into the paper structure. In adhesion theory, the closely the ink and paper molecules interact, the stronger the adhesion, as the adhesive forces overcome the cohesive forces of the ink. Therefore, the ink’s ability to penetrate into the paper structure also contributes to the durability and long-term performance of the print. The results indicate that ink penetration into the paper structure is a critical factor that directly affects the quality of adhesion. Understanding the interaction between ink components and paper fibers is essential for optimizing printing processes, especially when working with porous printing substrates. By controlling variables such as surface energy and resin composition, better adhesion and more durable prints can be achieved.


