
Synthesis and Characterisation of 4D-Printed NVCL-co-DEGDA Resin Using Stereolithography 3D Printing

 , ,
, ,  , ,
, ,
Abstract
1. Introduction
2. Materials and Methods
2.1. Materials
2.2. Preparation of NVCL-co-DEGDA Resin
2.3. Attenuated Total Reflectance–Fourier Transform Infrared Spectroscopy
2.4. Differential Scanning Calorimetry
2.5. Pulsatile Swelling Studies
2.6. Gel Fraction
2.7. Goniometry
2.8. Recrystallisation Test
3. Results
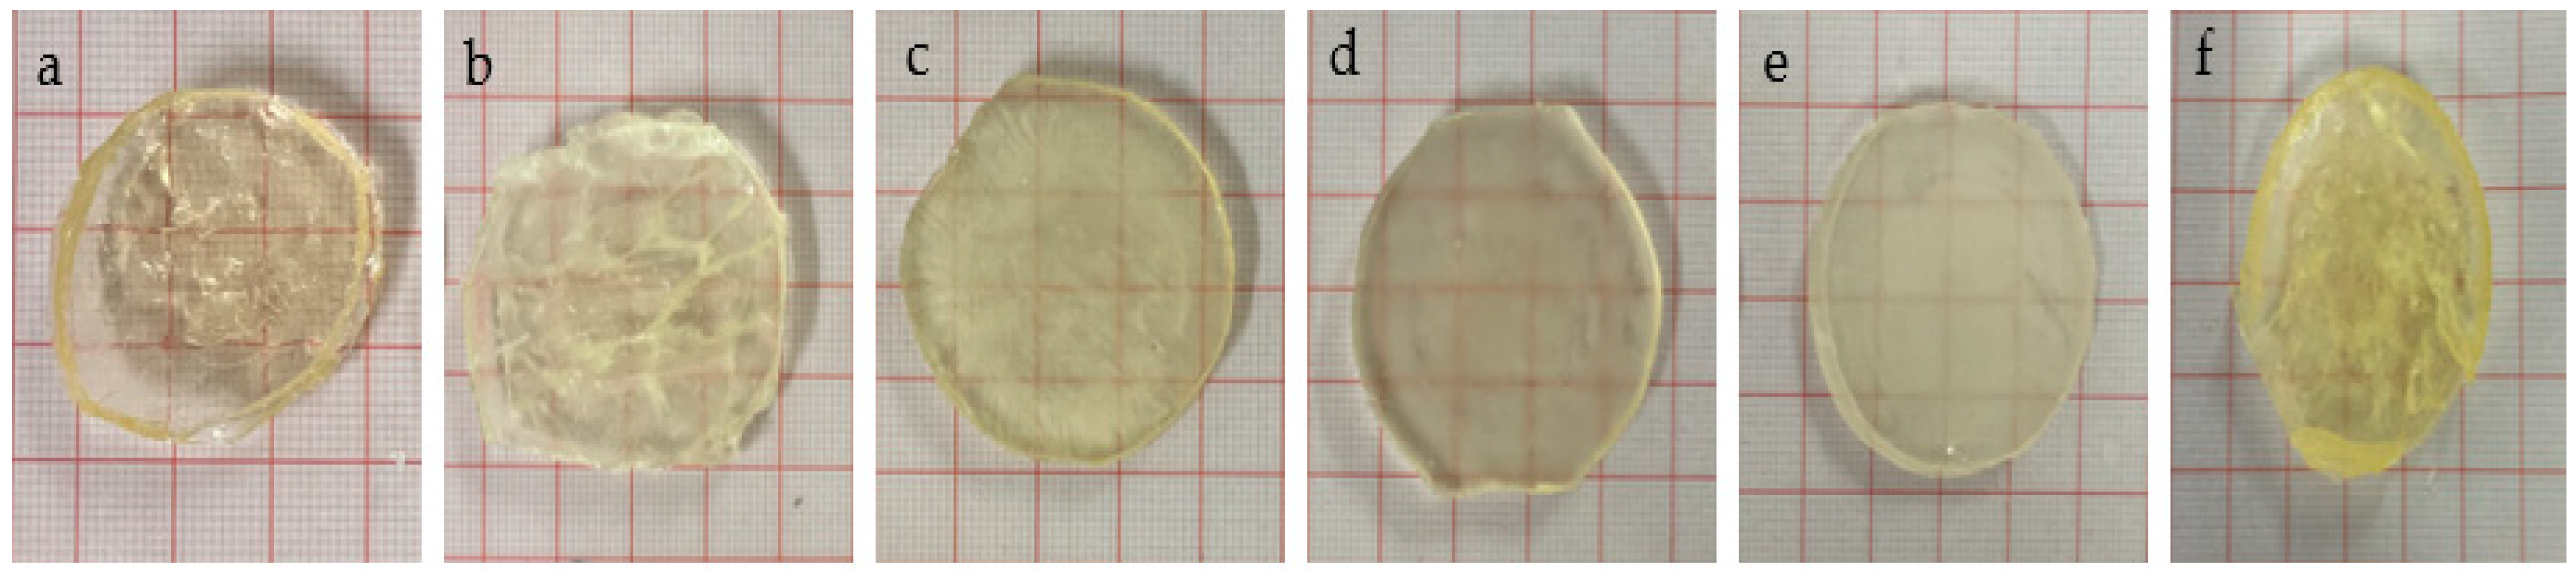
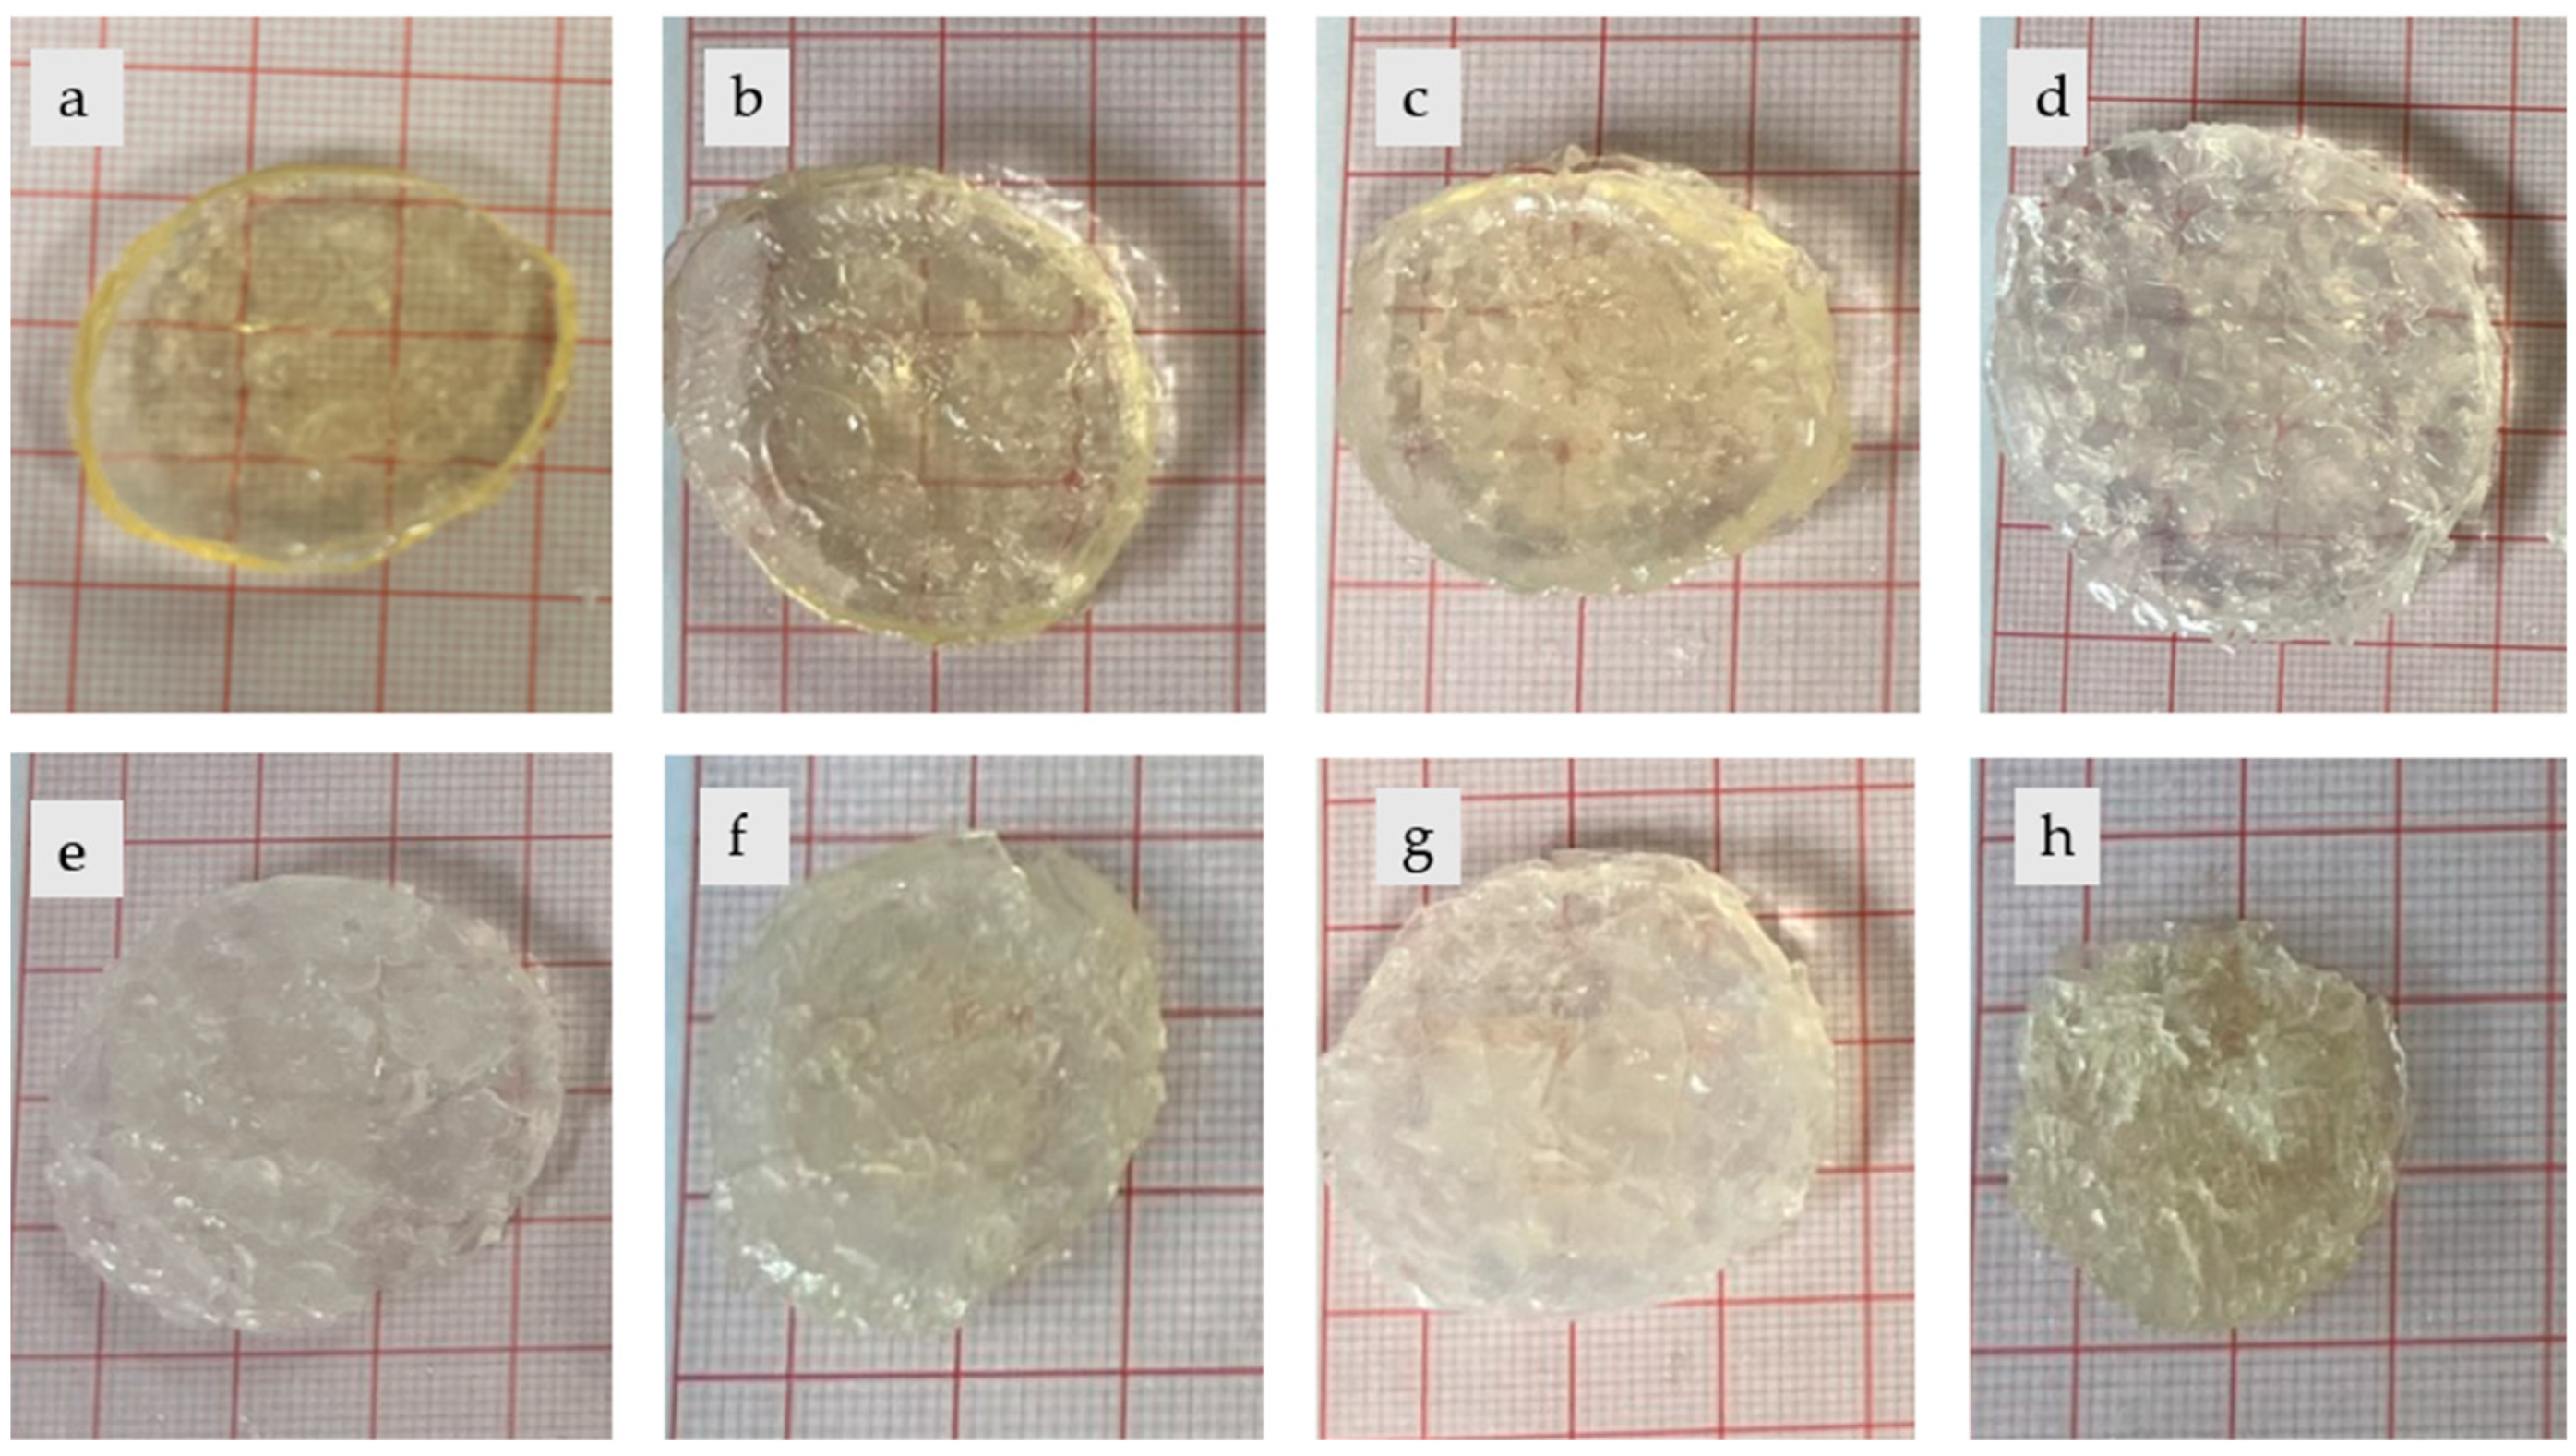
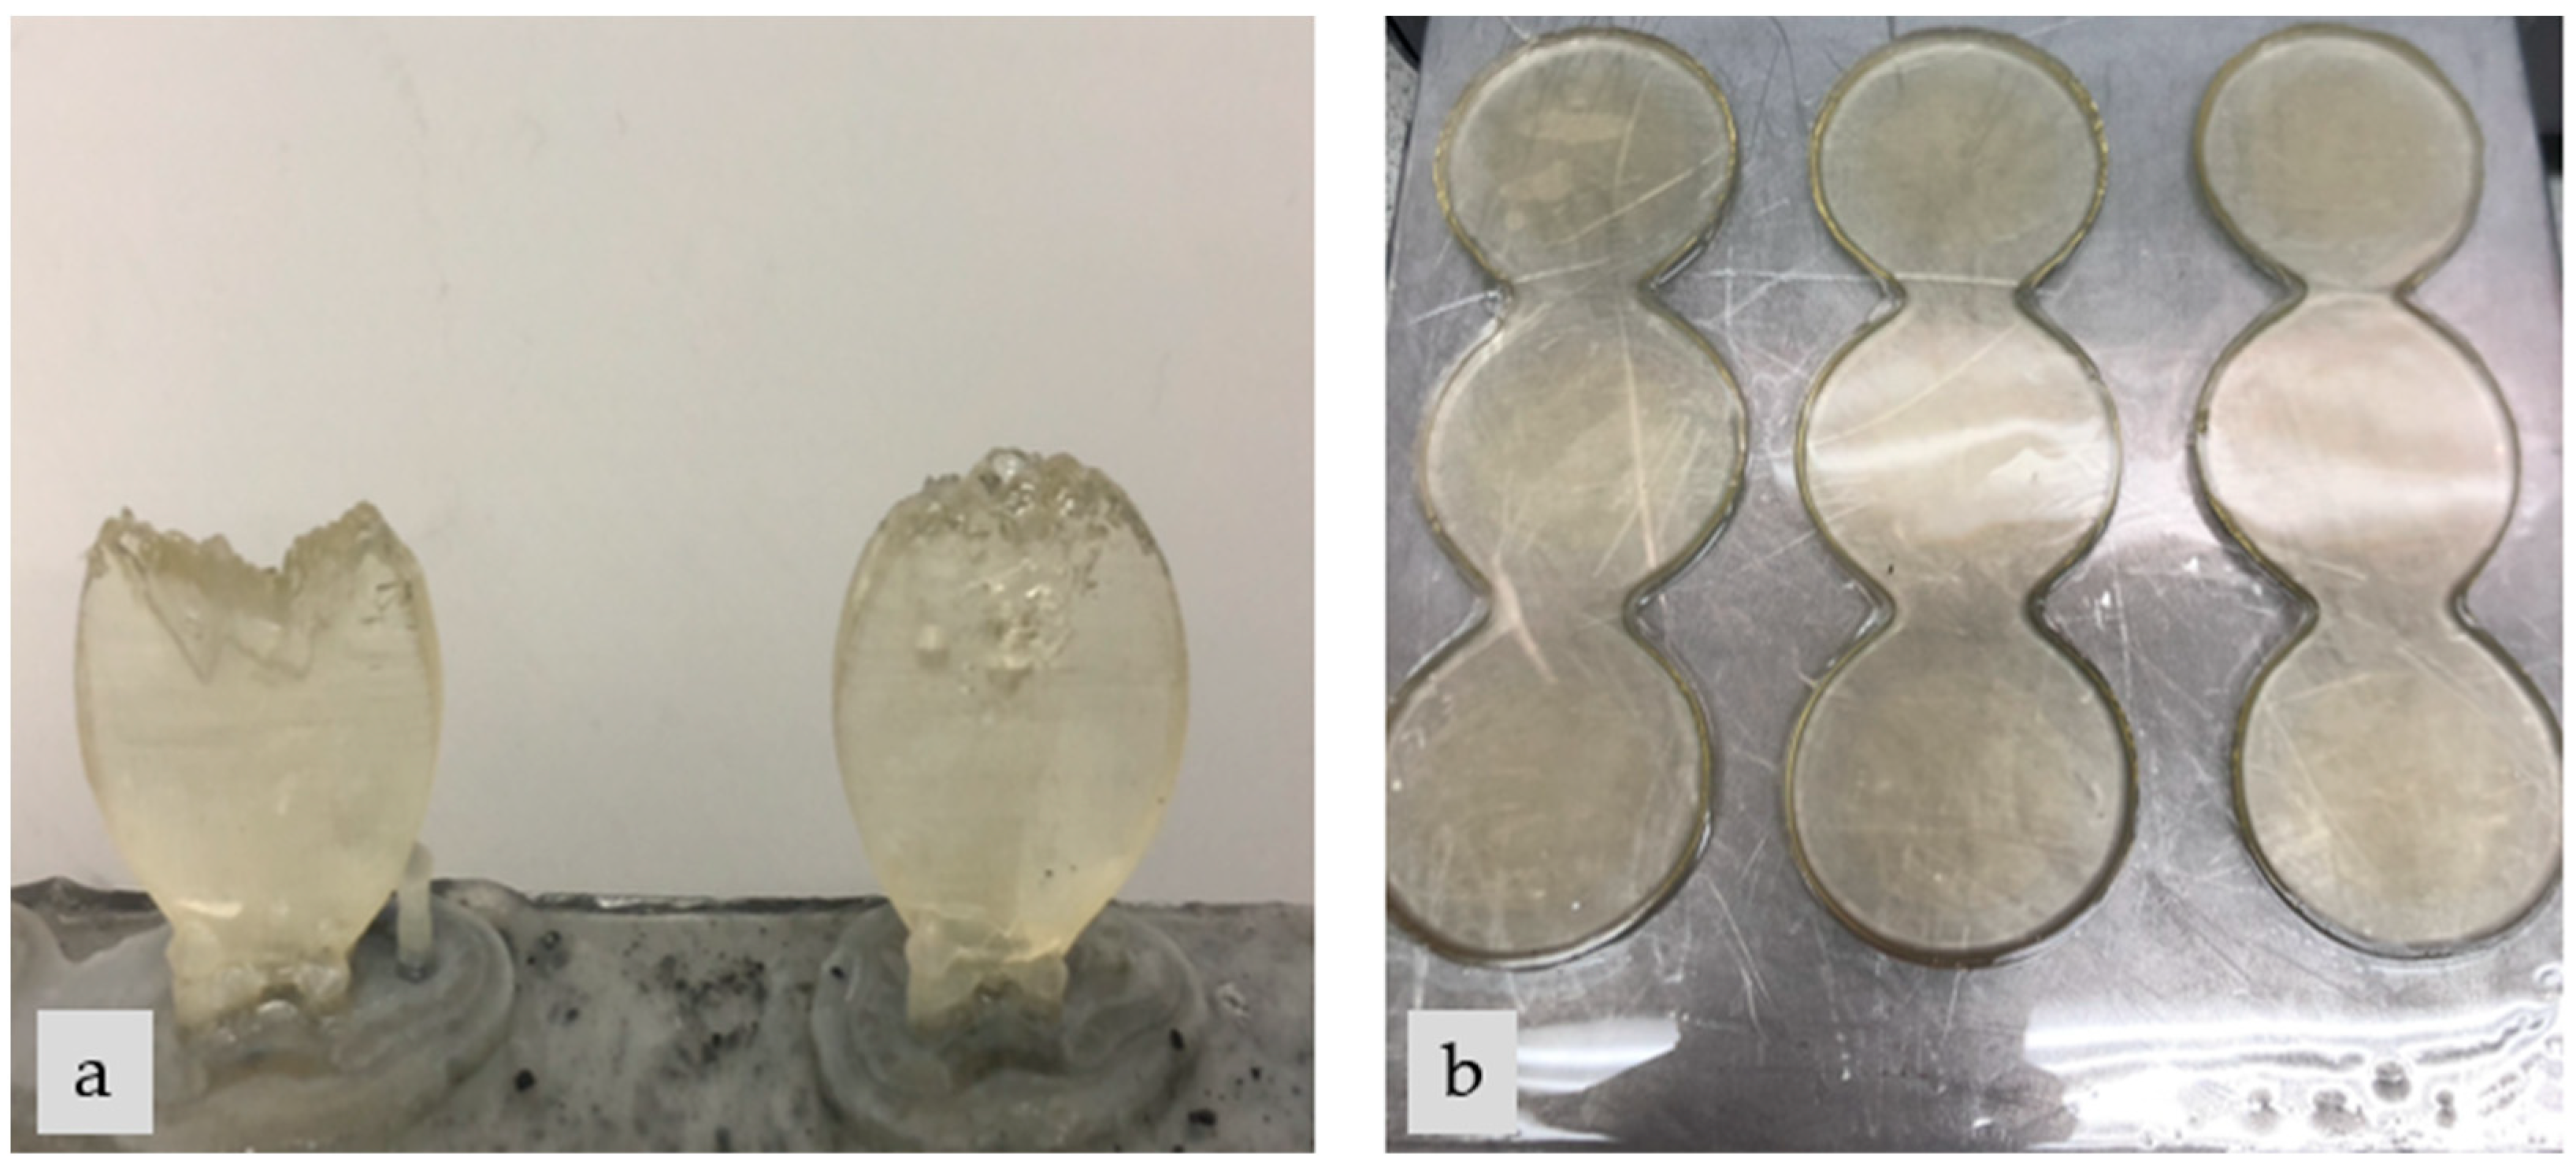
3.1. Preparation of NVCL-co-DEGDA Resin
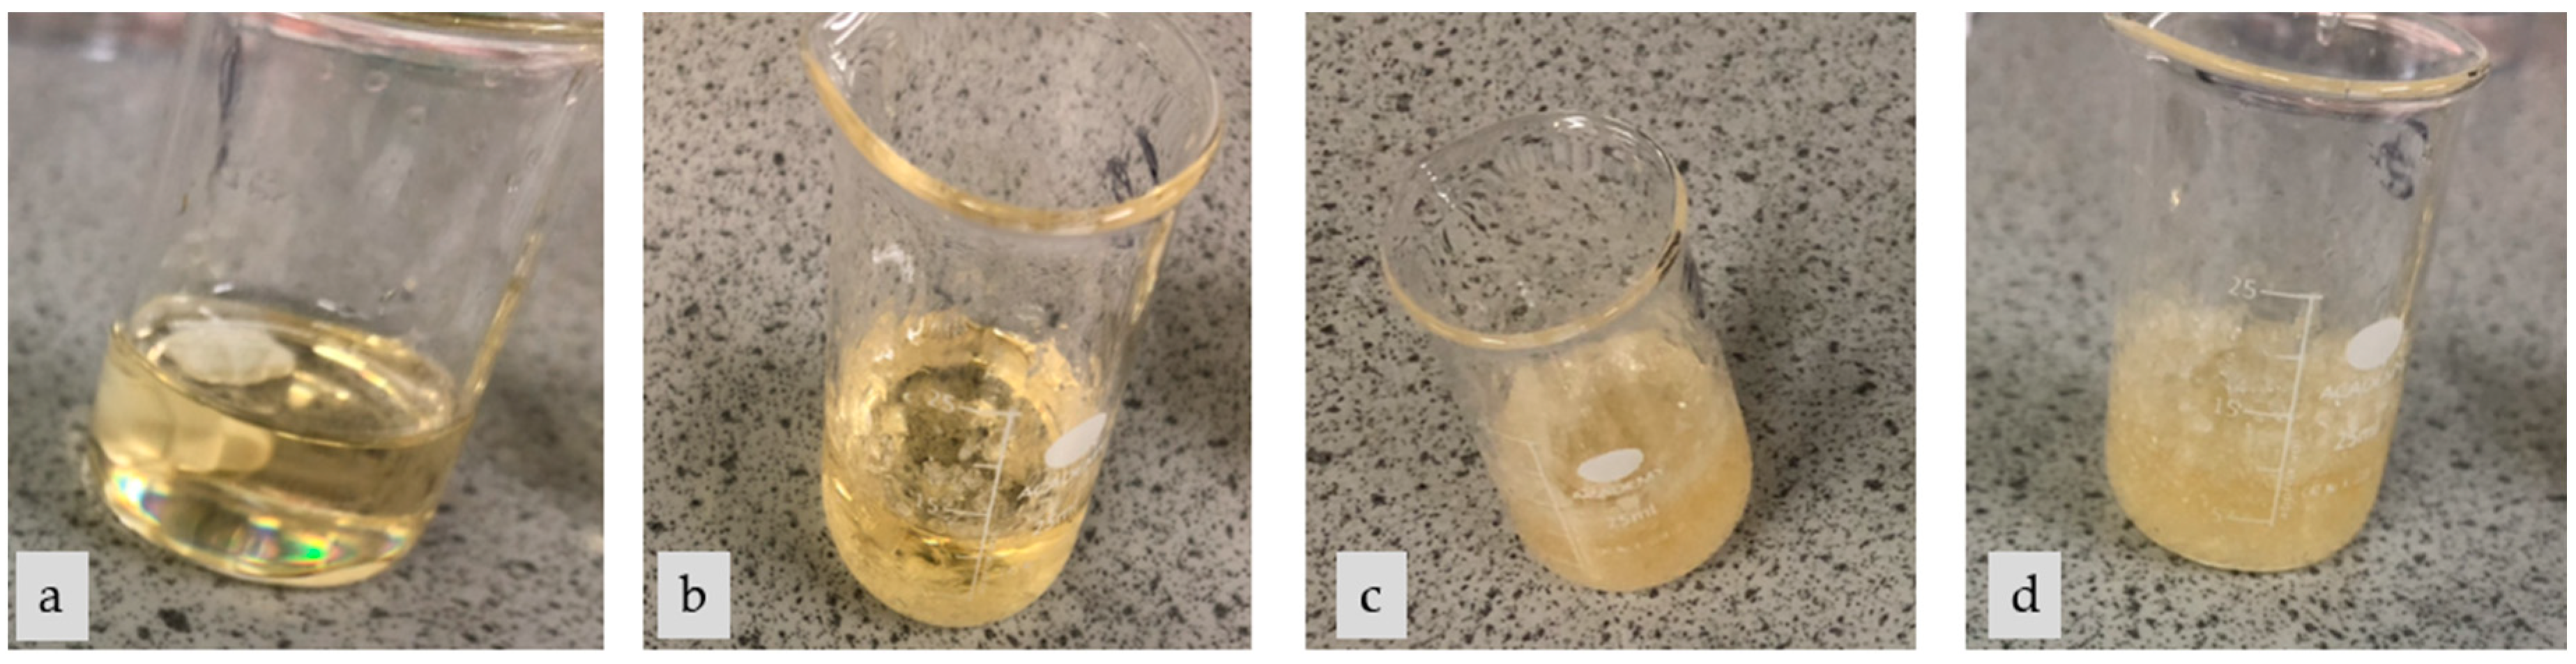
3.2. Recrystallisation Test
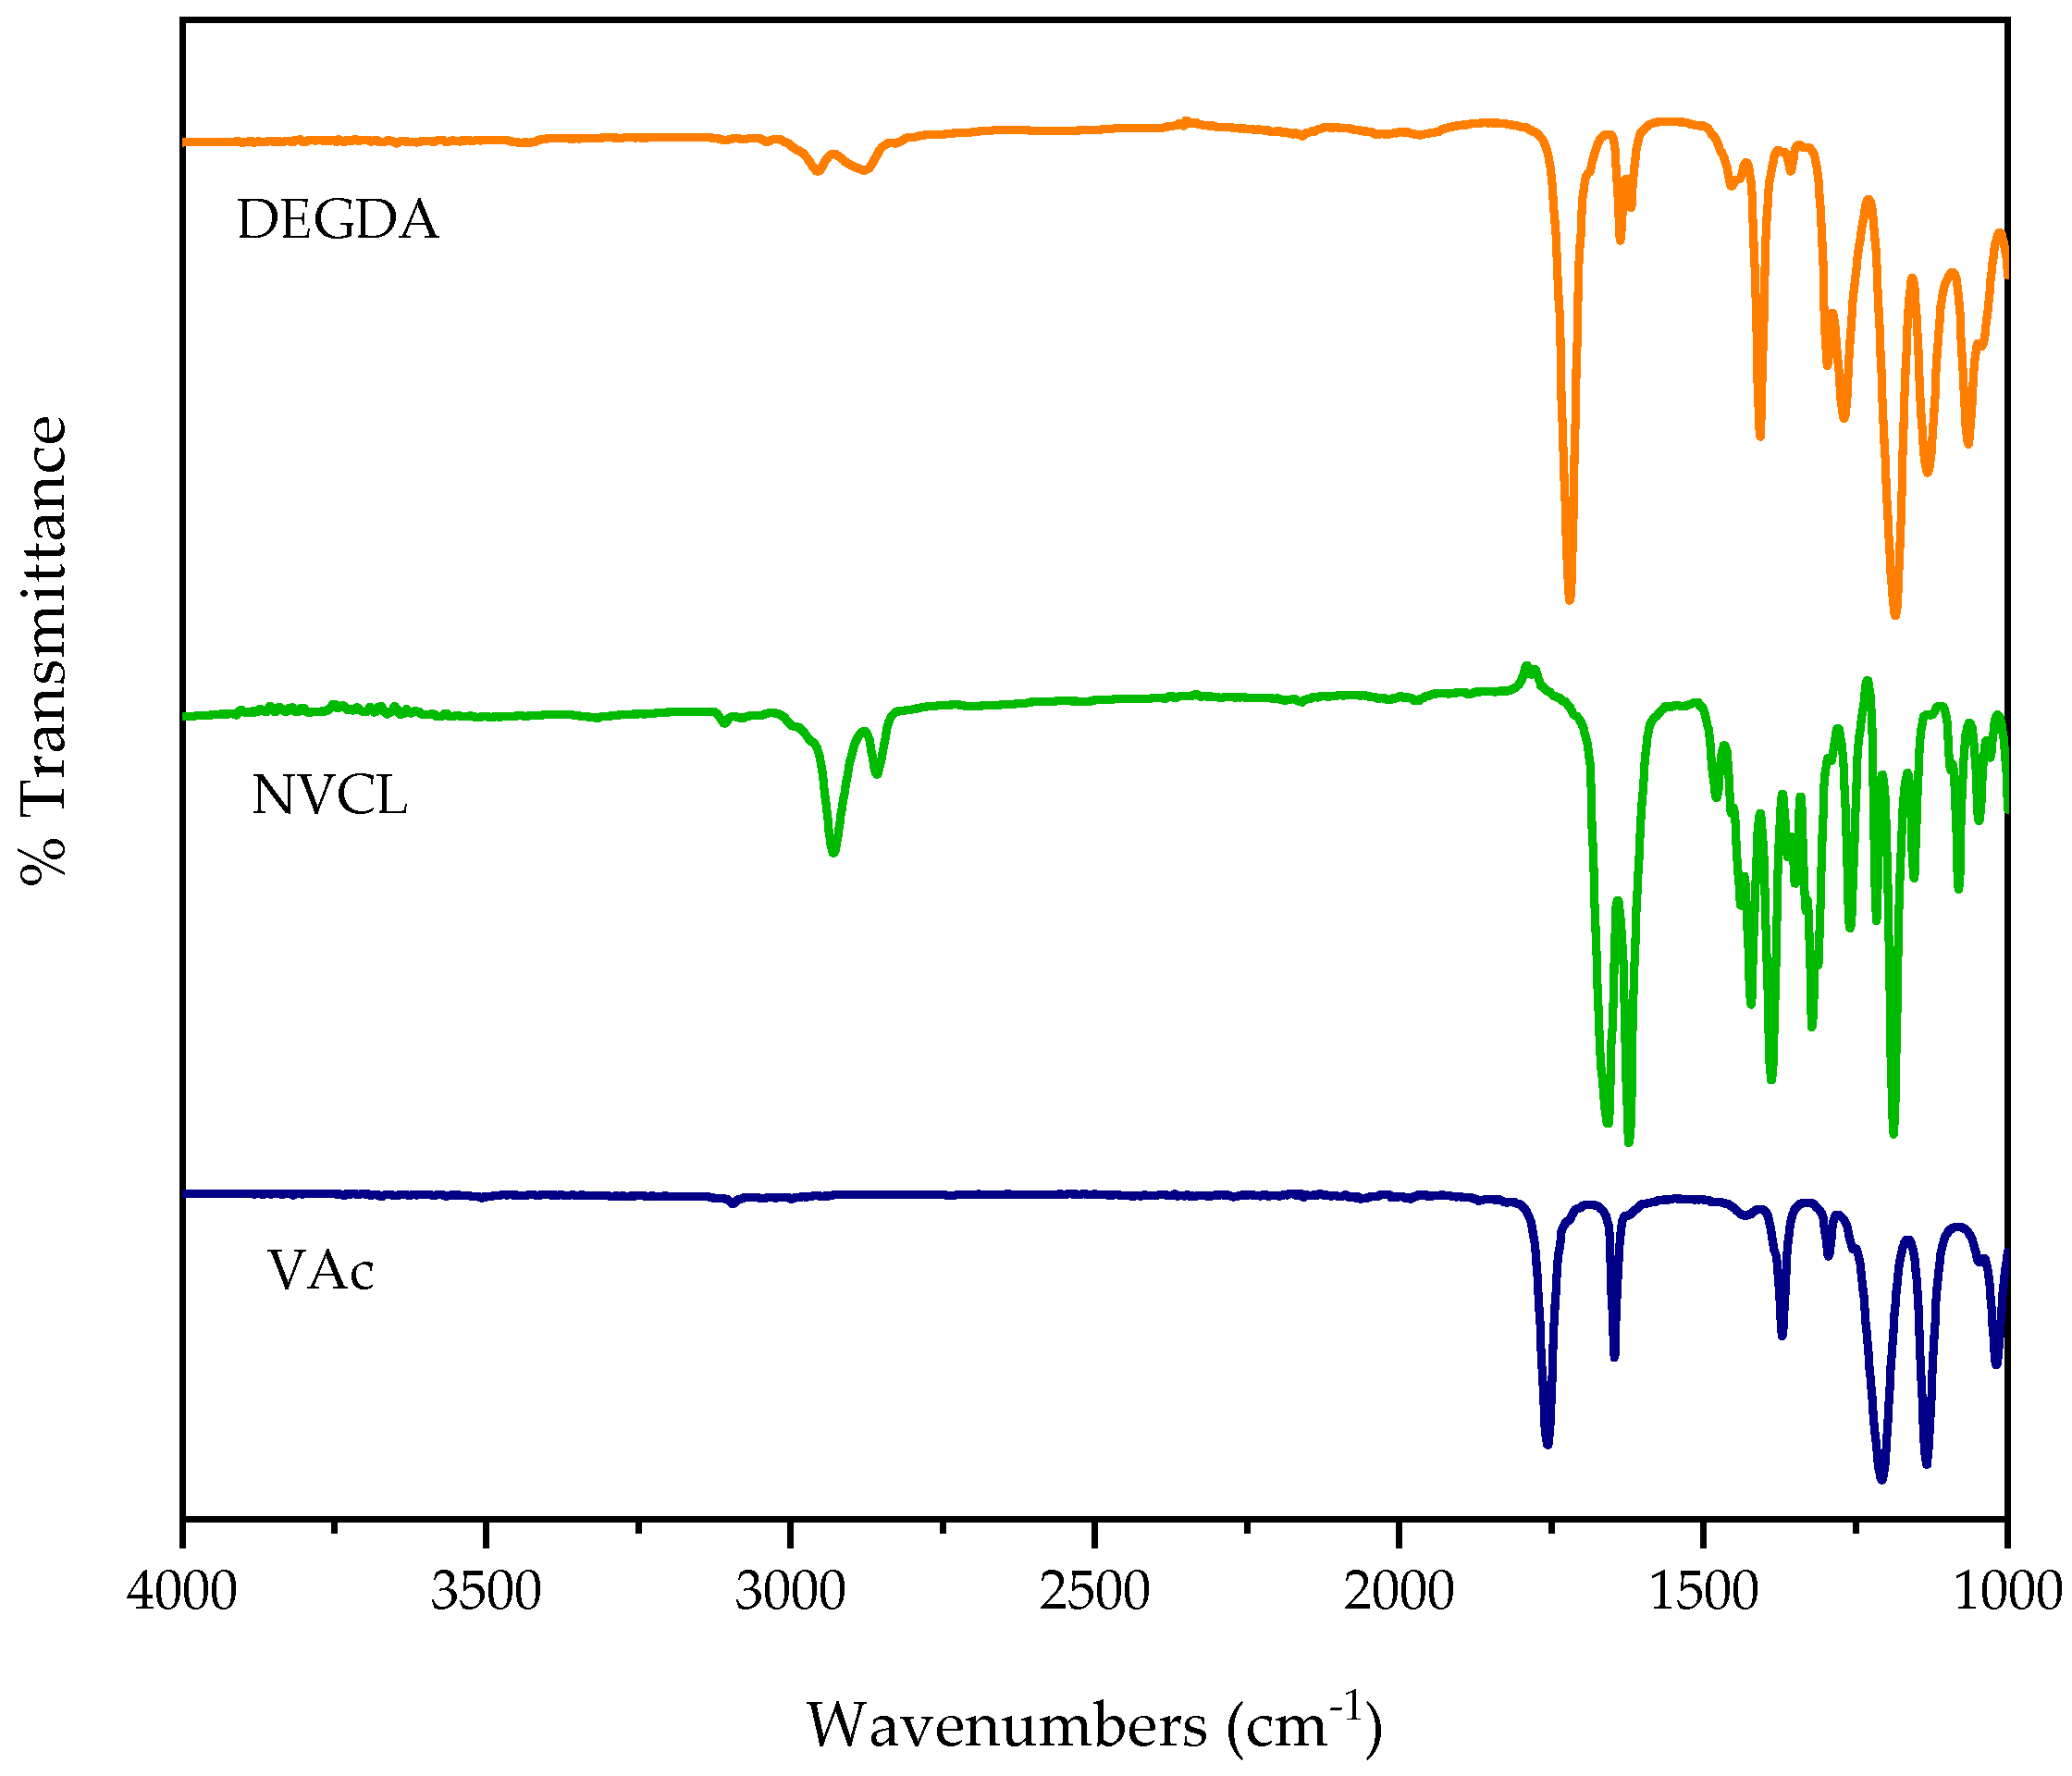
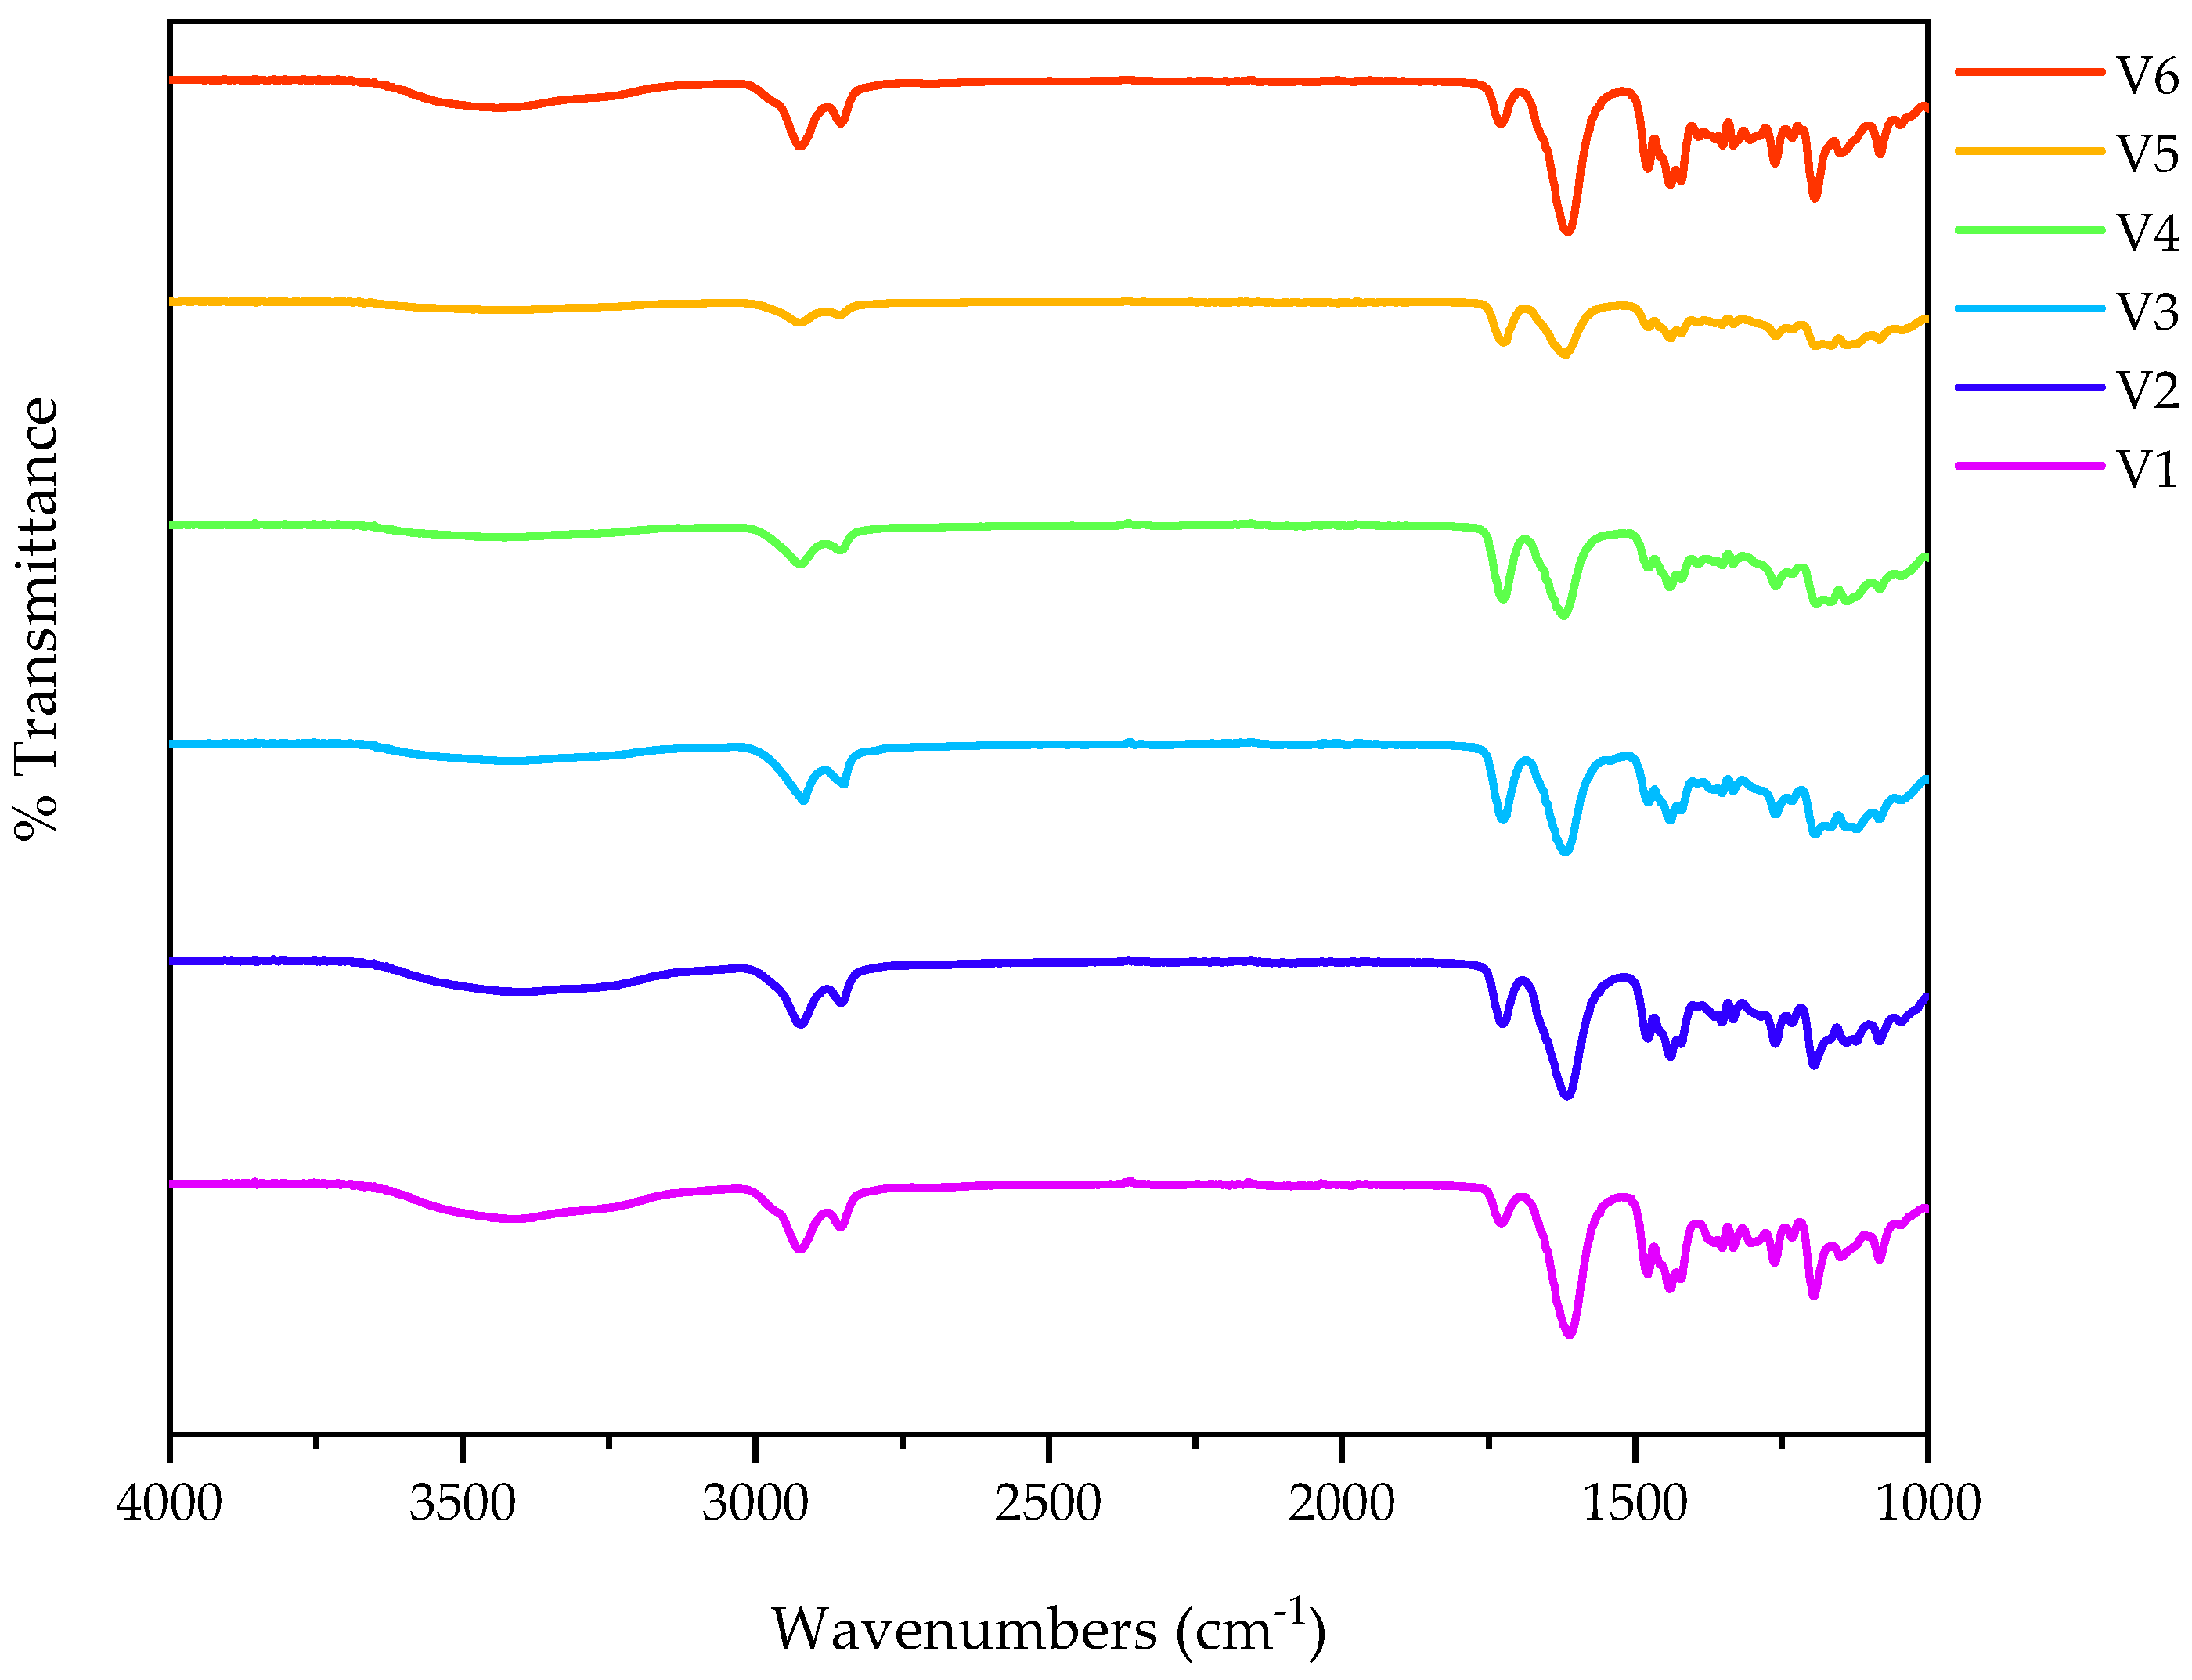
3.3. Attenuated Total Reflectance Fourier Transform Infrared Spectroscopy
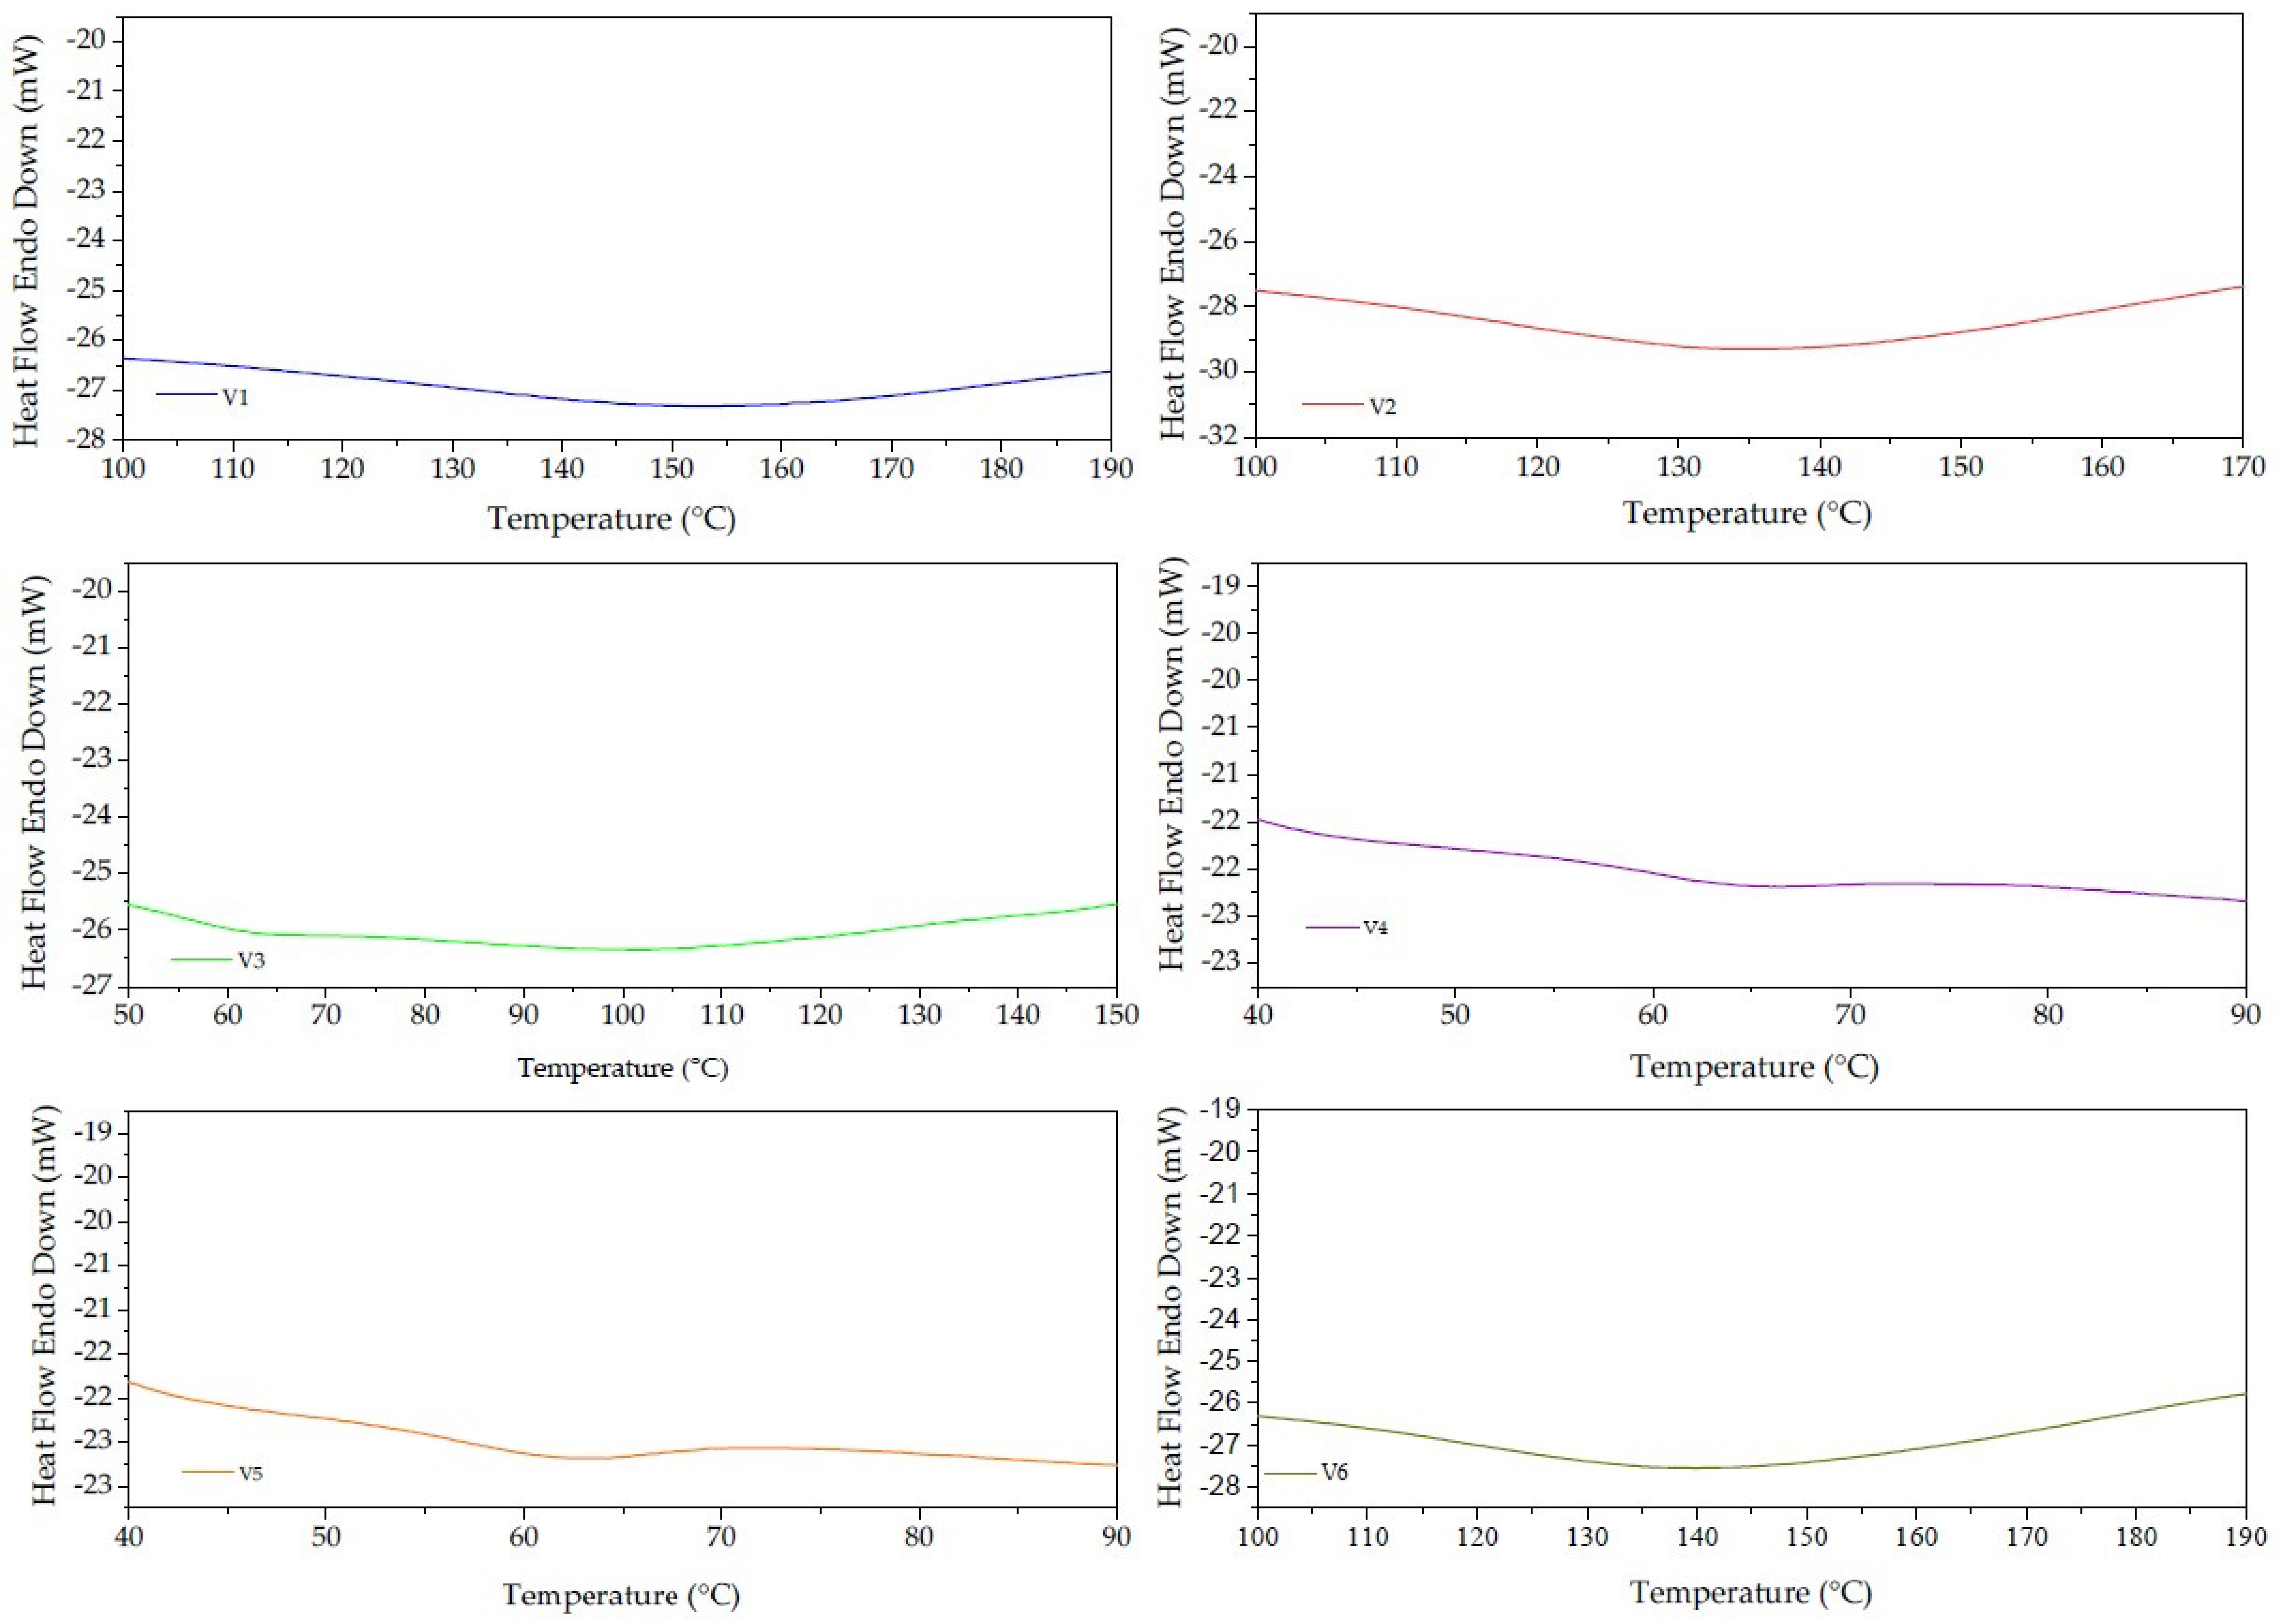
3.4. Differential Scanning Calorimetry
3.5. Pulstatile Swelling Studies
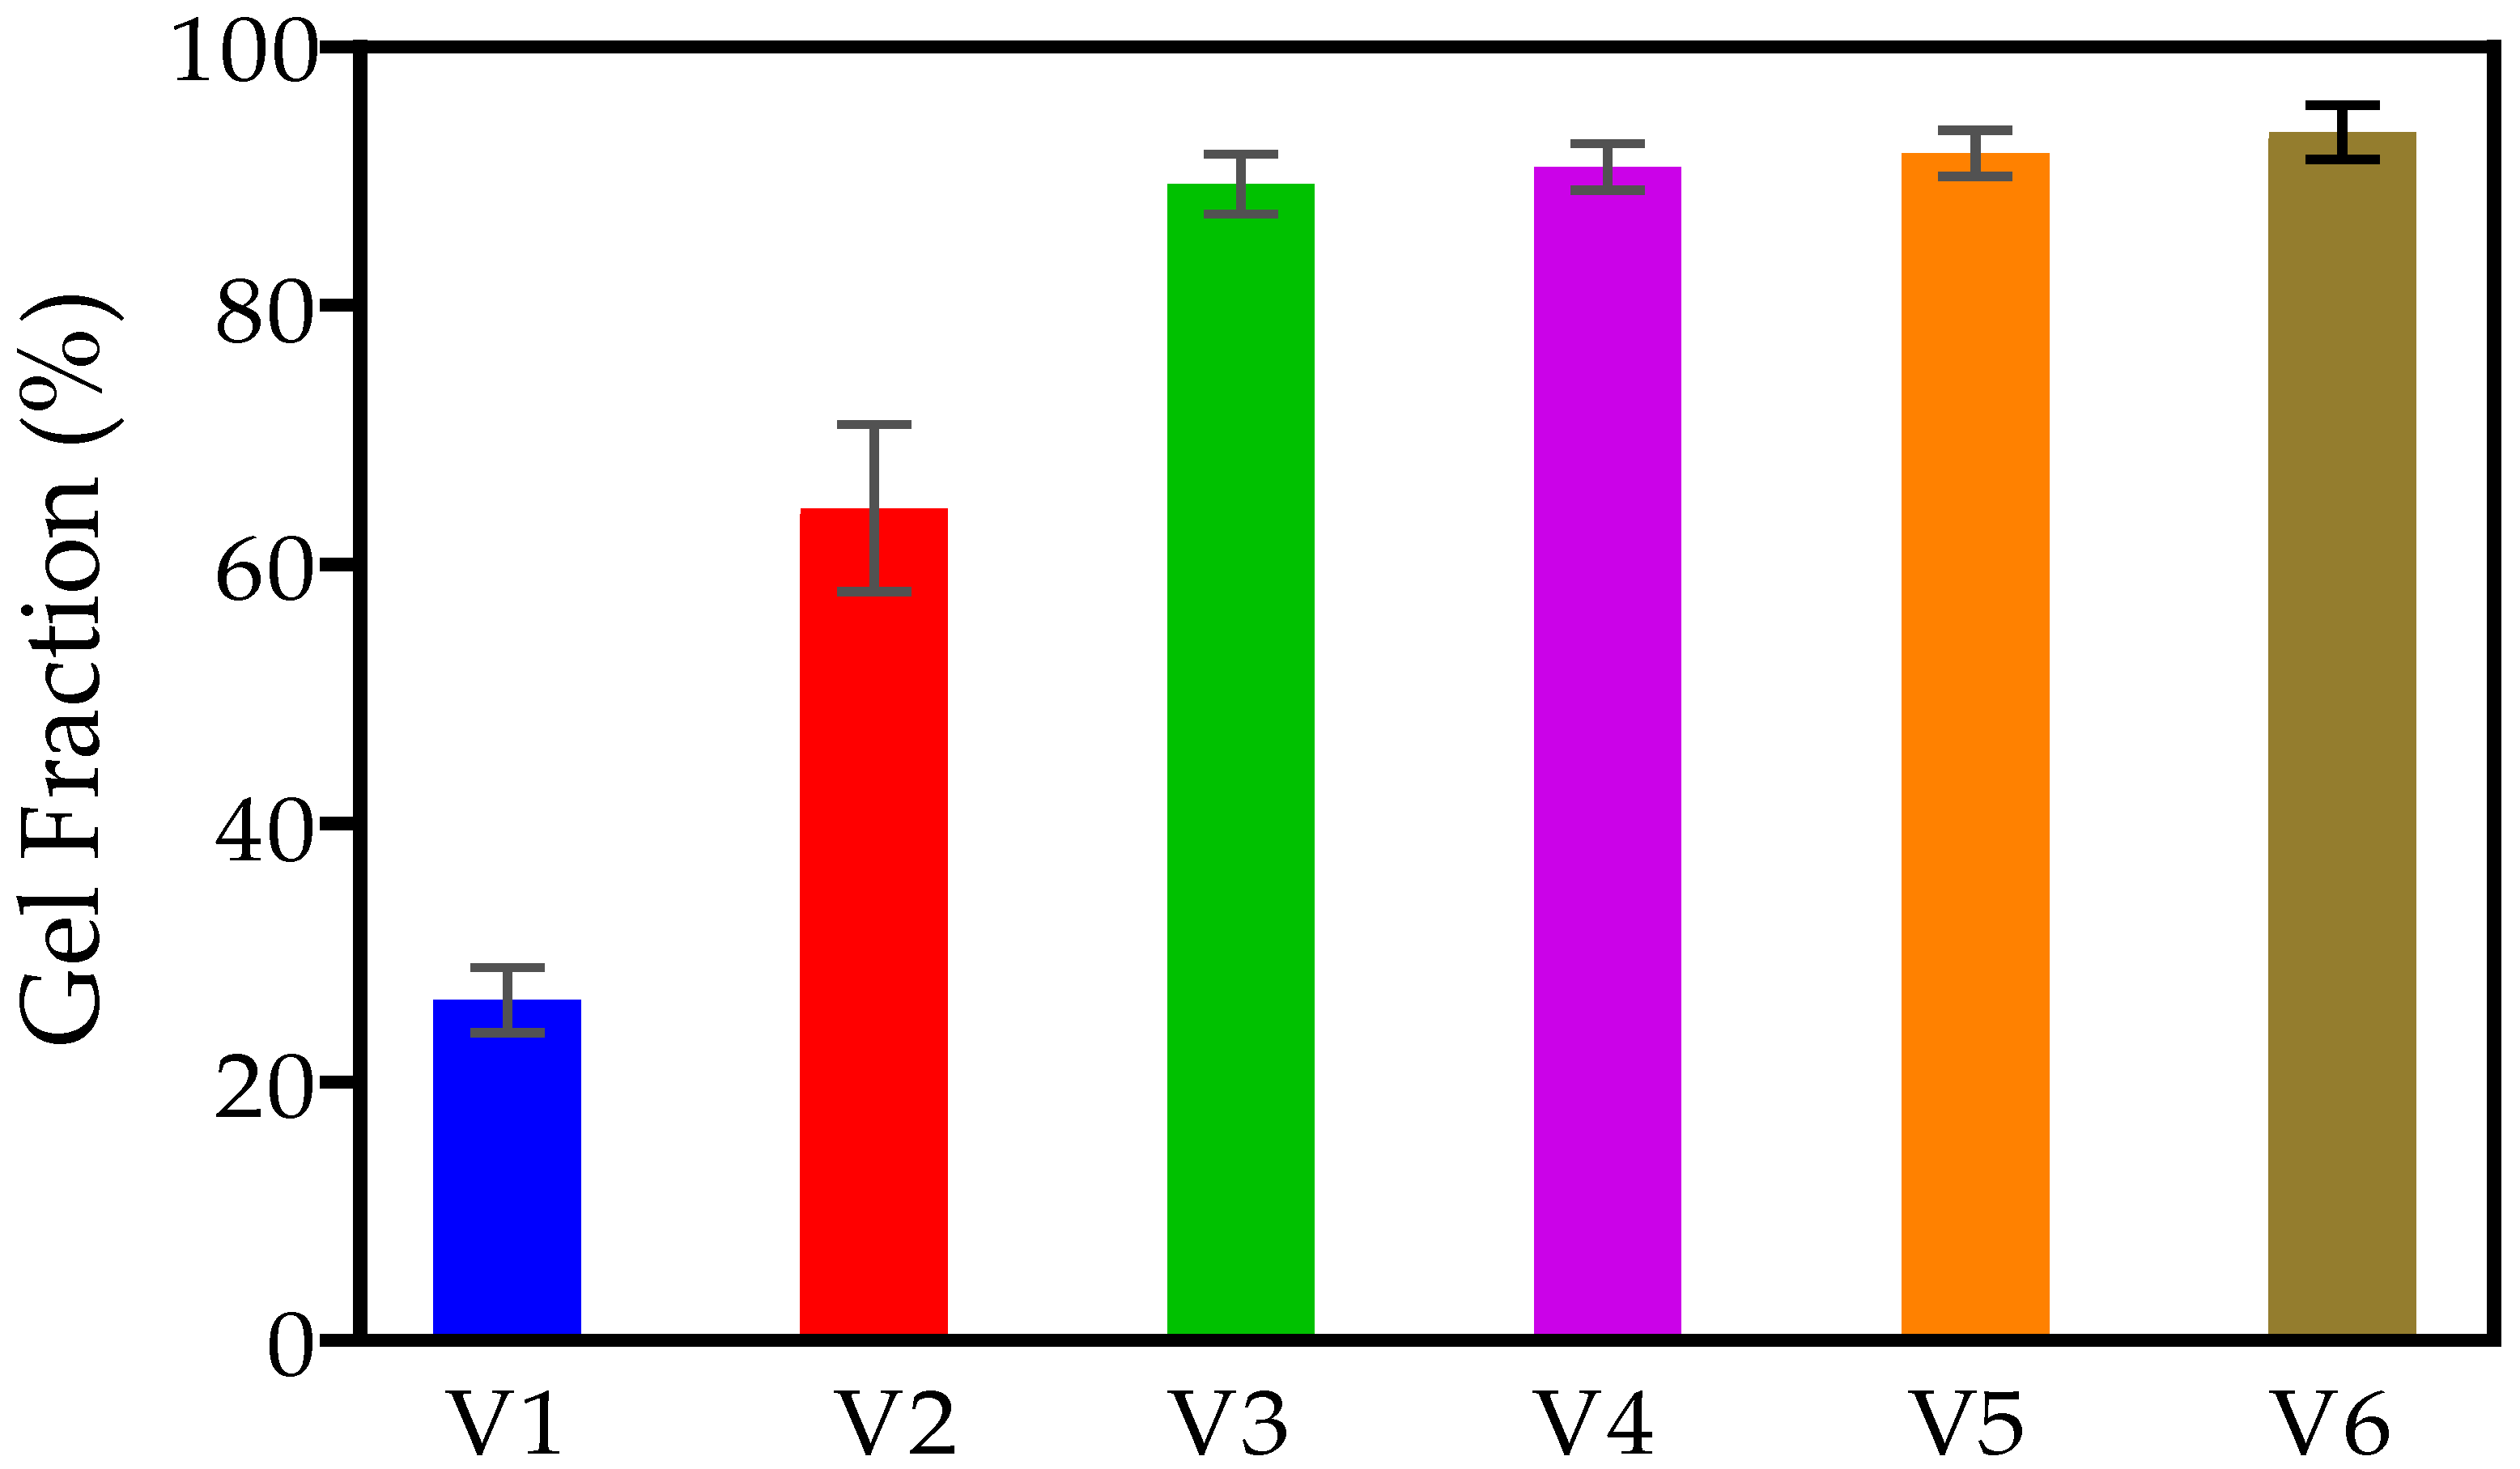
3.6. Gel Fraction Measurement
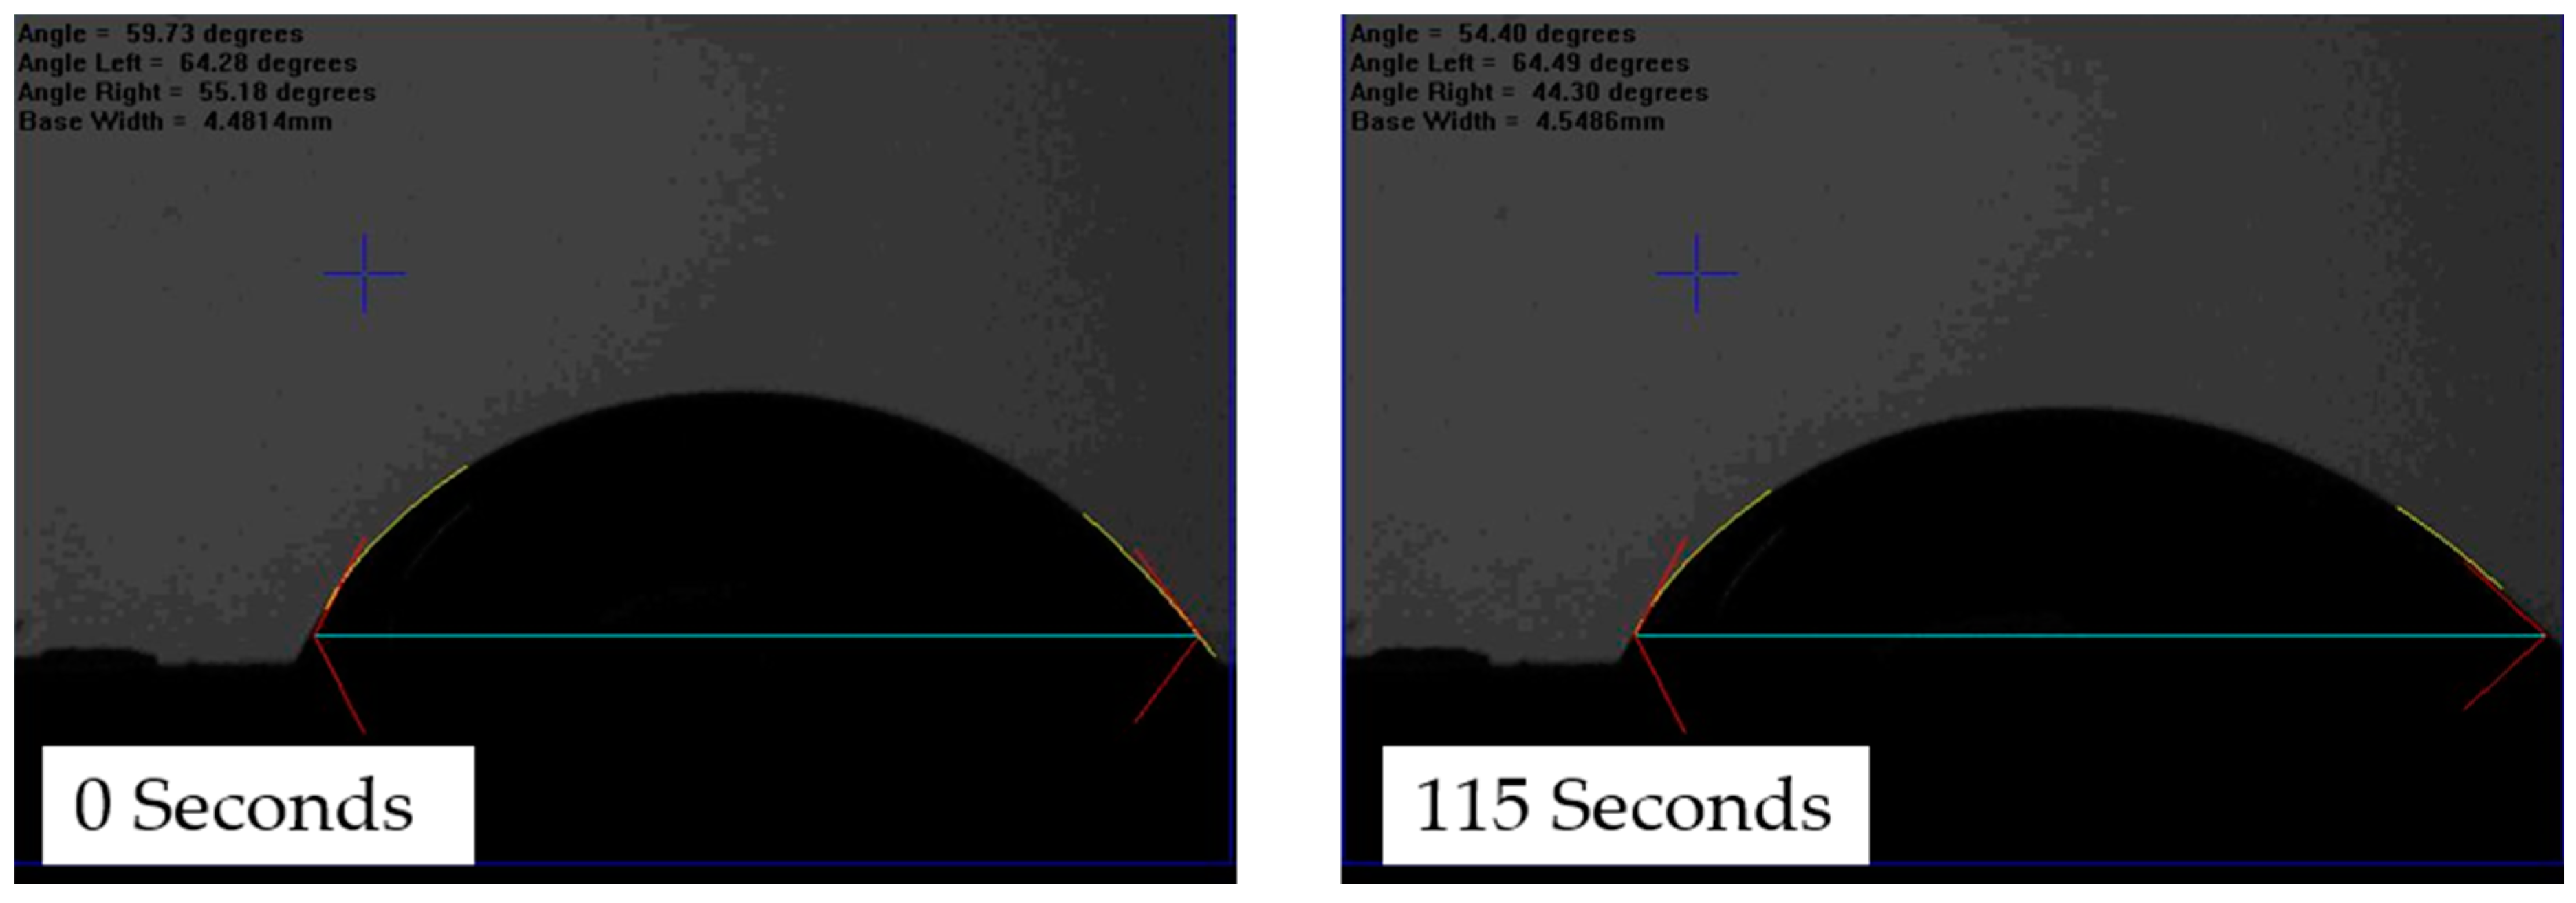
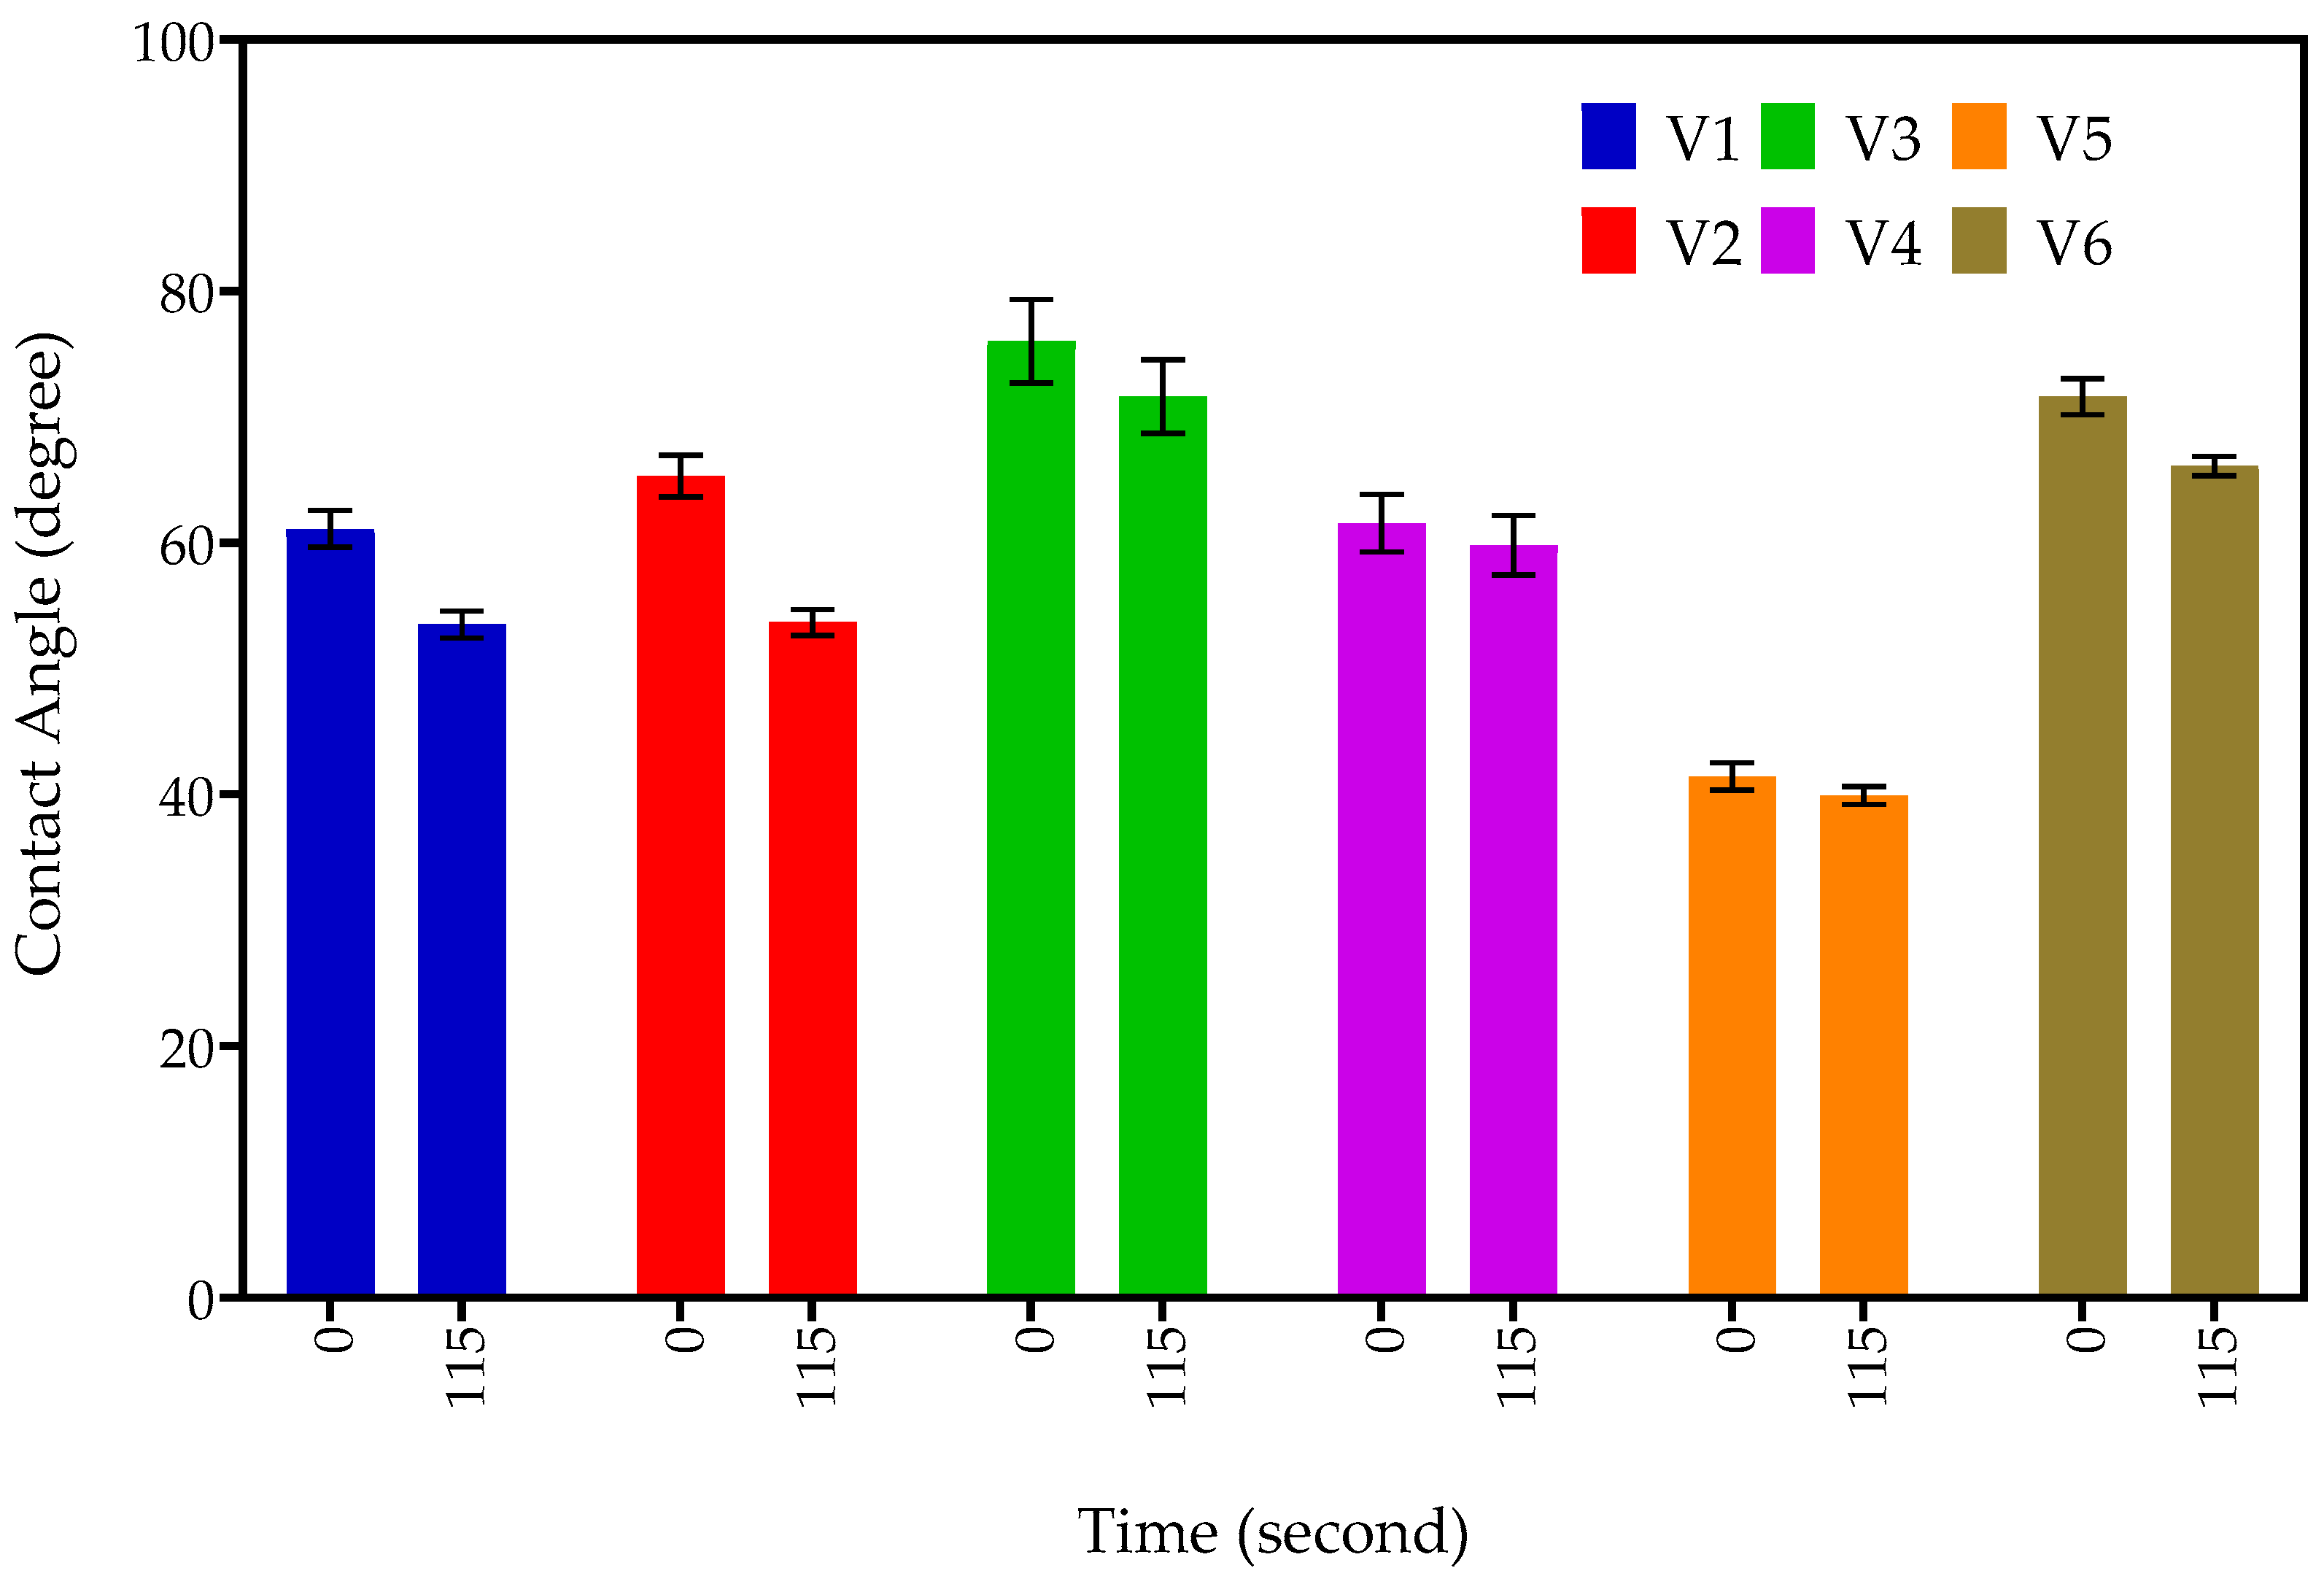
3.7. Goniometry
4. Conclusions
Author Contributions
Funding
Institutional Review Board Statement
Data Availability Statement
Acknowledgments
Conflicts of Interest
References
- Karkun, M.S.; Dharmalingam, S. 3D Printing Technology in Aerospace Industry – A Review. Int. J. Aviat. Aeronaut. Aerosp. 2022, 9, 4. [Google Scholar] [CrossRef]
- Elakkad, A.S. 3D Technology in the Automotive Industry. Int. J. Eng. Res. 2019, 8, 248–251. [Google Scholar] [CrossRef]
- Aimar, A.; Palermo, A.; Innocenti, B. The Role of 3D Printing in Medical Applications: A State of the Art. J. Health Eng. 2019, 2019, 5340616. [Google Scholar] [CrossRef]
- Fan, D.; Li, Y.; Wang, X.; Zhu, T.; Wang, Q.; Cai, H.; Li, W.; Tian, Y.; Liu, Z. Progressive 3D Printing Technology and Its Application in Medical Materials. Front. Pharmacol. 2020, 11, 122. [Google Scholar] [CrossRef]
- Shahrubudin, N.; Lee, T.C.; Ramlan, R. An overview on 3D printing technology: Technological, materials, and applications. Procedia Manuf. 2019, 35, 1286–1296. [Google Scholar] [CrossRef]
- Reddy, S. Smart Materials for 4D Printing: A Review on Developments, Challenges and Applications; Springer: Singapore, 2022. [Google Scholar]
- Ahmed, A.; Arya, S.; Gupta, V.; Furukawa, H.; Khosl, A.A. 4D printing: Fundamentals, materials applications and challenges. Polymer 2021, 228, 123926. [Google Scholar] [CrossRef]
- Momeni, F.; Hassani, S.M.M.; Liu, X.; Ni, J. A review of 4D printing. Mater. Des. 2017, 122, 42–79. [Google Scholar] [CrossRef]
- Kafle, A.; Luis, E.; Silwal, R.; Pan, H.M.; Shrestha, P.L.; Bastola, A.K. 3d/4d printing of polymers: Fused deposition modelling (FDM), selective laser sintering (SLS), and stereolithography (SLA). Polymers 2021, 13, 3101. [Google Scholar] [CrossRef]
- Hu, G.; Cao, Z.; Hopkins, M.; Hayes, C.; Daly, M.; Zhou, H.; Devine, D.M. Optimizing the hardness of SLA printed objects by using the neural network and genetic algorithm. Procedia Manuf. 2019, 38, 117–124. [Google Scholar] [CrossRef]
- Aldawood, F.K. A Comprehensive Review of 4D Printing: State of the Arts, Opportunities, and Challenges. Actuators 2023, 12, 101. [Google Scholar] [CrossRef]
- Kök, M.; Qader, İ.N.; Dağdelen, F.; Aydoğdu, Y. A Review of Smart Materials: Researches and Applications. El-Cezeri Fen Mühendislik Derg. 2019, 2019, 755–788. [Google Scholar]
- Haleem, A.; Javaid, M.; Singh, R.P.; Suman, R. Significant roles of 4D printing using smart materials in the field of manufacturing. Adv. Ind. Eng. Polym. Res. 2021, 4, 301–311. [Google Scholar] [CrossRef]
- Imrie, P.; Jin, J. Polymer 4D printing: Advanced shape-change and beyond. J. Polym. Sci. 2022, 60, 149–174. [Google Scholar] [CrossRef]
- Gazzaniga, A.; Foppoli, A.; Cerea, M.; Palugan, L.; Cirilli, M.; Moutaharrik, S.; Melocchi, A.; Maroni, A. International Journal of Pharmaceutics: X Towards 4D printing in pharmaceutics. Int. J. Pharm. 2023, 5, 100171. [Google Scholar]
- Sahafnejad-Mohammadi, I.; Karamimoghadam, M.; Zolfagharian, A.; Akrami, M.; Bodaghi, M. 4D printing technology in medical engineering: A narrative review. J. Braz. Soc. Mech. Sci. Eng. 2022, 44, 233. [Google Scholar] [CrossRef]
- Manaia, J.P.; Cerejo, F.; Duarte, J. Revolutionising textile manufacturing: A comprehensive review on 3D and 4D printing technologies. Fash. Text. 2023, 10, 20. [Google Scholar] [CrossRef]
- Nkomo, N.Z. A Review of 4D Printing Technology and Future Trends. In Proceedings of the Eleventh South African Conference on Computational and Applied Mechanics, Vanderbijlpark, South Africa, 17–19 September 2018. [Google Scholar]
- Cortez-Lemus, N.A.; Licea-Claverie, A. Poly(N-vinylcaprolactam), a comprehensive review on a thermoresponsive polymer becoming popular. Prog. Polym. Sci. 2016, 53, 1–51. [Google Scholar] [CrossRef]
- Killion, J.A.; Kehoe, S.; Geever, L.M.; Devine, D.M.; Sheehan, E.; Boyd, D.; Higginbotham, C.L. Hydrogel/bioactive glass composites for bone regeneration applications: Synthesis and characterisation. Mater. Sci. Eng. C 2013, 33, 4203–4212. [Google Scholar] [CrossRef]
- Xu, R. Light scattering: A review of particle characterization applications. Particuology 2015, 18, 11–21. [Google Scholar] [CrossRef]
- Bastiancich, C.; Danhier, P.; Préat, V. Anticancer drug-loaded hydrogels as drug delivery systems for the local treatment of glioblastoma. J. Control. Release 2016, 243, 29–42. [Google Scholar] [CrossRef]
- Arefin, A.M.E.; Khatri, N.R.; Kulkarni, N.; Egan, P.F. Polymer 3D printing review: Materials, process, and design strategies for medical applications. Polymers 2021, 13, 1499. [Google Scholar] [CrossRef]
- Zhuo, S.; Geever, L.M.; Halligan, E.; Tie, B.S.H.; Breheny, C. A Development of New Material for 4D Printing and the Material Properties Comparison between the Conventional and Stereolithography Polymerised NVCL Hydrogels. J. Funct. Biomater. 2022, 13, 262. [Google Scholar] [CrossRef]
- Choong, Y.Y.C.; Maleksaeedi, S.; Eng, H.; Wei, J.; Su, P.-C. 4D printing of high performance shape memory polymer using stereolithography. Mater. Des. 2017, 126, 219–225. [Google Scholar] [CrossRef]
- Karagianni, A.; Kachrimanis, K.; Nikolakakis, I. Co-amorphous solid dispersions for solubility and absorption improvement of drugs: Composition, preparation, characterization and formulations for oral delivery. Pharmaceutics 2018, 10, 98. [Google Scholar] [CrossRef]
- Moraes, R.M.; Carvalho, L.T.; Alves, G.M.; Medeiros, S.F.; Bourgeat-Lami, E.; Santos, A.M. Synthesis and Self-Assembly of Poly(N-Vinylcaprolactam)-b-Poly(ε-Caprolactone) Block Copolymers via the Combination of RAFT/MADIX and Ring-Opening Polymerizations. Polymers 2020, 12, 1252. [Google Scholar] [CrossRef]
- Usanmaz, A.; Özdemir, T.; Polat, Ö. Solid state polymerization of N-vinylcaprolactam via gamma irradiation and characterization. J. Macromol. Sci. Part A 2009, 46, 597–606. [Google Scholar] [CrossRef]
- Yang, S.B.; Karim, M.R.; Lee, J.; Yeum, J.H.; Yeasmin, S. Alkaline Treatment Variables to Characterize Poly(Vinyl Alcohol)/Poly(Vinyl Butyral/Vinyl Alcohol) Blend Films. Polymers 2022, 14, 3916. [Google Scholar] [CrossRef]
- Chowdhury, J.; Anirudh, P.V.; Karunakaran, C.; Rajmohan, V.; Mathew, A.T.; Koziol, K.; Alsanie, W.F.; Kannan, C.; Balan, A.S.S.; Thakur, V.K. 4D printing of smart polymer nanocomposites: Integrating graphene and acrylate based shape memory polymers. Polymers 2021, 13, 3660. [Google Scholar] [CrossRef]
- Kirsh, Y.; Yanul, N.; Kalninsh, K. Structural transformations and water associate interactions in poly-N-vinylcaprolactam–water system. Eur. Polym. J. 1999, 35, 305–316. [Google Scholar] [CrossRef]
- Meng, W.; Gao, L.; Venkatesan, J.K.; Wang, G.; Madry, H.; Cucchiarini, M. Translational applications of photopolymerizable hydrogels for cartilage repair. J. Exp. Orthop. 2019, 6, 47. [Google Scholar] [CrossRef] [PubMed]
- Halligan, S.C.; Dalton, M.B.; Murray, K.A.; Dong, Y.; Wang, W.; Lyons, J.G.; Geever, L.M. Synthesis, characterisation and phase transition behaviour of temperature-responsive physically crosslinked poly (N-vinylcaprolactam) based polymers for biomedical applications. Mater. Sci. Eng. C 2017, 79, 130–139. [Google Scholar] [CrossRef]
- Parhi, R. Cross-Linked Hydrogel for Pharmaceutical Applications: A Review. Tabriz Univ. Med. Sci. 2017, 7, 515–530. [Google Scholar] [CrossRef]
- Heck, T.; Faccio, G.; Richter, M.; Thöny-Meyer, L. Enzyme-catalyzed protein crosslinking. Appl. Microbiol. Biotechnol. 2013, 97, 461–475. [Google Scholar] [CrossRef]
- Cozens, E.J.; Roohpour, N.; Gautrot, J.E. Comparative adhesion of chemically and physically crosslinked poly(acrylic acid)-based hydrogels to soft tissues. Eur. Polym. J. 2021, 146, 110250. [Google Scholar] [CrossRef]
- Singh, A.K.; Itkor, P. State-of-the-Art Insights and Potential Applications of Cellulose-Based Hydrogels in Food Packaging: Advances. Gels 2023, 9, 433. [Google Scholar] [CrossRef]
- Maitra, J.; Shukla, V.K. Cross-linking in Hydrogels—A Review. Am. J. Polym. Sci. 2014, 4, 25–31. [Google Scholar]
- Ngadaonye, J.I.; Cloonan, M.O.; Geever, L.M.; Higginbotham, C.L. Synthesis and characterisation of thermo-sensitive terpolymer hydrogels for drug delivery applications. J. Polym. Res. 2011, 18, 2307–2324. [Google Scholar] [CrossRef]
- Barleany, D.R.; Ananta, C.V.; Maulina, F.; Rochmat, A.; Alwan, H.; Erizal, E. Controlled release of metformin hydrogen chloride from stimuli-responsive hydrogel based on poly(N-Isopropylacrylamide)/Chitosan/Polyvinyl alcohol composite. Int. J. Technol. 2020, 11, 511–521. [Google Scholar] [CrossRef]


 ) P(NVCL90-DEGDA10) and (
 ) P(NVCL70-DEGDA10-VAc20).
) P(NVCL90-DEGDA10) and () P(NVCL70-DEGDA10-VAc20).
) P(NVCL70-DEGDA10-VAc20).
) P(NVCL90-DEGDA10) and () P(NVCL70-DEGDA10-VAc20).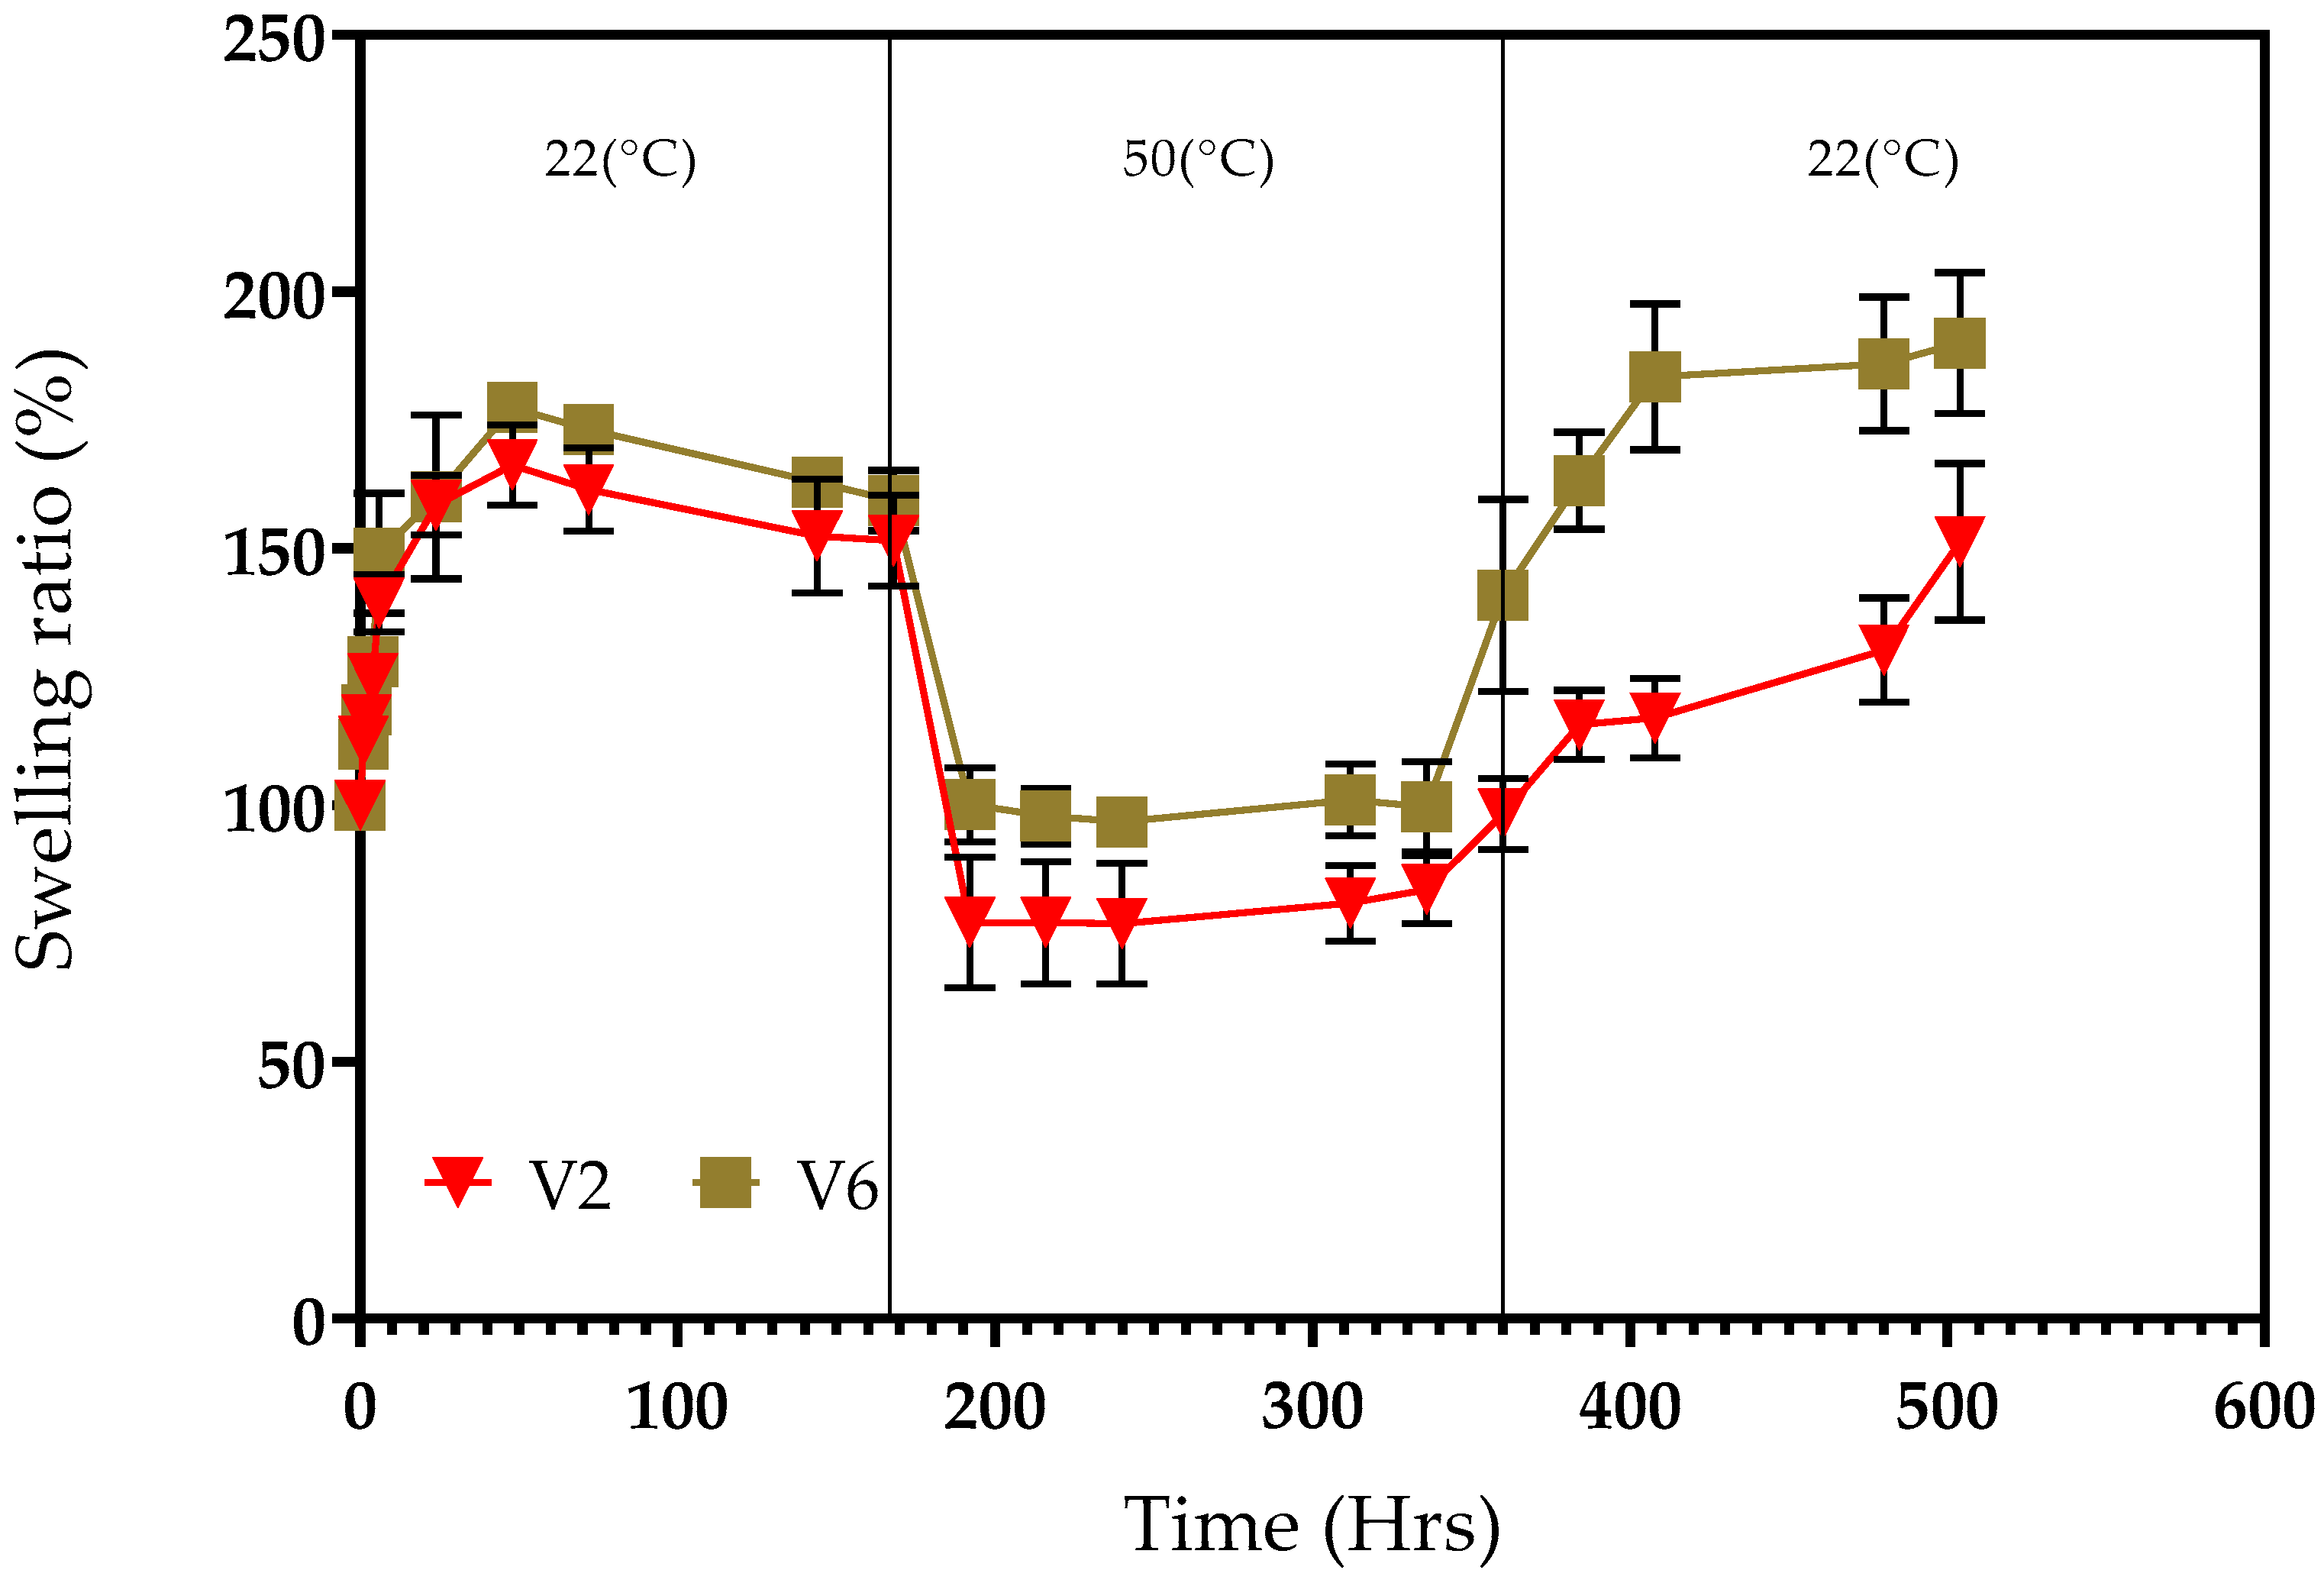


| Material | Chemical Structures |
|---|---|
| N-vinylcaprolatam (NVCL) | 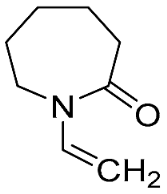 |
| Diphenyl(2,4,6-trimethylbenzoyl) phosphine oxide (TPO) | 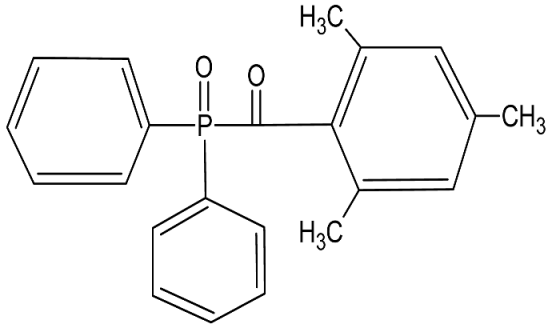 |
| Vinylacetate (VAc) | 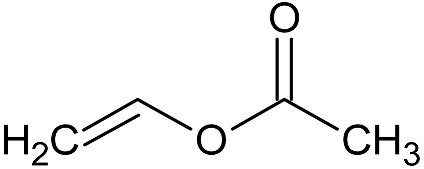 |
| Di(ethylene glycol) diacrylate (DEGDA) | 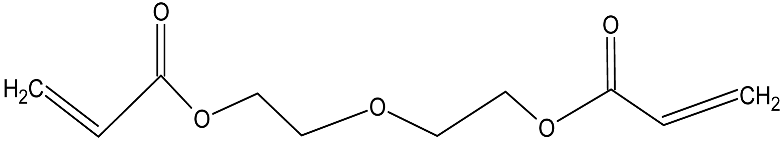 |
| CODE | Formulation | Photoinitiator | Monomer | Crosslinker | Comonomer |
|---|---|---|---|---|---|
| TPO (wt%) | NVCL (wt%) | DEGDA (wt%) | VAc (wt%) | ||
| V1 | P(NVCL95-DEGDA5) | 2 | 95 | 5 | -- |
| V2 | P(NVCL90-DEGDA10) | 2 | 90 | 10 | -- |
| V3 | P(NVCL80-DEGDA20) | 2 | 80 | 20 | -- |
| V4 | P(NVCL70-DEGDA30) | 2 | 70 | 30 | -- |
| V5 | P(NVCL60-DEGDA40) | 2 | 60 | 40 | -- |
| V6 | P(NVCL70-DEGDA10-VAc20) | 2 | 70 | 10 | 20 |
| Sample | Wavelength (cm−1) | Functional Group |
|---|---|---|
| Monomers | ||
| DEGDA | 1720 | C=O |
| 1637 | C–C | |
| 1185 | C–O | |
| VAc | 1647 | C=O |
| 1759 | C–H | |
| NVCL | 2930, 2860 | C–H |
| 1656 | C=O | |
| 1620 | C=C | |
| 1260 | C–N | |
| 3D printed Samples | ||
| PNVCL/DEGDA (V1–V5) | 1473–1350 | C–H |
| 1710–1730 | C=O | |
| PNVCL/DEGDA/VAc (V6) | 2854 | C–H |
Disclaimer/Publisher’s Note: The statements, opinions and data contained in all publications are solely those of the individual author(s) and contributor(s) and not of MDPI and/or the editor(s). MDPI and/or the editor(s) disclaim responsibility for any injury to people or property resulting from any ideas, methods, instructions or products referred to in the content. |
© 2024 by the authors. Licensee MDPI, Basel, Switzerland. This article is an open access article distributed under the terms and conditions of the Creative Commons Attribution (CC BY) license (https://creativecommons.org/licenses/by/4.0/).
Share and Cite
Halligan, E.; Tie, B.S.H.; Colbert, D.M.; Alsaadi, M.; Zhuo, S.; Keane, G.; Geever, L.M. Synthesis and Characterisation of 4D-Printed NVCL-co-DEGDA Resin Using Stereolithography 3D Printing. Macromol 2024, 4, 150-164. https://doi.org/10.3390/macromol4010008
Halligan E, Tie BSH, Colbert DM, Alsaadi M, Zhuo S, Keane G, Geever LM. Synthesis and Characterisation of 4D-Printed NVCL-co-DEGDA Resin Using Stereolithography 3D Printing. Macromol. 2024; 4(1):150-164. https://doi.org/10.3390/macromol4010008
Chicago/Turabian StyleHalligan, Elaine, Billy Shu Hieng Tie, Declan Mary Colbert, Mohamad Alsaadi, Shuo Zhuo, Gavin Keane, and Luke M. Geever. 2024. "Synthesis and Characterisation of 4D-Printed NVCL-co-DEGDA Resin Using Stereolithography 3D Printing" Macromol 4, no. 1: 150-164. https://doi.org/10.3390/macromol4010008
APA StyleHalligan, E., Tie, B. S. H., Colbert, D. M., Alsaadi, M., Zhuo, S., Keane, G., & Geever, L. M. (2024). Synthesis and Characterisation of 4D-Printed NVCL-co-DEGDA Resin Using Stereolithography 3D Printing. Macromol, 4(1), 150-164. https://doi.org/10.3390/macromol4010008