Article

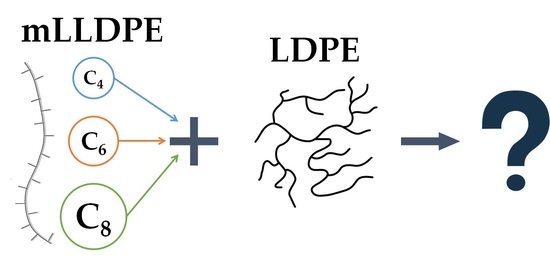
Influence of Ethylene-1-Alkene Copolymers Microstructure on Thermo-Rheological Behavior of Model Blends for Enhanced Recycling

Borouge Private Limited, Innovation Centre, Sas Al Nakhl, Abu Dhabi P.O. Box 6925, United Arab Emirates
*
Authors to whom correspondence should be addressed.
Macromol 2022, 2(2), 168-183; https://doi.org/10.3390/macromol2020011
Submission received: 11 March 2022 / Revised: 14 April 2022 / Accepted: 21 April 2022 / Published: 24 April 2022

Abstract

:
Polyethylenes (PE) are the most commonly occurring ingredients for post-consumer recyclates (PCR). The structure–property relationships of different types of model PE-based blends are established using multiple thermo-rheological analyses. Although considered “simple”, the complex behavior of model PE-based blends is experimentally demonstrated for the first time for metallocene-catalyzed, linear, low-density polyethylenes (mLLDPE) with different microstructures that are commonly encountered in PCR. During non-isothermal crystallization, the microstructure of mLLDPE predominantly influences the interaction between mLLDPE and LDPE. Based on the mLLDPE microstructure, the molten LDPE phase acts either as a nucleating agent or as a crystallization rate promoting agent. Both rheological and thermal analyses show that higher activation energy is required for the reptation or movement of polymer chains in a highly branched microstructure with long chain branching (LCB) compared to a linear microstructure with short chain branching (SCB). The quasi-melt response, as measured by thermal analysis under non-isothermal conditions, is distinctly different and sensitive to both the SCB and LCB present in the LLDPE/LDPE blends.

Graphical Abstract

1. Introduction

Linear low-density polyethylene (LLDPE) is preferred for blown film applications due to its higher stiffness, toughness and thermal properties, which are attributed to the short-chain branching (SCB) arising from 1-alkene comonomer(s). However, in practice for blown film applications, LLDPE is often blended with minor amounts (up to 30 wt.%) of low-density polyethylene (LDPE) for ease of processing [1].
The microstructure and properties of LLDPE are mainly influenced by the following parameters: type, amount and distribution of comonomer, weight average molecular weight (Mw) and molecular weight distribution (MWD) [2]. It is known that conventional Ziegler–Natta-catalyzed, linear, low-density polyethylene (ZN-LLDPE) has inherent structural heterogeneity, which arises due to asymmetric comonomer distribution in the microstructure, with higher comonomer content in the low-molecular-weight polymer fraction [3]. It has been established that the chain-to-chain heterogeneity of conventional ZN-LLDPE is broad enough to produce thermodynamically driven micro-phase separation in the melt of pristine ZN-LLDPE [4,5,6]. Recently developed metallocene-catalyzed, linear, low-density polyethylene (mLLDPE) has salient features such as a narrow MWD, uniform comonomer content and distribution across polymer chains [7,8].
The ZN-LLDPE blend with LDPE was found to be more miscible than mLLDPE with a similar Mw and branching content [9,10]. The miscibility of the mLLDPE/LDPE blend depends on many factors, such as SCB concentration, the molecular weight of mLLDPE and the amount of LDPE in the blends [9,10,11]. mLLDPE/LDPE blend miscibility was found to be insensitive to the type of 1-alkene comonomer or, in other words, the length of SCB [10,11]. It is important for mLLDPE and LDPE matrices to form a miscible blend and behave as a single-phase system to derive a synergistic combination of the properties of the pristine components. It has been reported that LDPE is miscible with ZN-LLDPE at all blend compositions, while LDPE and mLLDPE showed limited miscibility [11,12]. Melt phase separation depends on the branching content in the branching distribution. Many commercial mLLDPEs are broadly distributed and, even as pure components, they display phase separation in the melt [13]. Thus, basic differences in the microstructure of ZN-LLDPE and mLLDPE, and the intermolecular interactions with LDPE, affect the properties of the blends [14].
For binary blends containing two semi-crystalline components such as LLDPE and LDPE, the crystallization behavior of the polymer matrix in a blend was expected to be altered by the presence of the second blend component. It is important to understand the non-isothermal response of mLLPDE/LDPE blends that are designed for better recyclability in various applications. The objective of this article is to analyze and correlate the features of mLLDPE microstructure that affect the miscibility of mLLDPE with LDPE. There has been a recent urge to make packaging based on polyethelyene more sustainable. Therefore, a profound scientific understanding of the crystallization behavior of mLLPDE and LDPE, and the semicrystalline microstructure in mLLPDE/LDPE blends, would allow for effective polymer design to meet performance targets and ensure the recirculation of mLLPDE/LDPE blends [15]. In this work, the complex thermos-rheological behavior of model PE-based blends is experimentally demonstrated for the first time for a wide range of mLLDPEs with different microstructures, and selected ZN-LLDPEs with a complex microstructure.

2. Materials and Experimental Methods

2.1. Materials

Materials and their composition were modeled based on commonly encountered blend compositions in PCR. LLDPE matrices with different 1-alkene comonomers, viz., 1-butene (C4), 1-hexene (C6) and 1-octene (C8), were used. Dry blends of each LLDPE with 10, 20 and 30 wt.% LDPE (denoted as LD10, LD20 and LD30) were melt-blown using Dr. Collins Laboratory E25 blown film line (COLLIN Lab & Pilot Solutions GmbH, Maitenbeth, Germany) [15]. The extruder temperature profile was maintained at 160–185 °C with a die gap of 1.5 mm. The 40-µm monolayer blown film was produced with blow-up ratio of 2.5 and frost line height of twice the die diameter. Additionally, films with pristine LDPE and LLDPE resins were also produced using similar conditions. Technical properties of LLDPE and LDPE used in this study are reported in Table 1 and Table 2. Melt flow rate (MFR), density, weight average and number average molecular weights (Mw and Mn) from gel permeation chromatography analysis and shear thinning index (SHI) from frequency sweep tests are shown in Table 1 [15]. Comonomer type, total comonomer content and SCB per 1000 carbons (SCB/1000C) from nuclear magnetic resonance spectroscopy (NMR) analysis of all LLDPE are provided in Table 2 [15].

2.2. Experimental Methods

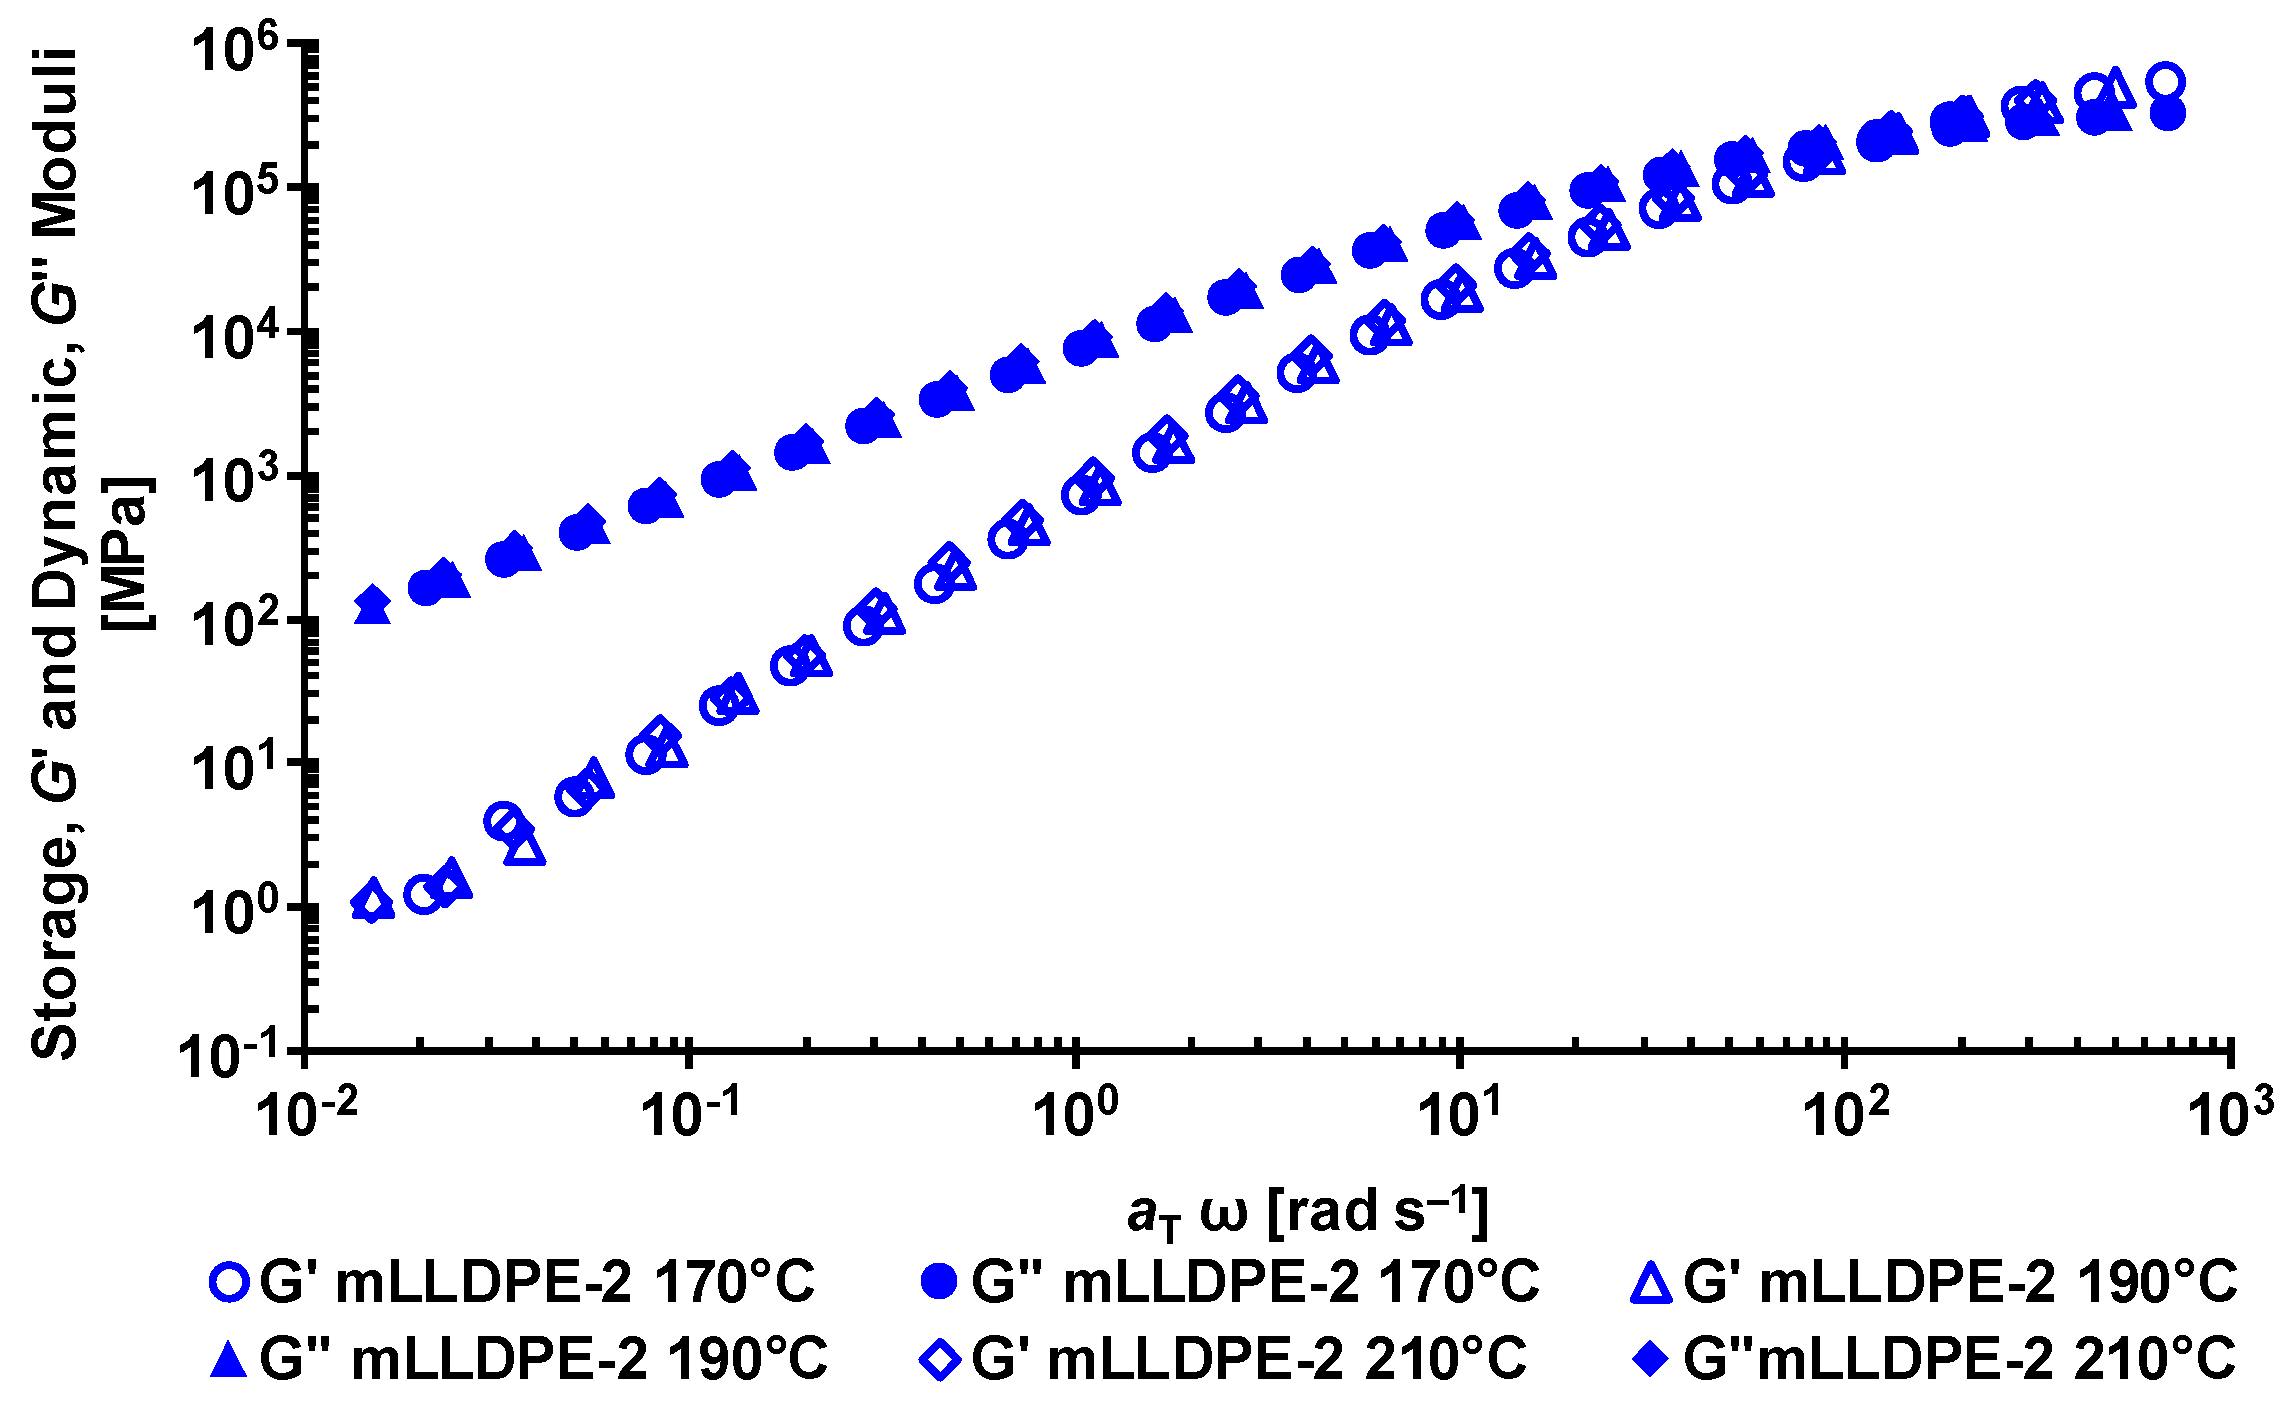
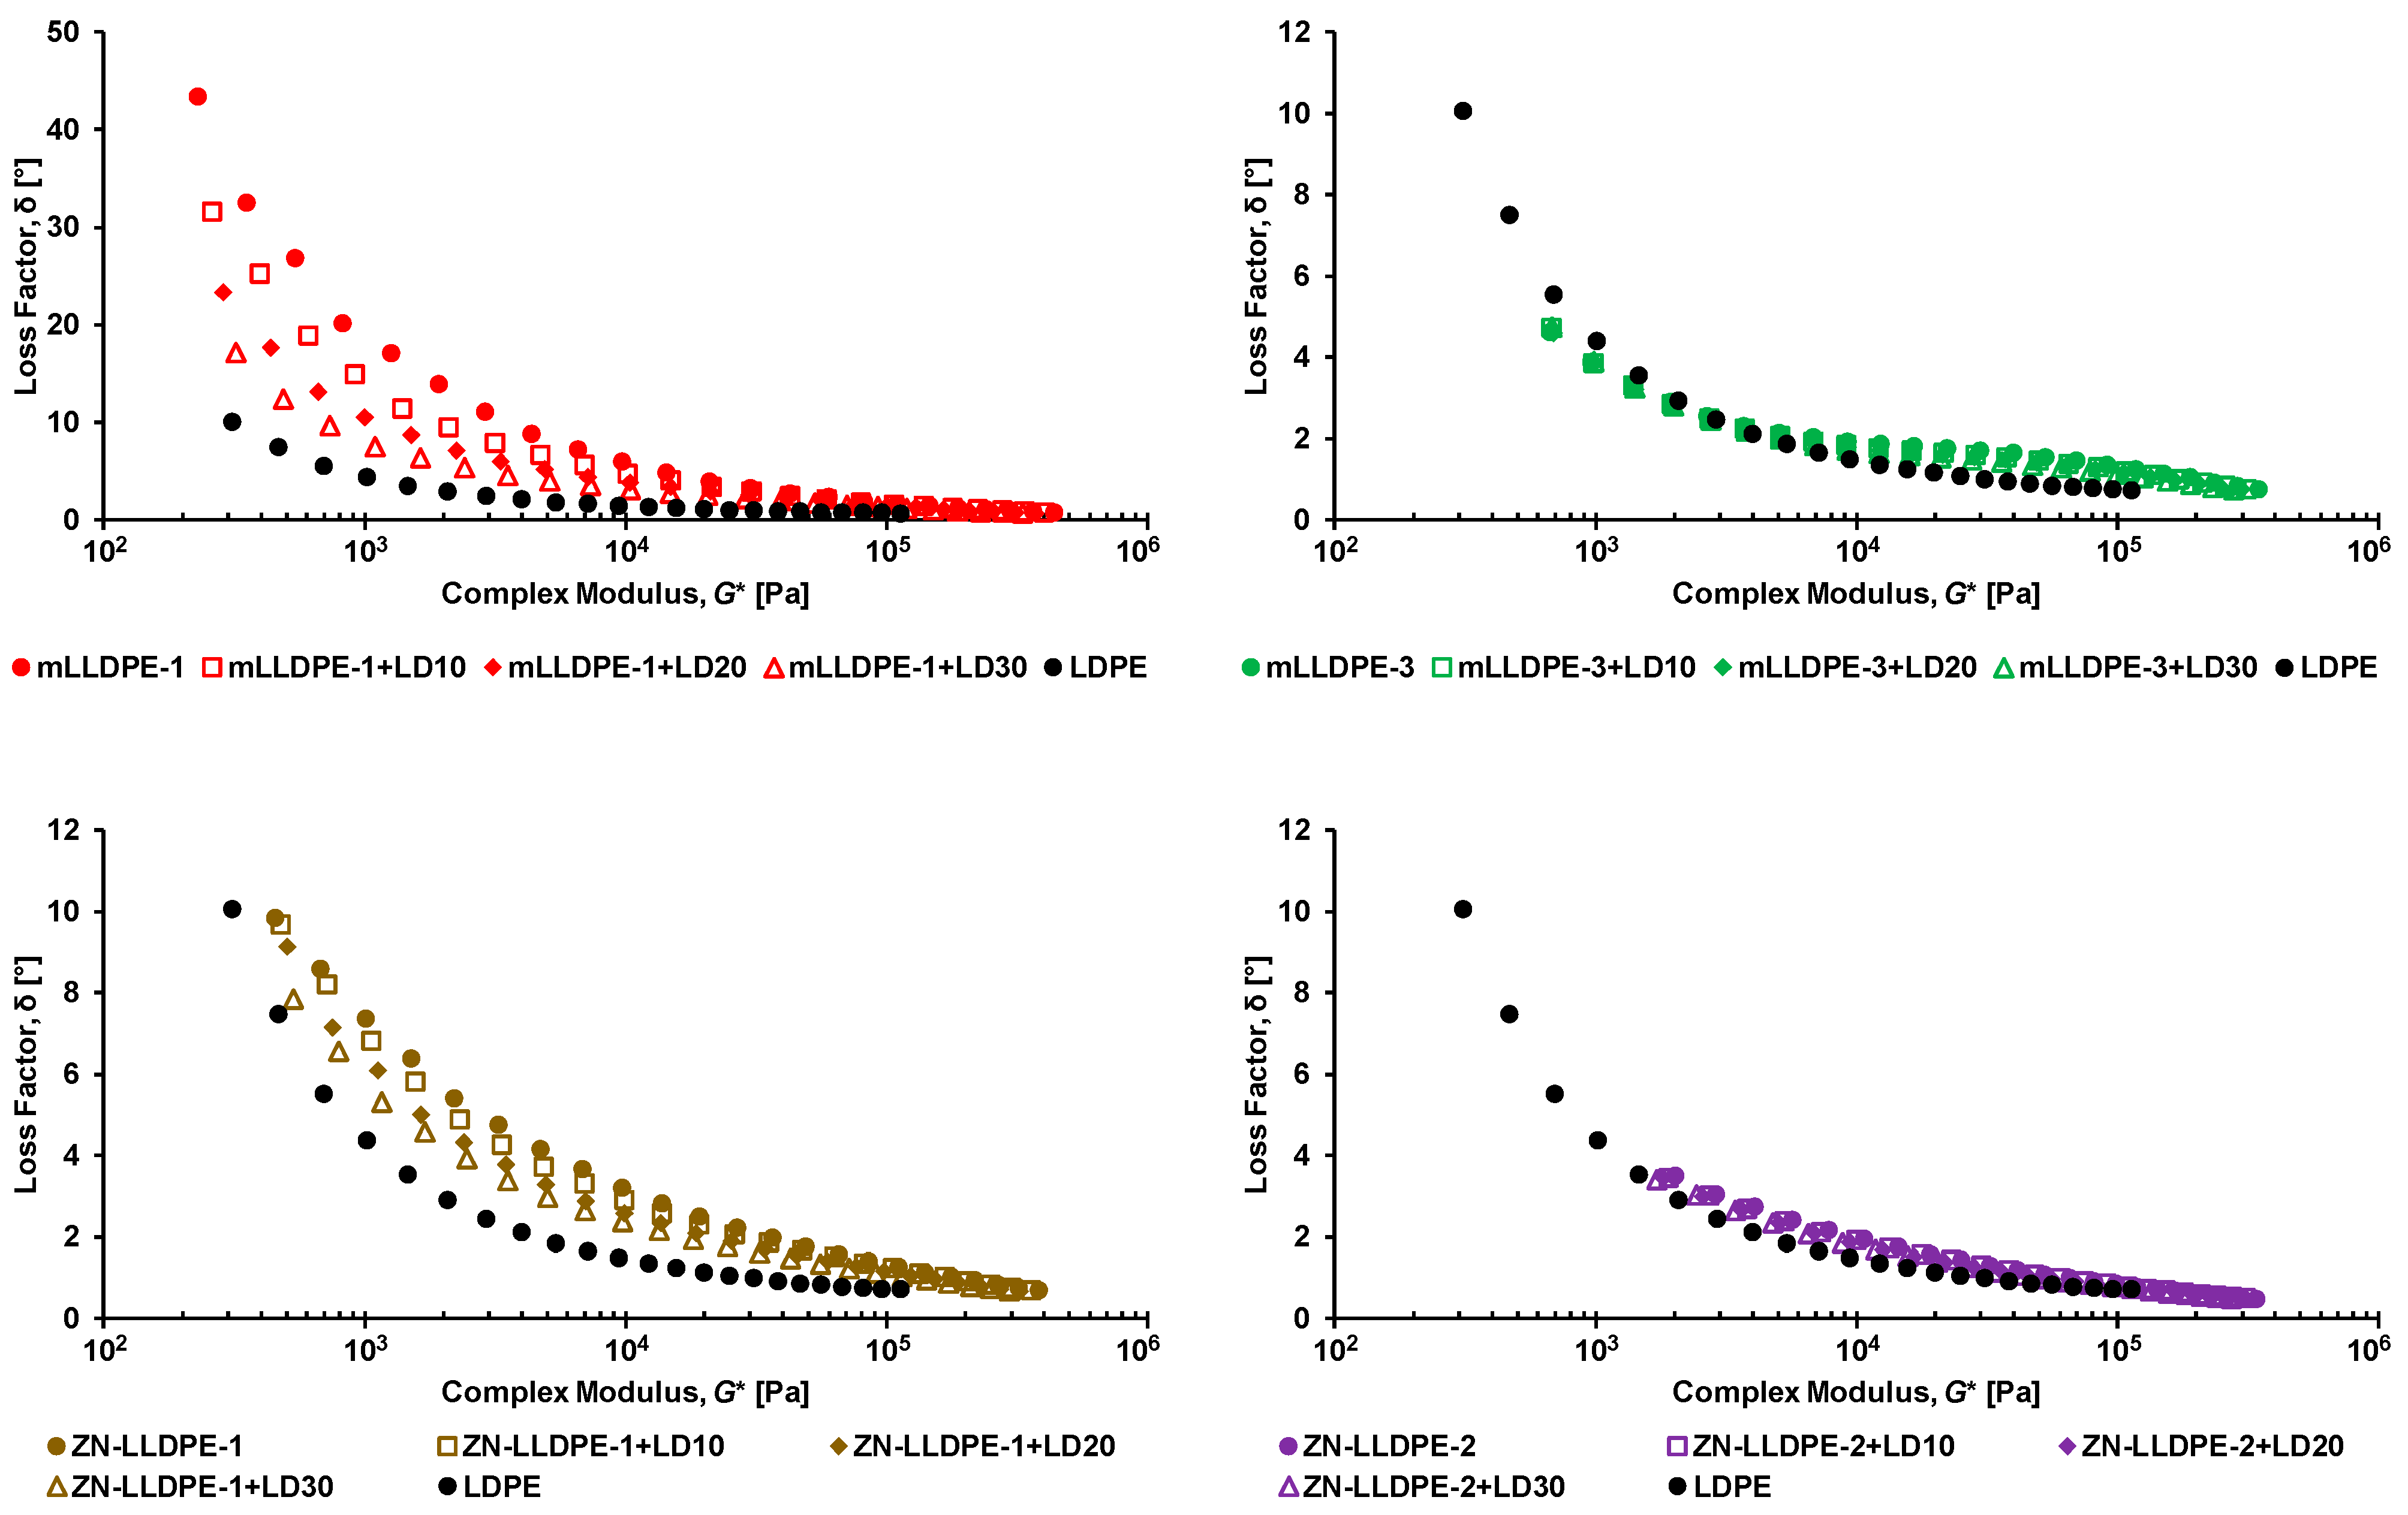
2.2.1. Dynamic Rheology

A rheological analysis of the samples was performed by frequency sweep measurements at 190 °C and 5% strain under nitrogen environment to avoid degradation using Anton Paar MCR 301 rotational rheometer (Anton Paar GmbH, Graz, Austria). For time–temperature superposition experiments, frequency sweep measurements were additionally carried out at 170 °C and 210 °C for 3 pristine mLLDPEs and their blends with 30 wt.% LDPE. Parallel plates with a diameter of 25 mm and a 1.2 mm gap were used. The employed method was based on ISO 6721-10 [16]. Commercially available IRIS software was used for data analysis and for the time–temperature superposition.

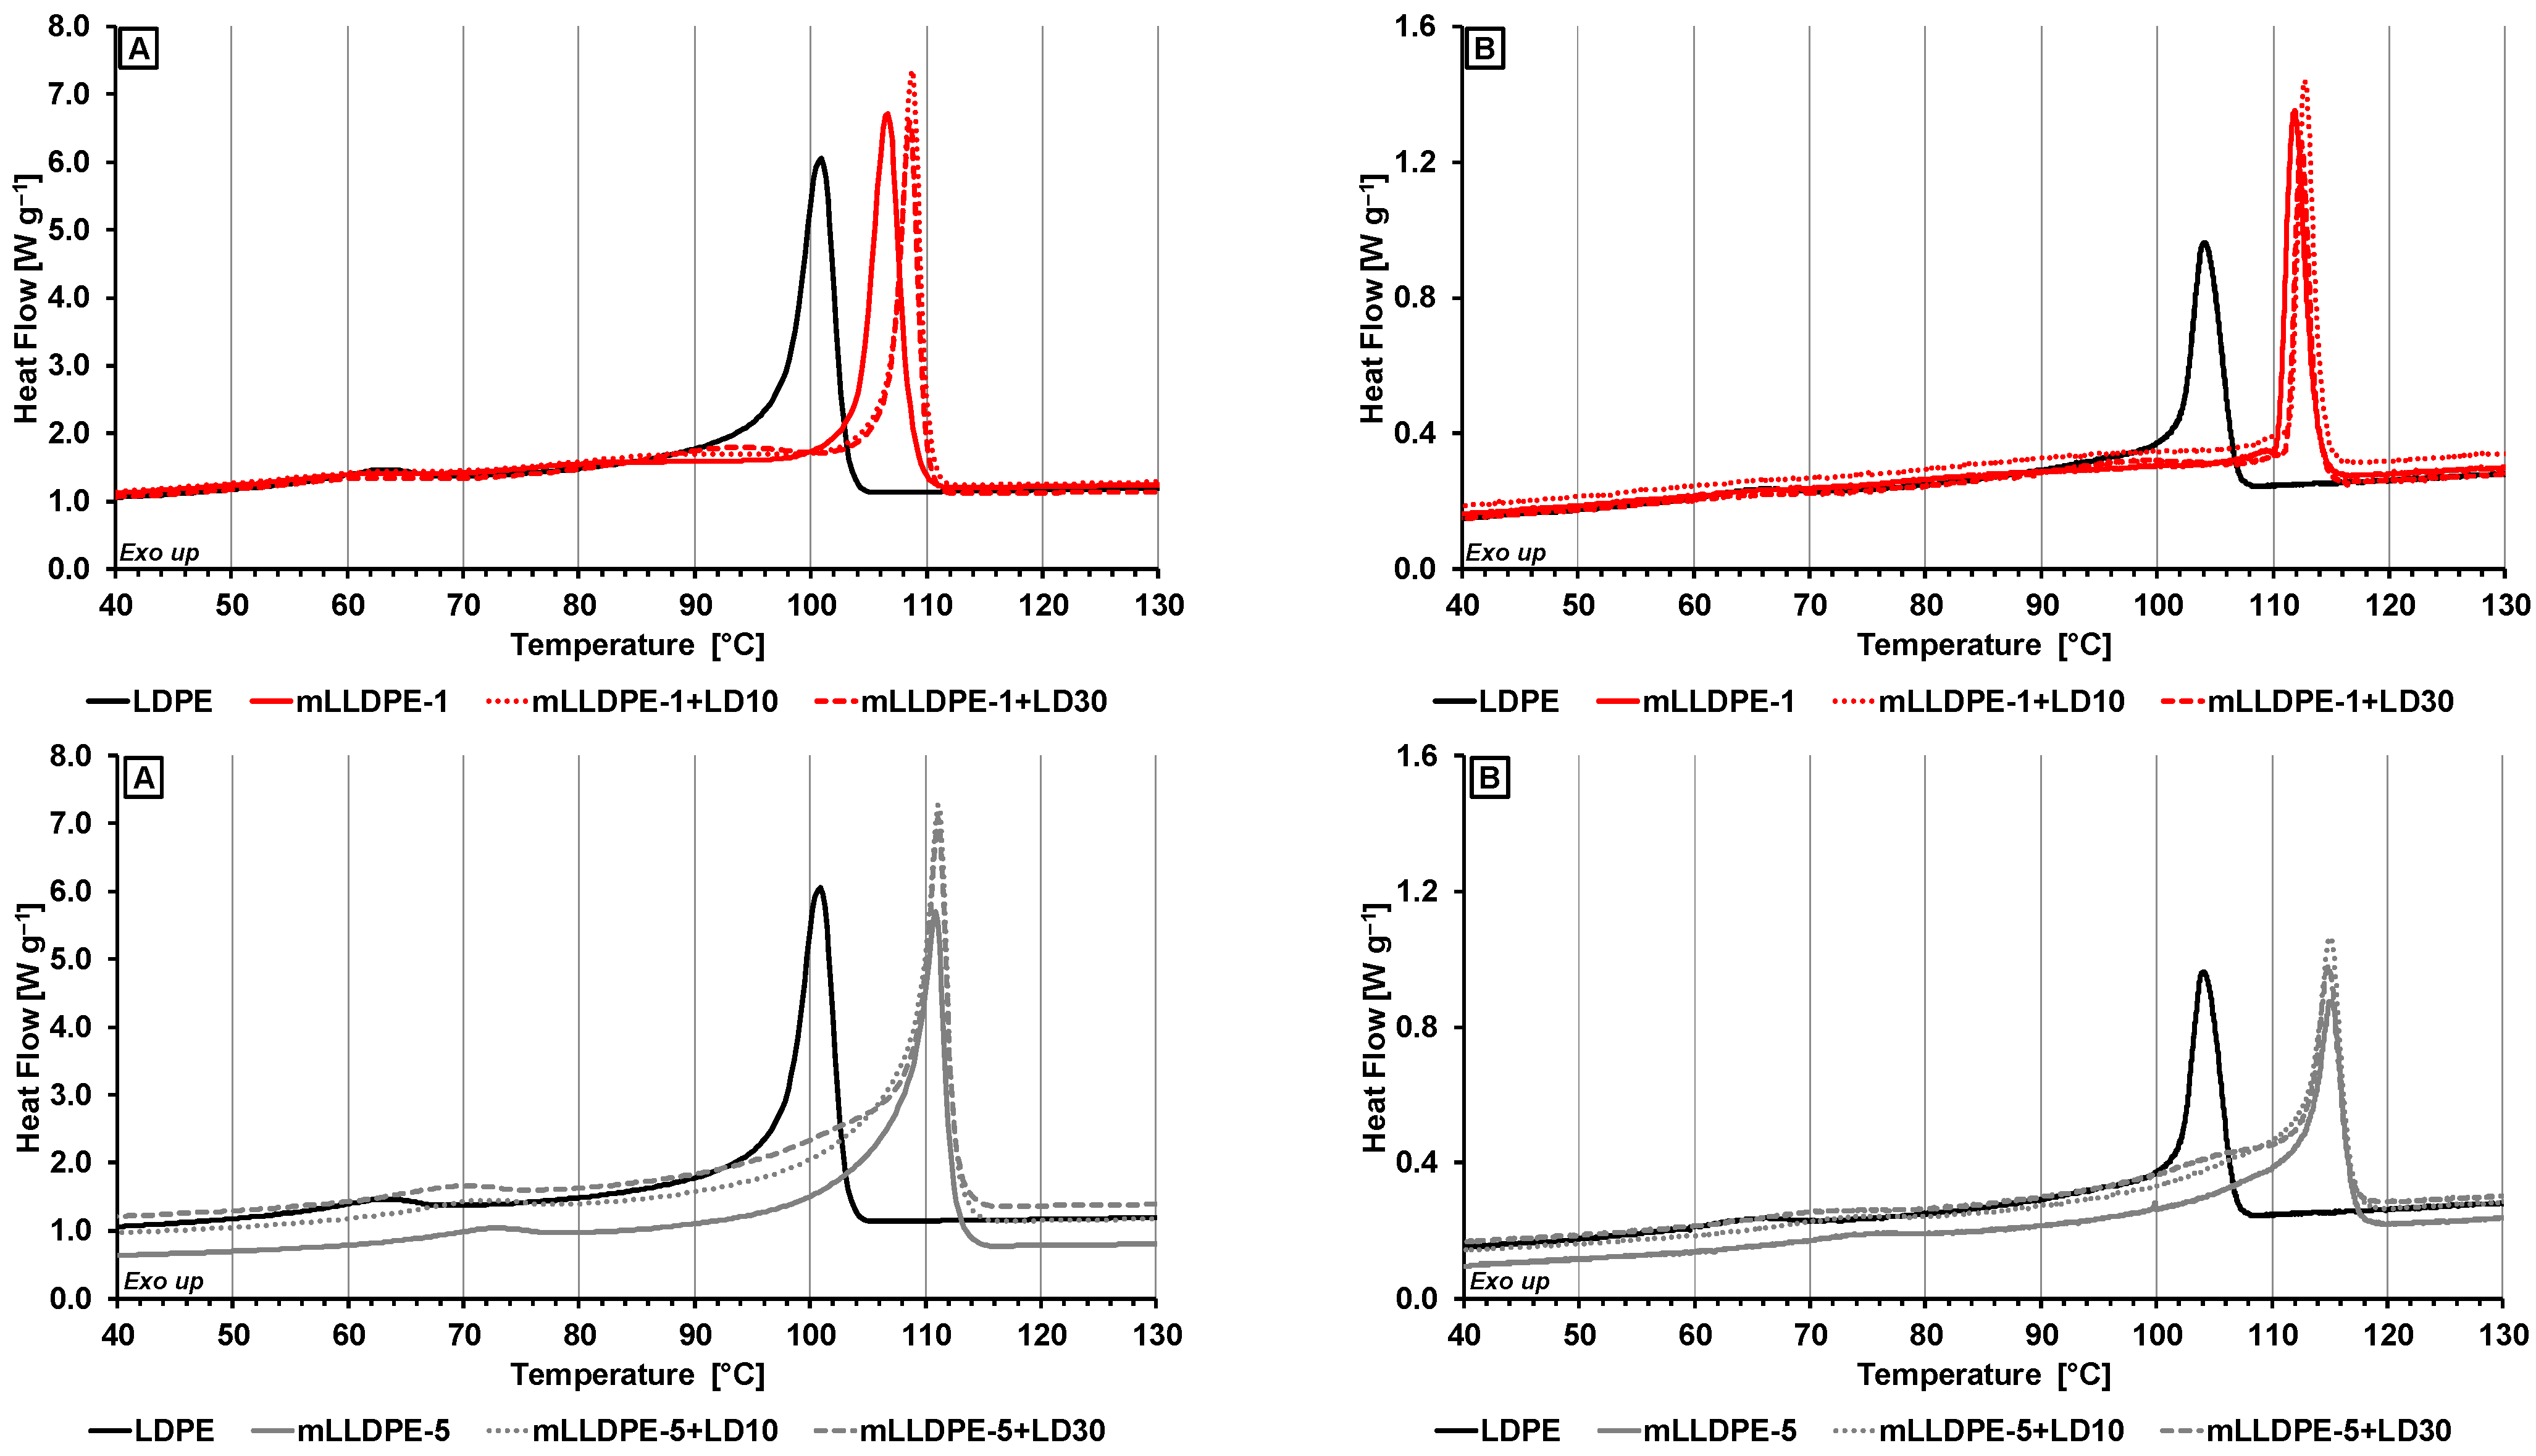
2.2.2. Thermal Analysis

Differential scanning calorimetry (DSC) was conducted on an indium and tin calibrated TA Instruments DSC Q2000 equipped with RCS90 cooling system (TA Instruments, New Castle, DE, USA). All samples were encapsulated in Tzero aluminum pans. Ultra-high-purity dry nitrogen was used as inert atmosphere for all tests. In order to reduce thermal inertia, a relatively lower sample mass of 2.6 ± 0.2 mg was utilized. In order to erase thermal history, the sample was first heated to 200 °C and held isothermally for 5 min. Subsequently, the sample was cooled to 0 °C at 20 °C min−1 or 10 °C min−1 or 5 °C min−1 or 2.5 °C min−1. Heat flow, as a function of time and temperature, was recorded during the crystallization process for subsequent data analysis. Enthalpy of crystallization was determined from the area of the exothermic peak in cooling curve, as described in ISO 11357-3, using the extrapolated baseline method [17]. Commercially available TA Instruments Universal Analysis software was used for data analysis.

3. Results and Discussions

3.1. Rheological Behavior of LLDPE/LDPE Blends

The LLDPEs used in this study were polymerized using metallocene or Ziegler–Natta catalysts, along with C4 and/or C6 or C8 as a comonomer. Although the macro-parameters of selected mLLDPE, viz., MFR2.16 (1.0–1.5 g 10 min−1), MWD (<5) and density (918–927 kg m−3), closely matched, the mLLDPEs differed in terms of the type and content of the comonomers. The addition of a comonomer introduced SCB along the backbone of polyethylene chain and also reduced the density of LLDPE. It was demonstrated in a previous study that mLLDPE-3 and mLLDPE-7 might have LCB and/or be hyper-branched in the polymer microstructure [15].
When both LLDPE and LDPE are melt-miscible, then the blend derives a synergistic property performance from both polymers. It has been reported that the branching characteristics of LDPE and LLDPE affect their melt miscibility with high-density polyethylene (HDPE) [18,19]. The melt-phase separation in HDPE/LDPE blends was predicted for high branch contents, i.e., more than 30 SCB/1000C. The HDPE/LLDPE blends were found to microphase-separated when the branch content of LLDPE exceeded 30 SCB/1000C. At 40 SCB/1000C, the two polymers displayed partial microphase separation, and complete microphase separation was observed at 60 SCB/1000C. As seen in Table 2, the branch contents of the LLDPEs used in this report were less than 30 SCB/1000C, while the branch content of the LDPE cannot be accurately measured by NMR techniques. Therefore, the melt miscibility of the LLDPE/LDPE blends was investigated by combinatorial rheological analysis [15].
In Figure 1, the miscibility of LLDPE and LDPE was demonstrated for selected pristine polymers, mLLDPE-1 (2.8 mol.% C4 + C6) and mLLDPE-3 (1.1 mol.% C6), and their respective LDPE blends by Van Gurp–Palmen plots of loss angle vs. complex shear modulus. Figure S1 in the Supplementary Information shows the by Van Gurp–Palmen plots of all the other samples in this study. A descending curve with increasing LDPE content was observed in most mLLDPE/LDPE blends. This demonstrated that Van Gurp–Palmen plots were sensitive to LCB in the polymer microstructure. The pristine mLLDPE matrix with a more linear backbone and only SCB in the microstructure has a higher loss angle, especially at a lower-frequency regime, compared to the LDPE and mLLDPE/LDPE blends, which have a more branched/hyper-branched microstructure. Upon the addition of LDPE, the mLLDPE/LDPE blends showed more viscous behavior and the loss angle of LLDPE matrices was found to decrease. However, mLLDPE-3 showed a qualitatively different behavior compared to the other mLLDPEs and their respective LDPE blends. Pristine mLLPDE-3 and mLLDPE-3/LDPE blends have a lower loss angle compared to other mLLDPE matrices. Furthermore, the loss angle was almost independent of the LDPE concentration (up to 30 wt.%). It can also be noted that ZN-LLDPE showed viscous behavior with a lower loss angle and, furthermore, their respective ZN-LLDPE/LDPE blends have a viscous behavior with a loss angle almost independent of LDPE concentrations (up to 30 wt.%), especially in lower-frequency regimes. A detailed discussion on the sensitivity of Van Gurp–Palmen plots with respect to branch content and type can be found elsewhere [18,19]. Van Gurp–Palmen plots of loss angle vs. complex shear modulus for mLLDPE/LDPE bends might not depend on temperature and on Mw [20,21]. Moreover, it been demonstrated that, for polymers with a narrow MWD, Van Gurp–Palmen plots are sensitive to LCB in the polymer microstructure and show a descending curve with increasing long-chain branching content [17,18,19].
Figure 2 shows the time–temperature superposition (TTS) of the storage modulus (G′) and dynamic modulus (G″) of mLLDPE-2. As can be seen in Figure 2, the curves for pristine mLLDPE-2, measured at 170 °C and 210 °C overlap the curve obtained at 190 °C, which was chosen as the reference temperature. mLLDPE-2 (2.1 mol.% C6) was chosen as a representative example; however, other LLDPEs and LLDPE/LDPE blends also demonstrated a similar behavior, and this indicated that the blends containing up to 30 wt.% LDPE were melt-miscible.
The horizontal shift factors (aT) were used to construct the Arrhenius plot, as shown in Figure 2. The following equation was used to calculate the activation energy:
s l o p e = A c t i v a t i o n   e n e r g y     E a m o l a r   g a s   c o n s t a n t   R
The activation energy was measured for three selected pristine mLLDPEs and their respective blends containing 30 wt.% LDPE (LD30). These mLLDPEs differ in their SCB/1000C content (14.4, 10.8 and 6.1, respectively), while the macro-parameters, namely, density and MFR, were fairly similar. The activation energy (Ea) measured for selected mLLDPE and mLLPDPE/LDPE blends is shown in Table 3. For all investigated samples, the r2 of linear fitting was ≥0.98.
As expected, all the materials showed good linearity in the Arrhenius plot. The super-positioned curves are shown in Figure 2. The activation energy (Ea), as a function of LDPE content in mLLDPE/LDPE blends, is shown in Figure 3.
As can be seen from Figure 3, mLLDPE-3 has a higher activation energy compared to mLLDPE-1 and mLLDPE-2. As discussed previously, rheological analysis of mLLDPE-3 strongly indicated the possible presence of a polymer chain microstructure that mimics LCB behavior [15]. Based on the general rigid bead-rod theory, LLDPE can be considered as a system where ethylene units in the main polymer backbone are set of beads, whose positions, relative to one another, are fixed [22,23]. General rigid bead-rod theory should not be confused with the freely joined chain, where the beads are rigidly separated but joints can rotate freely. In LLDPE, the ethylene units in the main polymer chains can only rotate freely in the segment between branches. Therefore, the branch points on the main polymer chain, viz., SCB or LCB, would act as rigid spheres to restrict the free rotation of ethylene units in the main chain. The SCB content in mLLPDE-1 > mLLDPE-2 > mLLPDE-3, wherein pristine mLLDPE-3 shows the highest activation energy amongst these three mLLDPE matrices, which can be attributed to the restricted rotation of ethylene units due to the LCB present in the microstructure. mLLDPE-2 and mLLPDE-1 showed comparable activation energy levels, as measured by the TTS method.
The activation energy of mLLDPE/LDPE blends was higher than pristine mLLDPE matrices. Therefore, it is postulated that the ethylene units in the main polymer chains can possibly overcome the resistance offered by the SCB, caused by the incorporation of 1-alkenes. However, the energy required to overcome this resistance was too low to be measured by rheological tools. However, ethylene units in the main polymer chains possibly require a higher energy to overcome the resistance offered by LCB in polymer microstructure. Therefore, the activation energy for mLLDPE or mLLDPE/LDPE would be more sensitive to the LCB present in a polymer microstructure than SCB. It can be inferred that LCB would act as a rigid sphere to restrict the free rotation of ethylene units in the main chain in the mLLDPE/LDPE blends.
To summarize, the quiescent rheological response of LLDPE matrices with LCB and/or hyper-branched microstructure, (viz., mLLDPE-3, mLLDPE-7, ZN-LLDPE) and their respective LPDE blends have a qualitatively different behavior than LLDPE matrices without LCB and their respective LPDE blends. The quiescent melt rheological response of mLLDPE/LDPE blends was strongly dictated by the presence of LCB in LLDPE microstructures compared to the SCB present in LLDPE. However, rheological analysis, as described in Figure 1 and Figure 3, remained more qualitative to describe interactions between LLDPE and LDPE. As a next step, the LLDPE/LDPE blends were investigated using thermal tools for quantitative analysis.

3.2. Thermal Characterization of LLDPE/LDPE Blends

The final step during the processing of semi-crystalline polymers into an article would be the crystallization that occurs during cooling. During the crystallization of blends containing two semi-crystalline components, such as LLDPE and LDPE, separate crystallization, concurrent crystallization and co-crystallization modes are possible. For LLDPE/LDPE blends, the crystallizability of both components is similar, so concurrent crystallization can occur when the crystallization temperature ranges overlap. Co-crystallization is only possible when the components are isomorphic or miscible in the amorphous as well as in the crystalline phase. This would be the case for LLDPE/LDPE blends. In both crystallization modes, mixed crystals can result, but in the case of concurrent crystallization, no changes in crystal structure may be induced. Co-crystallization requires chemical compatibility, closely matching chain conformations, lattice symmetry and comparable lattice dimensions [24].
Crystallization is often considered to take place under idealized isothermal conditions. Although this approach greatly simplifies the mathematical and thermodynamic analyses, it fails to account for the real-life, non-isothermal conditions. The continuously varying cooling rate has a significant influence on the final properties for end applications. Therefore, LLDPE/LDPE blends are analyzed under non-isothermal conditions.
Figure 4 shows the DSC heat flow curves of pristine LDPE, selected pristine LLDPE and their selected blends containing 10 and 30 wt.% LDPE measured at (A) an average cooling rate of 20 °C min−1 and (B) an average cooling rate of 2.5 °C min−1. Figure S2 in Supplementary Information shows the DSC heat flow curves of all samples. The crystallization parameters, viz., onset (Ti,c), peak (Tc), end (Tf,c) crystallization temperatures along with the enthalpy of crystallization (ΔHc) of LDPE, pristine LLDPE and their blends containing 20 wt.% LDPE at an average cooling rate of 20 °C min−1 and 2.5 °C min−1 are described in Table 4.

3.2.1. Effect of Cooling Rate

As evident from the DSC thermograms shown in Figure 4 and Figure S2 and Table 4, with an increasing cooling rate, the crystallization exotherm exhibited a broader peak shape and lower Ti,c and Tc. At higher cooling rates, the time interval was shorter, to allow for entangled polymer chains in the melt to align and form nuclei throughout the melt and then grow by the addition of further polymer chains [25]. On the other hand, a rapid decrease in temperature was accompanied by an increase in the viscosity of the polymer melt and, consequently, the transportation of untangled polymer chains to the growth front became more difficult and led to a reduced growth rate [26]. Hence, a higher degree of supercooling, i.e., lower Ti,c and Tc, was required to initiate the crystallization process and the exothermic peaks became broader due to the longer crystallization times at a reduced crystallization rate. As a consequence, the enthalpy of crystallization (ΔHc) decreased with increasing cooling rate.

3.2.2. Effect of Blending LDPE to LLDPE

The three temperature regions for comparing the LLDPE/LDPE blends are:
  • High-temperature crystallization region (100–120 °C) corresponding to crystallization behavior of pristine LLDPE and of LLDPE in the presence of LDPE;
  • Medium-temperature crystallization region (90–110 °C) corresponding to crystallization behavior of LDPE in the presence of LLDPE;
  • Low-temperature region (60–80 °C) corresponding to crystallization behavior of relatively highly branched polymer fraction.
For the high-temperature crystallization region (100–120 °C), the addition of LDPE to LLDPE did not significantly influence the Ti,c of LLDPE/LDPE blends. Tc was found to remain fairly similar (±1.0 °C), i.e., independent of LDPE concentration in blends of mLLDPE-2, mLLDPE-3, mLLDPE-5, mLLDPE-6 and ZN-LLDPE-2. On the contrary, Tc was found to increase in blends of mLLDPE-1, mLLDPE-4, mLLDPE-7, mLLDPE-8 and ZN-LLDPE-1 (by ≥1.5 °C at 20 °C min−1 in LD20 blends). This suggests that the segregation of components takes place during the crystallization process and, for these reported LLDPEs, molten phase-segregated LDPE might act as a nucleating agent, as in previous reports [27,28]. Since this nucleating effect was not observed during crystallization in all LLDPE/LDPE blends, this indicated that the microstructure of LLDPE principally influenced the interaction between the blend components. In the SCB/1000C of LLDPE, the addition of LDPE to LLDPE with SCB/1000C < 12, did not seem to influence Tc. When SCB/1000C of mLLDPE is >12, it has been experimentally demonstrated that the Tc of mLLDPE/LDPE blends is higher than the corresponding mLLDPE. This evidence validates the idea that the mLLDPE microstructure drives the interaction between mLLDPE and LDPE during crystallization.
In the medium-temperature crystallization region (90–110 °C), the effect of blending LDPE in LLDPE was more differentiated at lower cooling rates. Due to the longer crystallization time at a cooling rate of 2.5 °C min−1, separate crystallization, concurrent crystallization and co-crystallization modes were more differentiated in Figure 4 and Figure S2. However, no simple correlation between comonomer content or SCB/1000C was inferred in this temperature region regarding the separate crystallization, concurrent crystallization and co-crystallization modes. In LDPE blends of mLLDPE-1, mLLDPE-4 and ZN-LLDPE-2, the LDPE fraction in their corresponding blends were expected to predominantly undergo co-crystallization, as an exothermic peak/shoulder of LDPE was not clearly observed in this temperature region. Evidence of LDPE co-crystallizing with mLLDPE-1 has been previously reported [15]. However, in LDPE blends of mLLDPE-2 and mLLDPE-3, the LDPE fraction seemed to undergo predominantly concurrent crystallization at different temperature. LDPE blends of mLLDPE-5 and mLLDPE-6 exhibit a small exothermic shoulder in the 90–110 °C region. This could be attributed to both the concurrent and co-crystallization of mLLDPE-5 and mLLDPE-6 with LDPE. In LDPE blends of mLLDPE-7, mLLDPE-8 and ZN-LLDPE-1, a small exothermic peak was observed in the 90–110 °C region that was relatively lower than Tc of pristine LDPE. This indicated the possibility of both concurrent and co-crystallization occurring in mLLDPE-7, mLLDPE-8 and ZN-LLDPE-1 blends.
In the low-temperature region (60–80 °C), when the cooling rate increased from 2.5 °C min−1 to 20 °C min−1, it can be noted that the low-temperature crystallization peak of LDPE decreased from 66.1 °C to 63.3 °C. The low-temperature peak was due to the crystallization of polymer chains containing relatively higher branching [25]. Therefore, due to the highly branched chain structure of LDPE, the corresponding peak observed in this region was more prominent in LDPE than LLDPE. Conversely, a low-temperature crystallization peak in LLDPE was found to be at a higher temperature than LDPE. Furthermore, as the density of LLDPE increased, the area of the low-temperature crystallization peak decreased. It should be highlighted that the low-crystallization peak/shoulder temperature was found to decrease with increasing LDPE content in LLDPE. This is due to the increased branch content in the blends. In the previous study, the pristine LLDPE, LDPE and their blends were subjected to successive self-nucleation and annealing (SSA) protocols, and they were found to co-crystallize based on the LLDPE microstructure [15].
To summarize, thermal analysis under non-isothermal conditions was found to be sensitive to subtle SCB and LCB microstructure differences present in the LLDPE/LDPE blends. For holistic evaluation of various crystallization modes in complex fluids such as the LLDPE/LDPE blends that are frequently encountered in recyclates, it is imperative that both SSA and non-isothermal analysis are required.

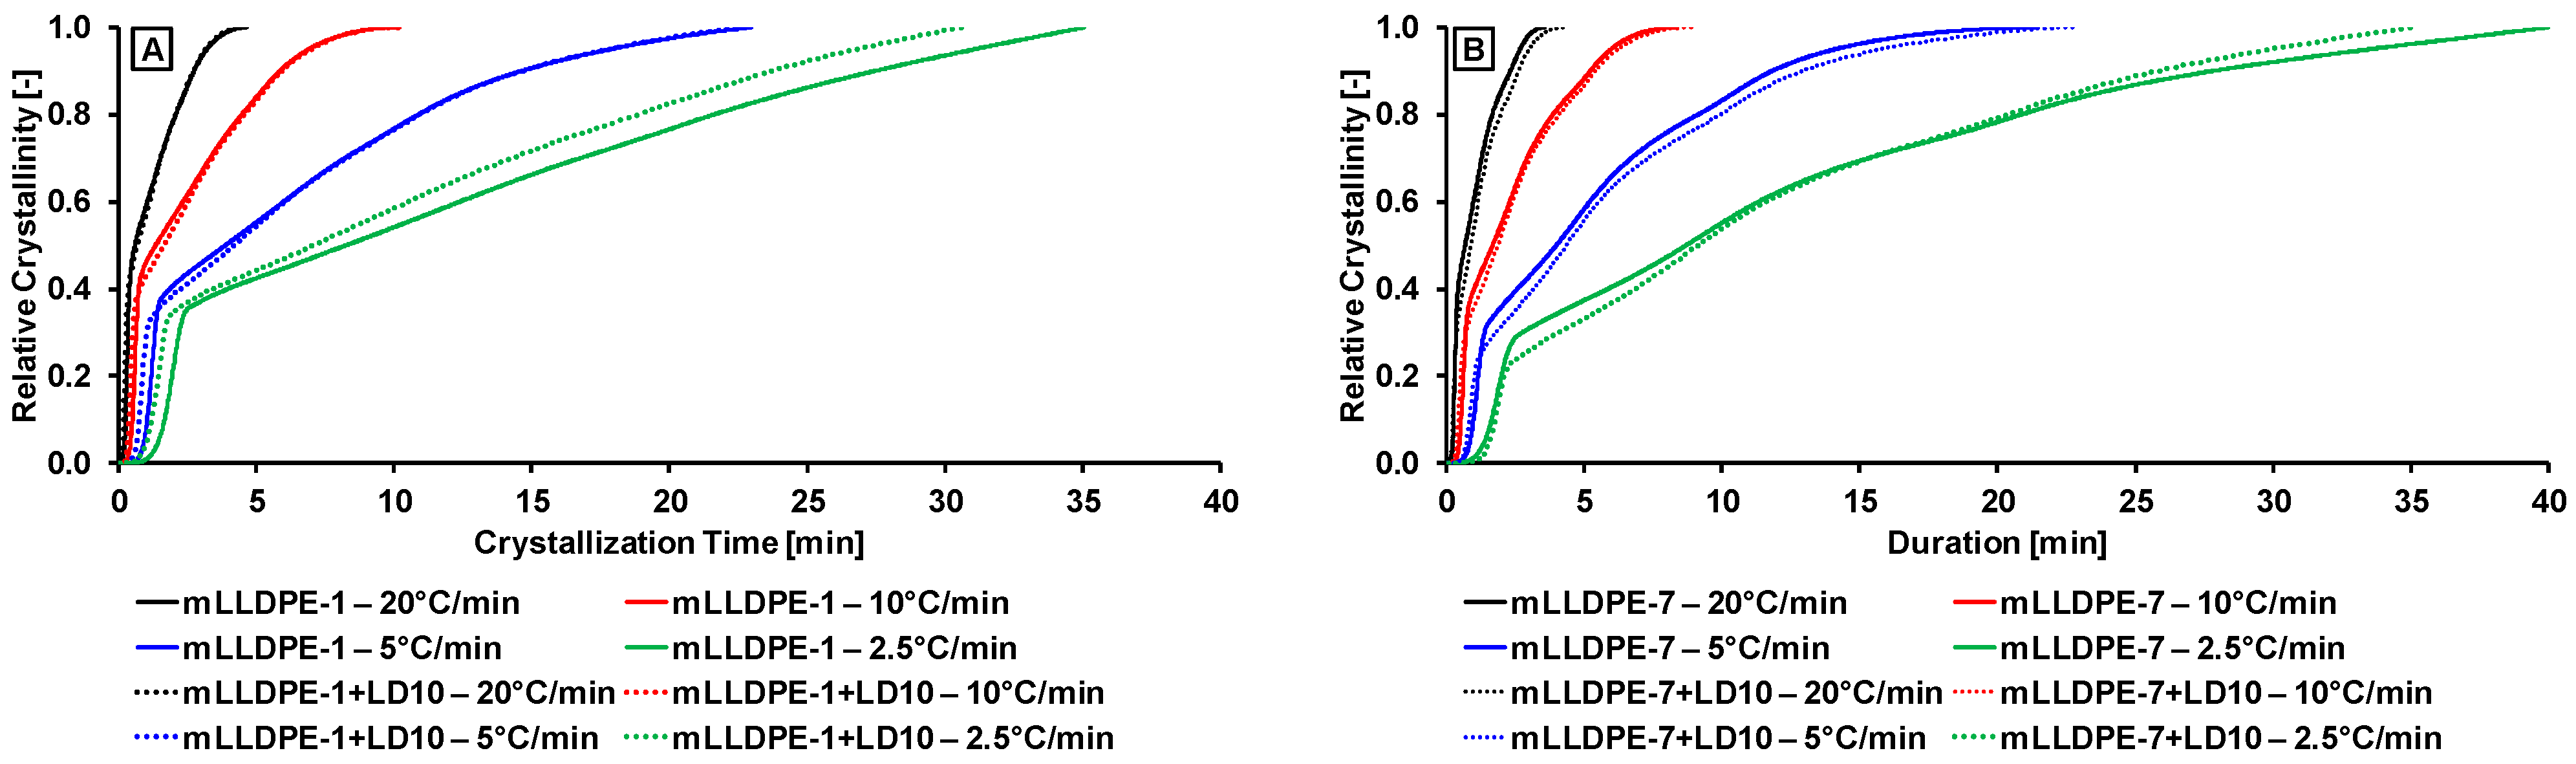
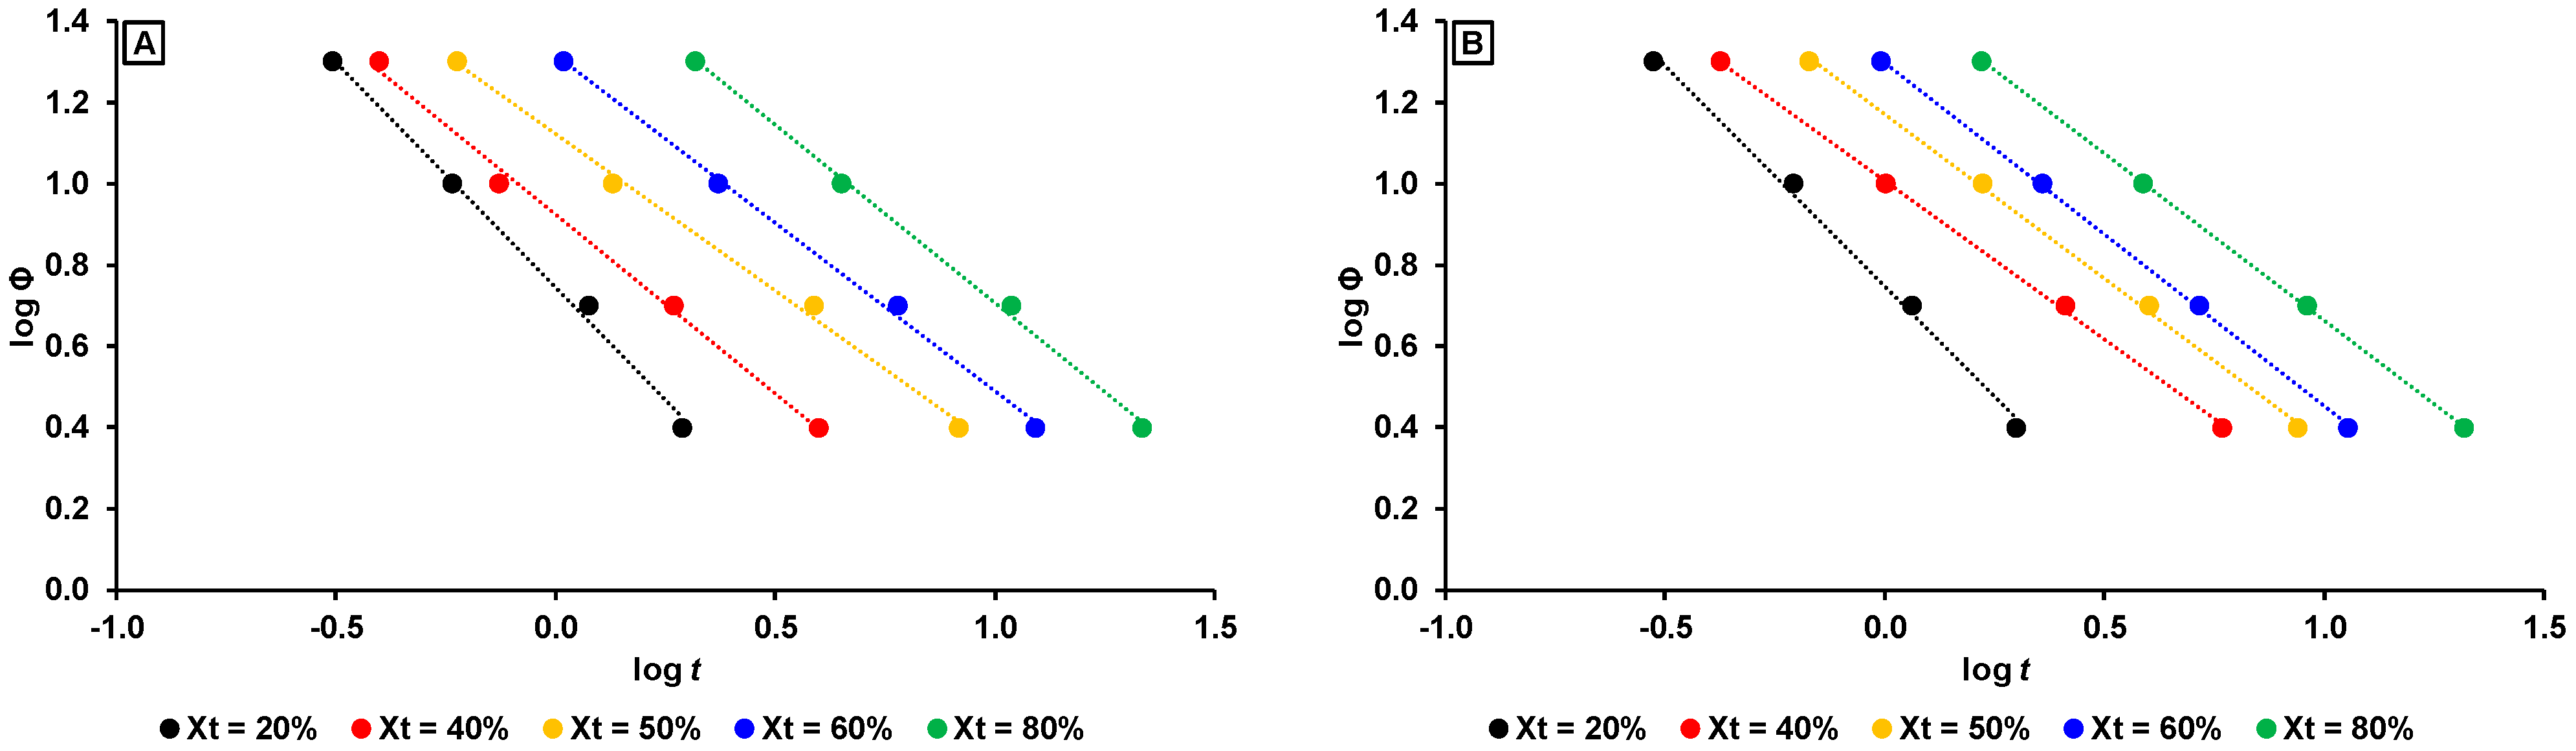
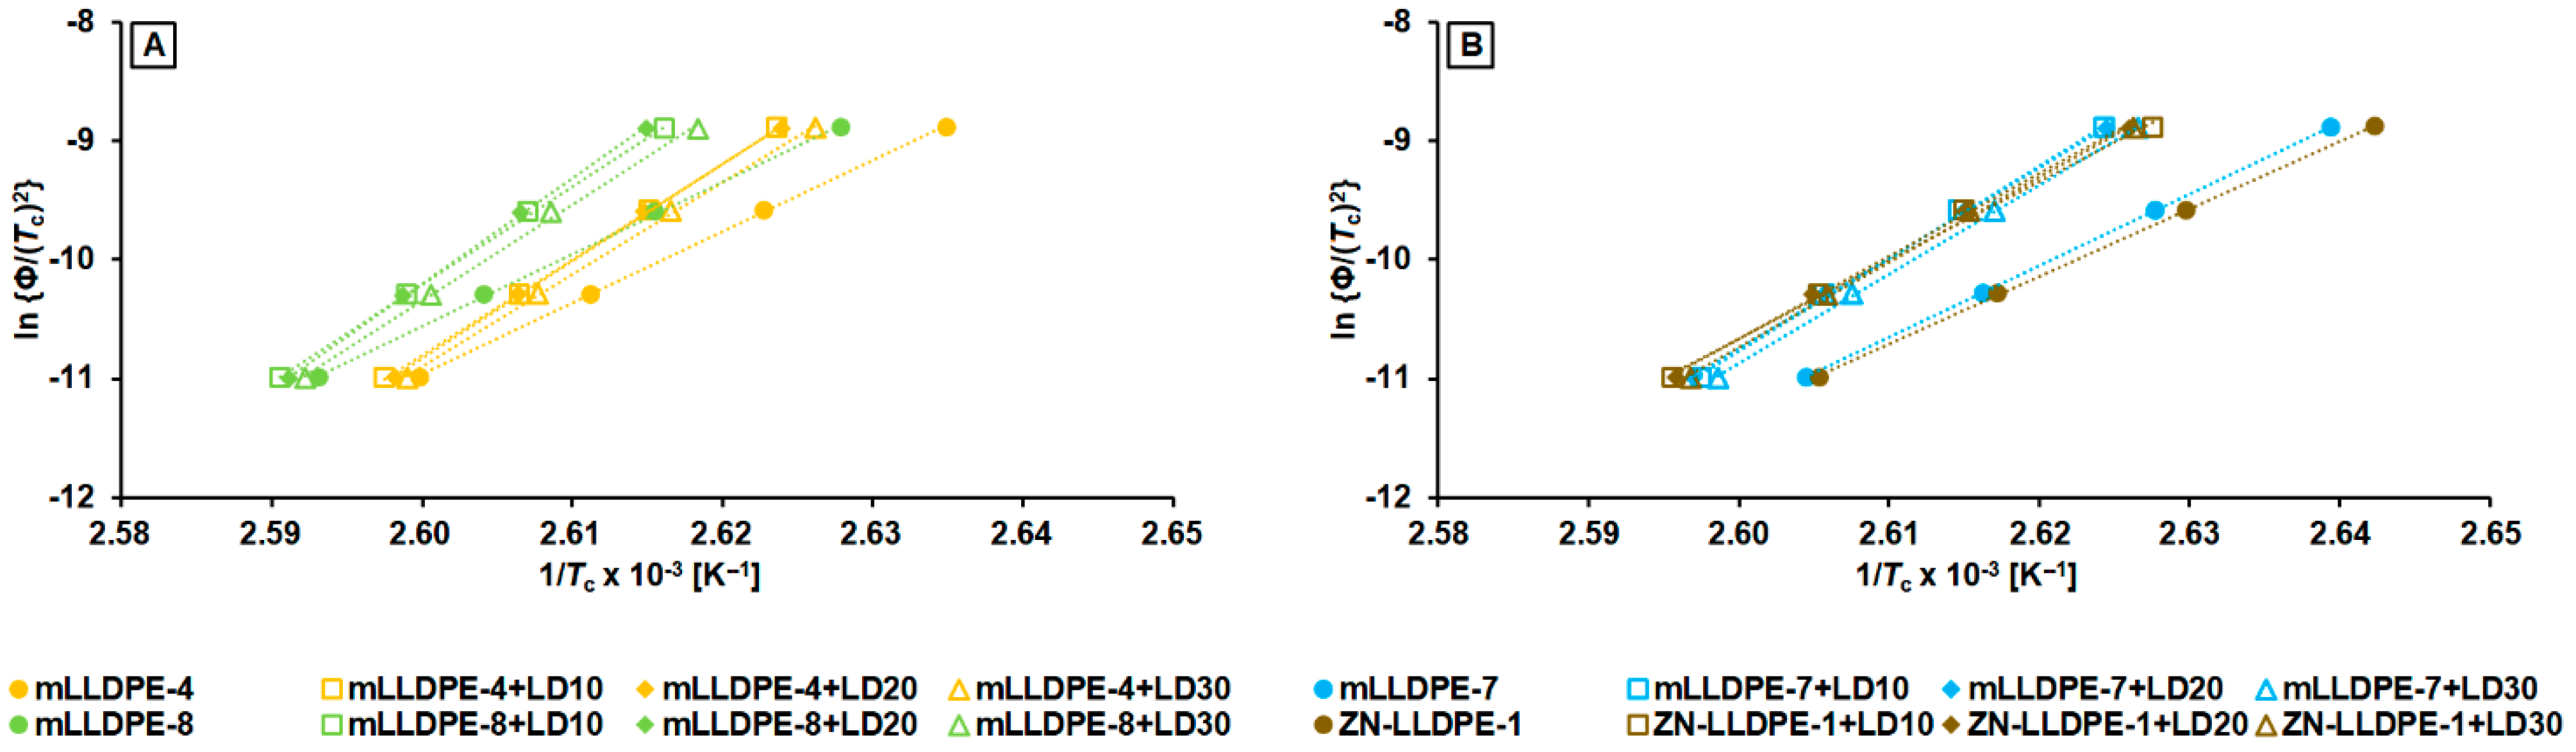
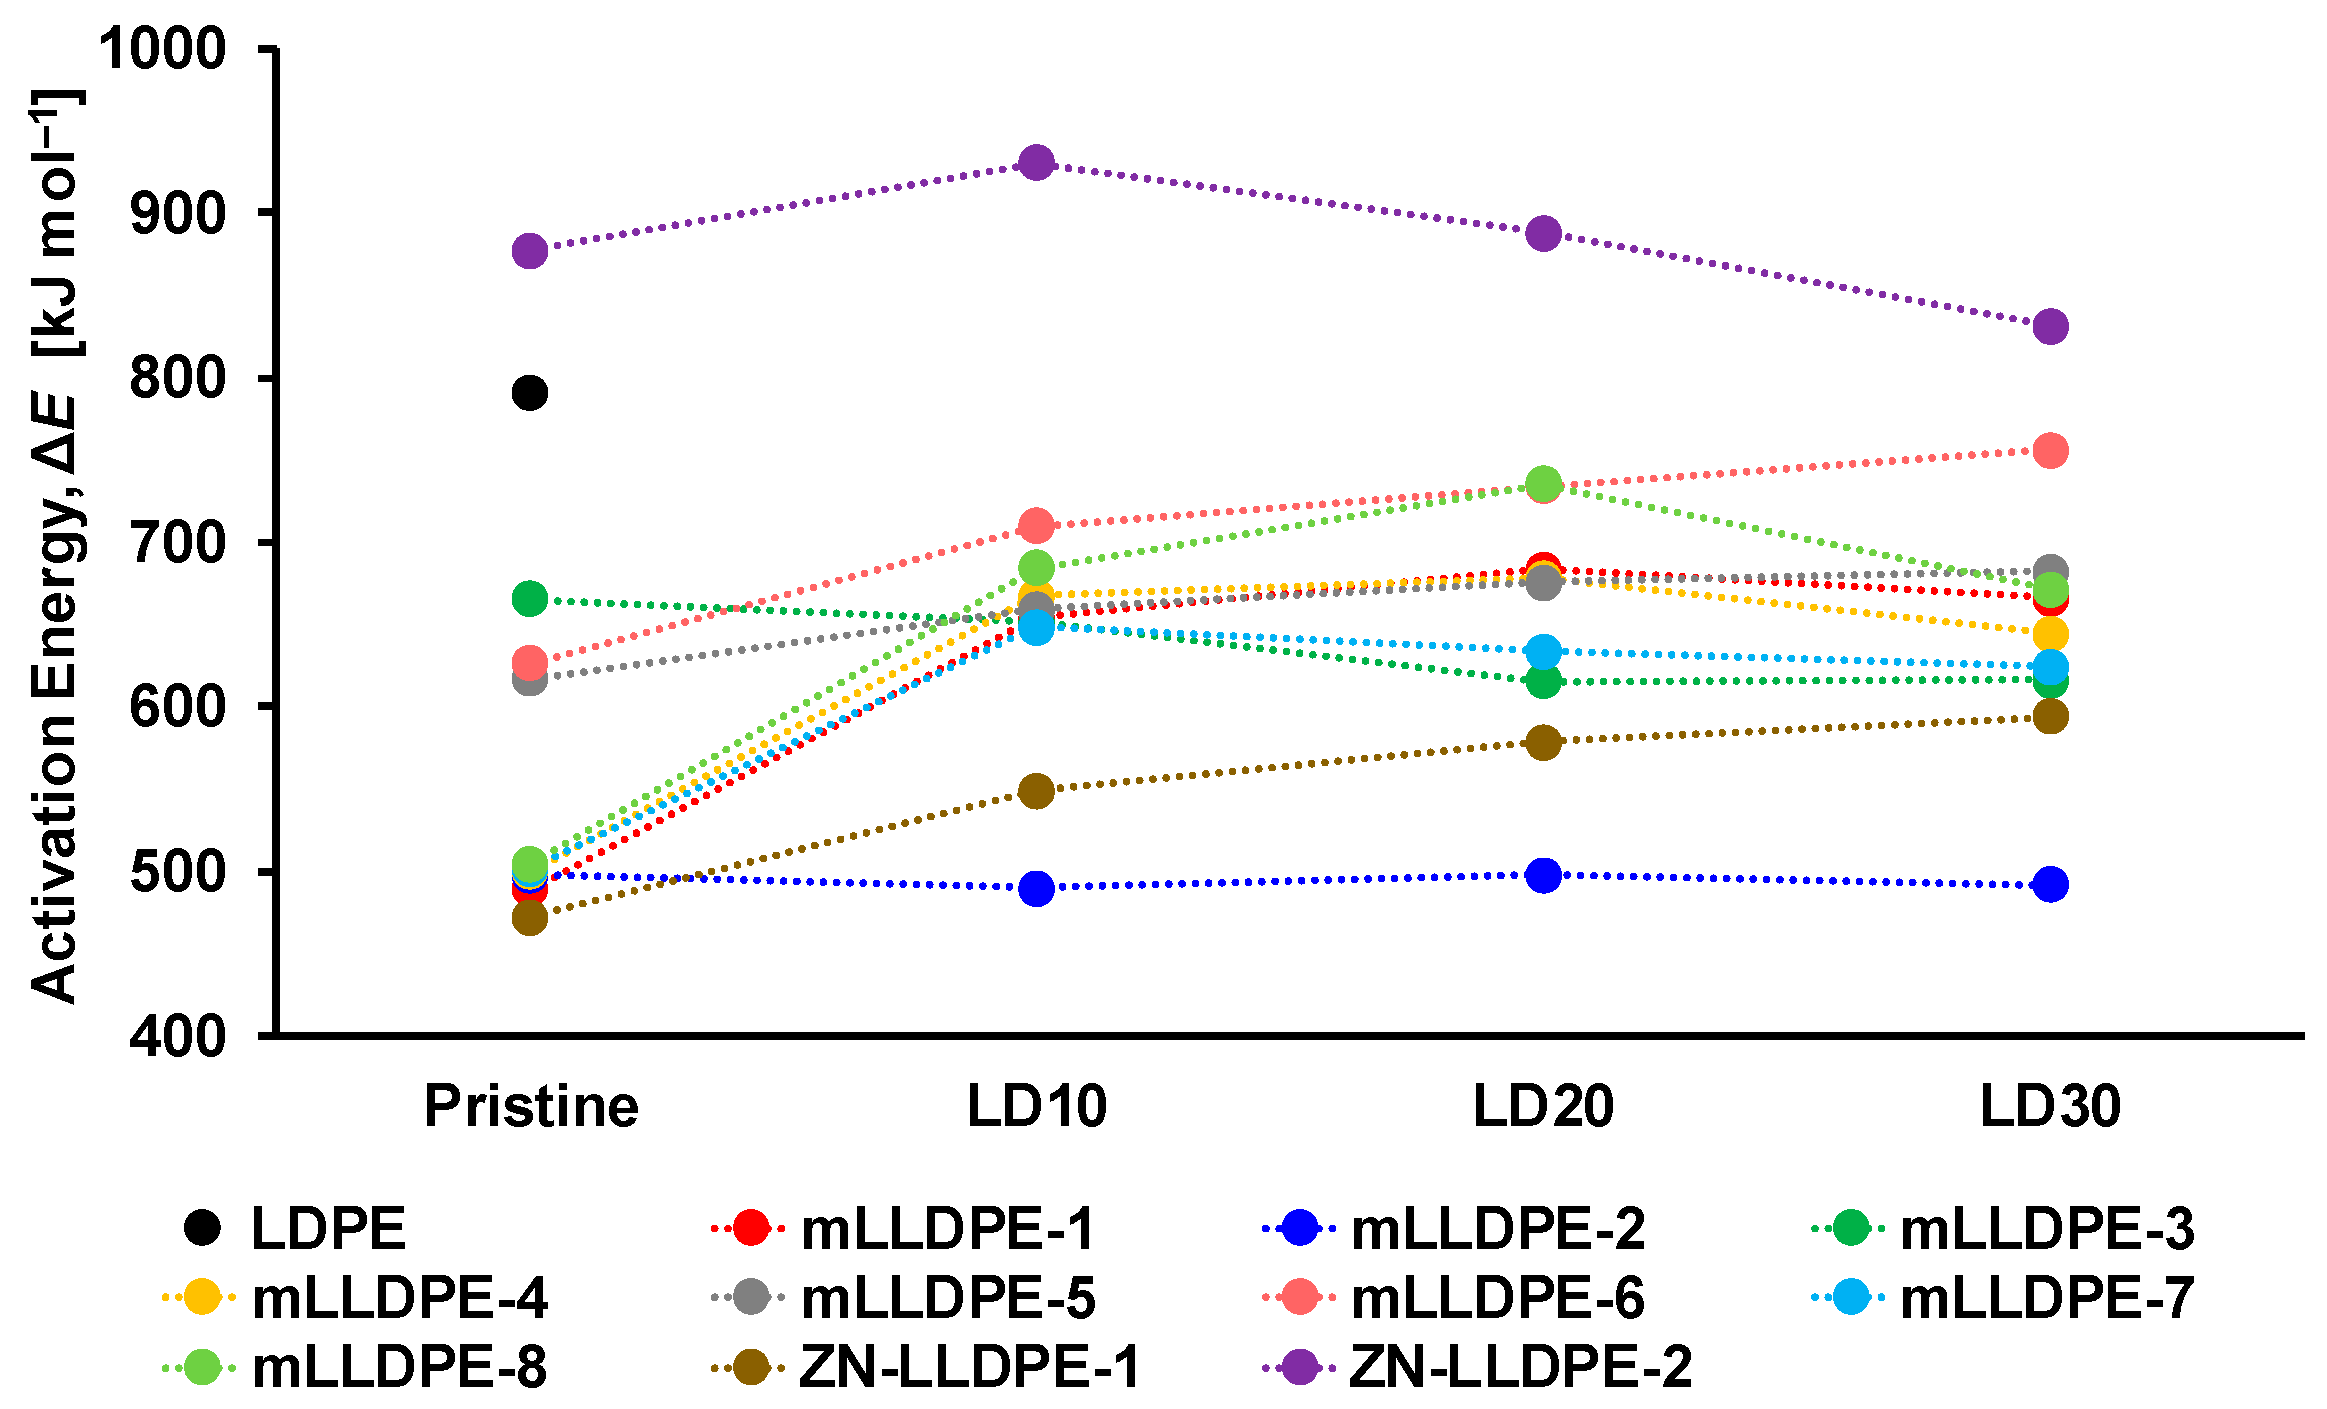
3.2.3. Non-Isothermal Crystallization Kinetics

The effect of addition of LDPE on crystallization behavior of LLDPE was studied under non-isothermal conditions using the Liu–Mo method that combines Avrami and Ozawa equations [29]. In addition, apparent activation energy (ΔE) was calculated based on the Kissinger model [30].
As crystallization is an exothermic process, the relative degree of crystallinity at temperature T was determined by integrating the exothermic peaks using the equation:
X w   = T i , c T d H d t d t T i , c T f , c d H d t d t   ,
where Xw is the relative degree of crystallinity, dH/dt is the rate of heat evolution, T is the temperature at time t, Ti,c is the crystallization onset temperature and Tf,c is the temperature at the end of the crystallization process.
During the non-isothermal crystallization processes, the relationship between crystallization temperature (T) and crystallization time (t) can be represented as:
t = T i , c   T Φ   ,
where Φ is the cooling rate.
Crystallization in semi-crystalline polymers such as polyethylene progresses over time from a disordered phase, usually a melt or dilution state. It is developed in a sigmoid shape, which is divided into primary and secondary crystallization processes. Primary crystallization consists of nucleation, growth of crystal nucleus and spherulitic organizing processes. Primary crystallization represents the interval between the induction time needed for the formation of the nuclei and the half-time of crystallization, t0.5. Secondary crystallization occurs at a slow rate due to spherulites impinging upon each other and this is more pronounced at lower cooling rates.
Using Equation (2), the exotherms of pristine LLDPE, LDPE and their blends were evaluated. Figure 5 shows the relative crystallinity of two selected mLLDPEs and their blends containing 10 wt.% LDPE as function of crystallization time at four cooling rates. Similar plots were obtained for all LLDPE and their LDPE blends. As can be observed in Figure 5, the relative crystallinity as a function of time of neither mLLDPE nor their LDPE blends can be described by sigmoidal function due to the complex secondary crystallization process. With increasing cooling rate, the relative crystallinity at which the transition from primary to secondary crystallization occurred increased. This could be expected when the polymer system does not have sufficient time to crystallize, especially at high cooling rates. Thus, it can be postulated that, even after processing the polymer system into a final article at high cooling rates, the polymer system would not have completed the secondary crystallization process and, hence, it might undergo further crystal refinement at room temperature.
As described earlier in Section 3.1, it was found that chain folding only occurred when there were flexible polymer molecules, whose relatively free rotation about the backbone is possible. A nucleating agent, such as molten LDPE phase, decreased the degree of undercooling required to start the crystallization process, and this is the reason for the increase in Ti,c. However, three-dimensional networks (entanglements) induced by the LDPE droplets may obstruct the chain folding crystals, and thus the growth rate, thereby retarding the overall crystallization rate. Hence, t0.5 and t would become longer.
Utilizing a model to fit these experimental results allows for better descriptions of the kinetics of non-isothermal behavior. Several models have been proposed to describe non-isothermal crystallization kinetics [25]. Among these models, the Liu–Mo model was the most successful in explaining non-isothermal kinetics at both lower and higher degrees of crystallinity [29]. The Liu–Mo model proposed a new approach to describe non-isothermal crystallization kinetics by combining the Avrami equation:
X t = 1 exp Z t t n ,
with a modified Ozawa equation:
X t = 1 exp K T / Φ m ,
where Xt of the Avrami equation is a time-dependent relative degree of crystallinity, exponent n is the Avrami mechanism constant, Zt is the crystallization rate constant, t is crystallization time, KT stands for the Ozawa crystallization rate constant as a function of temperature, exponent m is the Ozawa index and Φ is the cooling rate. Rearranging and combining the Ozawa and Avrami equations leads to a kinetic equation that provides a relationship between Φ and T:
log Z t + n log t = log K T m   log Φ ,
and Equation (6) can be further rewritten as:
log Φ = log F T a log t ,
where the parameter F T = K T / Z t 1 / m is the cooling or heating rate required to achieve a certain degree of crystallization at a unit crystallization time and a is the ratio of the Avrami exponent n to the Ozawa exponent m, i.e., a = n/m. Parameters FT and a can be determined from the intercept and slope of the plot of log Φ vs. log t, respectively, as shown in Figure 6. Similar plots were obtained for all samples and only mLLDPE-1 and mLLDPE-7 (2.8 mol.% C8) were shown as representative examples. The series of straight lines indicated that this model was highly effective in describing the non-isothermal crystallization kinetics of LLDPE and LDPE blends, and subtle differences between pristine LLDPE and their LDPE blends have been captured using the Liu–Mo model.
Figure 7 and Figure S3 summarize the parameter FT as a function of the four degrees of crystallinity. FT represented the cooling rate required for every sample to achieve a certain degree of relative crystallinity. FT is proportional to the relative degree of crystallinity, indicating that, at a certain unit crystallization time, Xt can be increased by accelerating the cooling rate, so the degree of the crystal refinement increased as the crystallization processes progressed. The lower the FT parameter, the higher the rate of crystallization of the investigated polymer system. It must be highlighted that onset of crystallization temperatures is not considered in most crystallization kinetics models. Therefore, comparing the crystallization kinetics of polymer systems with significantly different Ti,c should be carried out with precaution, as Ti,c at onset of crystallization t0 were not identical,.
At a high degree of crystallinity, only minor differences in the rate of crystallization between pristine mLLDPE and their blends containing LDPE were observed. Additionally, these blends can be classified as:
  • mLLDPE with SCB/1000C < 12, (viz., mLLDPE-2, mLLDPE-3, mLLDPE-5 and mLLDPE-6): For these mLLDPE matrices, blending with LDPE did not significantly influence Ti,c and Tc of mLLDPE. Their LPDE blends tend to crystallize faster than LDPE. In these blends, concurrent and/or separate crystallization was found to be the more preferred mode than co-crystallization of mLLDPE and LDPE.
  • mLLDPE with SCB/1000C > 12, (viz., mLLDPE-1, mLLDPE-4, mLLDPE-7 and mLLDPE-8): For these mLLDPE matrices, blending with LDPE did significantly influence Ti,c and Tc of mLLDPE. Their LPDE blends tend to crystallize slower than LDPE. In these blends, co-crystallization was found to be the more preferred mode than concurrent and/or separate crystallization of mLLDPE and LDPE.
The overall crystallization time increased when the co-crystallization of linear LLDPE with LDPE chains containing relatively lower branch content occurred at higher temperatures. This led to the exclusion of more branched polymer chains in the blend components from participating in the crystallization process at higher temperature, and they tended to crystallize at a lower temperature. Hence, during crystallization, the complex interaction between mLLDPE and LDPE has been experimentally demonstrated for the first time for a wide range of mLLDPE based on both SCB and LCB content. Although blending up to 30 wt.% LDPE increased Ti,c and Tc, it did not simultaneously increase the crystallization rate of mLLDPE/LDPE blends. Therefore, based on the microstructure of mLLDPE, the molten LDPE phase acts either as a nucleating agent (increase in Ti,c, Tc) or as a crystallization-rate-promoting agent (decrease in t). For ZN-LLDPE matrices, the study included only matrices that had a comparable SCB/1000C (<12), so it was not possible to comment on the SCB threshold of ZN-LLDPE matrices. The interaction with LDPE is expected to be even more complex in ZN-LLDPE/LDPE blends, given that SCB distribution in ZN-LLDPE is known to be heterogeneous [4,5,6]. To summarize, unlike the melt state rheological response, the quasi-melt response, as measured by thermal analysis, was distinctly different under non-isothermal conditions and sensitive to both SCB and LCB present in the LLDPE/LDPE blends.
The Liu–Mo model allowed for a comparison of crystallization kinetics at an iso-degree of crystallinity. To obtain further insights into the effect of the LLDPE microstructure on the behavior of pristine LLDPE and their LDPE blends at Tc, when the crystallization rate is the highest, the crystallization exotherms were further evaluated. At a given cooling rate, the relative degree of crystallinity at Tc ranged between 8% and 30% for all the pristine LLDPEs and LLDPE/LDPE blends. Using the following Kissinger equation, the apparent activation energy (ΔE) required for the molecular chains to transported from the melt state to the growing crystal surface, in non-isothermal systems, was calculated as follows [30]:
d l n Φ T c 2 d 1 T c = Δ E R ,
where R is the universal gas constant. The activation energy is obtained from the slope of the lines in a l n Φ T c 2 versus 1 T c plot, and plots are shown in Figure 8 for mLLDPE-4 and mLLDPE-8 (C4 comonomer) and mLLDPE-7 and ZN-LLDPE-1 (C8 comonomer) and their respective blends containing LDPE. For all samples, the r2 of linear fit was ≥0.99.
In a recent review, Vyazovkin stated that the simplicity of the Kissinger method is considerably offset by the number of problems that result from underlying assumptions [31]. The assumption of a first-order reaction introduces a certain evaluation error that may become very large when applying temperature programs other than linear heating. However, in this study, only linear heating/cooling programs were employed. Within the limitations of the Kissinger method, the apparent activation energy, in semi-quantitative/comparative terms, was used to gain additional insights into the effect of LLDPE microstructure on the behavior of pristine LLDPE and their LDPE blends at Tc.
The activation energy of all pristine LLDPEs and their LDPE blends were plotted as a function of LDPE content, and this is shown in Figure 9. It can be observed that, except ZN-LLDPE-2, ΔE of all other pristine LLDPEs were higher than LDPE. The dashed line in Figure 8 represents the changes in ΔE as a function of LDPE content in the blends. The ΔE of mLLDPE-2, mLLDPE-3, mLLDPE-5 and ZN-LLDPE-2 blends were found to be weakly dependent (±10% of pristine LLDPE) on LDPE concentration. On the other hand, mLLDPE-1, mLLDPE-4, mLLDPE-6, mLLDPE-7, mLLDPE-8 and ZN-LLDPE-1 blends with LDPE showed an increase in ΔE compared to their respective pristine LLDPEs. Although LDPE acts as a nucleating agent for several mLLDPEs, a higher activation energy has been observed for their blends. The higher the activation energy, the more difficult the transportation of polymer chains to the growing crystal surface [32,33,34].

4. Conclusions

The non-isothermal response of LLDPE/LDPE blends is complex, and requires detailed investigations, as they are critical for PCR. The microstructure of mLLDPE predominantly influenced the interaction between mLLDPE and LDPE. The SCB/1000C = 12 in mLLDPE was found to be critical in influencing the crystallization behavior of mLLDPE/LDPE blends. Based on the mLLDPE microstructure, it was determined that the molten LDPE phase acts either as a nucleating agent or a crystallization-rate-promoting agent, as evaluated using the Liu–Mo model.
The rheological measurements demonstrated that mLLDPE matrices were melt-miscible with LDPE, as indicated by the Van Gurp–Palmen plot. The melt state rheological response of the mLLDPE/LDPE blends was strongly dictated by the presence of LCB in the LLDPE microstructure compared to the SCB present in the LLDPE matrix. Furthermore, both rheological and thermal analyses showed that a higher activation energy is required for the reptation or movement of polymer chains in a highly branched microstructure with LCB compared to the more linear microstructure obtained with SCB. The quasi-melt response of modelled LLDPE/LDPE blends measured by thermal analysis under non-isothermal conditions was sensitive to both SCB and LCB. For a holistic evaluation of complex fluids, especially the LLDPE/LDPE blends that are frequently encountered in PCR, it is imperative that non-isothermal thermo-rheological behavior is understood for enhanced recycling.

Supplementary Materials

The following supporting information can be downloaded at: https://www.mdpi.com/article/10.3390/macromol2020011/s1, Figure S1. Van Gurp-Palmen plots of loss factor δ vs complex shear modulus G* of all samples obtained from frequency sweep tests. Figure S2. DSC heat flow curves as a function of temperature of pristine LDPE, pristine LLDPE and their blends containing 10 and 30 wt.% LDPE measured at (A) an average cooling rate of 20 °C min−1 and (B) an average cooling rate of 2.5 °C min−1. Figure S3. Parameter FT as a function of the degree of crystallinity for pristine LLDPE, LDPE and their respective LD blends.

Author Contributions

Conceptualization, G.G. and S.K.K.; methodology, G.G. and S.K.K.; formal analysis, S.K.K. and T.P.; investigation, S.K.K. and T.P.; data curation, S.K.K. and G.G.; writing—original draft preparation, G.G. and S.K.K.; writing—review and editing, G.G., S.K.K. and T.P. All authors have read and agreed to the published version of the manuscript.

Funding

This research received no external funding.

Institutional Review Board Statement

Not applicable.

Informed Consent Statement

Not applicable.

Data Availability Statement

Not applicable.

Acknowledgments

Authors would like acknowledge support of Felice De Santis, Anwar Roa and Sushil Chenoli Komath for rheological measurements.

Conflicts of Interest

The authors declare no conflict of interest.

References

  1. Steffl, T. Rheological and Film Blowing Properties of Various Low Density Polyethylenes and Their Blends. Ph.D. Thesis, Universität Erlangen-Nürnberg, Erlangen, Germany, June 2004. [Google Scholar]
  2. Simanke, A.G.; Galland, G.B.; Baumhardt, R.; Quijada, R.; Mauler, R.S. Influence of the type and the comonomer contents on the mechanical behavior of ethylene/α-olefin copolymers. J. Appl. Polym. Sci. 1999, 74, 1194–1200. [Google Scholar] [CrossRef]
  3. Usami, T.; Gotoh, Y.; Takayama, S. Generation mechanism of short-chain branching distribution in linear low-density polyethylene. Macromolecules 1986, 19, 2722–2726. [Google Scholar] [CrossRef]
  4. Munstedt, H.; Kurzbeck, S.; Egersdorfer, L. Influence of molecular structure on rheological properties of polyethylenes. Rheol. Acta 1998, 37, 21–29. [Google Scholar] [CrossRef]
  5. Wignal, G.D.; Alamo, R.G.; Ritchson, E.J.; Mandelkern, L.; Schwahn, D. SANS studies of liquid− liquid phase separation in heterogeneous and metallocene-based linear low-density polyethylenes. Macromolecules 2001, 34, 8160–8165. [Google Scholar] [CrossRef]
  6. Hussein, I.A.; Williams, M.C. Rheological Study of the Influence of Branch Content on the Miscibility of Octene m-LLDPE and ZNLLDPEin LDPE. Polym. Eng. Sci. 2004, 44, 660–672. [Google Scholar] [CrossRef]
  7. Knuuttila, H.; Lehtinen, A.; Nummila-Pakarinen, A. Advanced polyethylene technologies—Controlled material properties. In Long Term Properties of Polyolefins; Springer: Berlin/Heidelberg, Germany, 2004; pp. 13–28. [Google Scholar]
  8. Malpass, D.B. An overview of industrial polyethylene processes. In Introduction to Industrial Polyethylene: Properties, Catalysts, Processes; Scrivener Publishing LLC: Beverly, MA, USA, 2010; pp. 71–82. [Google Scholar]
  9. Hussein, I.A. Influence of composition distribution and branch content on the miscibility of m-LLDPE and HDPE blends: Rheological investigation. Macromolecules 2003, 36, 2024–2031. [Google Scholar] [CrossRef]
  10. Hussein, I.A.; Hameed, T.; Abu Sharkh, B.F.; Mezghani, K. Miscibility of hexene-LLDPE and LDPE blends: Influence of branch content and composition distribution. Polymer 2003, 44, 4665–4672. [Google Scholar] [CrossRef] [Green Version]
  11. Pérez, R.; Rojo, E.; Fernández, M.; Leal, V.; Lafuente, P.; Antamaría, A.S. Basic and applied rheology of m-LLDPE/LDPE blends: Miscibility and processing features. Polymer 2005, 46, 8045–8053. [Google Scholar] [CrossRef]
  12. Delgadillo-Velázquez, O.; Hatzikiriakos, S.G.; Sentmanat, M. Thermorheological properties of LLDPE/LDPE blends. Rheol. Acta 2008, 47, 19–31. [Google Scholar] [CrossRef]
  13. Mamun, A.; Chen, X.; Alamo, R.G. Interplay between a strong memory effect of crystallization and liquid–liquid phase separation in melts of broadly distributed ethylene–1-alkene copolymers. Macromolecules 2014, 47, 7958–7970. [Google Scholar] [CrossRef]
  14. Groeninckx, G.; Vanneste, M.; Everaert, V. Crystallization, morphological structure and melting of polymer blends. In Polymer Blends Handbook; Utracki, L.A., Ed.; Kluwer Academic Publishers: Alphen aan den Rijn, The Netherlands, 2003; pp. 215–240. [Google Scholar]
  15. Galgali, G.; Kaliappan, S.K. Microstructure–sealing performance linkage of metallocene linear low density polyethylene and low density polyethylene blends. Polym. Cryst. 2021, 4, e10206. [Google Scholar] [CrossRef]
  16. ISO 6721-10:2015; Plastics—Determination of Dynamic Mechanical Properties—Part 10: Complex Shear Viscosity Using a Parallel-Plate Oscillatory Rheometer. International Organization for Standardization: Geneva, Switzerland, 2015.
  17. ISO 11357-3:2018; Plastics—Differential Scanning Calorimetry (DSC)—Part 3: Determination of Temperature and Enthalpy of melting and Crystallization. International Organization for Standardization: Geneva, Switzerland, 2018.
  18. Fan, Z.J.; Williams, M.C.; Choi, P.A. molecular dynamics study of the effects of branching characteristics of LDPE on its miscibility with HDPE. Polymer 2002, 43, 1497–1502. [Google Scholar] [CrossRef]
  19. Abu-Sharkh, B.F.; Giri, A.M.; Hussein, I.A. Influence of branch content on the microstructure of blends of linear and octene-branched polyethylene: A MD simulation study. Eur. Polym. J. 2004, 40, 1177–1182. [Google Scholar] [CrossRef]
  20. Van Gurp, M.; Palmen, J. Time-temperature superposition for polymeric blends. J. Rheol. Bull. 1998, 67, 5–8. [Google Scholar]
  21. Hatzikiriakos, S.G. Long chain branching and polydispersity effects on the rheological properties of polyethylenes. Polym. Eng. Sci. 2000, 40, 2279–2287. [Google Scholar] [CrossRef]
  22. Kanso, M.A.; Giacomin, A. Van Gurp–Palmen relations for long-chain branching from general rigid bead-rod theory. J. Phys. Fluids 2020, 32, 033101-15. [Google Scholar] [CrossRef]
  23. Hassager, O. Kinetic theory and rheology of bead—Rod models for macromolecular solutions. II. Linear unsteady flow properties. J. Chem. Phys. 1974, 60, 4001–4008. [Google Scholar] [CrossRef]
  24. Olabishi, O.; Robeson, L.M.; Shaw, M.Y. Polymer-Polymer Miscibility; Academic Press: New York, NY, USA, 1979; pp. 105–133. [Google Scholar]
  25. Mandelkern, L. Crystallisation of Polymers: Volume 2. Kinetics and Mechanisms; Cambridge University Press: Cambridge, UK, 2004; pp. 67–96. [Google Scholar]
  26. Young, R.J.; Lovell, P.A. Introduction to Polymers; CRC Press: New York, NY, USA, 2011; pp. 168–186. [Google Scholar]
  27. Yamaguchi, M.; Abe, S. LLDPE/LDPE blends. I. Rheological, thermal, and mechanical properties. J. Appl. Polym. Sci. 1999, 74, 3153–3159. [Google Scholar] [CrossRef]
  28. Sweed, M. Co-Crystallization in Polyolefin Blends Studied by Various Crystallization Analysis Techniques. Master’s Thesis, University of Stellenbosch, Stellenbosch, South Africa, April 2006. [Google Scholar]
  29. Liu, T.; Mo, Z.; Wang, S.; Zhang, H. Nonisothermal melt and cold crystallization kinetics of poly (aryl ether ether ketone ketone). Polym. Eng. Sci. 1997, 37, 568–575. [Google Scholar] [CrossRef]
  30. Kissinger, H.E. Variation of peak temperature with heating rate in differential thermal analysis. J. Res. Natl. Bur. Stand. 1956, 57, 217–221. [Google Scholar] [CrossRef]
  31. Vyazovkin, S. Kissinger Method in Kinetics of Materials: Things to Beware and Be Aware of. Molecules 2020, 25, 2813. [Google Scholar] [CrossRef]
  32. Kim, H.J.; Lee, J.J.; Kim, J.; Kim, Y.C. Effect of starch content on the non-isothermal crystallization behavior of HDPE/silicate nanocomposites. J. Ind. Eng. Chem. 2010, 16, 406–410. [Google Scholar] [CrossRef]
  33. Jin, J.; Chen, S.J.; Zhang, J. Non-isothermal crystallization kinetics of partially miscible ethylene-vinyl acetate copolymer/low density polyethylene blends. Express Polym. Lett. 2010, 4, 141–152. [Google Scholar] [CrossRef]
  34. Abareshi, M.; Zebarjad, S.M.; Goharshadi, E.K. Non-isothermal crystallization kinetics of polyethylene–clay nanocomposites prepared by high-energy ball milling. Bull. Mater. Sci. 2004, 37, 1113–1121. [Google Scholar] [CrossRef] [Green Version]
Figure 1. Van Gurp–Palmen plots of loss angle (δ) vs. complex shear modulus (G*) of selected LLDPEs, LDPE and their blends, obtained from frequency sweep tests.
Macromol 02 00011 g001
Figure 2. Time–temperature superposition (TTS) curves of storage modulus (G′) and dynamic modulus (G″) for mLLDPE-2.
Macromol 02 00011 g002
Figure 3. Activation energy using TTS method for pristine LLDPE and mLLDPE/LDPE.
Macromol 02 00011 g003
Figure 4. DSC heat flow curves of pristine LDPE, pristine mLLDPE-1 (top), pristine mLLDPE-5 (bottom) and their blends containing 10 and 30 wt.% LDPE measured at (A) an average cooling rate of 20 °C min−1 and (B) an average cooling rate of 2.5 °C min−1.
Macromol 02 00011 g004
Figure 5. Relative crystallinity of (A) mLLDPE-1 and mLLDPE-1 + LD10 as function of crystallization time at four different cooling rates and (B) mLLDPE-7 and mLLDPE-7 + LD10 as function of crystallization time at four different cooling rates.
Macromol 02 00011 g005
Figure 6. Plot of log Φ vs. log t of (A) mLLDPE-1 and (B) mLLDPE-7 at various time-dependent relative degree of crystallinity, Xt = 20%, 40%, 50%, 60% and 80%.
Macromol 02 00011 g006
Figure 7. Parameter FT as a function of the degree of crystallinity for selected pristine LLDPE (mLLDPE-5, mLLDPE-6, mLLDPE-7 and mLLDPE-8), LDPE and their respective LD blends.
Macromol 02 00011 g007
Figure 8. Plot of l n Φ T c 2 versus 1 T c of (A) mLLDPE-4, mLLDPE-8 and their blends containing LDPE and (B) mLLDPE-7, ZN-LLDPE-1 and their blends containing LDPE.
Macromol 02 00011 g008
Figure 9. Activation energy ΔE of pristine LLDPEs and LLDPE/LDPE blends.
Macromol 02 00011 g009
Table 1. Technical properties of LLDPE and LDPE used in the blends.
SampleMFR2
[g 10 min−1]
Density
[kg m−3]
Mn
[kg mol−1]
Mw
[kg mol−1]
MWD = Mw/Mn
[-]
SHI(1/100)
[-]
LDPE2.0923171086.327.4
mLLDPE-11.5918251044.22.0
mLLDPE-21.0918321133.51.5
mLLDPE-31.0920241144.77.4
mLLDPE-41.0918261184.62.7
mLLDPE-51.3927281073.91.5
mLLDPE-61.3927241064.41.8
mLLDPE-71.0918251054.24.5
mLLDPE-81.5918271114.11.7
ZN-LLDPE-10.9919231195.13.7
ZN-LLDPE-20.29311119218.210.2
Table 2. NMR analysis of pristine LLDPE resins.
SampleComonomer Type
[-]
Total Comonomer Content
[mol.%]
SCB/1000C
[-]
mLLDPE-1C4 + C62.814.4
mLLDPE-2C62.110.8
mLLDPE-3C61.16.1
mLLDPE-4C43.518.1
mLLDPE-5C61.16.2
mLLDPE-6C4 + C61.47.8
mLLDPE-7C82.514.1
mLLDPE-8C44.221.7
ZN-LLDPE-1C82.110.8
ZN-LLDPE-2C4 + C62.011.9
Table 3. Average activation energy (Ea) calculated at 190 °C for representative samples.
SampleEa
[kJ mol−1]
mLLDPE-136.4
mLLDPE-1 + LD3040.2
mLLDPE-235.0
mLLDPE-2 + LD3037.3
mLLDPE-3 39.8
mLLDPE-3 + LD3043.2
Table 4. Crystallization parameters of LDPE, pristine LLDPE and their blends containing 20 wt.% LDPE.
Sample20 °C min−12.5 °C min−1
Ti,c [°C]Tc [°C]Tf,c [°C]ΔHc [J g−1]Ti,c [°C]Tc [°C]Tf,c [°C]ΔHc [J g−1]
LDPE105.6100.927.3130.6108.3104.010.9159.5
mLLDPE-1112.5106.619.4129.8116.7111.929.0155.4
mLLDPE-1 + LD20113.0108.921.8130.6116.5112.638.1156.2
mLLDPE-2115.2107.139.5118.6118.1112.329.9138.1
mLLDPE-2 + LD20114.9107.137.7121.3118.7112.235.9151.8
mLLDPE-3107.7103.242.9115.9110.5107.019.7137.0
mLLDPE-3 + LD20108.3103.228.1133.5110.6107.319.5148.4
mLLDPE-4111.9106.428.6120.9115.8111.527.6135.6
mLLDPE-4 + LD20112.2108.024.4121.0115.9111.711.0158.2
mLLDPE-5116.3110.939.9121.7119.0115.140.3135.9
mLLDPE-5 + LD20116.4111.136.5139.5119.6114.940.7157.4
mLLDPE-6113.7109.231.5142.6116.4113.327.7167.6
mLLDPE-6 + LD20113.4109.633.6143.9116.5113.235.3163.4
mLLDPE-7111.4105.739.9110.6115.4110.815.4129.2
mLLDPE-7 + LD20112.4107.930.5117.0115.2111.934.7149.0
mLLDPE-8114.2107.423.1125.5116.5112.521.2139.6
mLLDPE-8 + LD20113.5109.324.9128.8116.3112.824.4149.6
ZN-LLDPE-1111.5105.328.3126.2117.2110.725.7144.8
ZN-LLDPE-1 + LD30112.7107.722.6131.1115.7112.140.4144.3
ZN-LLDPE-2119.1114.733.3158.4121.7117.725.4184.3
ZN-LLDPE-2 + LD30118.4114.639.7142.6120.9117.634.1173.5
Publisher’s Note: MDPI stays neutral with regard to jurisdictional claims in published maps and institutional affiliations.

