Article

Passive Acoustic Monitoring Provides Insights into Avian Use of Energycane Cropping Systems in Southern Florida

1
Argonne National Laboratory, Environmental Science Division, Lemont, IL 60439, USA
2
University of Florida, Institute of Food and Agricultural Sciences, Everglades Research and Education Center, Belle Glade, FL 33430, USA
*
Author to whom correspondence should be addressed.
Birds 2025, 6(4), 60; https://doi.org/10.3390/birds6040060
Submission received: 18 June 2025 / Revised: 5 November 2025 / Accepted: 6 November 2025 / Published: 10 November 2025

Simple Summary

Understanding the ecological effects of agricultural land use changes is vital for their long-term sustainability. We examined bird community use of energycane fields in southern Florida. Using passive acoustic monitoring (PAM), we found seasonal differences in avian species diversity and richness between study plots and time periods. These findings provide insight to avian seasonal preferences of south Florida agricultural fields and highlight the potential limitations of PAM in areas experiencing dynamic vegetation changes.

Abstract

Birds are important indicators of ecosystem health and provide a range of benefits to society. It is important, therefore, to understand the impacts of agricultural land use changes on bird populations. The cultivation of energycane (EC)—a sugarcane hybrid—for biofuel production represents one form of agricultural land use change in southern Florida. We used passive acoustic monitoring (PAM) to examine bird community use of experimental EC fields and other agricultural land uses at two study sites in southern Florida. We deployed 16 acoustic recorders in different study plots and used the automatic species identifier BirdNET to identify 40 focal bird species. We found seasonal differences in daily avian species diversity and richness between EC experimental plots and reference agricultural fields (corn fields, orchards, pastureland), and between time periods (pre-planting, post-planting). Daily avian species diversity and richness were lower in the EC experimental plots during Fall and Winter months when plants reached maximum height (>400 cm in some areas). Despite seasonal differences in daily measures of species diversity and richness, we found no differences in cumulative species richness, suggesting that there may be little overall (season-long) effects of EC production. These findings could provide insight to avian seasonal habitat preferences and underscore the potential limitations of PAM in areas experiencing dynamic vegetation changes. More research is needed to better understand if utilization of EC cropping systems results in positive or negative effects on avian populations (e.g., foraging habitat quality, predator–prey dynamics, nest success).

Graphical Abstract

1. Introduction

The United States is projected to be capable of producing up to 1.5 billion tons of biomass annually under a mature future market scenario [1]. This estimated biomass production is expected to come from multiple sources including agricultural and forest residues, dedicated energy crops, algae, and municipal solid waste [1]. High-yielding perennial grasses will likely comprise most of the biomass production coming from dedicated energy crops. Due to the varying eco-physiological conditions on which perennial grasses inherently grow and thrive, the choice of which species or cultivars to grow vary by region to maximize yields. Energycane (Saccharum spp.), a sugarcane hybrid, is considered a top-ranked dedicated biomass crop [2], especially for the coastal plains of the U.S. Southeast due to its sub-tropical climate suitability. Past studies showed that energycane (EC) outperformed other important biomass crops (e.g., hybrid poplar, switchgrass, miscanthus, sorghum, etc.) in the sub-tropical and tropical regions [3,4]. For instance, in marginal soils of Florida, EC produced 30–34 Mg/ha dry biomass, outperforming other perennial bioenergy grasses [4,5]. As a deep rooting and high-yielding crop, EC could help provide a sustainable supply of biomass required to produce fuels for the hard to electrify sector of the transportation industry such as aviation, in addition to biomass-based chemicals and materials. EC production at scale could also help revitalize the rural economy particularly the U.S. Southeast citrus industry which is significantly affected by citrus greening [6] by providing an alternative crop production system. However, there is a need to understand how this proposed EC production system impacts biodiversity, especially local bird populations since large-scale biomass production could drive considerable changes in landscape configuration that have significant implications for bird species [7].
While bird populations vary in their responses to changes in land use and land cover associated with biomass production [8], nesting birds can be impacted by the loss of suitable habitats from large-scale monocultural corn production for ethanol [9]. A more recent study found that advanced switchgrass cultivars grown in the marginal croplands of the U.S. Midwest have the potential to contribute to the conservation of grassland birds, which are among the species to experience population declines across the nation, through replacement of lost habitats [10]. Crop management plays an important role in determining the impacts of perennial biomass crop production on bird population and diversity. Harvest timing, for instance, could optimize the tradeoffs between maximizing biomass yield and bird habitat [11].
There is a paucity of information about the ecological impacts of EC production for bioenergy. EC production systems may affect bird community structure (i.e., species richness) since it could change seasonal vegetation composition relative to other existing crop or landcover types [12]. In this study, we used passive acoustic monitoring (PAM) to examine the avian community use of EC production in southern Florida. Aided by advancements in artificial intelligence (AI) to improve species call recognition (e.g., BirdNET [13]), PAM has become a widely implemented tool for ecologists and natural resource managers to monitor bird communities (e.g., [10,14,15,16]). Recent studies have shown that automated approaches using PAM can sometimes outperform more traditional methods of estimating avian species richness such as point count surveys [16]. We used PAM and BirdNET to determine whether avian species richness and occurrence patterns differed by monitoring location (e.g., EC experimental plots, reference areas), season, and between time periods (before planting, after planting). We hypothesized that EC production would influence seasonal vegetation structure and composition, which would result in seasonal changes in the avian use of the EC plots.

2. Materials and Methods

2.1. Study Area Overview

Our study areas are located in the state of Florida, USA (Figure 1). Its biogeography is diverse, comprising coastal barrier systems, wetlands, pine flatwoods, hammocks, scrub, and mangrove forests [17,18] mixed with urban and agricultural lands, particularly in its central and southern parts. Approximately 280,000 ha of the Everglades, one of the world’s largest wetland systems, is utilized for agriculture, which is also known as the Everglades Agricultural Area (EAA) [19]. About 160,000 ha of the EAA is used for the production of sugarcane, Florida’s top crop by land area [20,21]. Energycane (EC), which has demonstrated potential cellulosic ethanol production [5,22], has been experimentally tested through research studies in the EAA. While there are some botanical and physiological differences between the two cultivar types [5], sugarcane and EC share similar cultivation and harvesting practices, and are morphologically related compared to other crops grown in the region [23] (e.g., corn, citrus).
Florida’s climate is characterized into subtropical and tropical with two seasonal weather classifications—wet season from June to October and dry season from November to May [24]. The northern and central parts of the state fall under the subtropical climate zone while the southern part of the state falls under the tropical climate zone.

2.2. Study Site Location and Experiment Plot Layout

This study was conducted at two agricultural research sites in southern Florida, USA. One was located at the Everglades Research and Education Center (EREC), Belle Glade, FL, while the other was located at the Indian River Research and Education Center (IRREC), Fort Pierce, FL (Figure 1). Both EREC and IRREC are owned by the University of Florida.
The EREC site (26.66° N, 80.63° W) is located on the southeastern shore of Lake Okeechobee, which is part of the EAA. It has organic soil (Histosols), the predominant soil type in the EAA. Soil carbon oxidation over the past few decades has resulted in shallow soils from soil loss, with most fields having less than one meter of soil above the bedrock. The increased incorporation of lime from the underlying bedrock has raised the soil pH, reducing nutrient availability for crops, thereby classifying the soils as marginal. Soil subsidence and nutrient runoff into the Florida Everglades are significant environmental concerns. The IRREC site (27.43° N, 80.41° W) is in east-central Florida, characterized by a subtropical climate and high rainfall. It has sandy soils, which have low organic matter, limited water retention, and poor nutrient content. These marginal soils require effective water and nutrient management. Over the past decade, citrus acreage in the area has decreased by 40% primarily due to citrus greening [6], resulting in fallow land and creating a need for alternative cropping systems suited to the region’s challenging climatic and soil conditions.
The annual average temperature at EREC from 1990–2020 was 23.5 °C while the average annual precipitation total is 1420.2 mm based on climate data from stations USC00081276 and USC00082298 [25]. During our study period (2021–2024), the average annual temperature and average annual precipitation total were 23.7 °C and 1650.6 mm, respectively. Similarly, the annual average temperature at IRREC from 1990–2020 was 23.5 °C while the average annual precipitation total is 1494.1 mm based on climate data from stations USC00083207 and USC00088620 [25]. During our study period (2021–2024), the average annual temperature and average annual precipitation total were 24.38 °C and 1529.1 mm, respectively.
Each site contained an experimental treatment plot where EC was planted. The EREC site had an experimental EC treatment plot of approximately 3 ha in size (Figure 1A), whereas the IRREC site had an experimental EC treatment plot of approximately 1.6 ha in size (Figure 1B). Planting of EC within the EC treatment plots occurred on 11–12 January 2023 at EREC and 21–22 December 2022 at IRREC. EC harvest at both sites occurred in February 2024 after the EC had matured.

2.3. Acoustic Monitoring

Autonomous acoustic recording units (ARUs; Wildlife Acoustics Song Meter Mini, Maynard, MA, USA) were utilized in this study to conduct a near-continuous survey of bird species at the EREC and IRREC sites. Acoustic recorders were deployed at each site from July 2021 to March 2024, attached to metal posts approximately 1.5 m above the ground. The monitoring period was divided into two temporal categories: prior to the planting of EC (“pre-planting” period from January 2021 to December 2022) and after the EC was planted (“post-planting” period from January 2023 to February 2024). At each site, we identified reference areas around the experimental plots. The reference areas consisted primarily of corn fields (n = 3), former citrus orchards (n = 2), and pasture fields (n = 3). Due to a limited number of available ARUs, we were not able to install ARUs in the reference areas during the pre-planting period. Reference areas were only monitored during the post-planting period. Our study design, therefore, represents a partial Before-After-Control-Impact (BACI) design. In 2021 and 2022, we deployed 8 ARUs evenly between the EC plots at both sites. In 2023 and 2024, we deployed 16 ARUs evenly between the EC plots and reference areas at both sites. At each site, 4 ARUs were deployed in the EC treatment plots, while 4 ARUs were distributed in reference areas.
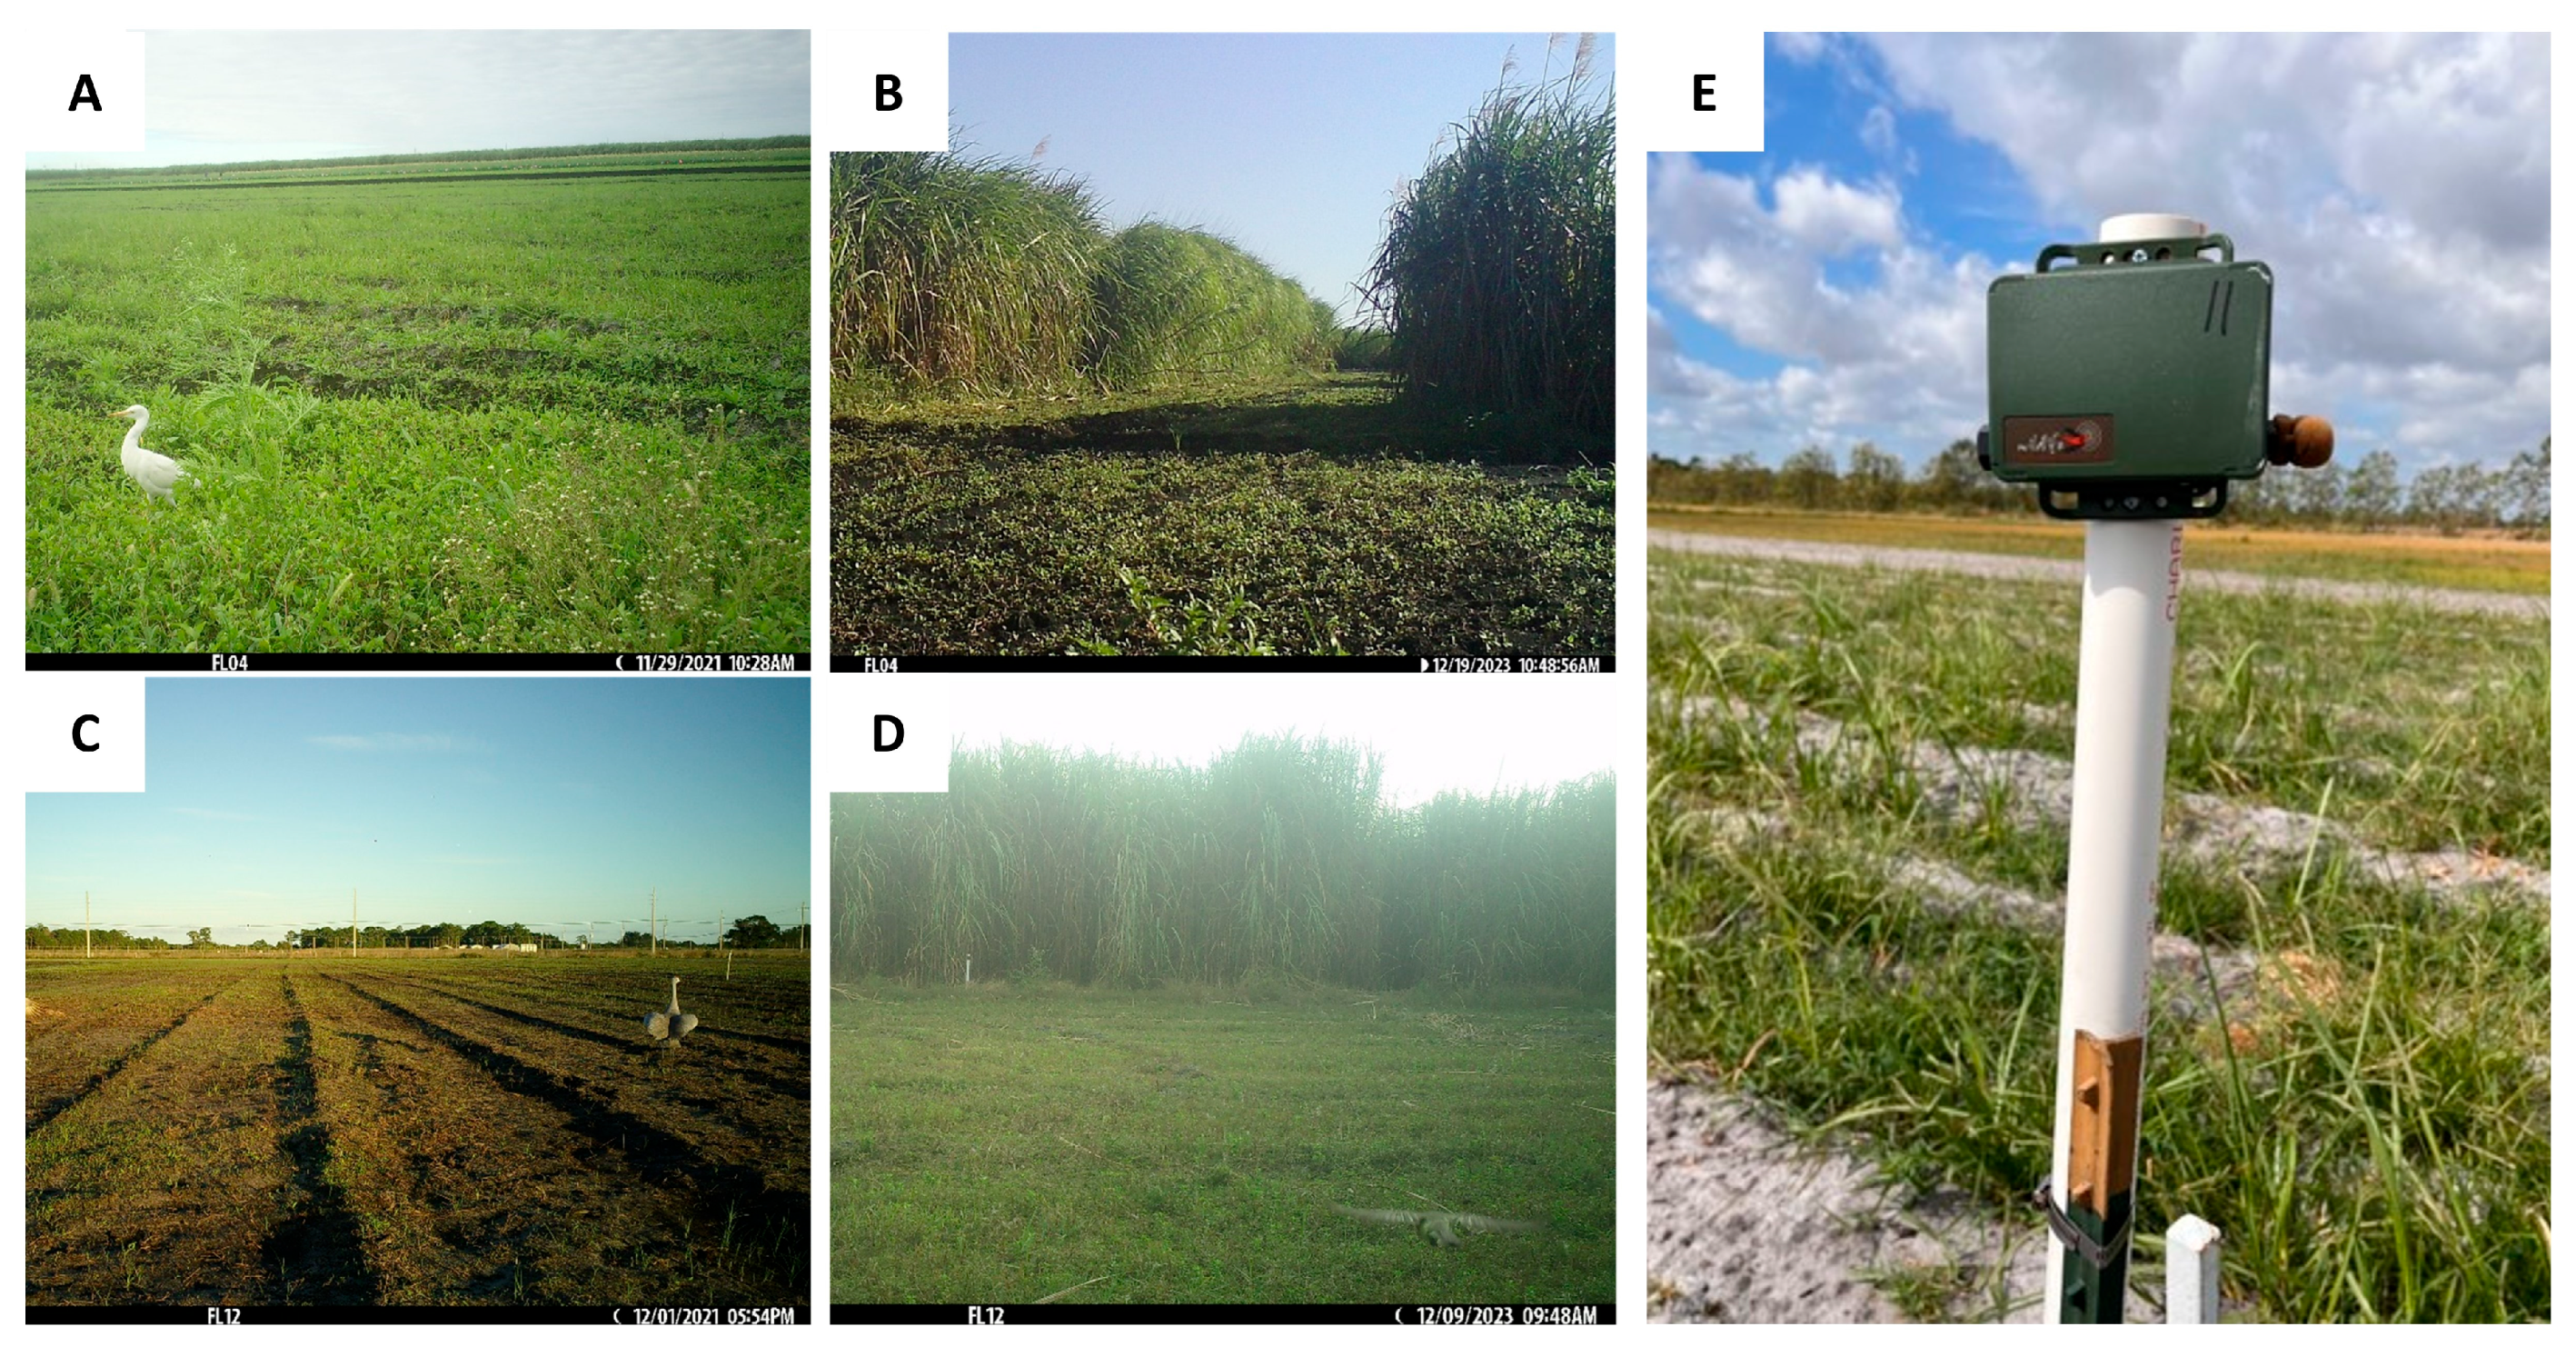
Given the relatively small sizes of the experimental plots, the ARUs in the EC treatment areas were spaced between 55 m and 175 m from one another. The ARUs in the reference areas were spaced >200 m apart and were between 250–1000 m away from the treatment areas (Figure 1). The ARUs were programmed to record 16-bit WAV audio at a sample rate of 24,000 Hz for a total of four hours each day: one hour before sunrise to one hour after sunrise, and one hour before sunset to one hour after sunset. Based on previous field observations by the authors, these were the times of day with the greatest bird activity in this region. The gain was set at the default setting (18 dB). ARUs were visited approximately every two to four weeks to replace batteries and digital memory (SD) cards. Example photographs of site conditions at EREC and IRREC during the pre-planting period and post-planting period are shown in Figure 2.

2.4. Acoustic Data Processing

We analyzed the recorded audio files with the BirdNET algorithm [13], a deep neural network capable of identifying over 6000 bird species based on their vocalizations alone. We used BirdNET Version 2.4, which was configured to make species predictions based on weekly eBird [26] checklists for the geographic area near each survey location. We set the minimum confidence threshold to 0.25 and used default BirdNET parameter settings for sensitivity (1) and overlap (0 s). We saved all BirdNET results as tab-delimited data tables.
To assess BirdNET performance and select focal bird species for our analyses, we first identified 50 candidate bird species that were known to occur in the region. We then randomly selected 100 BirdNET-generated detections for each species, stratified across the following BirdNET confidence intervals: <0.30 (i.e., 0.25–0.29), 0.30–0.39, 0.40–0.49, 0.50–0.59; 0.60–0.69; 0.70–0.79; 0.80–0.89; and ≥0.90. There were 13 sample recordings in each confidence interval except for the lowest interval (0.25–0.29) which had 9 recordings. All 5000 sample recordings were manually reviewed by trained biologists to determine BirdNET precision, as follows:
t r u e   p o s i t i v e s   t r u e   p o s i t i v e s   +   f a l s e   p o s i t i v e s
A true positive detection occurred when the observer confirmed that a species was accurately classified by BirdNET. A false positive detection occurred when BirdNET detected a species that was not confirmed by the observer. We then plotted precision estimates by the above BirdNET confidence intervals and determined the species-specific confidence threshold (SSCT) as the confidence level beyond which precision was consistently ≥ 0.90. If BirdNET failed to reach a consistent precision level ≥ 0.90, we removed that species from our focal species list. For all remaining focal species, we used the SSCT to filter all BirdNET detections and we assumed these to be valid detections. We used the packages ‘dplyr’ and ‘av’ in R version 4.4.1 [27] to organize, extract, and review BirdNET acoustic detections.

2.5. Statistical Methods

Our primary goal was to determine whether focal species richness and diversity changed in the experimental EC treatment plots after planting compared to other areas. Due to seasonal differences in bird activity and EC growth, we conducted analyses across four phenological seasons: Spring (March–May), Summer (June–Aug), Fall (Sept–Nov), and Winter (Dec–Feb). Although we deployed ARUs concurrently, there were several days in which some ARUs did not record due to technical difficulties or weather. Because unbalanced and inconsistent recordings among ARUs could influence the statistical comparisons of species richness if we were to pool all recordings, we randomly sampled acoustic recordings from each ARU. We randomly selected five days of acoustic recordings from each ARU each month as this allowed us to achieve sufficient and consistent ARU replication each month. A complete day of recordings by an ARU consisted of 4 one-hour recordings (2 at sunrise, 2 at sunset). Previous studies have suggested the effective range for ARUs to detect most bird vocalizations to be between 50 and 100 m, depending on a variety of factors such as bird size and landscape context [16,28]. Thus, to account for the nonindependence of some of our ARU locations, we sampled monthly from only one ARU out of any pair that were <100 m apart. This resulted in the omission of 2 ARUs each month at IRREC (all ARUs at EREC were >100 m apart).
Using the SSCT, we calculated valid daily focal species detections at each ARU. We categorized focal species into four broad taxonomic groups: (1) passerines; (2) owls and raptors, (3) shorebirds, and (4) ‘other’ species, including the Orders Caprimulgiformes, Columbiformes, and Galliformes. We summed the number of confirmed focal species at each ARU to determine daily species richness for each taxonomic group. We also calculated daily focal species diversity using the Shannon-Wiener index based on the total number of daily detections for each focal species (at SSCT) at each ARU. In addition, we calculated seasonal cumulative focal species richness for each ARU, which was calculated as the total sum of unique focal species detected by each ARU each season. All species richness and diversity calculations were made using the ‘vegan’ package in R [29].
Each month, we estimated average vegetation height within 50 m around each ARU (veg50). Average vegetation height was determined by a combination of in situ field measurements within the EC experimental plots and estimates derived from motion-triggered wildlife cameras (Browning Strikeforce Pro cameras, Browning Trail Cameras, Birmingham, AL, USA), which were positioned alongside each ARU.
We fitted generalized linear mixed models (GLMMs) for repeated measurements in order to compare daily avian species richness and diversity between plot types (EC, reference) and time periods (Pre-planting, Post-planting). We conducted analyses separately for each phenological season, and for the following four metrics: total focal species diversity, total focal species richness, Passerine species richness, and shorebird species richness. There were insufficient numbers of owls and raptors and ‘other’ species to warrant species richness analyses for those taxonomic groups. In all models, at minimum, we included a single fixed variable that grouped observations across plot type and time period (“treatment group”), as follows: (a) EC-Pre-Planting: all observations in EC experimental plots prior to EC planting; (b) EC-Post-Planting: all observations in EC experimental plots following EC planting; and Reference-Post-Planting: all observations in reference plots following EC planting.
All GLMMs included the random effect of ARU ID nested within Site (EREC or IRREC). We examined seasonal differences in veg50 with a GLMM that used season and time period as fixed effects. Following this, we determined the influence of surrounding vegetation height on avian community metrics with initial models that evaluated the fixed effects of treatment group and veg50, along with their interaction. We developed secondary models that removed veg50 from the fixed effects and included veg50 as a random slope. From these iterative models, we selected the best-performing model (based on AIC). When significant results were obtained from the GLMMs for treatment group, we carried out pairwise tests using Tukey’s method for multiple comparisons.
We conducted non-parametric Kruskal–Wallis tests by season to compare cumulative focal species richness among the three treatment groups. We used this non-parametric analysis with data pooled across sites because insufficient ARU replication did not allow for GLMMs (the variance-covariance matrices could not be estimated for site-level random effects). If significant results were obtained from the Kruskal–Wallis tests, we conducted pairwise tests using Dunn tests.
All analyses were performed using R version 4.4.1 [27]. GLMMs were carried out using the lme4 package [30]. We used the ‘Anova’ function of the car package [31] to examine the significance of fixed effects based on Type II Wald Tests. Pairwise Tukey tests following GLMMs were carried out using the emmeans package [32], pairwise Dunn tests were conducted using the dunn.test package [33], and data visualizations were performed with the ggplot2 package [34].

3. Results

We collected a total of 19,676 h of acoustic recordings from the 16 ARUs from July 2021 to March 2024, covering the pre-planting and post-planting periods. 2308 h of these recordings came from the pre-planting period (2021–2022) from 8 locations (four treatment plots at EREC; four treatment plots at IRREC), while 17,368 recording hours came from the post-planting period from 16 locations.
BirdNET made 4,791,877 total avian detections from the acoustic recordings, representing 222 different species. We inspected BirdNET precision for 40 of these species (Figure S1-1) and retained these species as our focal species for this study (Table 1). The list of focal species included 20 passerines, 10 shorebirds, 6 owls and raptors, and 4 species belonging to other taxonomic groups (Caprimulgiformes, Columbiformes, Galliformes). These 40 species were selected based on our ability to determine a SSCT through evaluation of BirdNET precision (Table 1; Figure S1-1). We combined some related focal species that had similar calls. For example, we combined Common Grackle (Quiscalus quiscula) and Boat-tailed Grackle (Quiscalus major) into one species (“Grackle”), American Crow (Corvus brachyrhynchos) and Fish Crow (Corvus ossifragus) were combined into “Crow”, Common Ground Dove (Columbina passerina) and Mourning Dove (Zenaida macroura) were combined into “Dove”, and Greater and Lesser Yellowlegs (Tringa melanoleuca and Tringa flavipes) were combined into “Yellowlegs” (Table 1). Combined, the 40 focal species made up over 85% of all BirdNET detections in this study.
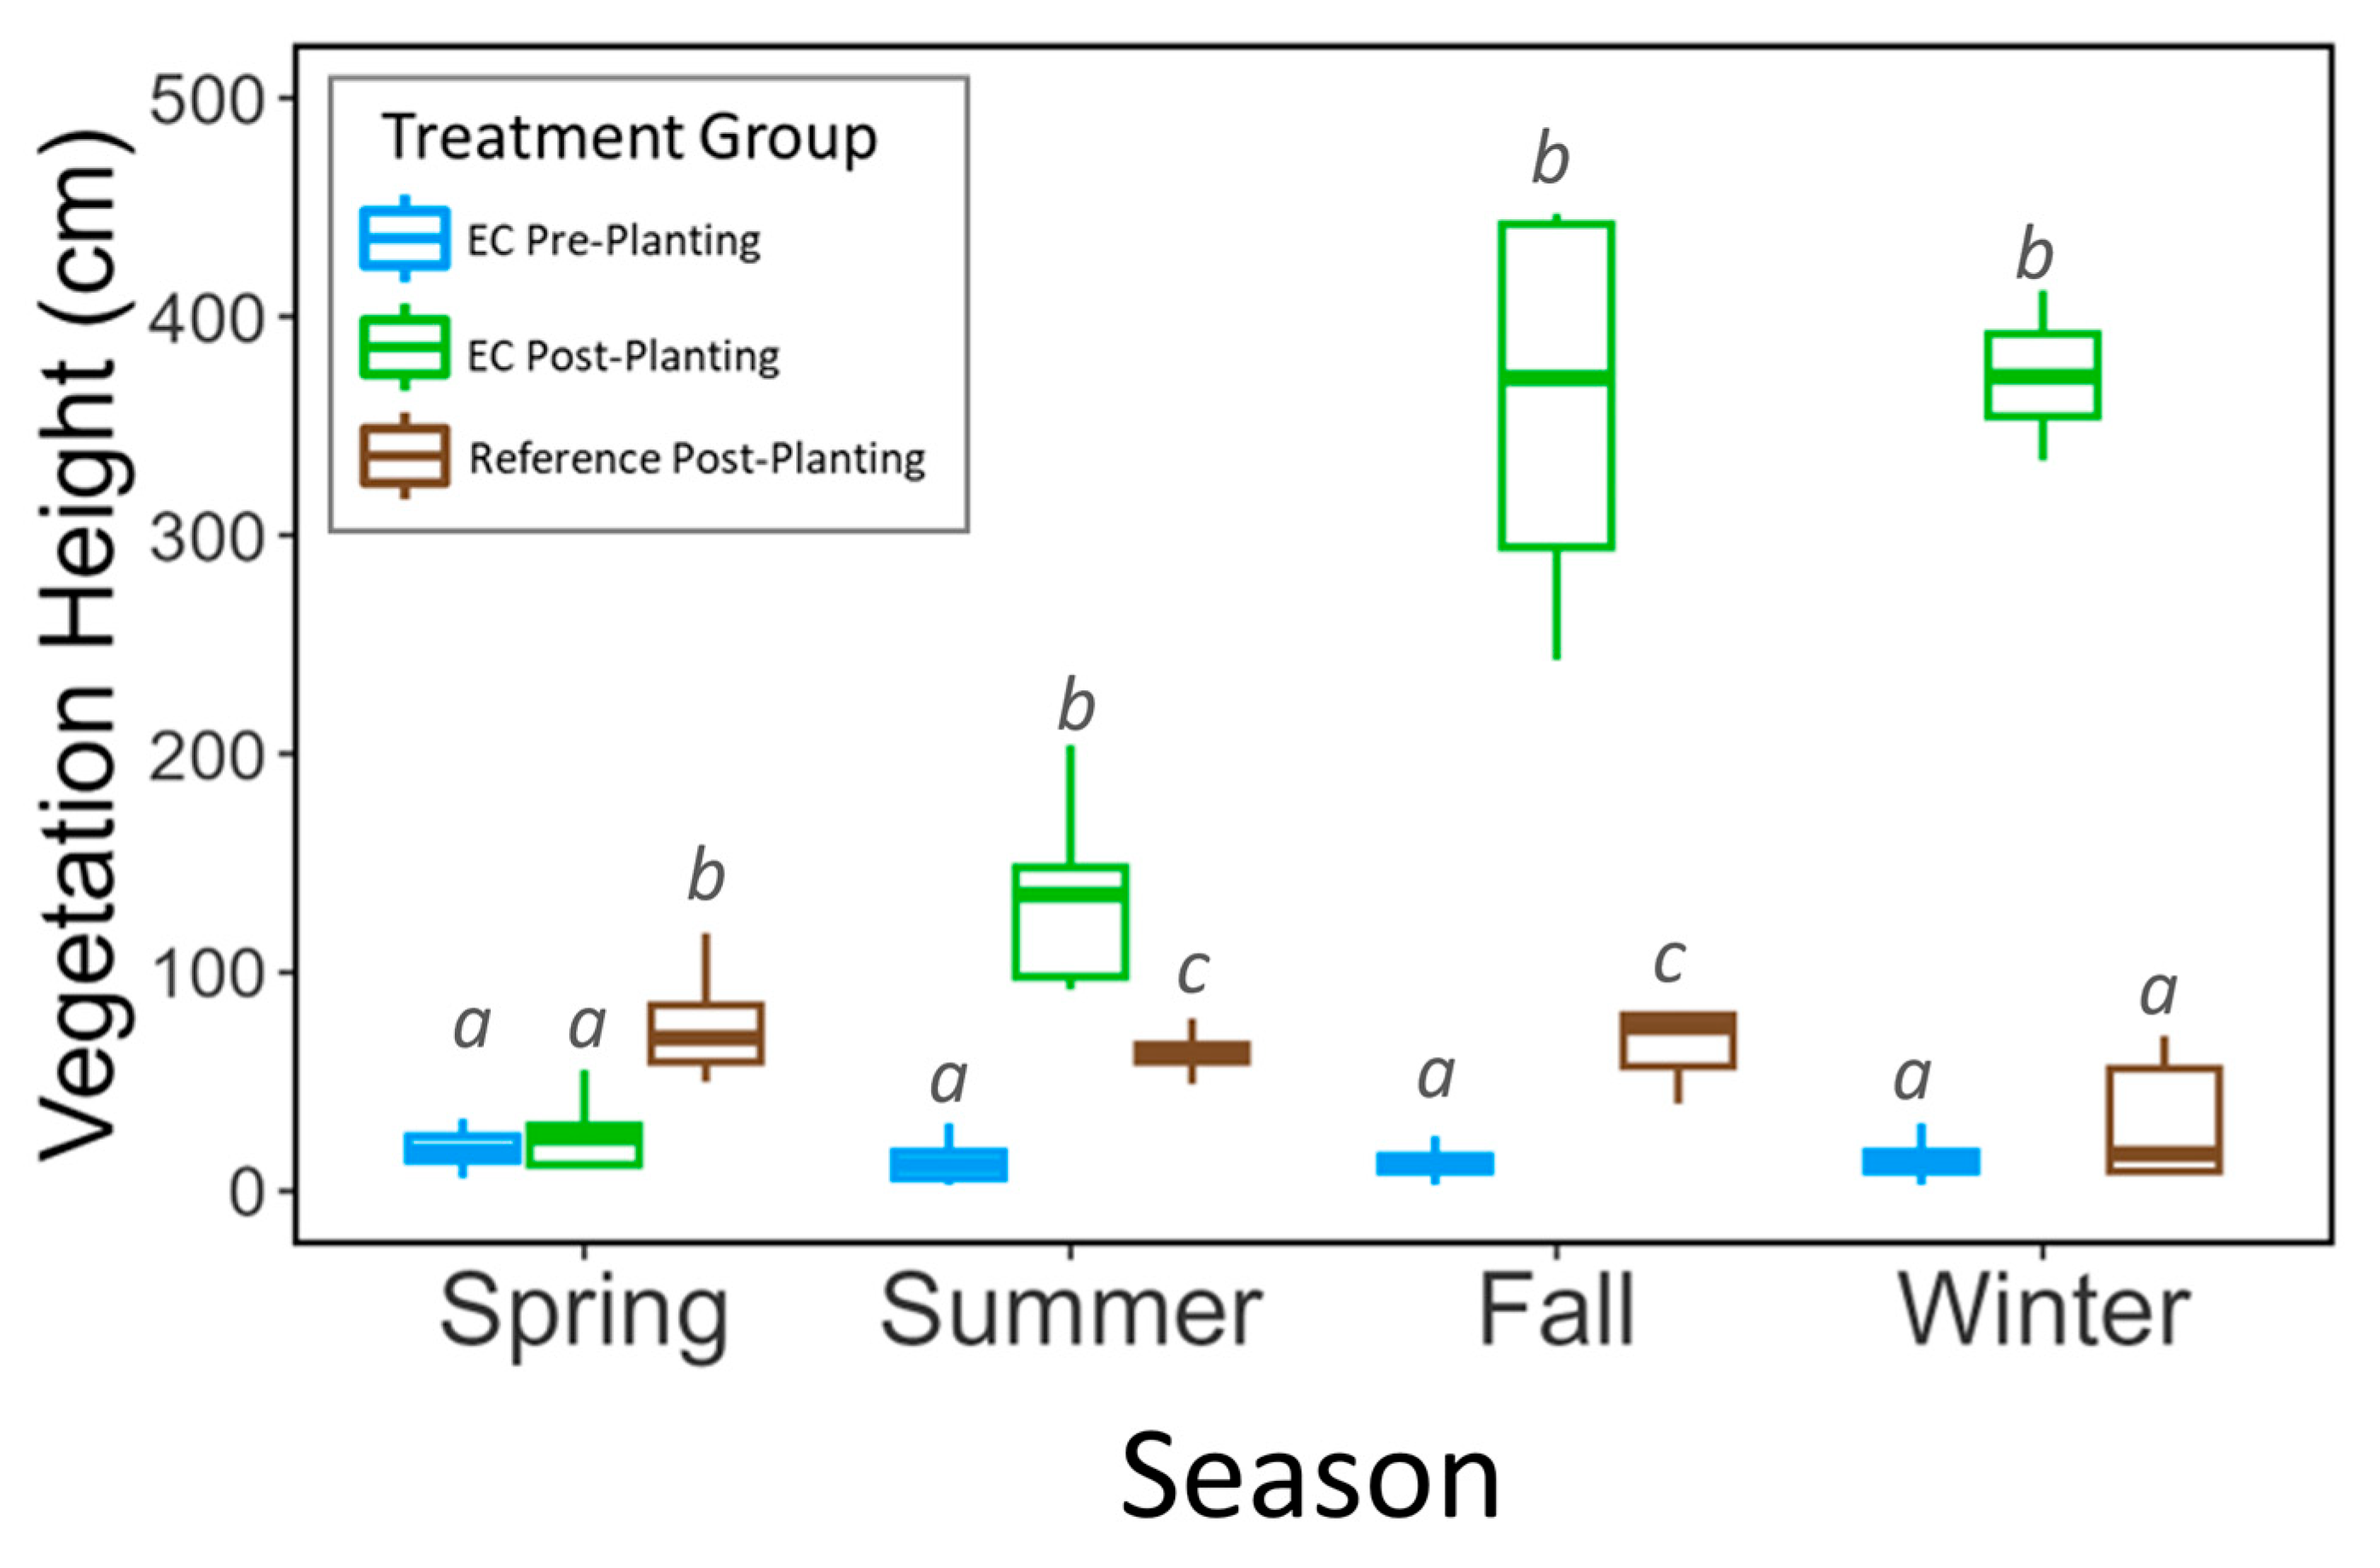
Vegetation height varied seasonally around the ARUs (Figure 3). The most notable differences in veg50 were in the Fall and Winter seasons when the EC reached its maximum height before the first harvest. During these months, veg50 around the ARUs in the EC experimental plots was approximately 4× taller than vegetation within 50 m of all other ARUs.
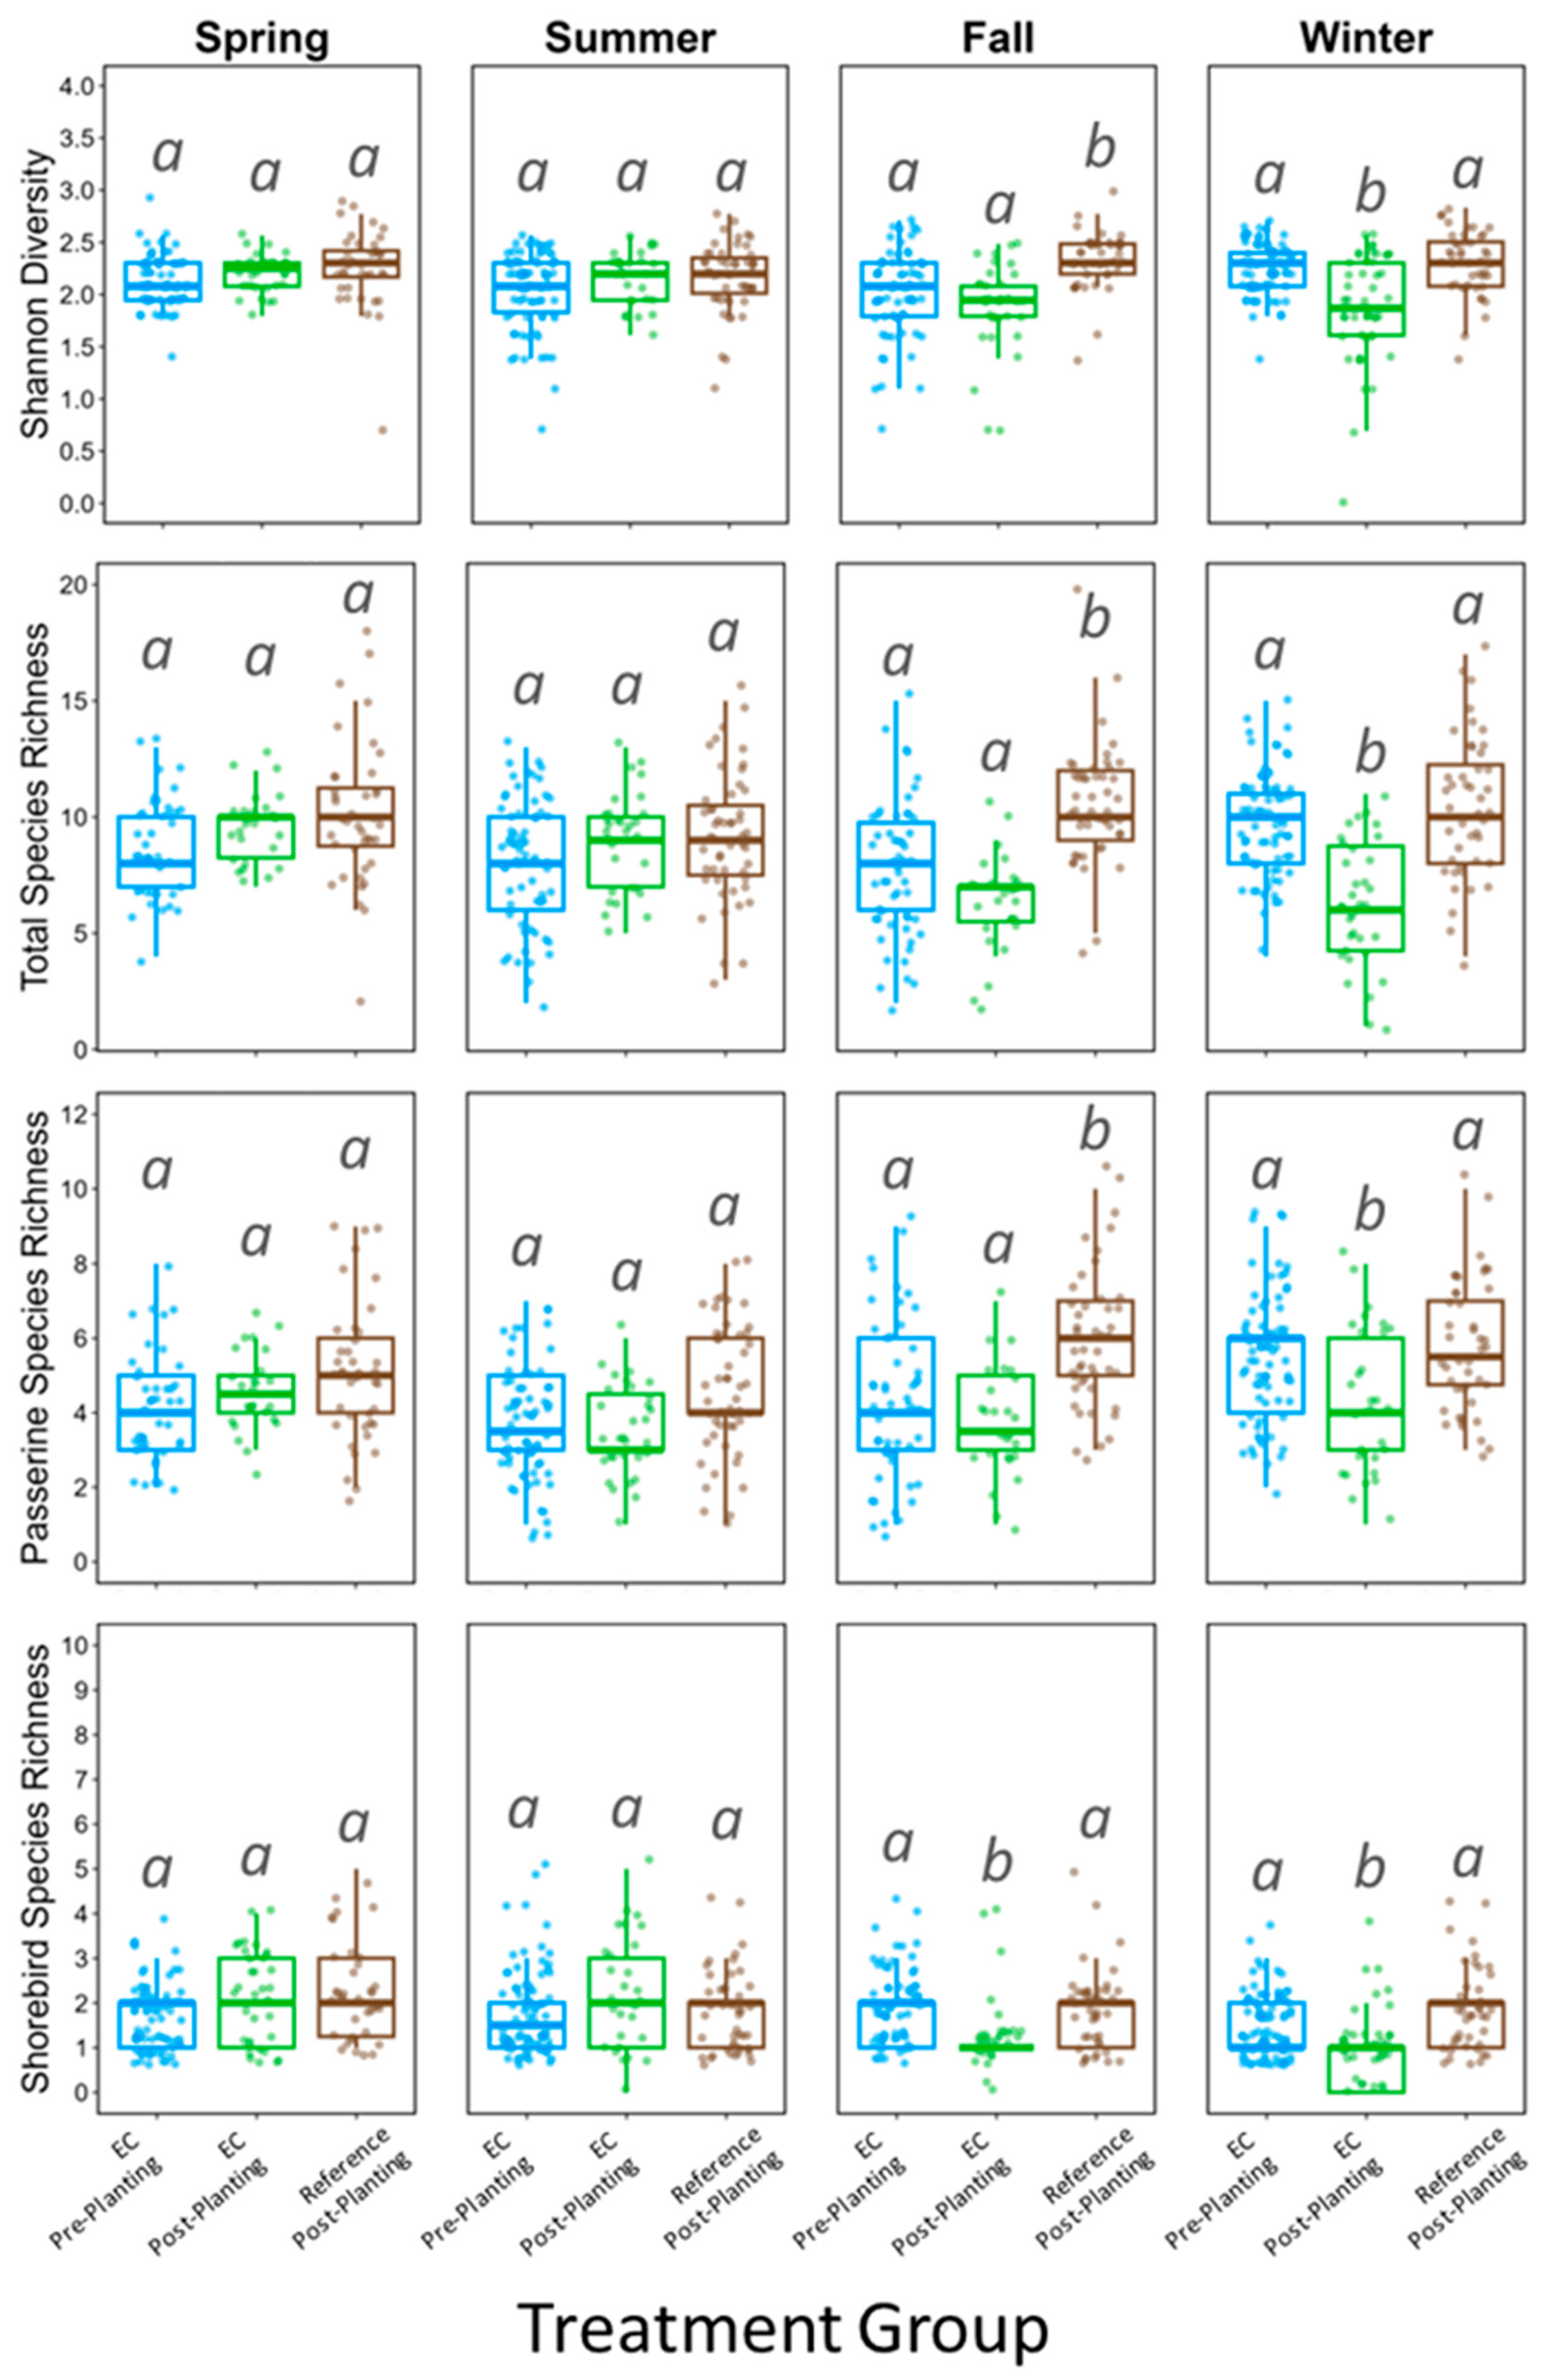
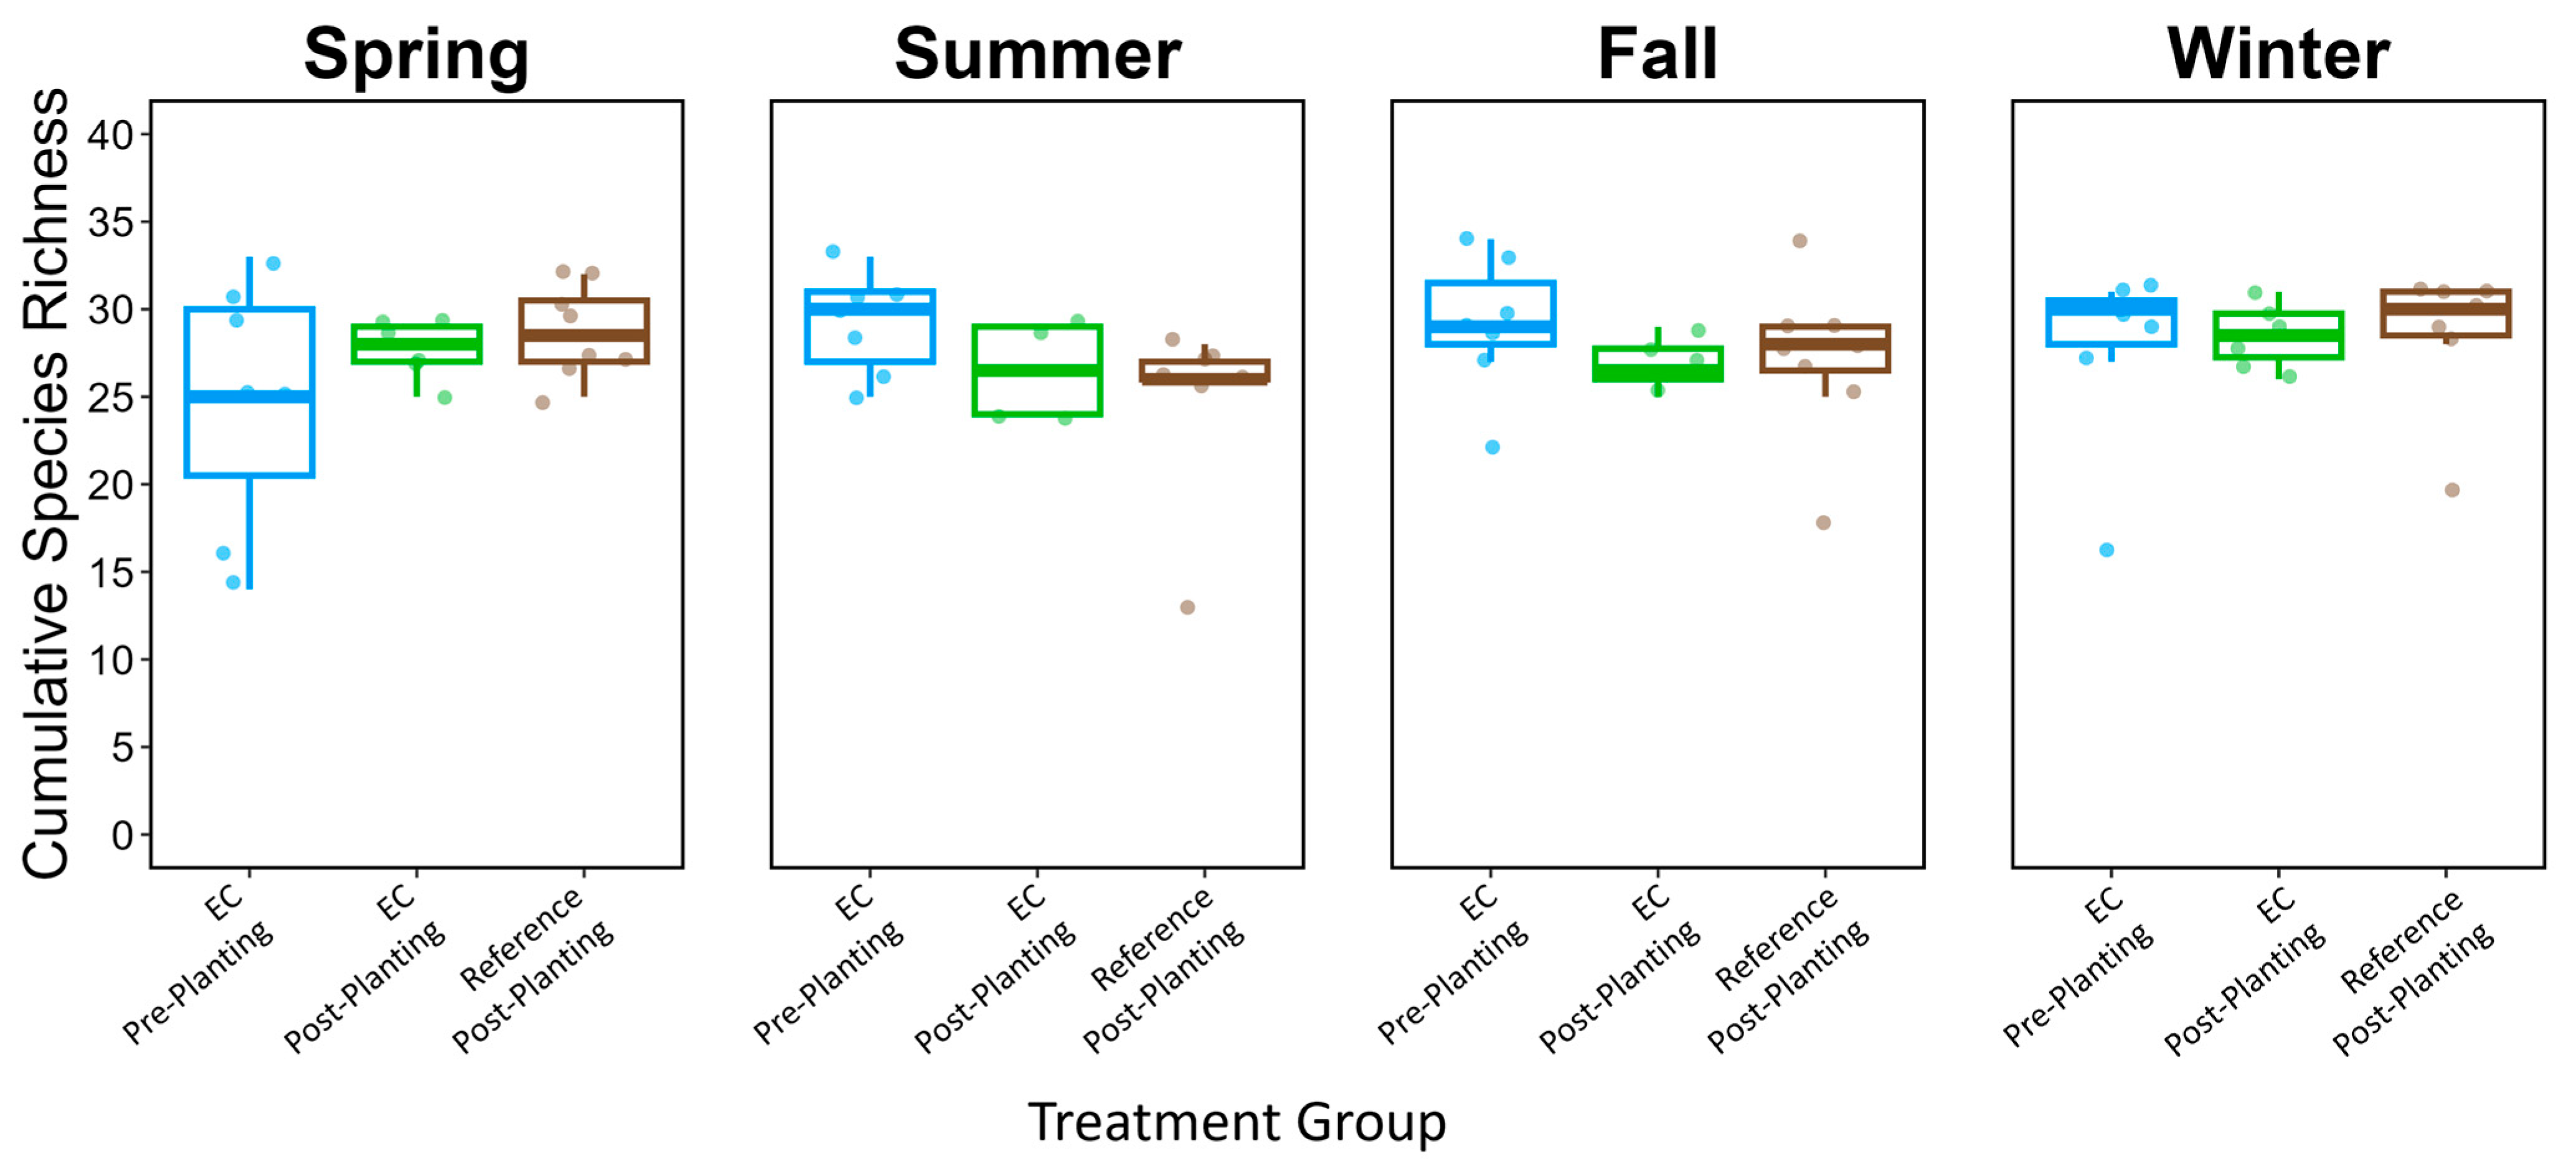
The best-performing GLMMs for daily focal species richness and diversity (based on lowest AIC scores) included veg50 as a random slope rather than a continuous fixed effect. From these models, we found no differences in avian species diversity or species richness across treatment groups in the Spring or Summer. However, there were noticeable differences in the Fall and Winter (Table 2). Tukey’s post hoc comparisons indicated that, during the Fall, there was little difference in avian community metrics between EC treatment groups (EC pre-planting, EC post-planting). However, both groups had significantly lower avian community metrics compared to reference sites. This was true for all avian community metrics except shorebird richness. In the Winter, all avian community metrics at the EC experimental plots post planting were significantly lower than both EC pre-planting and reference plots (Figure 4). Despite seasonal differences in daily species richness and diversity among treatment groups, we did not detect any differences for cumulative species richness (Kruskal–Wallis tests by season; p > 0.143; Figure 5). Cumulative numbers of detections for all focal species by season are presented in Tables S2-1–S2-4.

4. Discussion

Vegetation structure differed by treatment groups in relation to seasonal EC growth. Prior to EC planting, when the plots were barren and the soil was being prepared for planting, veg50 around the experimental plots was constantly below 50 cm throughout the year. However, after the EC was planted, veg50 in the experimental plots increased seasonally (due to EC growth) to an average of nearly 400 cm in Fall and Winter prior to first harvest.
We detected seasonal differences in daily avian species diversity and richness among treatment plots. These seasonal differences were associated with EC growth. There were no differences in daily avian community metrics across treatment groups in Spring and Summer when EC height was <150 cm. By Winter months, however, when the EC had reached average heights of nearly 400 cm, daily avian species diversity and richness was lower than the experimental plots prior to EC planting and lower than reference agricultural plots in the region. There are two possible explanations for these results: (a) resident bird communities avoid tall mature EC stands in Fall and Winter months, or (b) acoustic detectability of vocalizing birds is compromised by tall EC stands.
We expected avian responses to EC production to be similar to previously reported responses to sugarcane. Previous research in southern Florida has shown generally positive avian responses to sugarcane during certain times of the year. Pearlstine et al. [35,36] recorded a high degree of avian activity and species richness in sugarcane fields of southern Florida. Some avian species-specific responses fluctuate with the age and structure of sugarcane. For example, Common Yellowthroat (Geothlypis trichas), despite being a year-round resident in the region, is more commonly detected in sugarcane fields during the early growth periods and is less frequently detected when EC reaches its maximum height [37]. Other species, such as Cattle Egret (Ardea ibis) and other shorebirds, may be more common after sugarcane has been harvested where they can better forage on prey items in the disturbed soil [37,38].
Portions of our results are similar to these previous studies while some other results contrast. Consistent with previous reports, we observed greatest shorebird species richness in the experimental plots prior to EC planting and during the early growth stages following EC planting. Based on earlier studies, e.g., [36], we expected Passerine species richness would be greater in the EC experimental plots during the later growth stages when the EC was tallest (e.g., Fall and Winter). However, Passerine species richness was notably lower in the experimental plots during this time. These results could be due to the influence of EC height and density in our acoustic monitoring design. Sound transmission of avian vocalizations is influenced by height and complexity of surrounding vegetation [39], and the detection probability for some bird species is lowered in taller sugarcane than shorter sugarcane [37]. In our study, therefore, some avian species occupying the EC plots could have been undetected by the acoustic recorders due to the tall, dense EC stands.
Despite the apparent decrease in daily avian use of EC during the later growth stages, there were no significant changes in cumulative species richness among the treatment groups by season. We still managed to detect 38 out of the 40 focal species in the EC plots during the Winter months when the EC was tallest (Table S2-4). This is identical to the number of species detected in Winter months prior to EC planting, and slightly greater than the number of species detected in reference areas. These findings suggest that while there may be daily changes in species use of EC plots, there may be little overall (season-long) effects. The two species absent in the EC plots during the Winter months were both shorebirds (Black-necked Stilt [Himantopus mexicanus] and Common Gallinule [Gallinula galeata]). Both species were also absent in the Winter months in the reference sites.
We observed some discrepancies in species-specific Fall and Winter activity levels, as measured by the total number of BirdNET detections at the SSCT (Tables S2-3 and S2-4). Seasonal differences were expected as avian abundance in agricultural fields this region is a function of the combined effects of species-specific migration phenology and agricultural activities [38]. Twenty-eight of the focal species (70%) had lower Winter activity levels in the experimental plots when EC was at its maximum height compared to the same season prior to EC planting. This decrease in activity was most notable for Passerines such as Blue Jay (Cyanocitta cristata), Common Yellowthroat, Eastern Meadowlark (Sturnella magna), and Grackle species (Quiscalus sp.). These observations are likely due to the decreased detection probabilities for Passerines in and adjacent to the tall, dense EC vegetation [37]. Despite this, some species showed greater Winter activity levels in the experimental plots following EC planting, such as Barn Owl (Tyto furcata). Barn owls are important natural agents of agricultural pest control [40]. Therefore, their increased activity in EC plots could suggest a greater ability to control agricultural pests. Further study is needed to understand whether increased predator activity associated with EC production aids in pest control.

Study Limitations

There were a few limitations with our study design that could have influenced our results. First, our study was limited to two relatively small (1.6 ha to 3.0 ha in size) experimental plots, which prohibited us from establishing many independent sampling points without risk of pseudoreplication. Second, we were unable to monitor reference agricultural areas during the pre-planting period due to limited number of available ARUs. Because this study does not represent a full BACI design, we cannot discern our results from interannual variation in the bird community. Third, we were unable to determine with certainty whether lower Fall and Winter daily avian diversity and species richness in the experimental plots near peak EC growth was due to bird avoidance or technical limitations of the acoustic monitoring approach. Because cumulative species richness from all Fall and Winter acoustic recordings was similar across treatment groups, we believe the impact of EC growth on avian acoustic detectability is partly responsible for our results. As such, this study highlights an important limitation of PAM in areas experiencing variation in vegetation structure. Although BirdNET performed with reliable precision to generate SSCTs for 40 focal species, the notable changes in vegetation height at the experimental plots likely influenced what the ARUs could record at different times of the study, which could have resulted in biased species detections (e.g., variable false negative rates). During study design, researchers should place greater consideration on factors that could influence ARU detectability throughout the study. For future studies similar to ours where ARU detectability is likely to be affected by changes within treatment groups (e.g., vegetation height), PAM alone may not be sufficient to address research questions. In these cases, researchers should consider PAM in conjunction with more traditional approaches such as point count surveys [16]. Like previous studies [10,14,15,16], our study demonstrated the promise of the AI-powered bioacoustic species identifier BirdNET. However, the application of BirdNET in studies like ours is based solely on BirdNET precision (e.g., quantification of false positive rates). Given that site-specific factors (e.g., ambient soundscapes) and model parameters (e.g., sensitivity and overlap) can influence BirdNET detections and associated confidence scores [41,42], we caution the use of the SSCTs generated in our study for other applications. We encourage future applications of BirdNET to rely on study-specific assessments of BirdNET precision to generate context-specific SSCTs. Despite the potential limitations of PAM for daily measures of avian species richness and diversity, our study suggests that longer-term measurements, such as cumulative seasonal species richness, could be more reliable indictors of avian use in these dynamic agricultural systems.

5. Conclusions

It is important to investigate the ecological impacts of agricultural land use changes to ensure their long-term sustainability. The results of this study show that avian communities utilize EC cropping systems similar to other agricultural land uses in southern Florida during seasons when the EC has not fully matured. Lower avian species diversity and richness during seasons of peak EC growth may be the result of temporary bird avoidance to the tall, dense EC stands or the result of limited PAM detectability. Any apparent seasonal effects of EC production on bird communities are temporary since avian responses should return to pre-EC conditions after EC harvest, as indicated by our observations (Figure 4) and based on field observations after sugarcane harvest [37]. Like sugarcane, EC harvest typically occurs in winter months, which is outside the breeding phenology for most resident bird species. Furthermore, all bird species that showed a decrease in detections in the experimental EC plots were of relatively low conservation status and common inhabitants of agricultural and human-modified landscapes. Therefore, results of this study may reflect the seasonal shifts in habitat preferences among resident bird communities of southern Florida [35,36,37,38]. More research is needed to better understand if utilization of EC cropping systems results in positive or negative effects on avian populations and the agricultural services they provide (e.g., foraging habitat quality, nest success, pest control).

Supplementary Materials

The following supporting information can be downloaded at https://www.mdpi.com/article/10.3390/birds6040060/s1: Figure S1-1: Species-specific BirdNET precision by confidence interval; Table S2-1: Focal Species BirdNET Detections (at SSCT) During Spring Months (March, April, and May), Table S2-2: Focal Species BirdNET Detections (at SSCT) During Summer Months (June, July, and August), Table S2-3: Focal Species BirdNET Detections (at SSCT) During Fall Months (September, October, and November), Table S2-4: Focal Species BirdNET Detections (at SSCT) During Winter Months (December, January, and February).

Author Contributions

Conceptualization, L.J.W., J.F.C., H.S. and M.C.N.; data collection, L.J.W. and R.A.L.-V.; methodology and analyses, L.J.W., J.F.C. and J.F.; visualizations, L.J.W.; writing, L.J.W., J.F.C., C.R.Z., B.K. and J.F.; project administration, J.F.C. and H.S.; funding acquisition, H.S., M.C.N. and J.F.C. All authors have read and agreed to the published version of the manuscript.

Funding

This research was funded by the U.S. Department of Energy, Energy Efficiency and Renewable Energy, Bioenergy Technologies Office, grant number DE-EE0009281. The views expressed in this article do not necessarily represent the views of the DOE or the US Government. This manuscript has been created by UChicago Argonne, LLC, Operator of Argonne National Laboratory (“Argonne”). Argonne, a U.S. Department of Energy (DOE) Office of Science laboratory, is operated under contract no. DE-AC02-06CH11357. The U.S. Government retains for itself, and others acting on its behalf, a paid-up nonexclusive, irrevocable worldwide license in said article to reproduce, prepare derivative works, distribute copies to the public, and perform publicly and display publicly, by or on behalf of the Government.

Institutional Review Board Statement

Ethical review and approval were not applicable for this study because it was purely observational, involving no manipulation, disturbance, or collection of animals..

Data Availability Statement

Data supporting the analyses in this article will be made available by the authors on request.

Acknowledgments

The authors would like to thank Meredith Walston and the University of Florida staff and students who assisted with field work to deploy and maintain equipment throughout this study. We are also grateful for the constructive comments provided by four anonymous peer reviewers.

Conflicts of Interest

The authors declare no conflicts of interest.

References

  1. Langholtz, M. 2023 Billion-Ton Report; Oak Ridge National Laboratory (ORNL): Oak Ridge, TN, USA, 2024. [CrossRef]
  2. Lee, D.K.; Aberle, E.; Anderson, E.K.; Anderson, W.; Baldwin, B.S.; Baltensperger, D.; Barrett, M.; Blumenthal, J.; Bonos, S.; Bouton, J.; et al. Biomass production of herbaceous energy crops in the United States: Field trial results and yield potential maps from the multiyear regional feedstock partnership. Glob. Change Biol. Bioenergy 2018, 10, 698–716. [Google Scholar] [CrossRef]
  3. U.S. Department of Energy (US DOE). Billion-Ton Update: Biomass Supply for a Bioenergy and Bioproducts Industry; (No. ORNL/TM-2011/224); US Department of Energy, Oak Ridge National Laboratory: Oak Ridge, TN, USA, 2011. Available online: https://www1.eere.energy.gov/bioenergy/pdfs/billion_ton_update.pdf (accessed on 21 October 2025).
  4. Fedenko, J.R.; Erickson, J.E.; Woodard, K.R.; Sollenberger, L.E.; Vendramini, J.M.; Gilbert, R.A.; Helsel, Z.R.; Peter, G.F. Biomass production and composition of perennial grasses grown for bioenergy in a subtropical climate across Florida, USA. BioEnergy Res. 2013, 6, 1082–1093. [Google Scholar] [CrossRef]
  5. Sandhu, H.; Gilbert, R. Production of Biofuel Crops in Florida: Sugarcane/Energy Cane; The Institute of Food and Agricultural Sciences (IFAS), University of Florida: Gainesville, FL, USA, 2017. [Google Scholar] [CrossRef]
  6. Singerman, A.; Rogers, M.E. The economic challenges of dealing with citrus greening: The case of Florida. J. Integr. Pest Manag. 2020, 11, 3. [Google Scholar] [CrossRef]
  7. Blank, P.J.; Williams, C.L.; Sample, D.W.; Meehan, T.D.; Turner, M.G. Alternative scenarios of bioenergy crop production in an agricultural landscape and implications for bird communities. Ecol. Appl. 2016, 26, 42–54. [Google Scholar] [CrossRef]
  8. Beckmann, M.; Gerstner, K.; Akin-Fajiye, M.; Ceaușu, S.; Kambach, S.; Kinlock, N.L.; Phillips, H.R.P.; Verhagen, W.; Gurevitch, J.; Klotz, S.; et al. Conventional land-use intensification reduces species richness and increases production: A global meta-analysis. Glob. Change Biol. 2019, 25, 1941–1956. [Google Scholar] [CrossRef]
  9. Fargione, J.E.; Cooper, T.R.; Flaspohler, D.J.; Hill, J.; Lehman, C.; Tilman, D.; McCoy, T.; McLeod, S.; Nelson, E.J.; Oberhauser, K.S. Bioenergy and wildlife: Threats and opportunities for grassland conservation. BioScience 2009, 59, 767–777. [Google Scholar] [CrossRef]
  10. LaGory, K.E.; Cacho, J.F.; Zumpf, C.R.; Lee, D.; Feinstein, J.; Dematties, D.; Walston, L.J.; Namoi, N.; Negri, M.C. Bird species use of bioenergy croplands in Illinois, USA—Can advanced switchgrass cultivars provide suitable habitats for breeding grassland birds? Sustainability 2024, 16, 4807. [Google Scholar] [CrossRef]
  11. Kreig, J.A.; Lenhart, S.; Ponce, E.; Jager, H.I. Agent-based modeling to evaluate the effects of harvesting biomass and hunting on ring-necked pheasant (Phasianus colchicus) populations. Ecol. Model. 2024, 492, 110705. [Google Scholar] [CrossRef]
  12. Ambarlı, D.; Bilgin, C.C. Effects of landscape, land use and vegetation on bird community composition and diversity in Inner Anatolian steppes. Agric. Ecosyst. Environ. 2014, 182, 37–46. [Google Scholar] [CrossRef]
  13. Kahl, S.; Wood, C.M.; Eibl, M.; Klinck, H. BirdNET: A deep learning solution for avian diversity monitoring. Ecol. Inform. 2021, 61, 101236. [Google Scholar] [CrossRef]
  14. Bielski, L.; Cansler, C.A.; McGinn, K.; Peery, M.Z.; Wood, C.M. Can the hermit warbler (Setophaga occidentalis) serve as an old-forest indicator species in the Sierra Nevada? J. Field Ornithol. 2024, 95, 4. [Google Scholar] [CrossRef]
  15. Hack, B.; Cansler, C.A.; Peery, M.Z.; Wood, C.M. Fine-scale forest structure, not management regime, drives occupancy of a declining songbird, the olive-sided flycatcher, in the core of its range. Ornithol. Appl. 2024, 126, duad065. [Google Scholar] [CrossRef]
  16. Schuster, G.E.; Walston, L.J.; Little, A.R. Evaluation of an autonomous acoustic surveying technique for grassland bird communities in Nebraska. PLoS ONE 2024, 19, e0306580. [Google Scholar] [CrossRef]
  17. Volk, M.I.; Hoctor, T.S.; Nettles, B.B.; Hilsenbeck, R.; Putz, F.E.; Oetting, J. Florida land use and land cover change in the past 100 years. In Florida’s Climate: Changes, Variations, & Impacts; Chassignet, E.P., Jones, J.W., Misra, V., Obeysekera, J., Eds.; Florida Climate Institute: Gainesville, FL, USA, 2017; pp. 51–82. [Google Scholar] [CrossRef]
  18. Menges, E.S. Ecology and conservation of Florida scrub. In The Savanna, Barren, and Rock Outcrop Communities of North America; Anderson, R.C., Fralish, J.S., Baskin, J., Eds.; Cambridge University Press: Cambridge, UK, 1999; pp. 7–22. [Google Scholar] [CrossRef]
  19. Bai, X.; Smidt, S.J.; Fan, Y.; Brophy, T.; Her, Y.G.; Manirakiza, N.; Li, Y.; Bhadha, J.H. Farming in shallow soils: Impacts of soil depth on crop growth in the Everglades Agricultural Area of Florida, USA. Field Crops Res. 2024, 316, 109523. [Google Scholar] [CrossRef]
  20. Baucum, L.E.; Rice, R.W.; Schueneman, T.J. An overview of Florida sugarcane. In University of Florida IFAS Extension Document SS-AGR-232; University of Florida: Gainesville, FL, USA, 2009. [Google Scholar] [CrossRef]
  21. U.S. Department of Agriculture (USDA). 2024 State Agriculture Overview—Florida. 2024. Available online: https://www.nass.usda.gov/Quick_Stats/Ag_Overview/stateOverview.php?state=FLORIDA (accessed on 20 March 2025).
  22. Sandhu, H.S.; Gilbert, R.A.; Comstock, J.C.; Gordon, V.S.; Korndörfer, P.; Arundale, R.A.; El-Hout, N. Registration of ‘UFCP 82-1655’sugarcane. J. Plant Regist. 2016, 10, 22–27. [Google Scholar] [CrossRef]
  23. Matsuoka, S. Energy cane: A revolutionary clean energy crop for the transition to a sustainable energy system. Acad. Environ. Sci. Sustain. 2025, 2, 1–17. [Google Scholar] [CrossRef]
  24. Collins, J.M.; Rohli, R.V.; Paxton, C.H. Florida Weather and Climate: More than Just Sunshine; University Press of Florida: Gainesville, FL, USA, 2017. [Google Scholar]
  25. NOAA National Centers for Environmental Information (NCEI) (Year) Global Historical Climatology Network (GHCN)—Daily Observation Data. National Oceanic and Atmospheric Administration. 2025. Available online: https://www.ncei.noaa.gov/maps/daily (accessed on 21 October 2025).
  26. Wood, C.; Sullivan, B.; Iliff, M.; Fink, D.; Kelling, S. eBird: Engaging birders in science and conservation. PLoS Biol. 2011, 9, e1001220. [Google Scholar] [CrossRef]
  27. R Core Team. R: A Language and Environment for Statistical Computing. 2022. Available online: https://r-project.org/ (accessed on 30 April 2025).
  28. Darras, K.; Batáry, P.; Furnas, B.; Celis-Murillo, A.; Van Wilgenburg, S.L.; Mulyani, Y.A.; Tscharntke, T. Comparing the sampling performance of sound recorders versus point counts in bird surveys: A meta-analysis. J. Appl. Ecol. 2018, 55, 2575–2586. [Google Scholar] [CrossRef]
  29. Oksanen, J.; Simpson, G.; Blanchet, F.; Kindt, R.; Legendre, P.; Minchin, P. Vegan: Community Ecology Package. R Package Version 2.6-2. 2022. Available online: https://vegandevs.github.io/vegan/ (accessed on 21 October 2025).
  30. Bates, D.; Mächler, M.; Bolker, B.; Walker, S. Fitting linear mixed-effects models using lme4. J. Stat. Softw. 2015, 67, 1–48. [Google Scholar] [CrossRef]
  31. Fox, J.; Weisberg, S. An R Companion to Applied Regression, 3rd ed.; Sage: Thousand Oaks, CA, USA, 2019. [Google Scholar]
  32. Lenth, R.; Singmann, H.; Love, J.; Buerkner, P.; Herve, M. Emmeans: Estimated Marginal Means. AKA Least-Squares Means, R Package Version 1.8.1. 2019. Available online: https://cran.r-project.org/web/packages/emmeans/index.html (accessed on 21 October 2025).
  33. Dinno, A. Dunn.test: Dunn’s Test of Multiple Comparisons Using Rank Sums. 2024. Available online: https://cran.r-project.org/web/packages/dunn.test/index.html (accessed on 8 November 2025).
  34. Wickham, H.; Chang, W.; Wickham, M.H. Package ‘ggplot2.’ Create Elegant Data Visualisations Using the Grammar of Graphics Version 2:1–189. 2016. Available online: https://cran.r-project.org/web/packages/ggplot2/index.html (accessed on 21 October 2025).
  35. Pearlstine, E.V.; Mazzotti, F.J.; Rice, K.G.; Liner, A. Bird observations in five agricultural field types of the Everglades Agricultural Area in summer and fall. Fla. Field Nat. 2004, 32, 75–127. [Google Scholar]
  36. Pearlstine, E.V.; Mazzotti, F.J.; Kelly, M.H. Relative distribution and abundance of wintering raptors in agricultural and wetland landscapes of south Florida. J. Raptor Res. 2006, 40, 81–85. [Google Scholar] [CrossRef]
  37. Miller, M.W.; Pearlstine, E.V.; Dorazio, R.M.; Mazzotti, F.J. Occupancy and abundance of wintering birds in a dynamic agricultural landscape. J. Wildl. Manag. 2011, 75, 836–847. [Google Scholar] [CrossRef]
  38. Townsend, S.E.; Pearlstine, E.V.; Mazzotti, F.J.; Deren, C.W. Wading birds, shorebirds, and waterfowl in rice fields within the Everglades Agricultural Area. Fla. Field Nat. 2006, 34, 9–20. [Google Scholar]
  39. Darras, K.; Pütz, P.; Fahrurrozi; Rembold, K.; Tscharntke, T. Measuring sound detection spaces for acoustic animal sampling and monitoring. Biol. Conserv. 2016, 201, 29–37. [Google Scholar] [CrossRef]
  40. Kross, S.M.; Bourbour, R.P.; Martinico, B.L. Agricultural land use, barn owl diet, and vertebrate pest control implications. Agric. Ecosyst. Environ. 2016, 223, 167–174. [Google Scholar] [CrossRef]
  41. Pérez-Granados, C. BirdNET: Applications, performance, pitfalls, and future opportunities. IBIS 2023, 165, 1068–1075. [Google Scholar] [CrossRef]
  42. Wood, C.M.; Kahl, S. Guidelines for appropriate use of BirdNET scores and other detector outputs. J. Ornithol. 2024, 165, 777–782. [Google Scholar] [CrossRef]
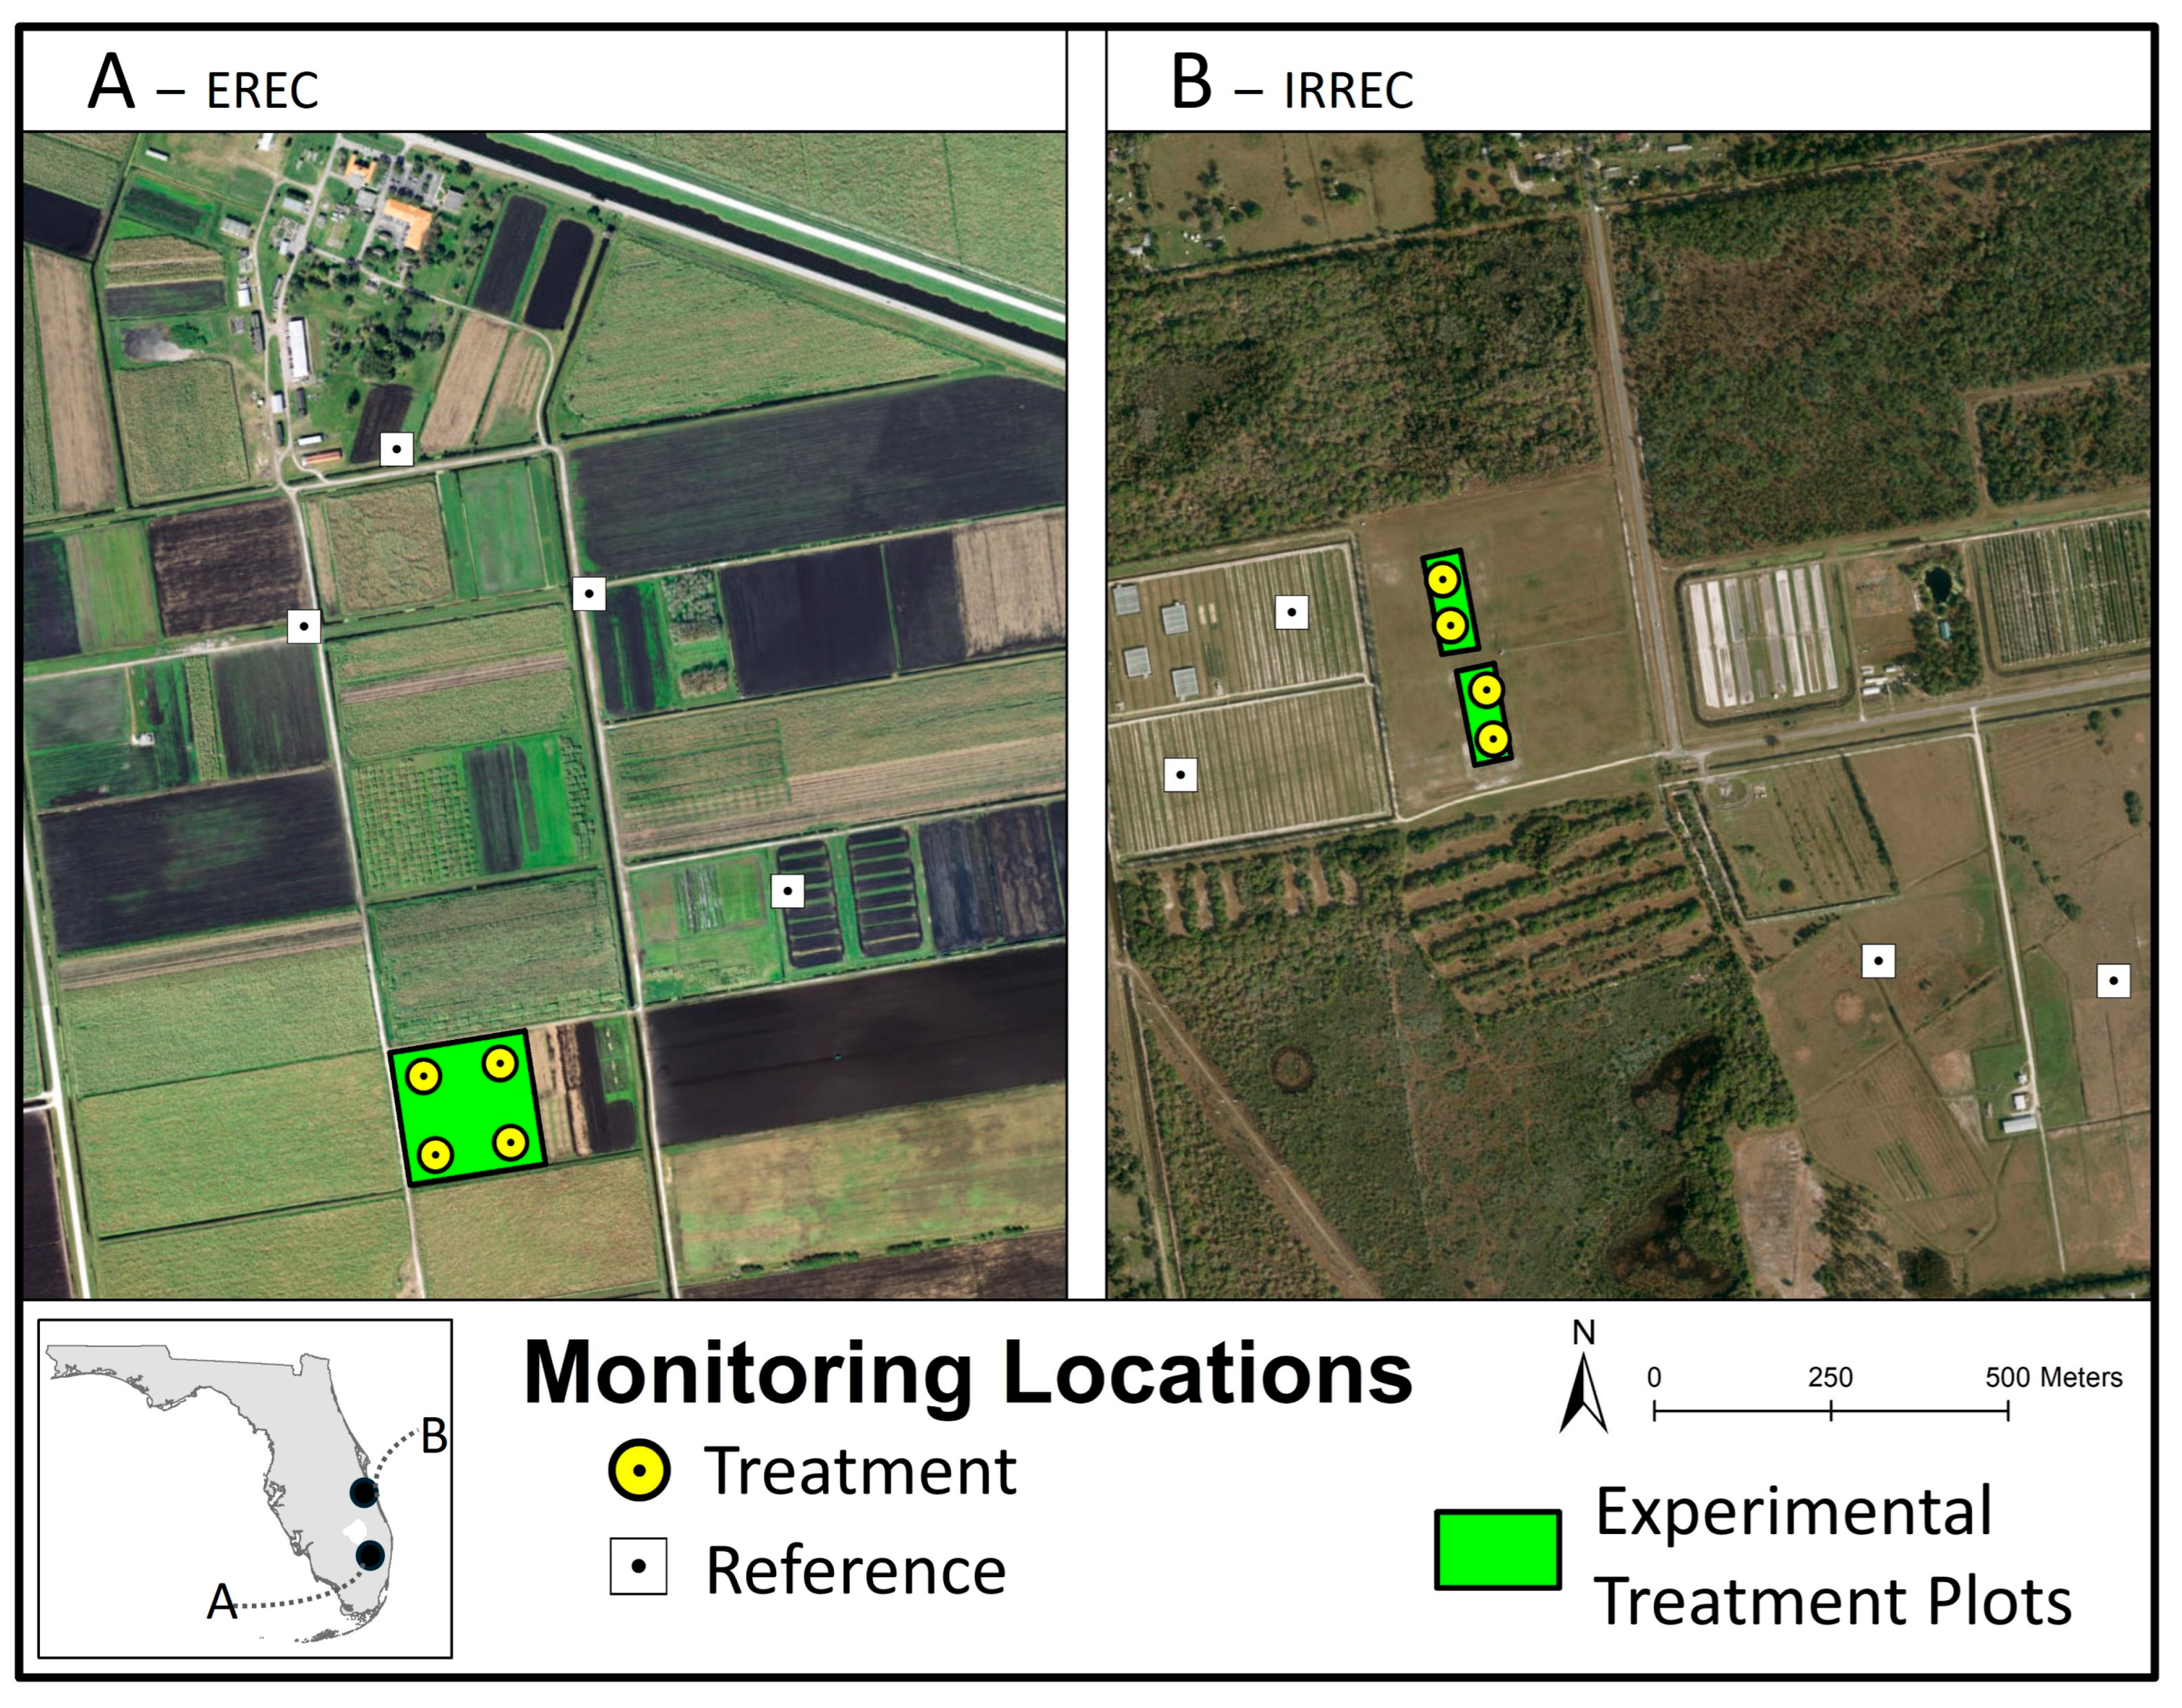
Figure 1. Acoustic monitoring locations at (A) Everglades Research and Education Center (EREC) and (B) Indian River Research and Education Center (IRREC) in this study. The geographic locations of these study sites in the state of Florida are shown in the inset. Source of satellite imagery: Environmental Systems Research Institute, Maxar, Earthstar Geographics.
Birds 06 00060 g001
Figure 2. Example photographs from stationary acoustic monitoring locations at (A) Everglades Research and Education Center (EREC) during the pre-planting period (29 November 2021), (B) EREC during the post-planting period prior to harvest (19 December 2023), (C) Indian River Research and Education Center (IRREC) during the pre-planting period (1 December 2021), (D) IRREC during the post-planting period prior to harvest (9 December 2023); and (E) an ARU positioned near the IRREC treatment plot in March 2023, approximately 3 months after the Energycane was planted.
Birds 06 00060 g002
Figure 3. Boxplot of average vegetation height within 50 m of each acoustic monitoring location (veg50) by season. Different letters indicate statistically significant differences within each season, based on generalized linear mixed models and pairwise Tukey’s post hoc tests (p < 0.05).
Birds 06 00060 g003
Figure 4. Boxplots of daily focal avian species diversity, total species richness, Passerine species richness, and Shorebird species richness among treatment groups by season. The three treatment groups are Energycane (EC) plots in the pre-planting period (EC Pre-Planting), EC plots during the post-planting period (EC Post-Planting), and Reference sites in the post-planting period (Reference Post-Planting). Different letters indicate statistically significant differences within each season, based on generalized linear mixed models and pairwise Tukey’s post hoc tests (p < 0.05).
Birds 06 00060 g004
Figure 5. Boxplots of seasonal cumulative (season-long) focal species richness among three treatment groups: Energycane (EC) plots in the pre-planting period (EC Pre-Planting), EC plots during the post-planting period (EC Post-Planting), and Reference sites in the post-planting period (Reference Post-Planting). There were no differences among treatment groups by season, based on non-parametric Kruskal–Wallis tests (p > 0.143).
Birds 06 00060 g005
Table 1. Summary of the 40 focal bird species evaluated in this study, in alphabetical order by taxonomic group. Total number of detections are provided for each species during the entire study period (2021–2024), after filtering to the species-specific confidence threshold (SSCT).
Focal Species NameTaxonomic GroupTotal Detections (2021–2024)Species-Specific Confidence Threshold (SSCT) a
Blue Jay (Cyanocitta cristata)Passerine46,2230.25
Blue-gray Gnatcatcher (Polioptila caerulea)Passerine14950.50
Cedar Waxwing (Bombycilla cedrorum)Passerine12,6690.90
Chimney Swift (Chaetura pelagica)Passerine43740.80
Common Yellowthroat (Geothlypis trichas)Passerine86,3380.80
“Crow” (American [Corvus brachyrhynchos] and Fish [Corvus ossifragus])Passerine15,6380.25
Eastern Bluebird (Sialia sialis)Passerine41840.90
Eastern Meadowlark (Sturnella magna)Passerine290,0720.40
Eastern Phoebe (Sayornis phoebe)Passerine19,0200.50
“Grackle” (Boat-tailed [Quiscalus major] and Common [Quiscalus quiscula])Passerine285,9750.25
House Finch (Haemorhous mexicanus)Passerine24420.80
House Wren (Troglodytes aedon)Passerine20550.50
Loggerhead Shrike (Lanius ludovicianus)Passerine45,2940.90
Northern Mockingbird (Mimus polyglottos)Passerine43,6540.50
Palm Warbler (Setophaga palmarum)Passerine108,7710.50
Purple Martin (Progne subis)Passerine19,6700.70
Red-winged Blackbird (Agelaius phoeniceus)Passerine72,0860.25
Savannah Sparrow (Passerculus sandwichensis)Passerine50,4000.40
Swamp Sparrow (Melospiza georgiana)Passerine57950.70
Yellow-rumped Warbler (Setophaga coronata)Passerine20290.90
American Kestrel (Falco sparverius)Owls & Raptors (Falconiformes)31,6590.40
Barn Owl (Tyto alba)Owls & Raptors (Strigiformes)161,9260.70
Cooper’s Hawk (Astur cooperii)Owls & Raptors (Accipitriformes)14070.90
Northern Harrier (Circus hudsonius)Owls & Raptors (Accipitriformes)88700.80
Red-shouldered Hawk (Buteo lineatus)Owls & Raptors (Accipitriformes)54,3270.70
Red-tailed Hawk (Buteo jamaicensis)Owls & Raptors (Accipitriformes)27270.80
Black-crowned Night-heron (Nycticorax nycticorax)Shorebird (Pelecaniformes)80110.90
Black-necked Stilt (Himantopus mexicanus)Shorebird (Charadriiformes)26,7050.80
Caspian Tern (Hydroprogne caspia)Shorebird (Charadriiformes)23910.80
Common Gallinule (Gallinula galeata)Shorebird (Gruiformes)10,2110.80
Great Blue Heron (Ardea herodias)Shorebird (Pelecaniformes)10,3120.90
Great Egret (Ardea alba)Shorebird (Pelecaniformes)24780.80
Green Heron (Butorides virescens)Shorebird (Pelecaniformes)54010.90
Killdeer (Charadrius vociferus)Shorebird (Charadriiformes)379,4290.25
Limpkin (Aramus guarauna)Shorebird (Gruiformes)10,1460.80
“Yellowlegs” (Greater [Tringa melanoleuca] and Lesser [Tringa flavipes])Shorebird (Charadriiformes)26,7050.80
Chuck-will’s-widow (Antrostomus carolinensis)Other (Caprimulgiformes)93,4220.40
Common Nighthawk (Chordeiles minor)Other (Caprimulgiformes)2,039,8210.30
“Dove” (Common Ground [Columbina passerina] and Mourning [Zenaida macroura])Other (Columbiformes)28,4840.60
Northern Bobwhite (Colinus virginianus)Other (Galliformes)64,5110.50
a Species-specific confidence threshold (SSCT) determined based on BirdNET precision estimates. See Supplementary Materials for species-specific BirdNET precision graphs.
Table 2. The results of the generalized linear mixed models (GLMMs) to compare avian species diversity and richness across treatment groups by season. All GLMMs included average vegetation height within 50 m of each acoustic monitoring location (veg50) as a random slope 1.
MetricTaxonomic GroupTreatment Group
χ2p
Spring
Species DiversityFocal Species Diversity 1.1950.550
Species RichnessTotal Focal Species Richness3.9310.140
Passerines2.8840.236
Shorebirds4.4630.107
Summer
Species DiversityFocal Species Diversity 0.4460.800
Species RichnessTotal Focal Species Richness2.6000.272
Passerines5.4550.080
Shorebirds1.8370.399
Fall
Species DiversityFocal Species Diversity 8.2090.016
Species RichnessTotal Focal Species Richness14.091<0.001
Passerines9.4930.009
Shorebirds8.1810.017
Winter
Species DiversityFocal Species Diversity 40.058<0.001
Species RichnessTotal Focal Species Richness5.9220.050
Passerines9.4740.009
Shorebirds16.187<0.001
1 All GLMMs were based on the following general formula using the ‘lmer’ package in R: lmer(y~Treatment. Group + (veg50|ARU) + (1|Site/ARU)).
Disclaimer/Publisher’s Note: The statements, opinions and data contained in all publications are solely those of the individual author(s) and contributor(s) and not of MDPI and/or the editor(s). MDPI and/or the editor(s) disclaim responsibility for any injury to people or property resulting from any ideas, methods, instructions or products referred to in the content.