Article

Influence of Park Size and Noise Pollution on Avian Species Richness in Urban Green Spaces: A Case Study from Mexico City

by
Claudia Yeyetzi Salas-Rodríguez
1,
Carlos Lara
2,
Luis A. Sánchez-González
3 and
Pablo Corcuera
4,*
1
Doctorado en Ciencias Biológicas y de la Salud, Universidad Autónoma Metropolitana, Ciudad de México 09310, Mexico
2
Centro de Investigación en Ciencias Biológicas, Universidad Autónoma de Tlaxcala, San Felipe Ixtacuixtla, Tlaxcala 90120, Mexico
3
Laboratorio de Procesos Evolutivos y Diversidad de Aves Neotropicales, Museo de Zoología, Department de Biología Evolutiva, Facultad de Ciencias, Universidad Nacional Autónoma de México, Ciudad de México 09310, Mexico
4
Departamento de Biología, Universidad Autónoma Metropolitana, Ciudad de México 09310, Mexico
*
Author to whom correspondence should be addressed.
Birds 2025, 6(3), 46; https://doi.org/10.3390/birds6030046
Submission received: 30 June 2025 / Revised: 29 August 2025 / Accepted: 29 August 2025 / Published: 1 September 2025

Simple Summary

Urbanization affects birds by destroying or dividing their habitats. However, urban parks provide shelter and protection. In these parks, traffic noise and other human activities may cause some birds to leave these areas or change their behavior. In this study, birds in nine parks in Mexico City were observed for one year. The size of the park, the mean noise level dB(A), and the amount of vegetation were considered. A total of 108 types of birds were found, 5 of which are protected by Mexican regulations. Birds were classified according to their food sources (seeds, fruits, or insects), and park size and noise were found to be important factors in determining which birds were present. Birds that eat seeds or all types of food (omnivores) are more tolerant of noise, while birds that eat insects or fruits prefer larger, quieter parks. These results show that it is important to conserve large green areas and reduce noise in cities to protect bird diversity.

Abstract

Urbanization affects bird communities by reducing habitat and fragmenting ecosystems. Urban parks can help counteract these effects. However, anthropogenic noise can further alter bird composition. We examined the distribution and abundance of bird species in nine urban parks in Mexico City. We used a ten minute fixed-radius (25 m) point-counting technique to count birds along their annual cycle, with ten minutes allocated for bird counts. The quality of green areas was analyzed in terms of vegetation (Normalized Difference Vegetation Index), park size, and mean noise level dB(A) (based on MIN and MAX values), and species were grouped into trophic guilds. A total of 108 bird species were recorded, 5 of which are under special protection; we grouped all species into 14 trophic guilds, showing different responses to environmental gradients. Redundancy analysis (RDA) explained 89.98% of the variance, with noise and park size being the most influential variables. Granivores and omnivores were more tolerant to noise, while insectivores and frugivores preferred quieter areas with more vegetation. A positive association was observed between the presence of winter resident species and the park size. On the other hand, mean noise level dB(A) was negatively related to permanent resident species, winter resident species, and those with protected status. Conservation efforts should focus on maintaining ample green spaces and reducing noise pollution, as recorded high mean noise levels (>53 dB(A)) exceed the recommended thresholds for avifauna conservation.

1. Introduction

Urbanization is a global phenomenon that profoundly impacts biodiversity, often leading to habitat loss, fragmentation, and homogenization of ecosystems [1,2]. However, parks within cities help to mitigate these negative aspects and have great ecological importance that allows the maintenance of avian biodiversity [3,4,5]. The capacity of these green spaces to support diverse biotic communities is influenced by several factors, including park size habitat quality, landscape connectivity, and anthropogenic disturbances such as noise pollution [6,7,8].
The relationship between area and species richness explored by MacArthur and Wilson (2002) [9] has been well documented in island-like habitats such as city parks. For instance, Fernández-Juricic and Jokimäki (2001) [10] found that park size was positively correlated with bird species richness in both Mediterranean and boreal cities. Similarly, Garaffa et al. (2009) [11] and Charre et al. (2013) [12] showed that larger urban green spaces in Buenos Aires and Mexico City, respectively, had a higher bird species richness than smaller parks. The main findings of Jokimäki (1999) [13] revealed that park size is the most influential factor in species richness, with larger parks hosting a greater diversity of birds. Park area is one of the most important predictors of breeding bird species richness.
However, the relationship between park size and avian diversity is not always straightforward and can be influenced by other factors such as habitat heterogeneity, connectivity, and local environmental conditions [14,15,16]. Habitat quality, often represented by vegetation structure and measured through indices like the Normalized Difference Vegetation Index (NDVI), can be a crucial predictor of bird diversity in urban settings [17,18]. Parks with higher vegetation density and complexity typically support more diverse bird communities regardless of size [19].
Beyond vegetation characteristics, acoustic ecology represents another critical dimension in urban bird habitats. Noise is an often overlooked factor that modifies the number of species in parks of different sizes. Anthropogenic noise can interfere with bird communication, alter foraging behavior, and even influence reproductive success [20,21,22]. Francis et al. (2009) [23] demonstrated that acoustic pollution can alter the composition of avian communities, and that species differ in their levels of noise tolerance. This selective pressure may result in a homogenization of urban bird communities, potentially reducing overall biodiversity. McClure et al. (2013) [24] recorded a 28% decrease in bird abundance and a near-total avoidance of some species on the so-called “ghost highway” during periods of noise in an experimental design. This result demonstrates, experimentally, that traffic noise is a major factor in the negative effects that roads have on bird populations. Background noise can mask essential sounds such as songs, calls, or acoustic signals from predators and prey, which increases vigilance and reduces food intake. Moreover, Proppe et al. (2013) [21] found that experimental traffic noise reduced bird abundance and altered species composition in roadside habitats, highlighting the direct impact of noise on avian communities. The effects of noise can be particularly pronounced in urban environments where noise levels often exceed natural background levels by 20–30 dB in roads (Bavaria, Germany), airports (United States), and highways (Netherlands, United States) [25]. In European cities, such as Kavala (Greece) and Rovaniemi (Finland), noise levels in the morning ranging from (40.02 ± 3.94 dB(A)) to (34.66 ± 3.23 dB(A)) have been reported in small urban green spaces [26]. Particularly in Mexico City, noise levels in green areas range from 49.6 ± 1.0 dB(A) during the quietest periods to 57.3 ± 1.3 dB(A) during the noisiest periods [27].
These environmental filters not only affect species richness but can also shape the functional structure of bird communities, particularly their trophic guild composition [28]. Certain feeding guilds, such as insectivores, may be more sensitive to urban disturbances than others, like omnivores or granivores [29,30]. Understanding how these functional groups respond to urbanization factors provides deeper insight into ecosystem processes and services in city environments [31].
Despite the growing body of research on individual urban factors shaping avian communities, the examination of how these variables interact simultaneously in shaping urban bird communities remains as a critical need. While studies have examined these factors separately, few have investigated their combined effects on avian diversity in urban environments [32,33]. This gap in knowledge is particularly significant given that the impacts of urbanization on biodiversity can vary across different geographical and cultural contexts [34,35].
To address this research gap, we selected Mexico City as our study area due to its unique characteristics as a megacity with diverse green spaces. Mexico City is the fifth most populated city in the world with 22,752,400 inhabitants, and, particularly in this megacity, research focusing on the effects of noise on birds is scarce; according to Scopus, and with the keywords (birds, Mexico City, noise, parks), only two articles have been published. The inhabitants of Mexico City increase on average by 3,529,233 people per year due to migration [36,37], and consequently the use of public and private transportation and the number of people who visit parks for recreational purposes are increasing every day, and consequently noise levels are constant and increasing. Mexico City is a city with particular characteristics, such as rapid changes in land use, changes in the landscape, and the introduction of exotic plant species [38]; therefore, urban parks and protected natural areas in this city are of utmost importance. They contain a great diversity of vegetation and relics of native vegetation, thus providing feeding, nesting, shelter, and resting sites for both native and migratory species. Mexico City is one of the largest urban agglomerations globally, thus providing an ideal setting to explore these relationships due to its diverse array of green spaces, ranging from small neighborhood parks to large urban forests, coupled with varying levels of urbanization and associated noise. Urban green spaces in Mexico City vary considerably in size, vegetation structure, and exposure to urban pressures, creating a natural gradient ideal for investigating the effects of these variables on avian communities [39,40]. Our main study aims were to examine the relationships between park size, mean noise level dB(A), and bird richness across nine urban parks in Mexico City, and to determine how environmental variables collectively influence avian species composition and food guild structure.
We raised three specific research questions: (1) How does park size correlate with bird species richness in urban green spaces in Mexico City? (2) What patterns emerge between noise levels and avian diversity in these parks? (3) How do environmental variables collectively influence avian species composition and food guild structure?
We hypothesized that larger parks would harbor greater bird species richness, but that this relationship would be modulated by noise levels. Additionally, we hypothesized that different trophic guilds would show varying tolerance to noise pollution based on their ecological specialization.
We predicted the following: (1) bird species richness would increase with park size; (2) noise levels would negatively impact species richness, particularly for specialist species; and (3) granivorous and omnivorous guilds would show greater tolerance to noise pollution compared to insectivorous and frugivorous guilds due to their dietary flexibility and reduced dependence on acoustic communication for foraging.

2. Materials and Methods

2.1. Study Site

We selected nine urban parks in Mexico City (CDMX) considering their size, vegetation cover, different noise gradients, and accessibility (Table S1). The selection was designed to capture the natural variation in urban green space characteristics while ensuring logistical feasibility for intensive monthly monitoring. Due to their characteristics and function, the Mexico City government has classified these nine green areas as urban parks [41]. Three of them are important protected natural areas categorized as National Parks. These areas are essential for the ecological balance, quality of life, and sustainability of Mexico City. Their preservation must be a priority in the face of urbanization and climate change. Among these National Parks is the Tlalpan Forest National Park, where scientific articles on the diversity of its fauna are scarce. CDMX, located 19°25′10″ N 99°08′44″ W, covers an area of 1585 km2, and altitude ranges from 2300 to 3930 m a.s.l. The region has four climate types including semi-dry temperate (6.63% of the total area), semi-cold humid (6.04%), semi-cold sub-humid (27.43%), and temperate sub-humid (59.90%) [42,43].
The average annual temperature is 16 °C, with maximum temperatures exceeding 30 °C in summer. The annual precipitation ranges from 1000 to 1500 mm. There are different covering types, such as urban (48%), natural (36%), and peri-urban with agriculture and human settlements (16%) [44].
The spatial delimitation of the parks was conducted through remote perception assessment using QGIS software version 3.22. We generated polygons for each park using high-resolution satellite imagery (Google Earth Pro, capture date: January 2023). The vectorial layer shapefile of each polygon was created with the function “polygon geometry” of QGIS. We georeferenced the satellite images, and the park perimeter was delineated with the QGIS tool “add polygon”.
Finally, each layer of the parks was edited independently (Figure 1). The polygon area was estimated in ha, with a variation of ±0.01 ha.

2.2. Terrestrial Bird Monitoring

We conducted bird monitoring using point counts within the previously defined polygons. A 25 m internal buffer area was created for each polygon, and a grid of equidistant points spaced 150 m apart was subsequently constructed [45]. Bird counting was carried out within a 25 m radius, and all species observed and heard were registered. We allocated ten minutes per count point to avoid double-counting the same individual. Monitoring was conducted from 7:00 a.m. to 12:00 p.m., the peak time of avian activity [46,47]. This time was determined to standardize the start of monitoring across all parks, as accessibility to the counting points varies, and it is close to dawn in Mexico City.
The monitoring was conducted monthly during a one-year period from May 2023 to April 2024. We conducted a total of 18 prospective visits and 108 campaigns. The censuses were conducted by the same person to ensure data consistency [47]. We visited the parks in an alternating weekly manner, and the point counts were systematically rotated to avoid temporal bias. Species recorded were classified according to four criteria: by their residence in the CDMX (permanent residents, summer residents, winter residents), by their conservation status according to Mexican regulations (NOM-059-SEMARNAT) (probably extinct in the wild, endangered, threatened, subject to special protection), by their category on the Red List of Threatened Species-International Union for Conservation of Nature and Natural Resources (IUCN) (not assessed, data deficient, least concern, near threatened, vulnerable, endangered, critically endangered, extinct in the wild, extinct), and by their degree of endemism (endemic, semi-endemic, quasi-endemic, and alien species) [48,49,50]. The observed bird counts were corrected by dividing them by the estimated detection probability for each survey, which allowed for more precise abundance estimates. The abundance values were then logarithmically transformed to normalize the data before analysis. Raptors were only included in the analysis for species with protected status. They were excluded from the remaining statistical analyses, as were nocturnal birds and hovering birds such as swallows, because the circle-plot method used is unsuitable for species that require very large areas to establish in a habitat.

2.3. Environmental Variables

The noise level dB(A) was measured using a digital sound level meter Steren® (San Diego, CA, USA), HER-404 (range, 30–130 dB; frequency weighting: A; slow response; ANSI S1.4, Class II). This equipment displays and records maximum or minimum sound levels captured during a measurement period. At each count point, noise measurements were taken before and after the 10 min bird count period. We recorded the maximum and minimum dB(A) values detected during a 50 s sampling period, resulting in four values per count point (pre-count maximum, pre-count minimum, post-count maximum, post-count minimum). From these measurements, we calculated mean MIN dB(A) values (averaging the pre-count and post-count minimum values) and mean MAX dB(A) values (averaging the pre-count and post-count maximum values) for each count point. Subsequently, all count point values were averaged to obtain park-level mean MIN dB(A) and mean MAX dB(A) values, which were then averaged together to calculate the mean noise level dB(A) used for statistical analysis.
The Normalized Difference Vegetation Index (NDVI) and park size were also quantified. NDVI values were extracted from Landsat 9 OLI TIRS satellite images obtained through the USGS Earth Explorer platform. This spectral index ranges from −1 to +1, with higher values indicating denser and healthier vegetation. Park sizes were delineated and calculated using remote sensing techniques in QGIS (see above). For analysis purposes, values were averaged to obtain a single value per variable for each point count.

2.4. Data Analysis

Species accumulation curves were generated to assess sampling efficiency and completeness of the inventory. These curves represent the increase in the number of species recorded in relation to the effort expended on monitoring; the maximum values are represented by an asymptote, which suggests that all species have been recorded [51]. Curves were estimated using a non-parametric Chao1 estimator, which estimates the total number of species in a community based on abundance data and the number of rare species in the monitoring. The Jackknife 1 estimator, which is based on a resampling technique that considers the frequency of rare species to project a more robust estimate of total richness, was also used [52,53]. To compare species richness between parks with different sample sizes, rarefaction curves were used, which allow for data interpolation. These curves relate the number of species to the number of individuals, calculating the expected richness for a standardized sample size [54,55].
We tested normality using the Shapiro–Wilks test for all variables. Results showed that most variables followed normal distribution (p > 0.05), validating the use of parametric Pearson correlations. To evaluate species composition similarity and establish functional groupings, hierarchical clustering was performed using UPGMA (Unweighted Pair Group Method with Arithmetic Mean), with the Jaccard similarity index as the dissimilarity measure. This index was calculated from presence/absence matrices (0/1) including the following functional traits: feeding preference, foraging substrate, foraging stratum, and foraging technique [56,57].
Redundancy analysis (RDA) with variance partitioning was used to evaluate the relationship between species distribution and the relative contribution of environmental variables in urban parks. MIN and MAX noise levels dB(A) (Table 1) were significantly correlated with each other (r2 = 0.974, n = 9, p < 0.001); these values were averaged to create a single noise variable representing the acoustic gradient across park, referred to as mean noise level dB(A). Then, the variables were structured into two groups: the first group included mean noise level, and the second, NDVI and the size of each park. Closer vectors in the same direction indicate a stronger positive relationship between variables, while those in opposite directions reflect a negative relationship [58,59].
To complement our multivariate community analysis, we implemented GLMs for four key ecological variables that address our main research objectives and conservation concerns. Total species richness was modelled, as it directly addresses our primary research question about the relationship between park characteristics and avian diversity. Protected species were analyzed separately due to their conservation priority and potential heightened sensitivity to urban disturbances. Additionally, we modelled abundances of two functionally contrasting guilds: foliage insectivores (habitat specialists requiring complex vegetation structure and low disturbance) and ground omnivores (urban-adapted generalists that exploit disturbed environments and anthropogenic food sources). We assessed multicollinearity among predictor variables using variance inflation factors (VIF) calculated in Xlstat software (https://www.xlstat.com/), with VIF < 5 considered acceptable following standard ecological modeling practices. Additional correlation analysis was conducted with r < 0.7 as the threshold. Due to high correlation between park area and noise level (r = −0.847), noise was excluded from GLM analyses to avoid multicollinearity issues. All GLMs used Poisson distribution with a logarithmic link function appropriate for count data, with park area (hectares) and NDVI as final predictor variables. We fitted full models with both predictors based on a priori ecological hypotheses, park area representing habitat availability (island biogeography theory) and NDVI representing vegetation quality, rather than conducting formal model selection procedures. Model performance was evaluated using AIC values. All analyses were conducted in R using the glm() function.
We finally compared the environmental variables recorded in the parks according to the number of species with protected status (t-test); the parks were divided into two groups (group 1, one species under protection; group 2, two or more species under protection).

3. Results

3.1. Environmental Variables

The highest MAX noise levels were recorded at PM and PV (>55 dB(A)), and the lowest MIN values were recorded at BT and CE (<44 dB(A)). Parks with the largest areas were BT (239.49 ha), CE (145.15 ha), and CH1 (116.47 ha), while the smallest were PL (6.15 ha) and PM (6.83 ha). NDVI values remained above 0.45; the highest value was recorded for PM (0.64), and the lowest was calculated for CE (0.24). The number of monitoring count points varied according to park size (Table 1).

3.2. Avian Community Composition

During the period from May 2023 to April 2024, 108 species from 28 families and 7 orders were recorded. The most representative families were Tyrannidae and Parulidae (16 species each), Icteridae (9 species), and Cardinalidae, Turdidae, and Passerellidae (7 species each). Of the total number of species documented, 79 were permanent residents, 24 were winter residents, 4 were summer residents, and 1 was transient. In terms of endemism, 4 endemic, 7 semi-endemic, and 4 quasi-endemic species were recorded. In accordance with NOM-059- SEMARNAT-2010, 5 species were identified in the category “subject to special protection”: Sharp-shinned Hawk (Accipiter striatus), Cooper’s Hawk (Astur cooperii), Broad-winged Hawk (Buteo platypterus), Harris’s Hawk (Parabuteo unicinctus), and Brown-backed Solitaire (Myadestes occidentalis). Additionally, Loggerhead Shrike (Lanius ludovicianus) is listed as near-threatened according to the Red List of Threatened Species of IUCN (Table S2).

3.3. Inventory Completeness

Inventory completeness varied among parks, with the highest values observed for VC (96.36%) and PL (95.23%) using the Chao1 estimator, while CH1 showed the lowest completeness (83.62%). Jackknife 1 estimates were generally lower, ranging from 77.55% (CE) to 88.03% (PM). Rarefied richness was highest at CE (75.95) and lowest at PM (26.96), reflecting differences in park size and habitat complexity (Table 2).

3.4. Trophic Guilds

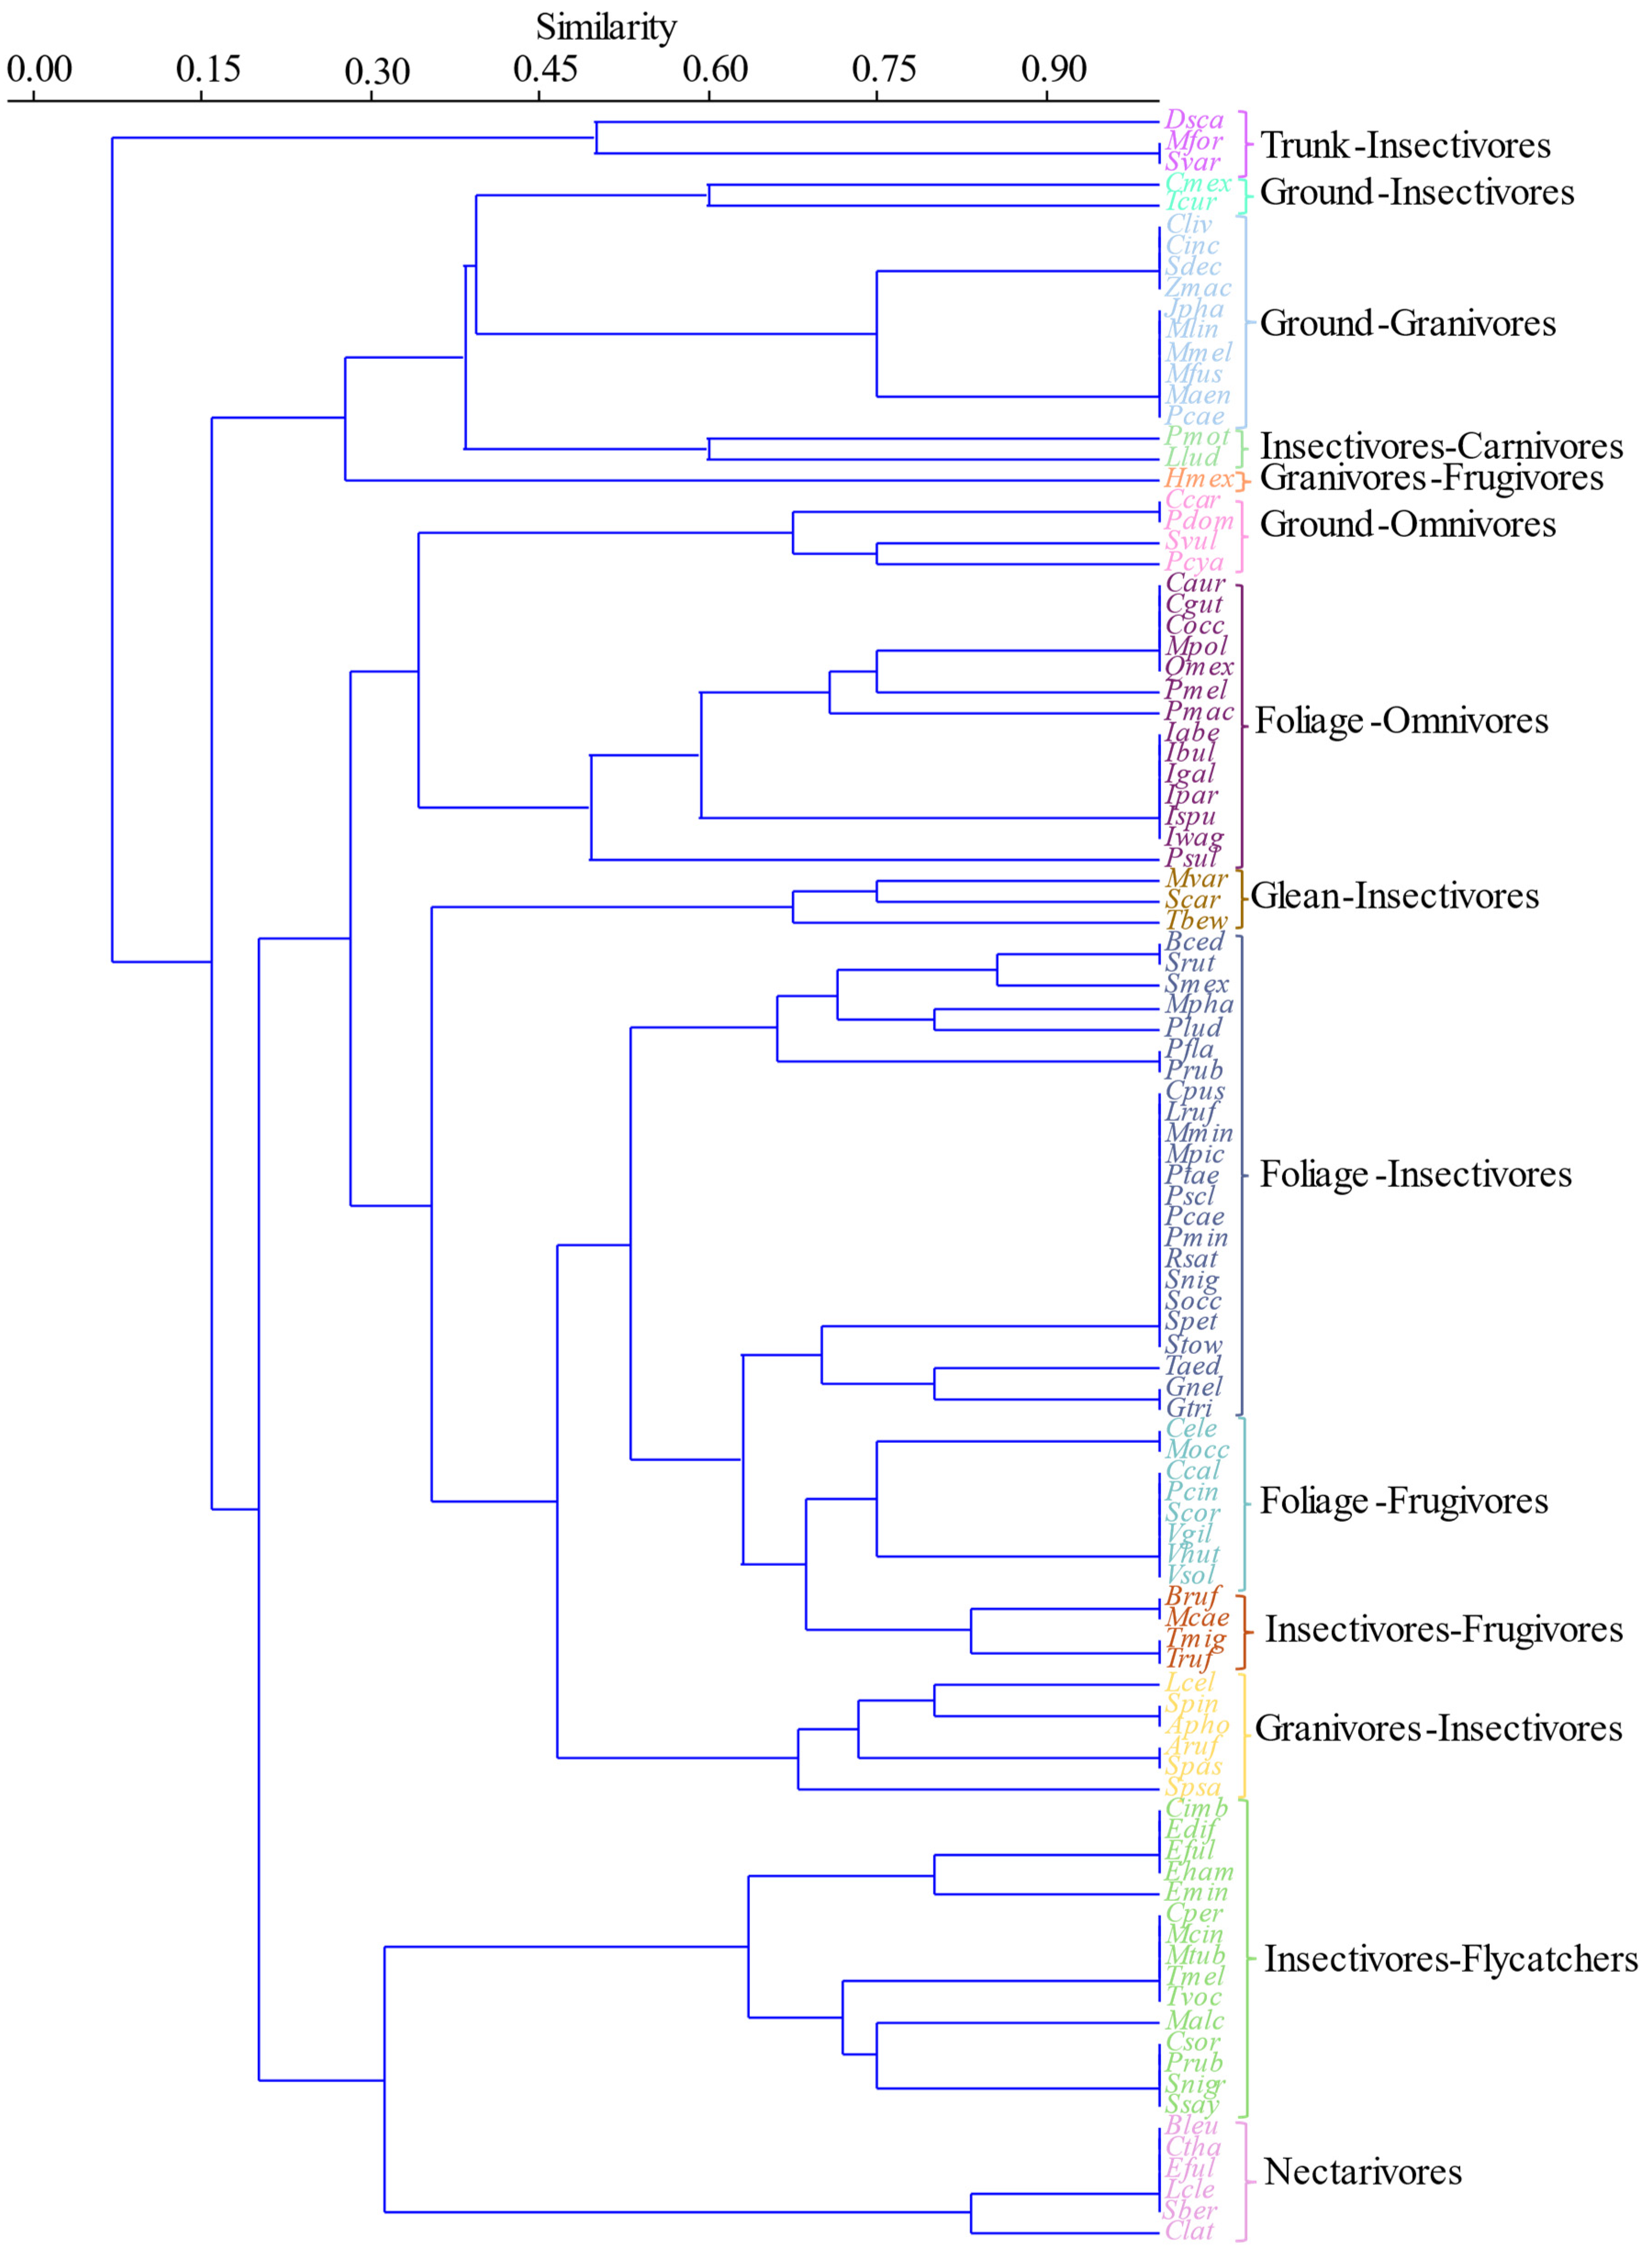
Through similarity analysis based on UPGMA-Jaccard, a dendrogram was obtained that grouped species into fourteen trophic guilds. The foliage insectivore grouping stood out, gathering the largest number of species (23), showing some overlap with glean insectivore guilds (3 species) and insectivore–granivore guilds (6 species). The omnivore guild was divided into two subgroups: foliage omnivores (14 species) and ground omnivores (4 species). Species included in the ground insectivore (2 species) and ground granivore (10 species) groups showed a close relationship based on substrate use. On the other hand, species from the carnivore–insectivore guilds (2 species) and the frugivore–granivore guild (1 species) did not show clear affinity with other groupings. The insectivore–frugivore (4 species) and foliage frugivore (8 species) groups shared some functional proximity. Species of the flycatcher insectivore guild (15 species) clustered closely together. Finally, the nectarivore (6 species) and trunk insectivore (3 species) groupings were positioned in isolation in the dendrogram (Figure 2).
Generalized linear models revealed that park size was the most consistent predictor of bird community patterns, significantly affecting total species richness (p < 0.001), foliage insectivores (p < 0.001), and protected species (p = 0.238) (Table 3). All significant relationships with park size were positive, indicating that larger parks consistently support higher species diversity and abundance of habitat-sensitive guilds. Ground omnivores showed no significant response to park size (p = 0.306), confirming their tolerance to urban environmental constraints and ability to persist in smaller fragmented habitats. This contrasts markedly with foliage insectivores, which showed the strongest positive response to park area, reflecting their requirement for larger, higher-quality habitats. Vegetation quality (NDVI) was significant only for total species richness (p = 0.024), suggesting that vegetation density affects overall community diversity but does not specifically influence individual functional groups. Interestingly, all NDVI coefficients were negative, indicating that areas with very dense vegetation may not necessarily support higher bird abundances, possibly due to reduced habitat heterogeneity or dominance by exotic vegetation. Model performance varied across response variables, with protected species showing the best fit (AIC = 31.745), followed by ground omnivores (AIC = 34.490), foliage insectivores (AIC = 47.549), and total richness (AIC = 66.783). The strong model performance for protected species suggests that park characteristics are particularly important predictors for conservation-priority taxa.
Prior to GLM analysis, multicollinearity assessment revealed the following VIF values: park size (VIF = 3.584), NDVI (VIF = 1.392), and noise level (VIF = 4.189). Although all VIF values were below the acceptable threshold of 5, we excluded noise level from subsequent analyses due to its strong negative correlation with park size (r = −0.847). The final models included only park size and NDVI, both meeting multicollinearity criteria.

3.5. Multivariate Analysis and Environmental Relationships per Species

Redundancy analysis (RDA) explained 89.98% of the variance in its first two axes (axis 1 = 61.64%, axis 2 = 28.25%). Mean noise level dB(A) and park size showed the strongest relationship with species distribution. Axis 1 showed a negative correlation with mean noise level dB(A) and a positive correlation with park size, suggesting it represented a gradient from large, conserved areas to smaller areas with higher noise intensity. Axis 2 showed less influence from environmental variables, although noise maintained a negative correlation. Axis 3 was associated with NDVI, showing that this variable presented a gradient independent of park size and noise (Tables S3 and S4, Figure 3). The ordination revealed that Great-tailed Grackle (Quiscalus mexicanus), House Sparrow (Passer domesticus), Rufous-backed Robin (Turdus rufopalliatus), Inca Dove (Columbina inca), Rock Pigeon (Columba livia), European Starling (Sturnus vulgaris), Bewick’s Wren (Thryomanes bewickii), and Eurasian CollaredDove (Streptopelia decaocto), among others, were associated with sites of higher noise intensity and smaller area. In contrast, White-eared Hummingbird (Basilinna leucotis), Buff-breasted Flycatcher (Empidonax fulvifrons), Dusky-capped Flycatcher (Myiarchus tuberculifer), Tufted Flycatcher (Mitrephanes phaeocercus), Acorn Woodpecker (Melanerpes formicivorus), Orange-billed Nightingale-Thrush (Catharus aurantiirostris), Say’s Phoebe (Sayornis saya), Yellow-bellied Sapsucker (Sphyrapicus varius), Olive Warbler (Peucedramus taeniatus), and Great Kiskadee (Pitangus sulphuratus) were associated with sites of larger area and lower mean noise level dB(A). Species such as Tropical Kingbird (Tyrannus melancholicus) and Orchard Oriole (Icterus spurius) were primarily influenced by NDVI values (Figure 3).

3.6. Multivariate Analysis and Environmental Relationships per Guilds

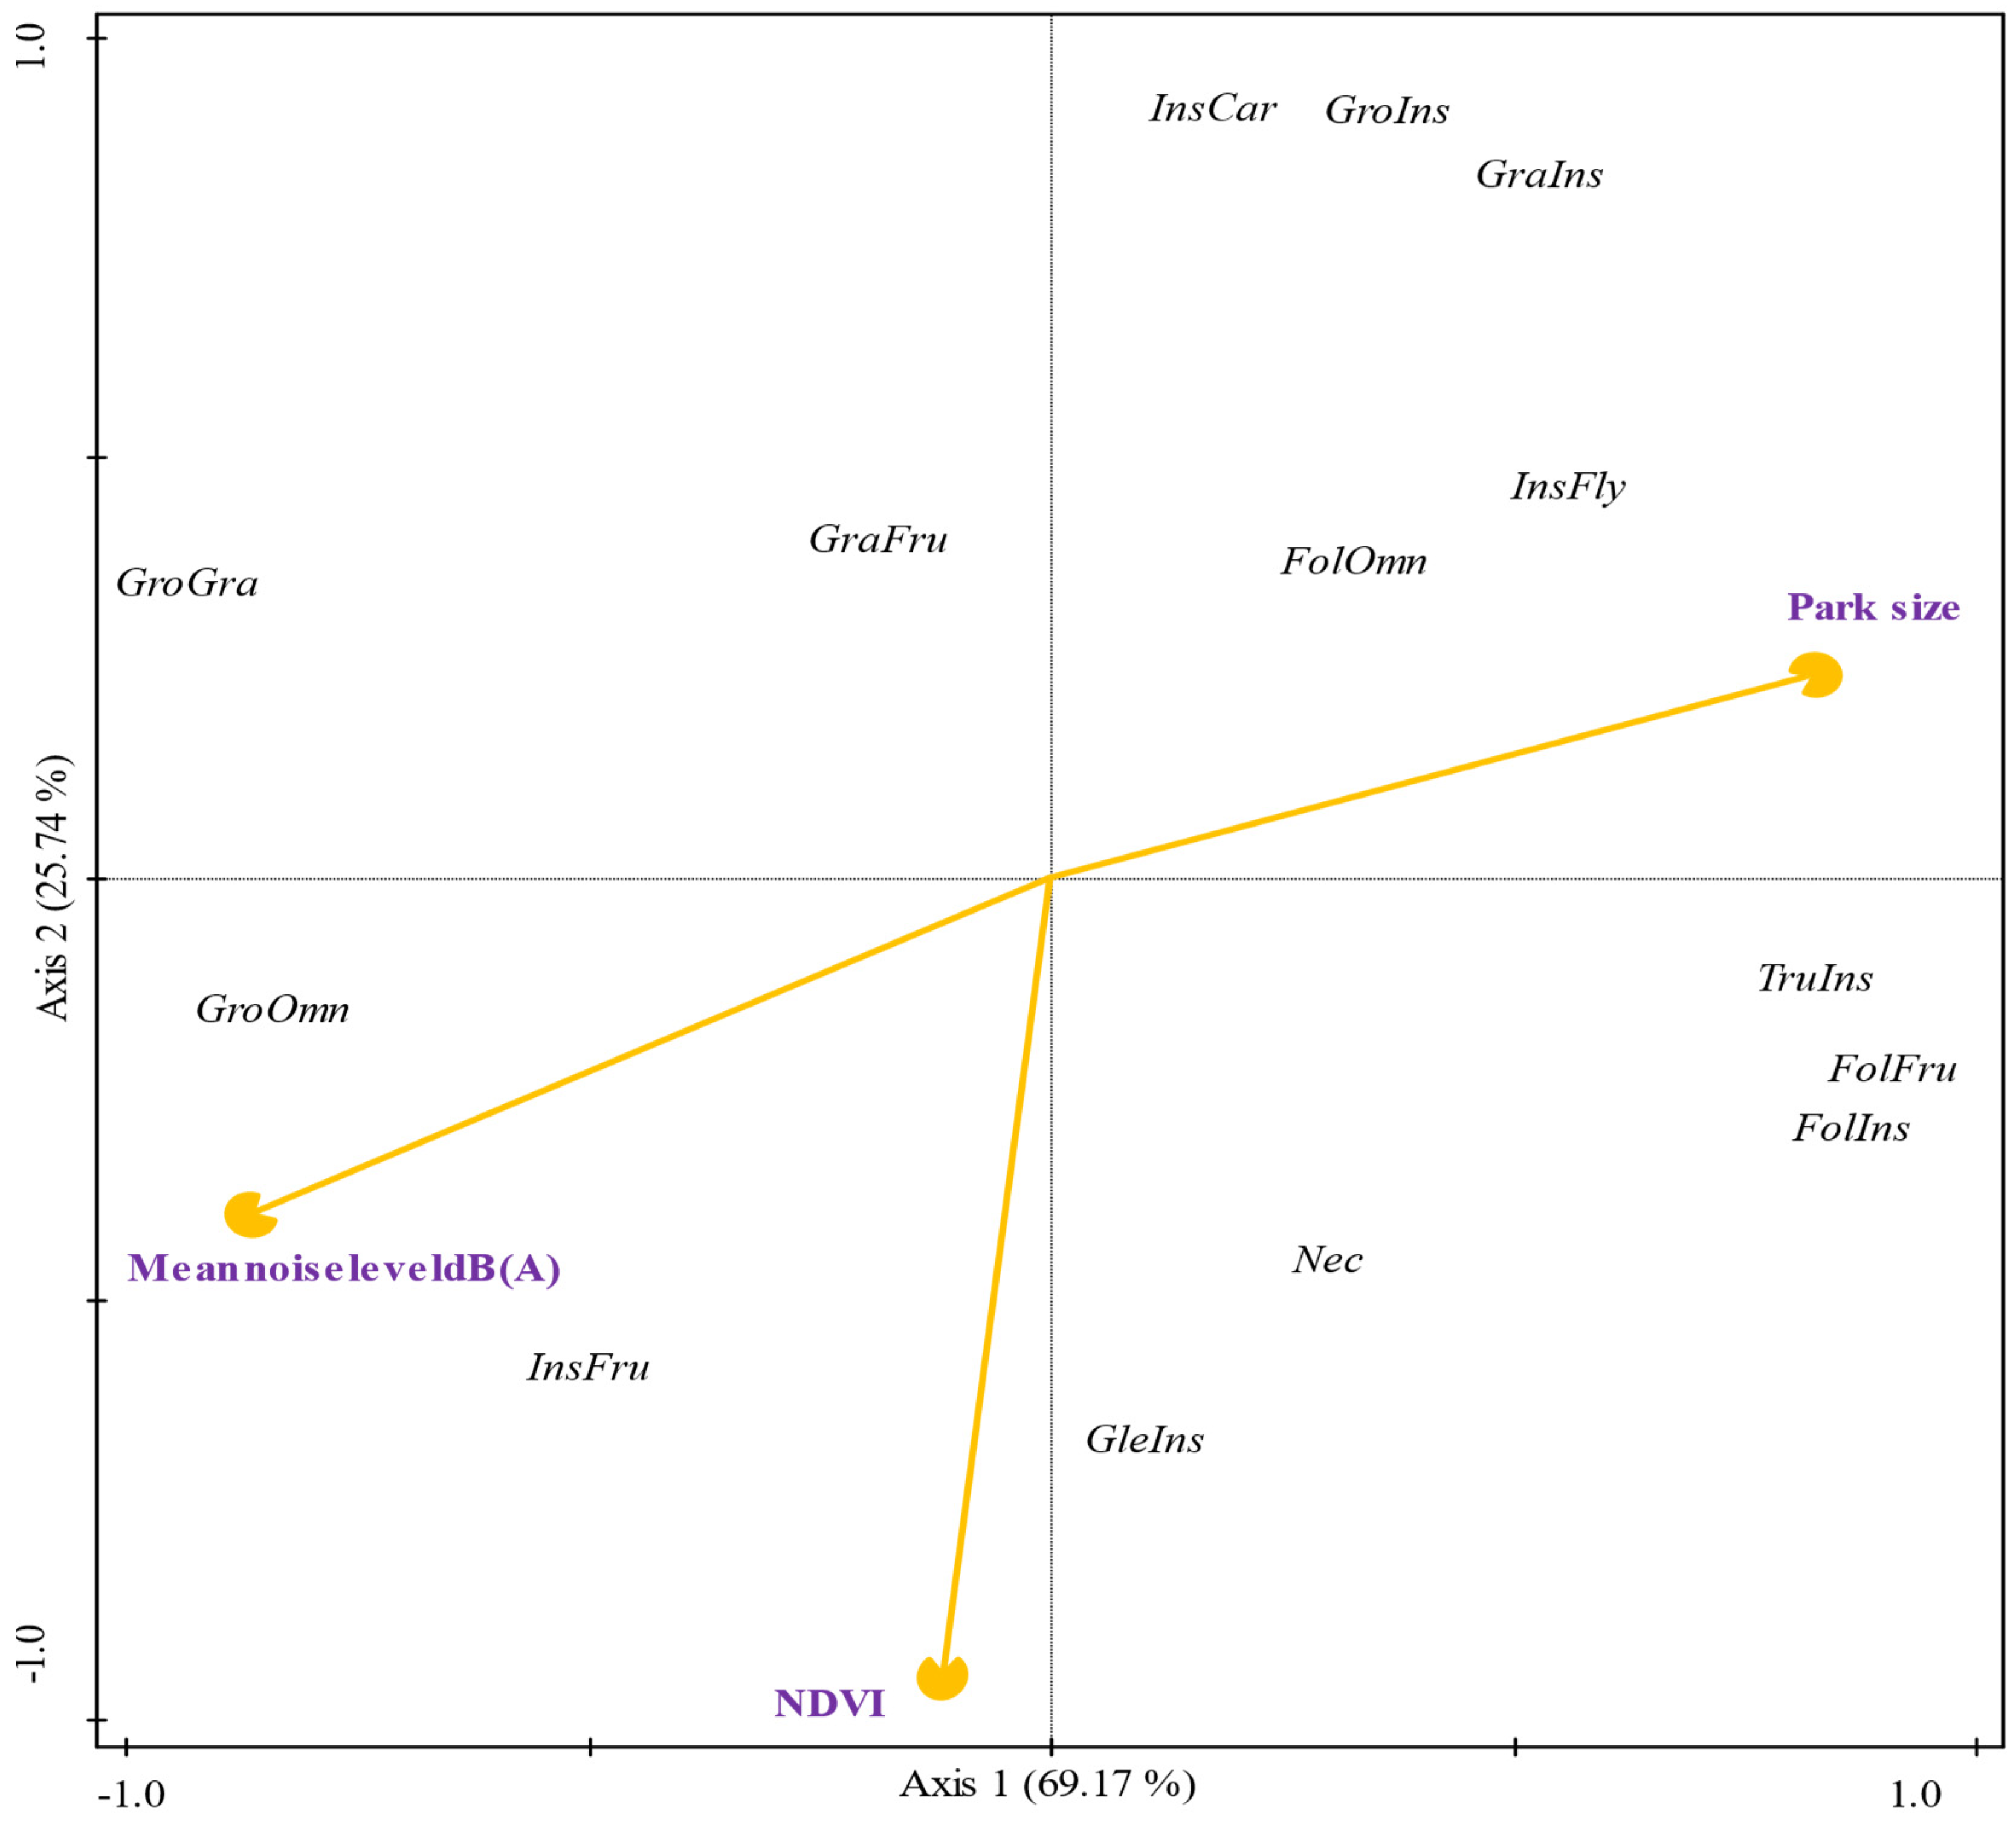
Redundancy analysis (RDA) showed notable differentiation in trophic guild distribution based on the selected environmental variables. The first two axes explained 94.91% of the variation (axis 1 = 69.17%, axis 2 = 25.74%) (Table S5). The biplot showed that ground granivore and ground omnivore guilds were related to high mean noise level dB(A) small areas. In contrast, guilds such as foliage insectivores, frugivores, and omnivores, as well as flycatcher insectivores and trunk insectivores, were associated with the axis of large areas and lower mean noise level dB(A). Ground insectivores, carnivore–insectivores, and granivore–insectivores are mostly influenced by area and negatively by NDVI. Finally, glean insectivore and nectarivore guilds were negatively associated with noise and positively with NDVI values (Figure 4).

3.7. Variation Partitioning Analysis

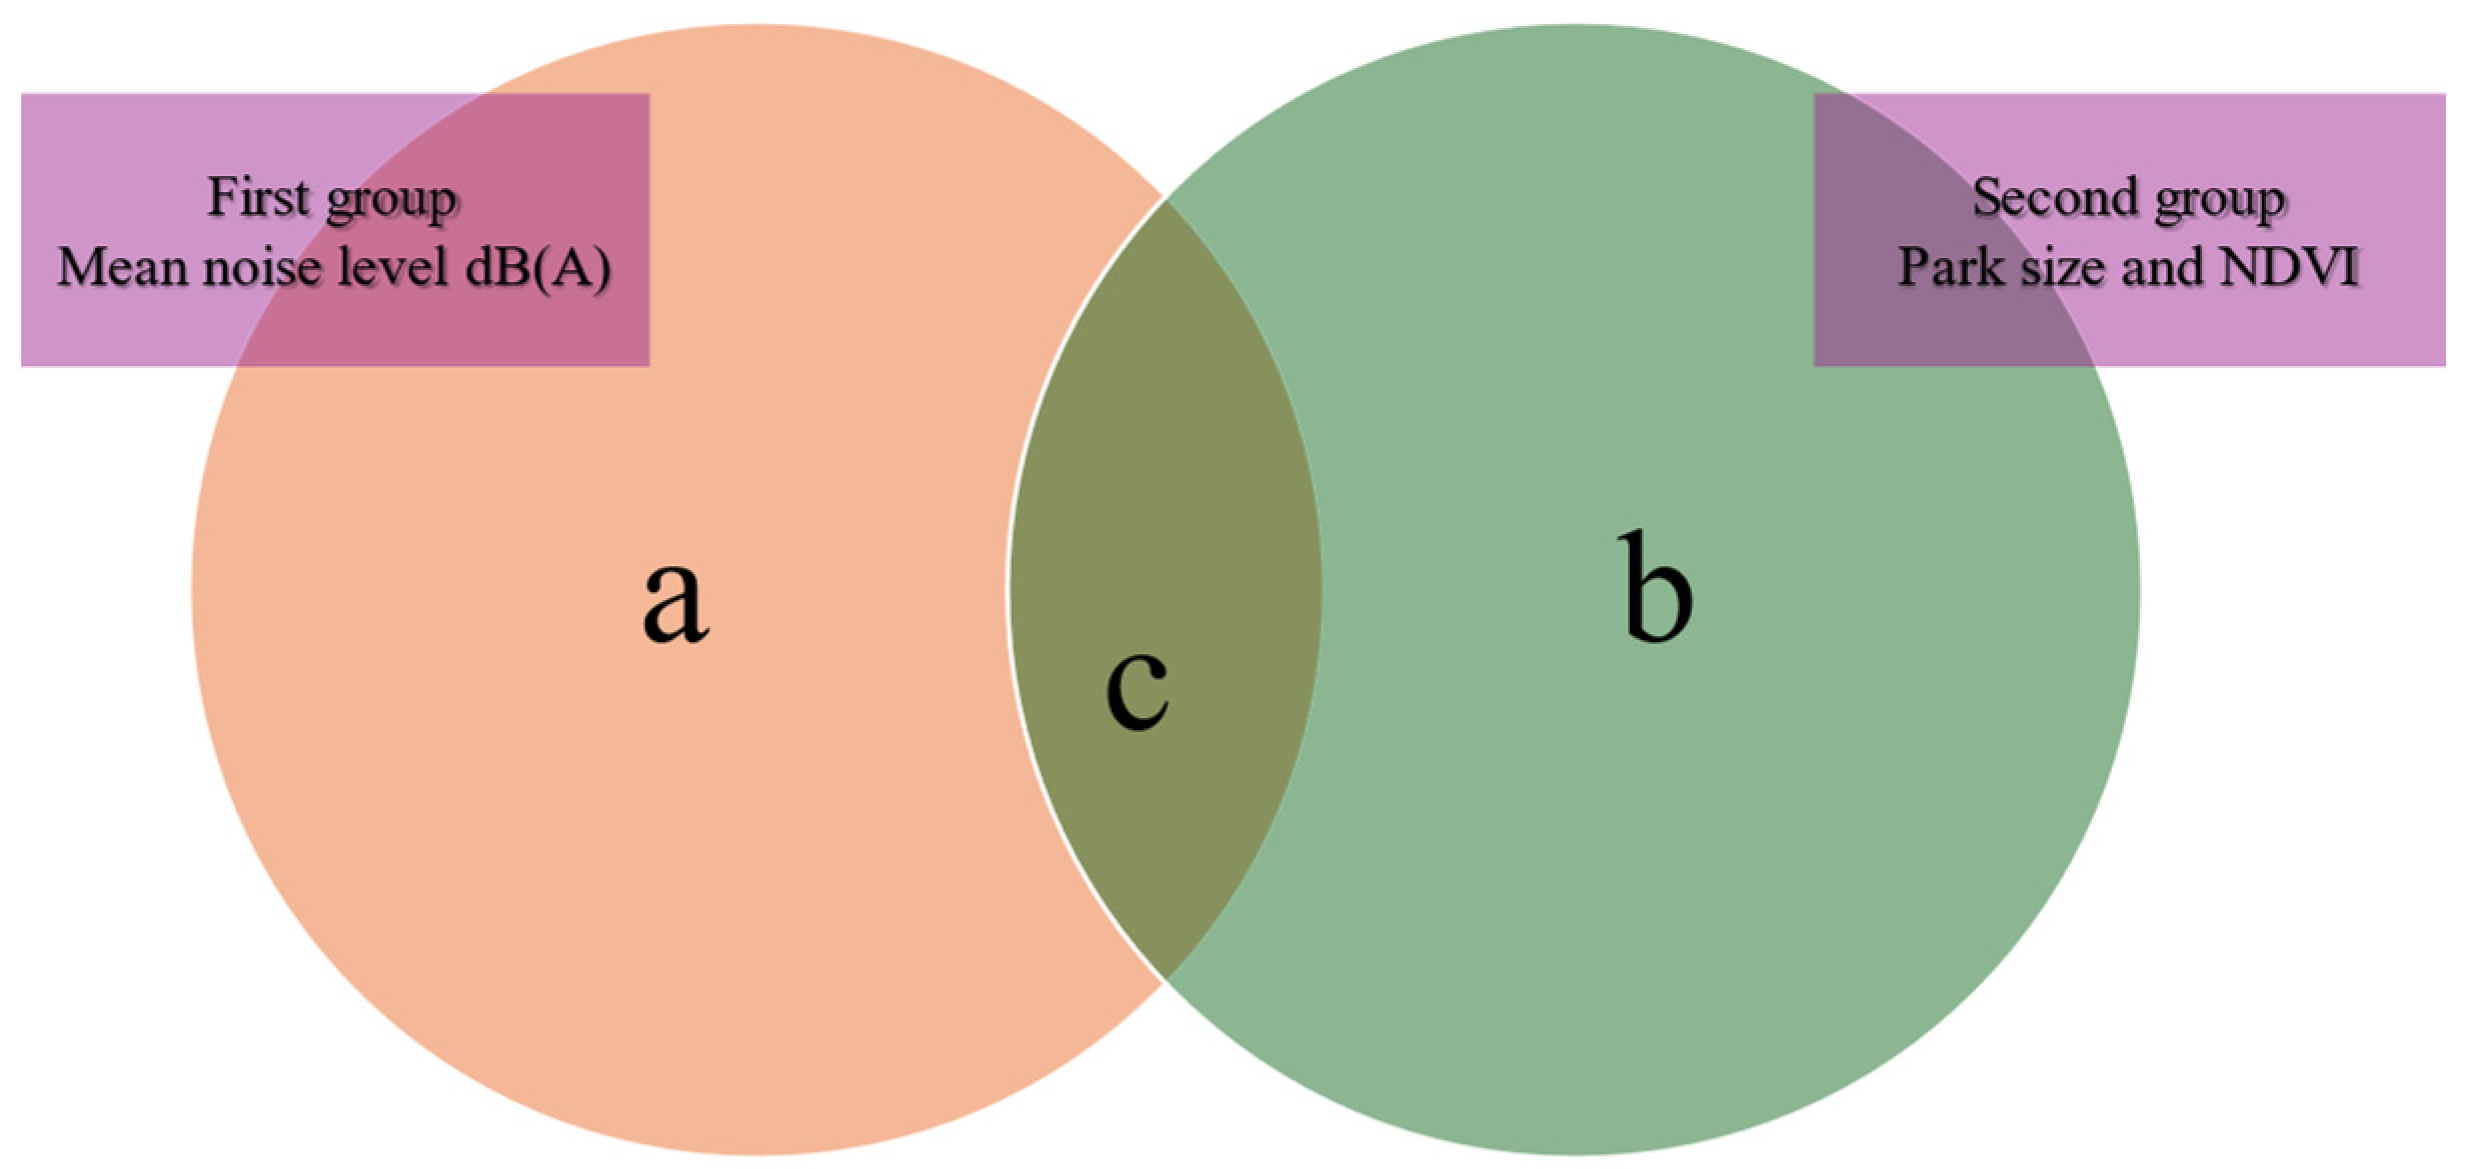
Variation partitioning analysis indicated that the mean noise level dB(A) (fraction a) included 30.8% of the total explained variation. The unique fraction of park size and NDVI (fraction b) contributed 39.9%, while the shared fraction between noise and other variables (fraction c) represented 29.3%. Together, all environmental variables explained 23.3% of the total variation in bird community composition. The combination of these fractions was statistically significant (p < 0.05) (Table 4 and Table 5; Figure 5).

3.8. Correlation and Multivariate Analysis Between Environmental Variables and Residence in the CDMX

We recorded 79 permanent resident species and 24 winter residents during the study period. Significant correlations were observed between environmental variables and species residency status. Mean noise level dB(A) showed a strong negative correlation with permanent resident species (r = −0.951) and winter residents (r = −0.833). In contrast, park size presented a strong positive correlation with both categories (r = 0.924 for permanent, r = 0.825 for winter). The vegetation index (NDVI) showed a moderate negative correlation with the two categories. In addition, a positive correlation was observed between permanent and winter resident species. Finally, mean noise level dB(A) was negatively correlated with park size and positively correlated with NDVI.
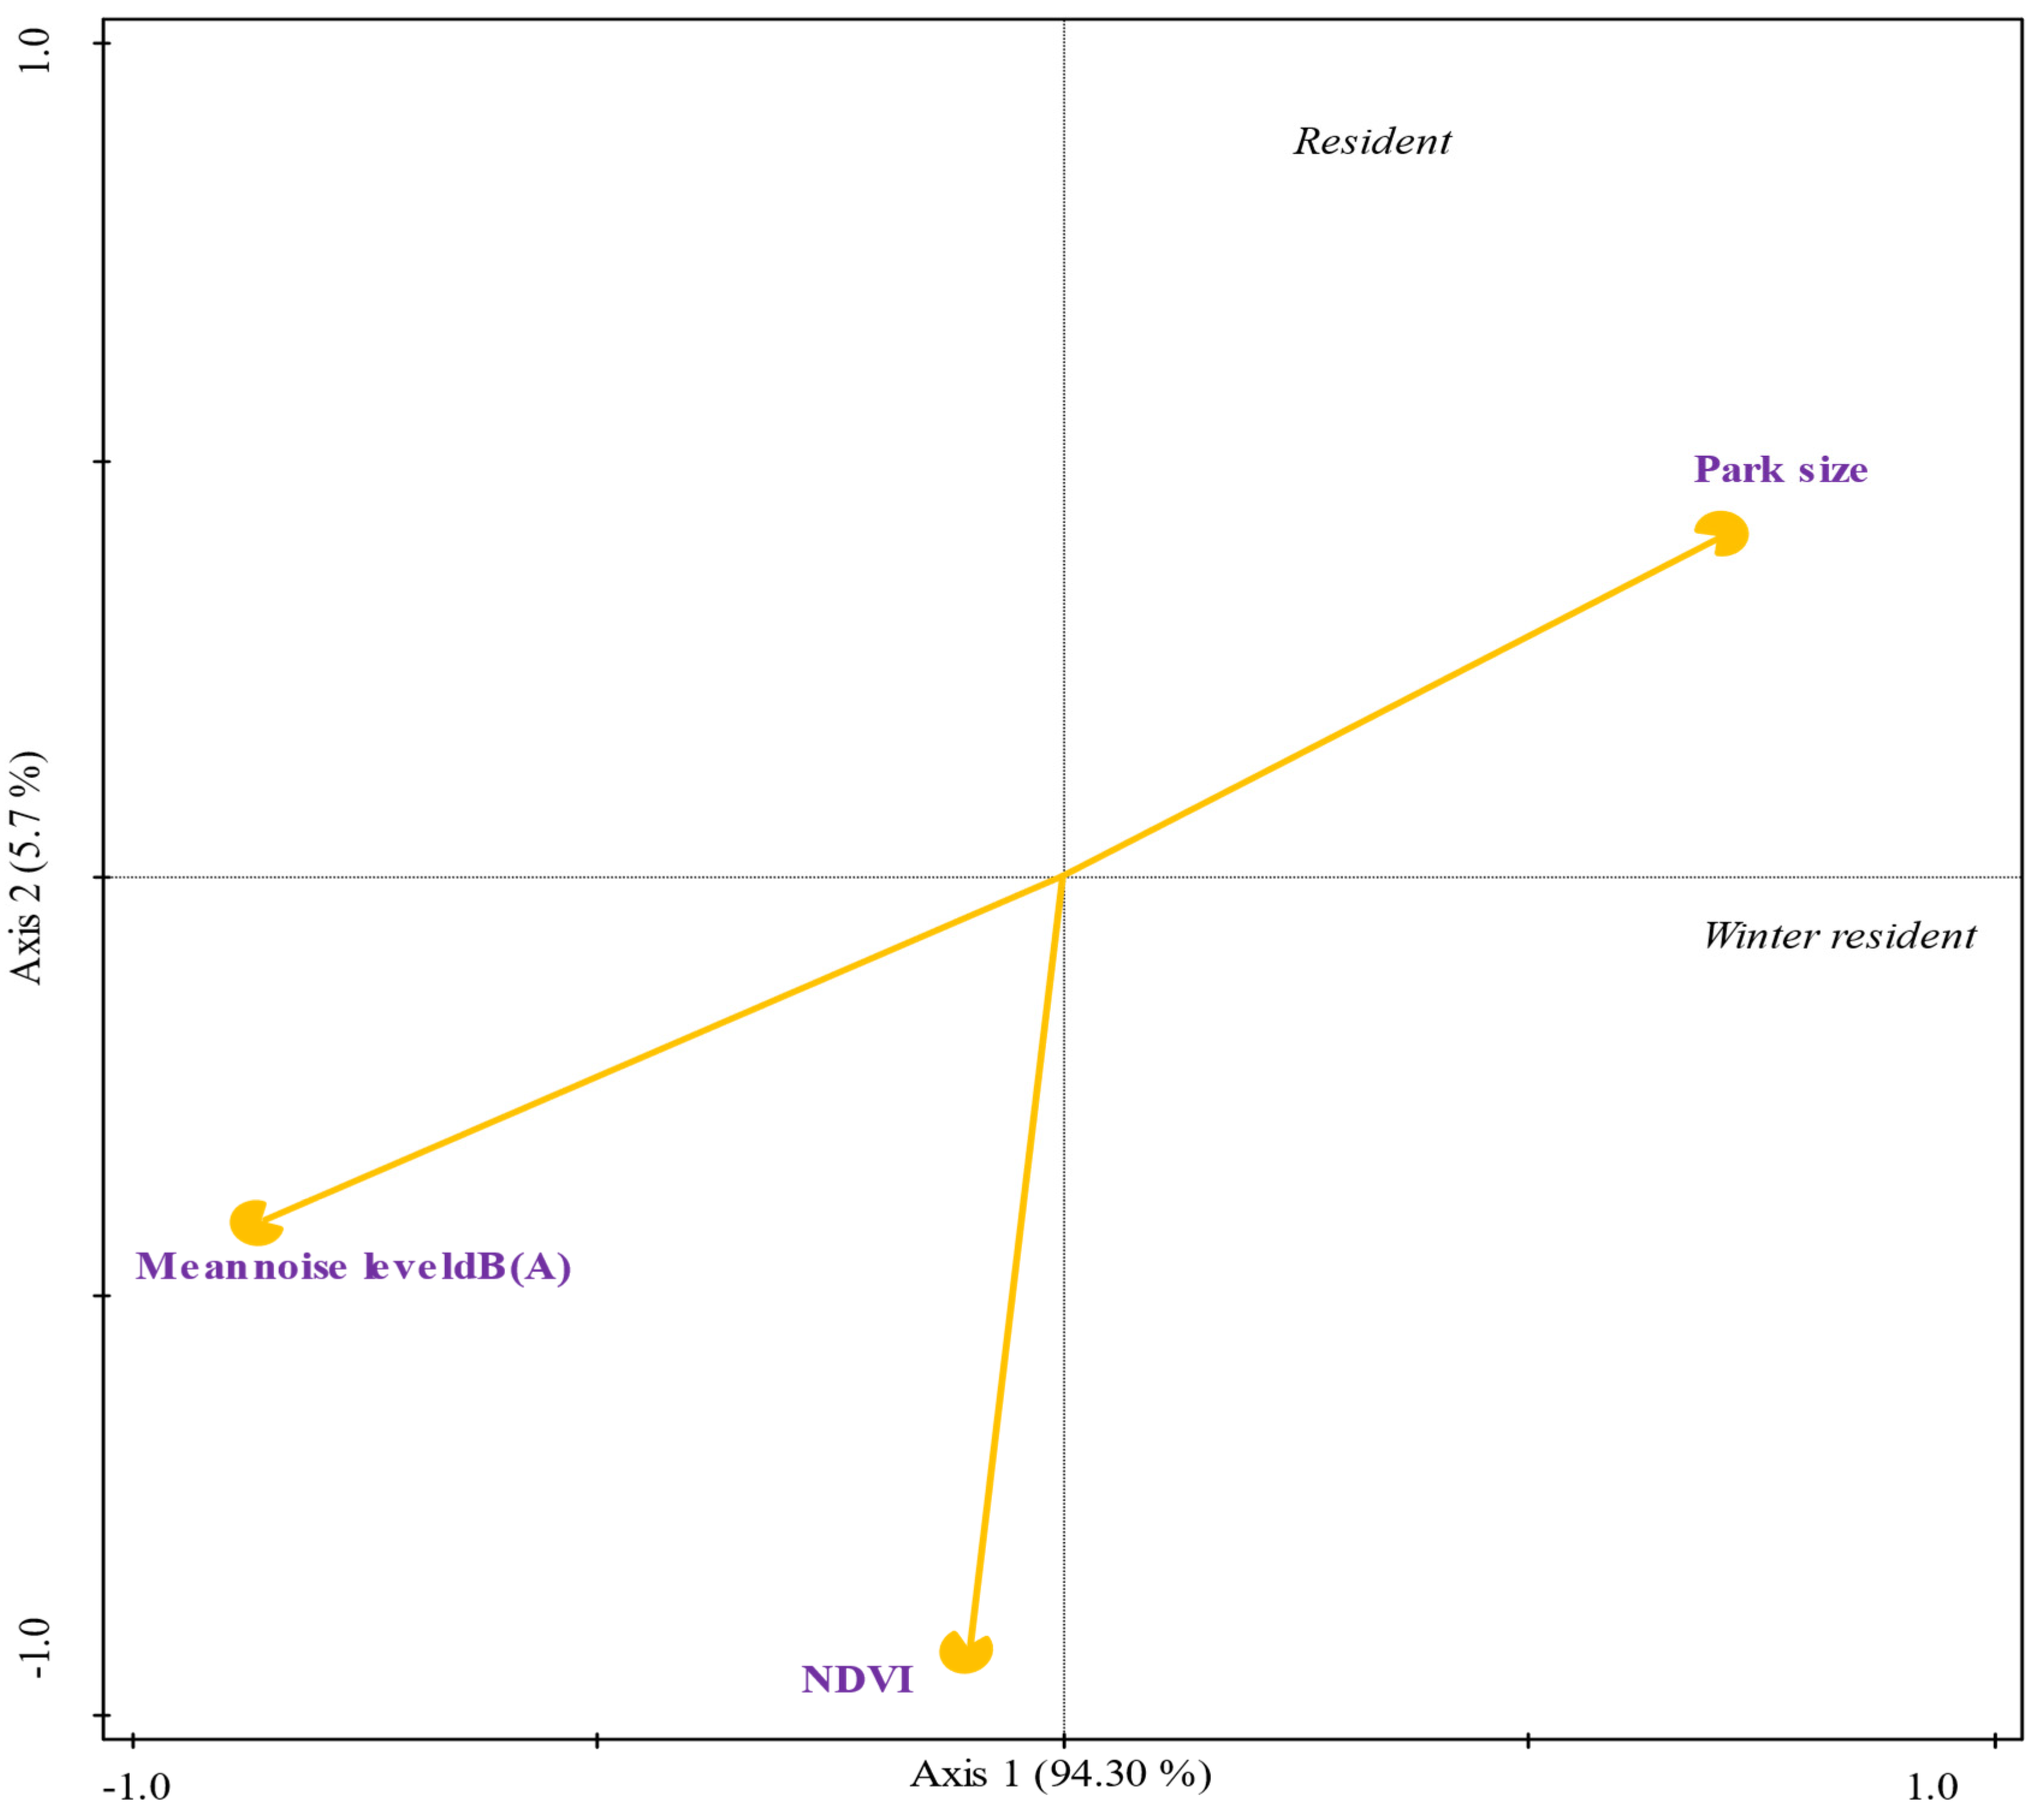
Redundancy analysis (RDA) showed that the selected environmental variables explained 100% of the variance in species composition on the first two axes. The first axis accounted for the largest proportion of the variance (94.3%), while the second axis explained 5.7%. Winter resident species were positively associated with park size. Mean noise level dB(A) showed a negative relationship with both species categories, especially with permanent residents. On the other hand, the vegetation index (NDVI) made a moderate contribution within the biplot, with less explanatory weight compared to the other variables. Larger parks and lower mean noise level dB(A) favor the presence of permanent and winter resident birds (Tables S6 and S7, Figure 6).

3.9. Correlation Between Environmental Variables and Conservation Status

The five species under special protection were recorded mainly in the larger parks, BT (239.49 ha), CE (145.15 ha), and CH1 (116.47 ha), with absence in small parks such as PM (6.83 ha) and PL (6.15 ha). Parks with a higher number of protected species had significantly lower mean noise levels dB(A) (53.447 ± 0.8977 dB(A) vs. 45.737 ± 1.2483 dB(A); t obs = 4.892, p = 0.002) compared to parks with fewer species under protection. Species with some degree of protection and those without conservation status presented a strong negative correlation with mean noise levels dB(A) (r = −0.946 and r = −0.938, respectively; n = 9, p < 0.001). In contrast, both showed a positive correlation with park size (r = 0.831 and r = 0.887, respectively; n = 9, p ≤ 0.005). The vegetation index (NDVI) showed moderate negative correlations with both groups. Finally, a very high correlation was observed between species with and without protection.

4. Discussion

The nine urban parks studied in Mexico City maintain a notable avifauna richness (108 species), representing approximately 21% of birds reported for the Mexico Basin [60]. This proportion is relevant considering that urban green spaces typically harbor between 20–30% of regional avifauna in Latin American cities [61,62], a pattern documented from Mexico to Argentina that highlights the role of these spaces as biodiversity reservoirs across the region [40]. The predominance of permanent resident species (73%) suggests that these spaces provide sufficient resources throughout the year, a pattern consistent with other urban areas in Mexico [39,63] and Latin America [8]. The marked relationship between park size and species richness supports habitat island theory in urban ecosystems [10]. Larger sites (BT: 239.49 ha, CE: 145.15 ha) consistently maintained higher species richness (53–80 species), while small parks (PM: 6.83 ha, PL: 6.15 ha) showed lower species richness (28–38 species). This area–species pattern coincides with previous studies in Mexican urban parks [64,65] and global meta-analyses on urban biodiversity [6,15].
Species composition responded to defined environmental gradients determined by noise, NDVI, and habitat area. Greater vegetation cover relates to higher richness or presence of species dependent on conserved habitats, such as Tropical Kingbird (Tyrannus melancholicus) and Orchard Oriole (Icterus spurius). This finding agrees with previous studies highlighting the role of vegetation structural complexity as a key determinant in richness and composition of faunal communities [66,67].
On the other hand, mean noise level dB(A) showed a strong negative correlation, suggesting a filter effect of acoustic disturbance on species such as Rivoli’s Hummingbird (Eugenes fulgens), Yellow-bellied Sapsucker (Sphyrapicus varius), and Mexican Chickadee (Poecile sclateri) consistent with studies documenting negative effects of urban noise on bird diversity, which can interfere with communication, reproductive behavior, and habitat use [20,23,68].
However, generalist species were associated with highly disturbed environments characterized by greater noise and less green cover. These species are typically more abundant and tend to dominate urban environments by exploiting anthropogenic food resources and utilizing buildings as nesting sites [69]. These same generalist species were identified by Ramírez-Albores et al. (2024) [70] as highly common across Mexico City greenspaces, confirming their role as urban exploiters in this metropolitan area. Recent research has documented that these species have modified their feeding strategies in urban environments and seek alternative food sources, for example, insects on the front parts of cars, such as license plates or radiators, suggesting greater adaptation to urban environments and successful use of the resources that cities provide them [71]. The differential noise tolerance observed between generalist and specialist species reflects different urban environment adaptation strategies, a phenomenon widely documented in the literature [23,34].
Species such as White-eared Hummingbird (Basilinna leucotis), Papamoscas Llanero (Sayornis saya), Acorn Woodpecker (Melanerpes formicivorus), and Orange-billed NightingaleThrush (Catharus aurantiirostris) were associated with sites of larger area and less acoustic disturbance, reflecting their affinity for more conserved conditions and highlighting the importance of green area extension and connectivity to ensure greater resource availability [72,73,74].
Species grouping into guilds showed redundancy and functional differentiation patterns key to ecological diversity conservation [75,76]. Guilds such as foliage insectivores, glean insectivores, and flycatcher insectivores showed strong association, suggesting functional convergence based on specialization in arthropod consumption and arboreal stratum use for foraging [77,78]. On the other hand, guilds with mixed diets such as frugivore–insectivores and granivore–frugivores presented intermediate similarity levels, reflecting greater trophic flexibility and possibly seasonal response to resource availability [79,80]. Finally, the nectarivore guild appeared most dissimilar from others, which is congruent with their high dietary and morphological specialization, as well as low functional redundancy in the analyzed system [81,82]. This functional separation may imply greater ecological vulnerability to changes in flower or pollinator availability.
Mean noise level dB(A), as an indicator of anthropogenic disturbance, presented negative and statistically significant correlations with several specialized guilds, including foliage insectivores, flycatcher insectivores, and foliage frugivores. In contrast, guilds such as ground granivores and ground omnivores were associated with sites characterized by high mean noise level dB(A) and small areas, suggesting that these groups are functionally tolerant to intensely disturbed urban conditions, probably due to their generalist diet and ecological flexibility. A greater abundance of species belonging to these trophic guilds is associated with species lacking trees and with more impervious surfaces [83,84,85,86]. In contrast, guilds such as foliage insectivores, frugivores, as well as flycatcher insectivores and trunk insectivores, were associated with more conserved environments, that is, with greater green area surface, more grass coverage, less cement cover, and lower noise levels, reflecting greater sensitivity to fragmentation and acoustic disturbance [20,23,87].
Park size showed positive correlations with guilds such as foliage insectivores, foliage frugivores, glean insectivores, and flycatchers, suggesting that these groups tend to concentrate in broader habitats, probably due to greater resource availability and less fragmentation. This pattern is consistent with the idea that species specialized in the canopy or displaying complex foraging techniques require greater spatial habitat integrity, providing them with greater resource availability, connectivity, and structural diversity [67,88].
NDVI, as an indicator of vegetation cover, showed predominantly negative correlations, especially with guilds such as ground granivores, carnivore–insectivores, and frugivore–insectivores. These results could reflect that such guilds are associated with areas with less dense vegetation, or that they present greater tolerance to environments with reduced vegetation cover. However, some guilds such as nectarivores and trunk insectivores showed weak positive correlations, which could indicate selectivity for specific vegetative patches or a more complex response to habitat structure [89,90]. Some authors suggest that urban areas with high average NDVI values have high bird richness, a greater number of specialist species, and lower community homogenization [91]. Overall, the functional structure of the bird community appears to be mediated by a combination of environmental filters: mean noise level dB(A) acts as an exclusionary filter, while vegetation cover and habitat area favor the presence of functionally diverse and specialized guilds. This pattern reaffirms the importance of considering multiple abiotic variables when evaluating the functional response of communities.
Our GLM results support the multivariate community patterns identified through RDA and variance partitioning. The dominance of park size as a predictor confirms that area effects, whether direct (habitat availability) or indirect (correlated with reduced noise pollution), represent the primary environmental filter structuring urban bird communities [8,9,10]. The contrasting responses of foliage insectivores and ground granivores validate our functional guild classification and support the urban tolerance gradient observed in our community ordination [23,24,25]. Notably, the negative NDVI coefficients suggest that vegetation density alone does not guarantee habitat quality, consistent with previous findings that structural complexity and native plant composition may be more important than simple vegetation cover for urban bird diversity [6,17,54,81,82]. This finding has important implications for urban green space management, suggesting that diverse, heterogeneous vegetation may be more valuable than dense, homogeneous plantings [4,25,31,84]. Urban green spaces with varied vegetation structure and native species composition consistently support more diverse bird communities regardless of overall vegetation density [4,6].
Mean noise level dB(A) has a considerable negative impact on the richness of resident and winter resident species, as well as on those with and without protected status. This result is consistent with previous studies evidencing that anthropogenic noise interferes with key processes such as vocal communication, reproductive behavior, and predation risk perception in birds [23,26,92,93]. It has been documented that the most vulnerable species present a lower tolerance to acoustic disturbance, which may accentuate their exclusion from noisy urban habitats. These disturbances act as ecological barriers, limiting the colonization of specialist species or those with more stringent requirements [23]. The effect of noise is particularly critical in environments where space is limited, such as in smaller urban parks [20]. In smaller urban parks, as noise increases, the number of different bird species, the uniformity in the abundance of those species, and the overall diversity of the community tend to decrease [26].
Our results show that the five species under special protection were mainly distributed in parks with lower mean noise level dB(A) (45.737 ± 1.2483 dB(A)). This suggests that protected species are particularly vulnerable to environmental disturbances, such as habitat fragmentation and urban noise pollution, and therefore require more conserved environmental conditions. Larger parks tend to have greater structural complexity, availability of microhabitats and less exposure to human disturbance, conditions that favor the coexistence of species with different degrees of ecological sensitivity, such a raptors. Contrary to what was reported by Leveau, 2024 [94], the urban parks in our study show a greater richness of specialized raptor species that are larger in size and belong to the Accipitridae family, reinforcing the fact that the parks included have a heterogeneous composition and greater structural complexity [84,95,96].
On the other hand, the vegetation index (NDVI) showed moderate negative correlations with the four species categories analyzed. This tendency could be attributed to the fact that the NDVI measures exclusively the density or greenness of the vegetation, without considering floristic diversity, vertical stratification, or functional value as habitat. High vegetation density does not necessarily imply higher habitat quality, nor does it guarantee the presence of key resources such as food or nesting sites [97]. It is possible that areas with high NDVI values are dominated by exotic, homogeneous, or poorly structured vegetation, unfavorable conditions for species with specialized requirements, including many species of conservation concern [98]. In this sense, a greater vegetation cover is not a reflection of greater bird richness, which highlights the need to consider the ecological quality of the habitat beyond cover metrics.
Mean noise level dB(A), park size, and NDVI showed significant effects on the bird community under study when using GLMs and RDA. It is difficult to tease out the importance of two inter-correlated variables, but in the GLM models, park size was the best explanator. On the other hand, a VIF analysis indicated that both park size and mean noise level dB(A), together with NDVI, can be used in an RDA analysis. In this case, mean noise level dB(A) was a significant predictor of bird distribution.
The results of this study have direct implications for the management and conservation of the urban avifauna in Mexico City. First, the positive relationship between park size and species richness reinforces the critical need to preserve larger urban parks (>100 ha) such as the Bosque de Tlalpan, Cerro de la Estrella, and the Chapultepec Forest sections. These spaces not only harbor greater diversity, but also function as refuges for sensitive species and those under special protection [34].
The conservation of protected species in urban environments requires the design and implementation of specific actions focused on reducing noise levels, increasing the effective size of the habitat, and improving the structure and composition of urban vegetation, integrating ecological criteria in the design and management of green spaces. It has been reported that the connectivity of green areas and their isolation from surrounding buildings favor the richness and diversity of birds [99]. This recommendation is particularly relevant considering that loss and fragmentation of urban green areas is a growing threat to biodiversity in megapolises [3,10].
Together, these results emphasize the relevance of considering multiple abiotic variables in evaluating community structure, since factors such as vegetation and mean noise level dB(A) can act synergistically or antagonistically on biological assemblages. It is also important that these variables be monitored continuously or over an extended period (years) to more clearly observe their effect on bird composition and abundance, as well as on community dynamics [100,101]. From a conservation perspective, the analysis evidences the need to preserve habitats with high vegetation cover and low acoustic impact to maintain ecological and functional integrity of the studied communities. These results reinforce the need to consider functional attributes in conservation strategy design, since landscape change impacts not only taxonomic richness but also the ecological integrity of the system.
The significant influence of mean noise level dB(A) on species composition suggests the need to implement acoustic mitigation strategies, particularly in small parks such as Parque México, Parque Lira, and Parque Venados. Measures such as establishing vegetation barriers, regulating traffic in adjacent areas, and creating buffer zones could reduce noise impact on bird communities [68]. These efforts are especially relevant considering that recorded mean noise levels dB(A) (>53 dB(A)) exceed the recommended thresholds for urban avifauna conservation [20].

5. Study Limitations

This study presents some limitations that should be acknowledged. First, the sample size of nine parks is relatively small, which may limit the generalizability of our findings to other urban contexts. Second, many other potentially important factors were not considered in our analysis, including the following: (1) the characteristics of areas surrounding the parks, (2) presence and abundance of predators, (3) intensity of recreational use by humans, (4) artificial light pollution levels, (5) availability of anthropogenic food resources, and (6) seasonal variations in resource availability. Third, our study covers only one annual cycle, which may not capture longer-term population trends or the effects of inter-annual variation in environmental conditions. Fourth, our noise measurements were limited to recording minimum and maximum dB(A) values during field sampling periods, rather than continuous mean noise levels. Therefore, our reported mean noise level dB(A) calculated based on MIN and MAX dB(A) values are probably not comparable to studies that have measured time-weighted average noise levels in the field. Despite this methodological difference, the mean noise level dB(A) gradients across parks remain valid for analyzing their effects on bird communities, as MIN and MAX values were strongly correlated. Finally, we did not apply multiple testing corrections to our correlation analyses, which could lead to increased Type I error rates. Future research should address these limitations through longer-term monitoring programs, inclusion of additional environmental and social variables, and implementation of more sophisticated statistical modeling approaches.

6. Conclusions

According to our findings, mean noise level dB(A) and park size influenced bird diversity. Most species had a preference, presence, and abundance in larger, low-noise sites. These observations could reflect the sensitivity of birds to these types of environmental factors, which have very varied patterns in urban areas. This study contributes evidence on the importance of urban parks for biodiversity conservation in megacities, in the context of Mexico City’s rapid urban growth. Finally, we suggest implementing a long-term monitoring program to assess population trends and the effectiveness of management measures. This program should include monitoring not only species richness and abundance, but also key environmental variables such as noise levels, vegetation cover, and resource availability. Implementing these recommendations could help maintain and potentially increase bird diversity in these valuable green spaces.

Supplementary Materials

The following supporting information can be downloaded at https://www.mdpi.com/article/10.3390/birds6030046/s1: Table S1. Characteristics of urban parks selected for avian diversity study in Mexico City, including location, area, and dominant vegetation species; Table S2. Bird species recorded during the annual cycle in the nine urban parks of Mexico City, with their ecological status and conservation categories. Abbreviations: R, Resident; WR, Winter Resident; SR, Summer Resident; SP, Subject to Special Protection; NC, No Conservation Category; LC, Least Concern; NT, Near Threatened; NE, Non-endemic; SE, Semi-endemic; EX, Exotic; QE, Quasi-endemic; Table S3. Eigenvalues and variance explained by RDA axes for Multivariate analysis and environmental relationships per species; Table S4. Correlation coefficients between environmental variables and RDA axes for Multivariate analysis and environmental relationships per species; Table S5. Eigenvalues and variance explained by RDA axes for Multivariate analysis and environmental relationships per guilds; Table S6. Eigenvalues and variance explained by RDA axes for Multivariate analysis and environmental relationships for residence in the CDMX; Table S7. Correlation coefficients between environmental variables and RDA axes for Multivariate analysis and environmental relationships for residence in the CDMX.

Author Contributions

Conceptualization: C.Y.S.-R., L.A.S.-G., P.C. and C.L.; methodology and data collection: C.Y.S.-R., P.C. and C.L.; formal analysis and investigation: C.Y.S.-R., P.C. and C.L.; writing—original draft preparation: C.Y.S.-R., P.C. and C.L.; writing—review and editing: C.Y.S.-R., L.A.S.-G., P.C. and C.L.; funding acquisition: P.C.; resources: P.C.; supervision: P.C. and C.L. All authors have read and agreed to the published version of the manuscript.

Funding

This research received no external funding.

Institutional Review Board Statement

Additional ethical review and approval were waived for this study because the study did not involve the capturing or manipulation of birds, only their observation.

Data Availability Statement

The data presented in this study are available on request from the corresponding author due to the data are part of an ongoing study.

Acknowledgments

The first author is a student of the Ph.D. Program Doctorado en Ciencias Biológicas y de la Salud—Universidad Autónoma Metropolitana Iztapalapa (UAM-I), and the paper is part of her dissertation in partial fulfillment of the requirements for the graduate program.

Conflicts of Interest

The authors declare no conflicts of interest.

References

  1. McKinney, M.L. Urbanization, biodiversity, and conservation: The impacts of urbanization on native species are poorly studied, but educating a highly urbanized human population about these impacts can greatly improve species conservation in all ecosystems. BioScience 2002, 52, 883–890. [Google Scholar] [CrossRef]
  2. Grimm, N.; Faeth, S.H.; Golubiewski, N.E.; Redman, C.L.; Wu, J.; Bai, X.; Briggs, J.M. Global Change and the Ecology of Cities. Science 2008, 319, 756–760. [Google Scholar] [CrossRef]
  3. Aronson, M.F.; La Sorte, F.A.; Nilon, C.H.; Katti, M.; Goddard, M.A.; Lepczyk, C.A.; Warren, P.S.; Williams, N.S.G.; Cilliers, S.; Clarkson, B.; et al. A Global Analysis of the Impacts of Urbanization on Bird and Plant Diversity Reveals Key Anthropogenic Drivers. Proc. Biol. Sci. 2014, 281, 20133330. [Google Scholar] [CrossRef]
  4. Lepczyk, C.A.; Aronson, M.F.J.; Evans, K.L.; Goddard, M.A.; Lerman, S.B.; MacIvor, J.S. Biodiversity in the City: Fundamental Questions for Understanding the Ecology of Urban Green Spaces for Biodiversity Conservation. BioScience 2017, 67, 799–807. [Google Scholar] [CrossRef]
  5. Jokimäki, J.; Kaisanlahti-Jokimäki, M.L.; Carbó-Ramírez, P. The importance of wooded urban green areas for breeding birds: A case study from Northern Finland. In Avian Urban Ecology: Behavioural and Physical Adaptations; Gil, D., Brumm, H., Eds.; Oxford University Press: Oxford, UK, 2014; pp. 201–213. [Google Scholar] [CrossRef]
  6. Beninde, J.; Veith, M.; Hochkirch, A. Biodiversity in Cities Needs Space: A Meta-Analysis of Factors Determining Intra-Urban Biodiversity Variation. Ecol. Lett. 2015, 18, 581–592. [Google Scholar] [CrossRef] [PubMed]
  7. Ikin, K.; Knight, E.; Lindenmayer, D.B.; Fischer, J.; Fischer, J.; Manning, A.D. The Influence of Native versus Exotic Streetscape Vegetation on the Spatial Distribution of Birds in Suburbs and Reserves. Divers. Distrib. 2013, 19, 294–306. [Google Scholar] [CrossRef]
  8. Marzluff, J.M. A Decadal Review of Urban Ornithology and a Prospectus for the Future. Ibis 2017, 159, 1–13. [Google Scholar] [CrossRef]
  9. Hengeveld, R.; MacArthur, R.H.; Wilson, E.O.; MacArthur, R.H.; Wilson, E.O. The Theory of Island Biogeography. Acta Biotheor. 2002, 50, 133–136. [Google Scholar] [CrossRef]
  10. Fernández-Juricic, E.; Jokimäki, J. A habitat island approach to conserving birds in urban landscapes: Case studies from southern and northern Europe. Biodivers. Conserv. 2001, 10, 2023–2043. [Google Scholar] [CrossRef]
  11. Garaffa, P.I.; Filloy, J.; Bellocq, M.I. Bird community responses along urban–rural gradients: Does the size of the urbanized area matter? Landsc. Urban Plan. 2009, 90, 33–41. [Google Scholar] [CrossRef]
  12. Charre, G.M.; Hurtado, J.A.Z.; Néve, G.; Ponce-Mendoza, A.; Corcuera, P. Relationship between habitat traits and bird diversity and composition in selected urban green areas of Mexico City. Ornitol. Neotrop. 2013, 24, 279–297. [Google Scholar]
  13. Jokimäki, J. Occurrence of breeding bird species in urban parks: Effects of park structure and broad-scale variables. Urban Ecosyst. 1999, 3, 21–34. [Google Scholar] [CrossRef]
  14. Laurance, W.F. Theory meets reality: How habitat fragmentation research has transcended island biogeographic theory. Biol. Conserv. 2008, 141, 1731–1744. [Google Scholar] [CrossRef]
  15. Nielsen, A.B.; van den Bosch, M.; Maruthaveeran, S.; van den Bosch, C.K. Species richness in urban parks and its drivers: A review of empirical evidence. Urban Ecosyst. 2013, 17, 305–327. [Google Scholar] [CrossRef]
  16. Matthies, S.; Rüter, S.; Prasse, R.; Schaarschmidt, F. Factors Driving the Vascular Plant Species Richness in Urban Green Spaces: Using a Multivariable Approach. Landsc. Urban Plan. 2015, 134, 177–187. [Google Scholar] [CrossRef]
  17. Bino, G.; Levin, N.; Darawshi, S.; Hal, N.V.D.; Reich-Solomon, A.; Kark, S. Accurate Prediction of Bird Species Richness Patterns in an Urban Environment Using Landsat-Derived NDVI and Spectral Unmixing. Int. J. Remote Sens. 2008, 29, 3675–3700. [Google Scholar] [CrossRef]
  18. Zambrano, L.; Aronson, M.F.J.; Fernández, T. The consequences of landscape fragmentation on socio-ecological patterns in a rapidly developing urban area: A case study of the National Autonomous University of Mexico. Front. Environ. Sci. 2019, 7, 152. [Google Scholar] [CrossRef]
  19. Evans, K.L.; Newson, S.E.; Gaston, K.J. Habitat influences on urban avian assemblages. Ibis 2009, 151, 19–39. [Google Scholar] [CrossRef]
  20. Slabbekoorn, H.; Ripmeester, E.A.P. Birdsong and anthropogenic noise: Implications and applications for conservation. Mol. Ecol. 2008, 17, 72–83. [Google Scholar] [CrossRef]
  21. Proppe, D.S.; Sturdy, C.B.; St. Clair, C.C. Anthropogenic noise decreases urban songbird diversity and may contribute to homogenization. Glob. Change Biol. 2013, 19, 1075–1084. [Google Scholar] [CrossRef]
  22. Halfwerk, W.; Holleman, L.J.M.; Lessells, C.M.; Slabbekoorn, H. Negative impact of traffic noise on avian reproductive success. J. Appl. Ecol. 2011, 48, 210–219. [Google Scholar] [CrossRef]
  23. Francis, C.D.; Ortega, C.P.; Cruz, A. Noise pollution changes avian communities and species interactions. Curr. Biol. 2009, 19, 1415–1419. [Google Scholar] [CrossRef]
  24. McClure, C.J.; Ware, H.E.; Carlisle, J.; Kaltenecker, G.; Barber, J.R. An experimental investigation into the effects of traffic noise on distributions of birds: Avoiding the phantom road. Proc. R. Soc. B 2013, 280, 20132290. [Google Scholar] [CrossRef]
  25. Warren, P.S.; Katti, M.; Ermann, M.; Brazel, A. Urban bioacoustics: It’s not just noise. Anim. Behav. 2006, 71, 491–502. [Google Scholar] [CrossRef]
  26. Liordos, V.; Jokimäki, J.; Kaisanlahti-Jokimäki, M.L.; Valsamidis, E.; Kontsiotis, V.J. Patch, matrix and disturbance variables negatively influence bird community structure in small-sized managed green spaces located in urban core areas. Sci. Total Environ. 2021, 801, 149617. [Google Scholar] [CrossRef] [PubMed]
  27. Ríos-Chelén, A.A.; Quirós-Guerrero, E.; Gil, D.; Macias Gracía, C. Dealing with urban noise: Vermilion flycatchers sing longer songs in noisier territories. Behav. Ecol. Sociobiol. 2013, 67, 145–152. [Google Scholar] [CrossRef]
  28. Croci, S.; Butet, A.; Clergeau, P. Does urbanization filter birds on the basis of their biological traits? Condor 2008, 110, 223–240. [Google Scholar] [CrossRef]
  29. Kark, S.; Iwaniuk, A.; Schalimtzek, A.; Banker, E. Living in the city: Can anyone become an ‘urban exploiter’? J. Biogeogr. 2007, 34, 638–651. [Google Scholar] [CrossRef]
  30. Fontana, S.; Sattler, T.; Bontadina, F.; Moretti, M. How to manage the urban green to improve bird diversity and community structure. Landsc. Urban Plan. 2011, 101, 278–285. [Google Scholar] [CrossRef]
  31. Luck, G.W.; Smallbone, L.T.; Sheffield, K.J. Environmental and socio-economic factors related to urban bird communities. Austral Ecol. 2013, 38, 111–120. [Google Scholar] [CrossRef]
  32. Sanchez, K.A.; Benedict, L.; Holt, E.A. Landscape Composition Is a Stronger Determinant Than Noise and Light of Avian Community Structure in an Urbanizing County. Front. Ecol. Evol. 2023, 11, 1254280. [Google Scholar] [CrossRef]
  33. Ciach, M.; Fröhlich, A. Habitat Type, Food Resources, Noise and Light Pollution Explain the Species Composition, Abundance and Stability of a Winter Bird Assemblage in an Urban Environment. Urban Ecosyst. 2017, 20, 547–559. [Google Scholar] [CrossRef]
  34. Chace, J.F.; Walsh, J.J. Urban effects on native avifauna: A review. Landsc. Urban Plan. 2006, 74, 46–69. [Google Scholar] [CrossRef]
  35. Marzluff, J.M.; Shulenberger, E.; Endlicher, W.; Alberti, M.; Bradley, G.; Ryan, C.; Simon, U.; ZumBrunnen, C. Urban Ecology: An International Perspective on the Interaction between Humans and Nature; Springer Science & Business Media: Boston, MA, USA, 2008. [Google Scholar] [CrossRef]
  36. United Nations (UN). The 2018 Revision of the World Urbanization Prospects. Available online: https://www.un.org/es/desa/2018-revision-world-urbanization-prospects (accessed on 17 July 2025).
  37. Secretaría de Gobernación (SEGOB). Unidad de Política Migratoria, Registro e Identidad de Personas, Secretaría de Gobernación. Boletín Mensual de Estadísticas Migratorias, 2025. Available online: https://portales.segob.gob.mx/work/models/PoliticaMigratoria/CEM/Estadisticas/Boletines_Estadisticos/2025/Boletin_2025.pdf (accessed on 17 July 2025).
  38. Comisión Nacional para el Conocimiento y Uso de la Biodiversidad (CONABIO). Coordinación de Estrategias de Biodiversidad y Cooperación-CONABIO. In Resumen de La biodiversidad en la Ciudad de México. Estudio de Estado; CONABIO: Mexico City, Mexico, 2021. [Google Scholar]
  39. MacGregor-Fors, I.; Schondube, J.E. Gray vs. green urbanization: Relative importance of urban features for urban bird communities. Basic Appl. Ecol. 2011, 12, 372–381. [Google Scholar] [CrossRef]
  40. Ortega-Álvarez, R.; MacGregor-Fors, I. Dusting-off the file: A review of knowledge on urban ornithology in Latin America. Landsc. Urban Plan. 2011, 101, 1–10. [Google Scholar] [CrossRef]
  41. Norma Oficial Mexicana nom-001-SEDATU-2021, Espacios Públicos en los Asentamientos Humanos. Ciudad de México, México. Available online: https://dof.gob.mx/nota_detalle.php?codigo=5643417&fecha=22/02/2022#gsc.tab=0 (accessed on 19 July 2025).
  42. Instituto Nacional de Estadística y Geografía (INEGI). Superficie Estatal por tipo de Clima. Ciudad de México. Available online: https://www.inegi.org.mx/app/cuadroentidad/CDMX/2019/01/1_6 (accessed on 18 July 2025).
  43. Estrada, F.; Martínez-Arroyo, A.; Fernández-Eguiarte, A.; Luyando, E.; Gay, C. Defining climate zones in México City using multivariate analysis. Atmosfera 2009, 22, 175–193. [Google Scholar]
  44. Comisión Nacional para el Conocimiento y Uso de la Biodiversidad (CONABIO). Coordination of Biodiversity Strategies and Cooperation. Summary of “Biodiversity in Mexico City: State of Knowledge”; CONABIO: Mexico City, Mexico; Available online: https://www.biodiversidad.gob.mx/media/1/region/eeb/files/CDMX_resumen.pdf (accessed on 13 December 2024).
  45. Ralph, J.; Geupel, G.R.; Pyle, P.; Martin, T.E.; DeSante, D.F. Handbook of Field Methods for Monitoring Landbirds; Pacific Southwest Research Station, Forest Service, U.S. Department of Agriculture: Albany, CA, USA, 1993; p. 41. [Google Scholar] [CrossRef]
  46. Hutto, R.L.; Pletschet, S.M.; Hendricks, P. A fixed-radius point count method for nonbreeding and breeding season use. Auk 1986, 103, 593–602. [Google Scholar] [CrossRef]
  47. Bibby, C.J.; Burgess, N.D.; Hill, D.A.; Mustoe, S.H. Bird Census Techniques, 2nd ed.; Academic Press: London, UK, 2000; p. 302. [Google Scholar]
  48. Secretaría de Medio Ambiente y Recursos Naturales (SEMARNAT). NOM-059-SEMARNAT-2010: Listing of Species of Wild Flora and Fauna at Risk, Terrestrial and Aquatic, 1st ed.; Diario Oficial de la Federación: Mexico City, Mexico, 2010. [Google Scholar]
  49. Comisión Nacional para el Conocimiento y Uso de la Biodiversidad (CONABIO). AvesMX: Database on the Birds of Mexico. Available online: https://avesmx.conabio.gob.mx/ (accessed on 18 June 2024).
  50. International Union for Conservation of Nature (IUCN). The IUCN Red List of Threatened Species, Version 2024-1. Available online: https://www.iucnredlist.org (accessed on 22 June 2024).
  51. Soberón, J.; Llorente, J. The use of species accumulation functions for the prediction of species richness. Conserv. Biol. 1993, 7, 480–488. [Google Scholar] [CrossRef]
  52. Heltshe, J.F.; Forrester, N.E. Estimating species richness using the Jackknife procedure. Biometrics 1983, 39, 1–11. [Google Scholar] [CrossRef]
  53. Chao, A.; Lee, S.-M. Estimating the number of classes via sample coverage. J. Am. Stat. Assoc. 1992, 87, 210–217. [Google Scholar] [CrossRef]
  54. Hulbert, S.H. The nonconcept of species diversity: A critique and alternative parameters. Ecology 1971, 52, 577–586. [Google Scholar] [CrossRef]
  55. Krebs, C.J. Ecological Methodology, 2nd ed.; Harper & Row: New York, NY, USA, 1999; p. 765. [Google Scholar]
  56. Legendre, P.; Legendre, L. Numerical Ecology, 3rd ed. In Developments in Environmental Modeling; Elsevier: Amsterdam, The Netherlands, 2012; p. 419. [Google Scholar]
  57. González-Salazar, C.; Martínez-Meyer, E.; López-Santiago, G. A hierarchical classification of trophic guilds for North American birds and mammals. Rev. Mex. De Biodivers. 2014, 85, 931–941. [Google Scholar] [CrossRef]
  58. Greenacre, M.J. Theory and Applications of Correspondence Analysis; Academic Press: London, UK, 1984; p. 364. [Google Scholar]
  59. Ter Braak, C.J.F.; Šmilauer, P. CANOCO Reference Manual and CanoDraw for Windows User’s Guide: Software for Canonical Community Ordination (Version 4.5); Microcomputer Power: Ithaca, NY, USA, 2002; p. 496. [Google Scholar]
  60. Navarro-Sigüenza, A.G.; Rebón-Gallardo, M.F.; Gordillo-Martínez, A.; Peterson, A.T.; Berlanga-García, H.; Sánchez-González, L.A. Biodiversidad de aves en México. Rev Mex Biodiv 2014, 85, S476–S495. [Google Scholar] [CrossRef]
  61. Filloy, J.; Zurita, G.A.; Bellocq, M.I. Bird diversity in urban ecosystems: The role of the biome and land use along urbanization gradients. Ecosystems 2019, 22, 213–227. [Google Scholar] [CrossRef]
  62. Villegas, M.; Garitano-Zavala, Á. Bird community responses to different urban conditions in La Paz, Bolivia. Urban Ecosyst. 2010, 13, 375–391. [Google Scholar] [CrossRef]
  63. González-García, F.; Straub, R.; Lobato García, J.A.; MacGregor-Fors, I. Birds of a neotropical green city: An up-to-date review of the avifauna of the city of Xalapa with additional unpublished records. Urban Ecosyst. 2014, 17, 991–1012. [Google Scholar] [CrossRef]
  64. Carbó-Ramírez, P.; Zuria, I. The value of small urban greenspaces for birds in a Mexican city. Landsc. Urban Plan. 2011, 100, 213–222. [Google Scholar] [CrossRef]
  65. González-Oreja, J.A.; Barillas-Gómez, A.L.; Bonache-Regidor, C.; Buzo-Franco, D.; Garcia-Suárez, M.D.; Hernández-Santín, L. Does habitat heterogeneity affect bird community structure in urban parks? Stud. Avian Biol. 2018, 45, 1–32. [Google Scholar]
  66. Casas, G.; Darski, B.; Ferreira, P.M.A.; Kindel, A.; Müller, S.C. Habitat structure influences the diversity, richness and composition of bird assemblages in successional Atlantic rainforests. Trop. Conserv. Sci. 2016, 9, 503–524. [Google Scholar] [CrossRef]
  67. Davison, C.W.; Assmann, J.J.; Normand, S.; Rahbek, C.; Morueta-Holme, N. Vegetation structure from LiDAR explains the local richness of birds across Denmark. J. Anim. Ecol. 2023, 92, 1332–1344. [Google Scholar] [CrossRef]
  68. Francis, C.D.; Newman, P.; Taff, B.D.; White, C.; Monz, C.A.; Levenhagen, M.; Petrelli, A.R.; Abbott, L.C.; Newton, J.; Burson, S.; et al. Acoustic environments matter: Synergistic benefits to humans and ecological communities. J. Environ. Manag. 2017, 203, 245–254. [Google Scholar] [CrossRef]
  69. MacGregor-Fors, I.; Morales-Pérez, L.; Quesada, J.; Schondube, J.E. Relationship between the presence of House Sparrows (Passer domesticus) and Neotropical bird community structure and diversity. Biol. Invasions 2010, 12, 87–96. [Google Scholar] [CrossRef]
  70. Ramírez-Albores, J.E.; Sánchez-González, L.A.; Pérez-Suárez, M.; Navarro-Sigüenza, A.G.; Franco-Maass, S. Greenspaces as Shelters for the Conservation of Bird Diversity in a Big City. Urban Ecosyst. 2024, 27, 2047–2059. [Google Scholar] [CrossRef]
  71. Jokimäki, J.; Ramos-Chernenko, A. Innovative Foraging Behavior of Urban Birds: Use of Insect Food Provided by Cars. Birds 2024, 5, 469–486. [Google Scholar] [CrossRef]
  72. Fahrig, L. Effects of habitat fragmentation on biodiversity. Annu. Rev. Ecol. Evol. Syst. 2003, 34, 487–515. [Google Scholar] [CrossRef]
  73. Arévalo, C.; Amaya-Espinel, J.D.; Henríquez, C.; Ibarra, J.T.; Bonacic, C. Urban noise and surrounding city morphology influence green space occupancy by native birds in a Mediterranean-type South American metropolis. Sci. Rep. 2022, 12, 4471. [Google Scholar] [CrossRef]
  74. Oropeza-Sánchez, M.T.; Solano-Zavaleta, I.; Cuandón-Hernández, W.L.; Martínez-Villegas, J.A.; Palomera-Hernández, V.; Zúñiga-Vega, J.J. Urban green spaces with high connectivity and complex vegetation promote occupancy and richness of birds in a tropical megacity. Urban Ecosyst. 2025, 28, 50. [Google Scholar] [CrossRef]
  75. Petchey, O.L.; Gaston, K.J. Functional diversity (FD), species richness and community composition. Ecol. Lett. 2002, 5, 402–411. [Google Scholar] [CrossRef]
  76. Mouillot, D.; Graham, N.A.J.; Villéger, S.; Mason, N.W.H.; Bellwood, D.R. A functional approach reveals community responses to disturbances. Trends Ecol. Evol. 2013, 28, 167–177. [Google Scholar] [CrossRef]
  77. Korňan, M.; Holmes, R.T.; Recher, H.F.; Adamík, P.; Kropil, R. Convergence in foraging guild structure of forest breeding bird assemblages across three continents is related to habitat structure and foraging opportunities. Community Ecol. 2013, 14, 89–100. [Google Scholar] [CrossRef]
  78. Hanz, D.M.; Böhning-Gaese, K.; Ferger, S.W.; Fritz, S.A.; Neuschulz, E.L.; Quitián, M.; Santillán, V.; Töpfer, T.; Schleuning, M. Functional and phylogenetic diversity of bird assemblages are filtered by different biotic factors on tropical mountains. J. Biogeogr. 2018, 46, 291–303. [Google Scholar] [CrossRef]
  79. Bender, I.M.A.; Kissling, W.D.; Böhning-Gaese, K.; Hensen, I.; Kühn, I.; Wiegand, T.; Dehling, D.M.; Schleuning, M. Functionally specialised birds respond flexibly to seasonal changes in fruit availability. J. Anim. Ecol. 2017, 86, 800–811. [Google Scholar] [CrossRef] [PubMed]
  80. Loiselle, B.A.; Blake, J.G. Temporal variation in birds and fruits along an elevational gradient in Costa Rica. Ecology 1991, 72, 180–193. [Google Scholar] [CrossRef]
  81. Stiles, F.G. Temporal organization of flowering among the hummingbird foodplants of a tropical wet forest. Biotropica 1978, 10, 194–210. [Google Scholar] [CrossRef]
  82. Bleiweiss, R. Origin of Hummingbird Faunas. Biol. J. Linn. Soc. 1998, 65, 77–97. [Google Scholar] [CrossRef]
  83. Curzel, F.E.; Leveau, L.M. Bird Taxonomic and Functional Diversity in Three Habitats in Buenos Aires City, Argentina. Birds 2021, 2, 217–229. [Google Scholar] [CrossRef]
  84. Clergeau, P.; Jokimäki, J.; Savard, J.-P.L. Are urban bird communities influenced by the bird diversity of adjacent landscapes. J. Appl. Ecol. 2001, 38, 1122–1134. [Google Scholar] [CrossRef]
  85. Blair, R.B. Land use and avian species diversity along an urban gradient. Ecol. Appl. 1996, 6, 506–519. [Google Scholar] [CrossRef]
  86. Bellocq, M.I.; Filloy, J.; Zurita, G.A.; Apellaniz, M.F. Responses in the abundance of generalist birds to environmental gradients: The rufous-collared sparrow (Zonotrichia capensis) in the southern Neotropics. Ecoscience 2011, 18, 354–362. [Google Scholar] [CrossRef]
  87. Galiano, L.; Leveau, C.M.; Leveau, L.M. Long-Term Changes in Bird Communities in the Urban Parks of Mar del Plata City, Argentina. Birds 2024, 5, 814–831. [Google Scholar] [CrossRef]
  88. Remeš, V.; Remešová, E.; Friedman, N.R.; Matysioková, B.; Rubáčová, L. Functional diversity of avian communities increases with canopy height: From individual behavior to continental-scale patterns. Ecol. Evol. 2021, 11, 11839–11851. [Google Scholar] [CrossRef]
  89. Arriaga-Weiss, S.L.; Calmé, S.; Kampichler, C. Bird communities in rainforest fragments: Guild responses to habitat variables in Tabasco, Mexico. Biodivers. Conserv. 2008, 17, 173–190. [Google Scholar] [CrossRef]
  90. Hawkinson, A.J.; Montgomery, R.A.; Roy, C.L.; Shartell, L.M.; Andersen, D.E.; Stevens, T.K.; Knosalla, L.J.; Frelich, L.E. Bird-habitat associations and local-scale vegetation structure in lowland brushlands. J. Wildl. Manag. 2024, 88, e22568. [Google Scholar] [CrossRef]
  91. Benedetti, Y.; Callaghan, C.T.; Ulbrichová, I.; Galanaki, A.; Kominos, T.; Abou Zeid, F.; Ibáñez-Álamo, J.D.; Suhonen, J.; Díaz, M.; Markó, G.; et al. EVI and NDVI as Proxies for Multifaceted Avian Diversity in Urban Areas. Ecol. Appl. 2023, 33, e2808. [Google Scholar] [CrossRef]
  92. Arroyo-Solís, A.; Castillo, J.M.; Figueroa, E.; López-Sánchez, J.L.; Slabbekoorn, H. Experimental Evidence for an Impact of Anthropogenic Noise on Dawn Chorus Timing in Urban Birds. J. Avian Biol. 2013, 44, 288–296. [Google Scholar] [CrossRef]
  93. Slabbekoorn, H.; Peet, M. Birds sing at a higher pitch in urban noise. Nature 2003, 424, 267. [Google Scholar] [CrossRef]
  94. Leveau, L.M. Urban Parks Are Related to Functional and Phylogenetic Filtering of Raptor Assemblages in the Austral Pampas, Argentina. Birds 2024, 5, 38–47. [Google Scholar] [CrossRef]
  95. Benítez-López, A.; Alkemade, R.; Verweij, P.A. The impacts of roads and other infrastructure on mammal and bird populations: A meta-analysis. Biol. Conserv. 2010, 143, 1307–1316. [Google Scholar] [CrossRef]
  96. Fernández Juricic, E. Avifaunal use of wooded streets in an urban landscape. Conserv. Biol. 2000, 14, 513–521. [Google Scholar] [CrossRef]
  97. Lerman, S.B.; Warren, P.S. The conservation value of residential yards: Linking birds and people. Ecol. Appl. 2011, 21, 1327–1339. [Google Scholar] [CrossRef]
  98. Ortega Álvarez, R.; MacGregor Fors, I. Living in the big city: Effects of urban land use on bird community structure, diversity, and composition. Landsc. Urban Plan. 2009, 90, 189–195. [Google Scholar] [CrossRef]
  99. Leveau, L.M.; Leveau, C.M. Does urbanization affect the seasonal dynamics of bird communities in urban parks? Urban Ecosyst. 2016, 19, 631–647. [Google Scholar] [CrossRef]
  100. Leveau, L.M. Long-term directional changes in urban bird communities of Mar del Plata City, Argentina. Front. Ecol. Evol. 2024, 12, 1457476. [Google Scholar] [CrossRef]
  101. Ramírez-Albores, J.E. Avian Community Structureand Spatial Distribution in Anthropogenic Landscapesin Central Mexico. Birds 2025, 6, 18. [Google Scholar] [CrossRef]
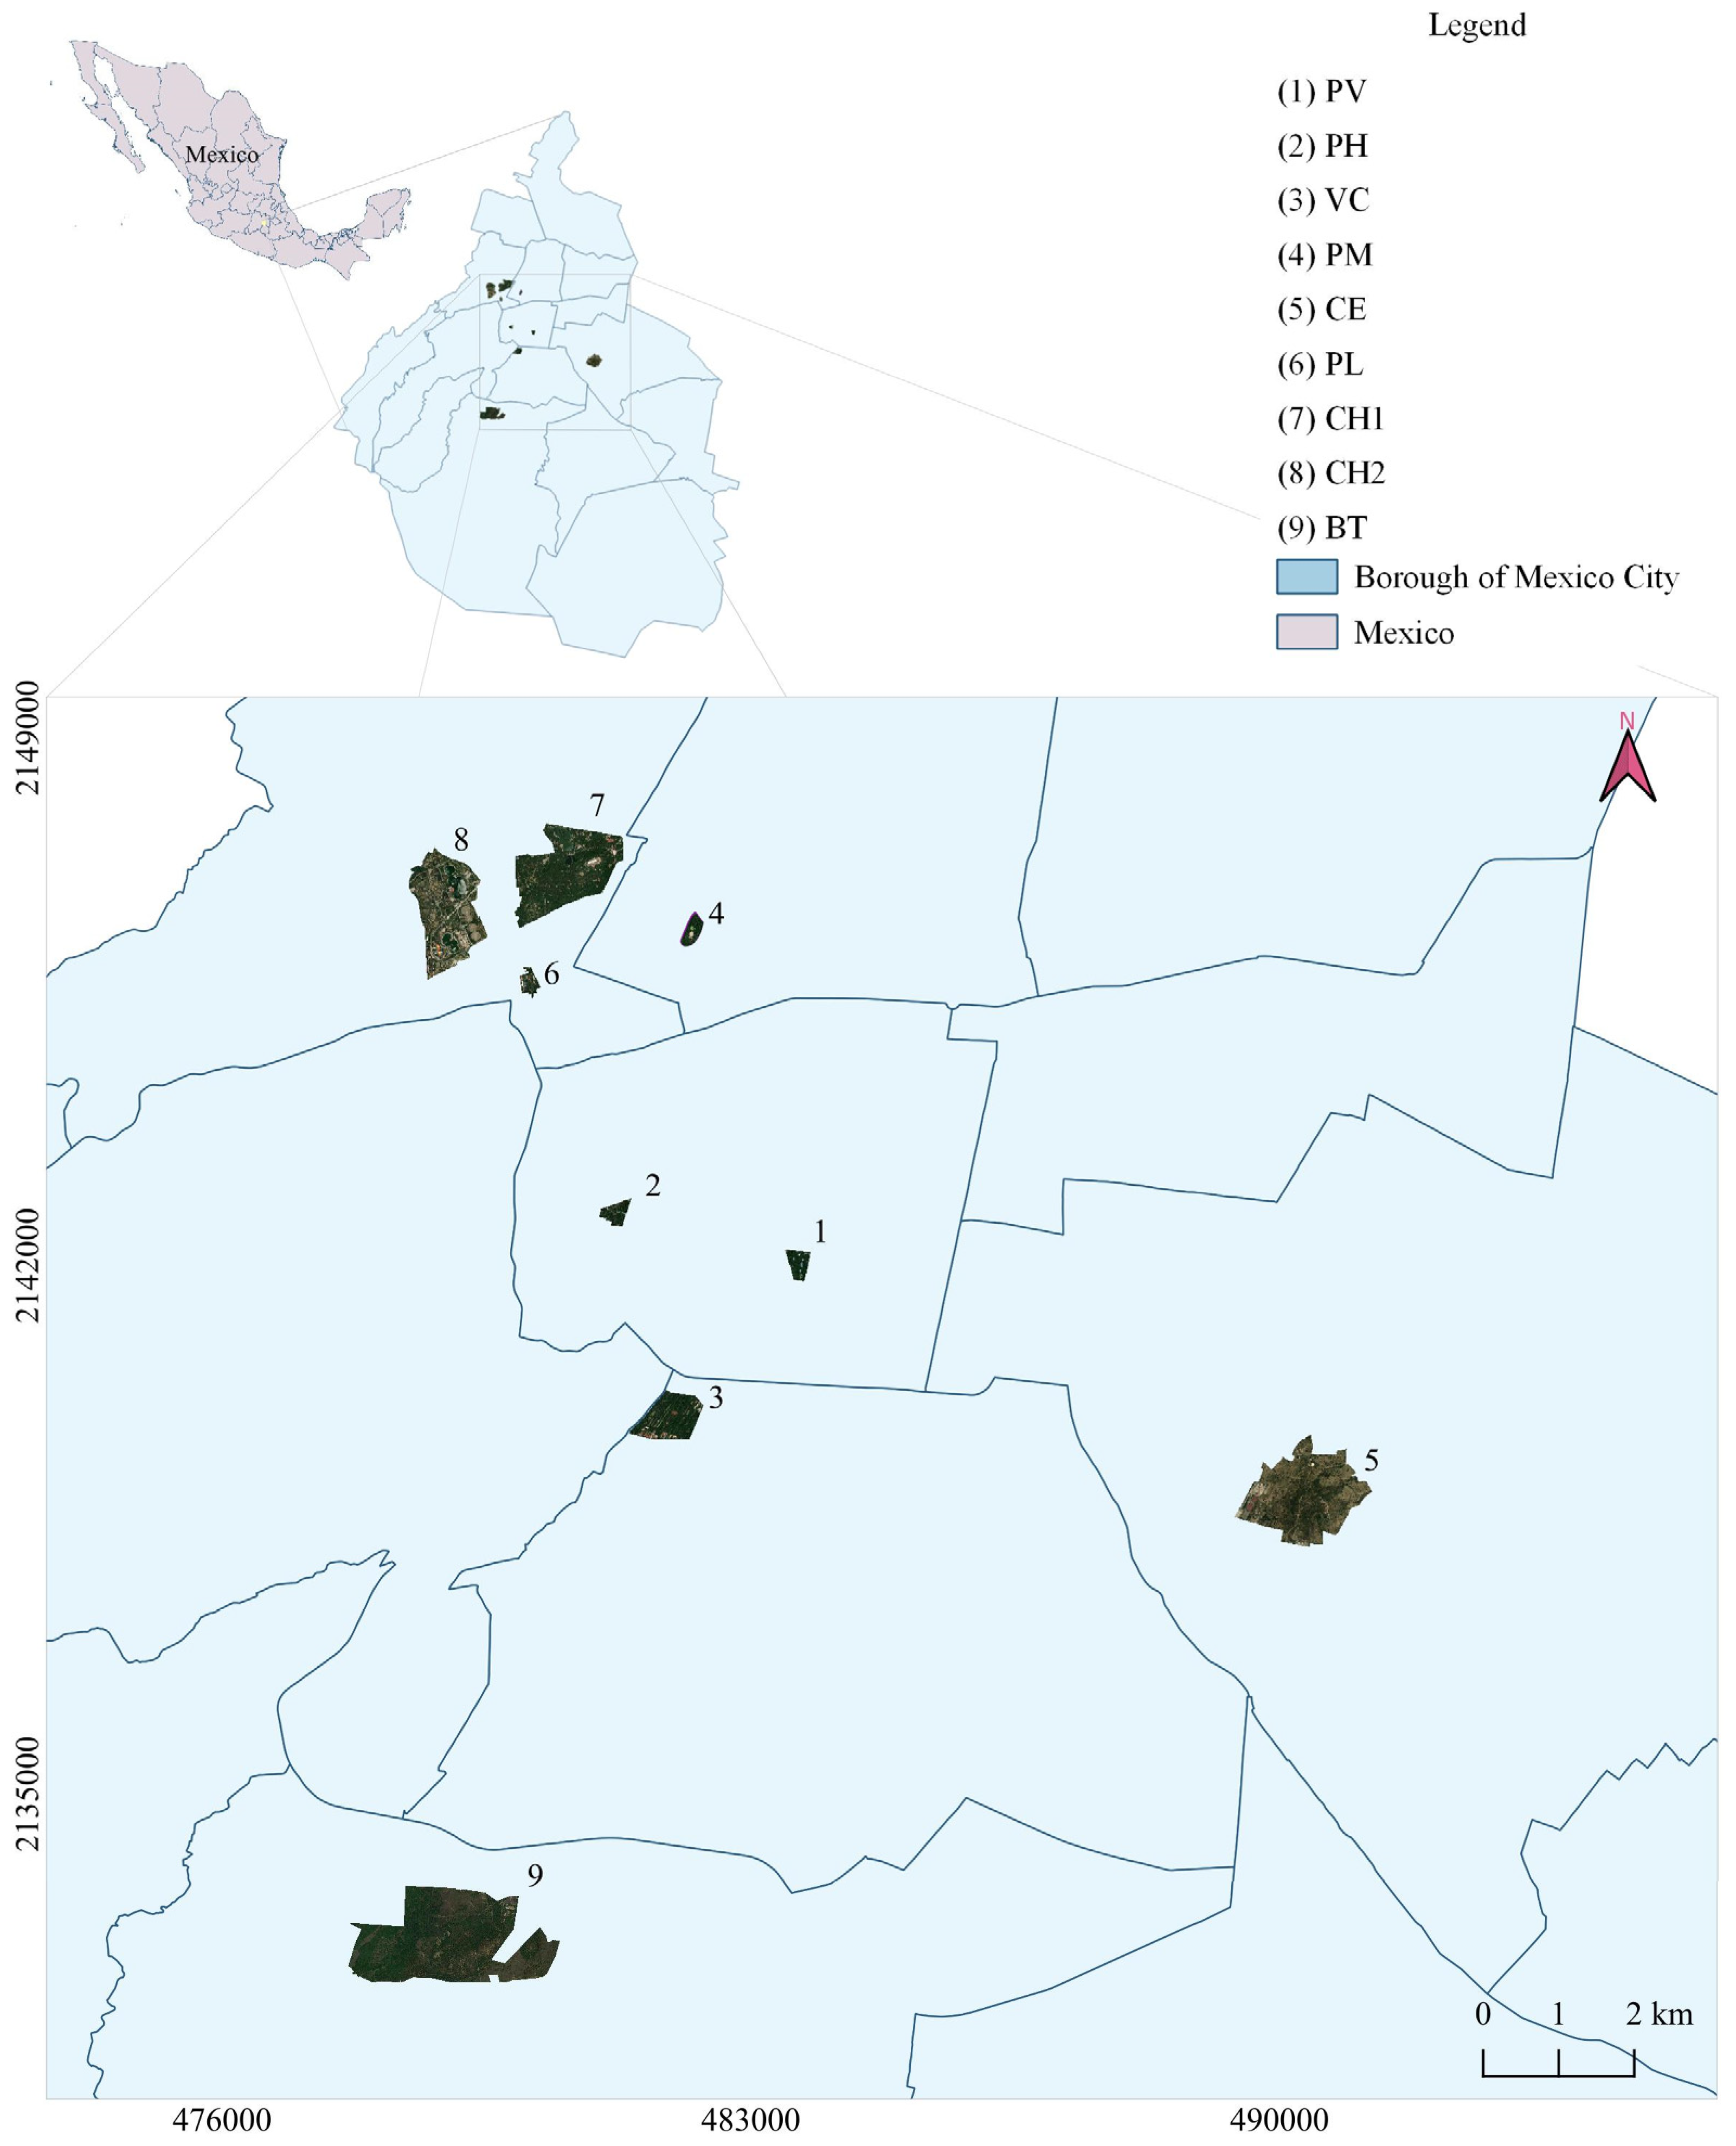
Figure 1. Location of the nine selected study parks within Mexico City. PV, Parque de los Venados; PH, Parque Hundido; VC, Viveros de Coyoacán; PM, Parque México; CE, Cerro de la Estrella; PL, Parque Lira; CH1, Primera sección del Bosque de Chapultepec; CH2, Segunda sección del Bosque de Chapultepec; BT, Bosque de Tlalpan.
Birds 06 00046 g001
Figure 2. Dendrogram resulting from the Jaccard-UPGMA cluster analysis. It shows 101 species grouped into 14 functional groups. The dissimilarity threshold of 0.45 implies that species within the same group share at least 65% similarity in their functional traits. Scientific names were abbreviated using the first letter of the genus (capital) and the first three letters of the species (lowercase), e.g., Colibri thalassinus = Ctha.
Birds 06 00046 g002
Figure 3. Redundancy analysis (RDA) biplot showing relationships between environmental variables (yellow vectors) and bird species distribution (black abbreviations). The first two RDA axes explain 61.64% and 28.25% of the variation, respectively. Vector direction and length indicate the strength and direction of environmental variable associations: park size shows positive association with axis 1, while mean noise level dB(A) shows negative association with this axis. NDVI is primarily associated with axis 3. Species positioned closer to specific environmental vectors show stronger associations with those variables. Scientific names were abbreviated using the first letter of the genus (capital) and the first three letters of the species (lowercase), e.g., Setophaga coronata = Scor.
Birds 06 00046 g003
Figure 4. RDA biplot showing relationships between environmental variables (yellow vectors) and trophic guild distribution (black abbreviations). The first two RDA axes explain 69.17% and 25.74% of the variation, respectively. Guilds positioned closer to specific environmental vectors show stronger associations with those variables. FolFru, Foliage Frugivores; FolIns, Foliage Insectivores; FolOmn, Foliage Omnivores; GleIns, Glean Insectivores; GraFru, Granivores–Frugivores; GraIns, Granivores–Insectivores; GroGra, Ground Granivores; GroIns, Ground Insectivores; GroOmn, Ground Omnivores; InsFly, Insectivore–Flycatcher; InsCar, Insectivores–Carnivores; InsFru, Insectivores–Frugivores; Nec, Nectarivores; TruIns, Trunk Insectivores.
Birds 06 00046 g004
Figure 5. Venn diagram showing the variance partitioning of bird community composition explained by mean noise level dB(A) (a: 30.8%), park size and NDVI, combined unique effects (b: 39.9%), and shared effects (c: 29.3%).
Birds 06 00046 g005
Figure 6. The redundancy analysis (RDA) biplot shows the relationships between environmental variables (yellow vectors) and the residency status of bird species (black words). The first two axes of the RDA explain 94.30% and 5.7% of the variation, respectively. The direction and length of the vectors indicate the intensity and direction of associations between environmental variables: park size shows a positive association with axis 1, while mean noise level dB(A) shows a negative association with this axis. NDVI is mainly associated with axis 3.
Birds 06 00046 g006
Table 1. Environmental characteristics of the nine study parks in Mexico City, including number of count points, individual mean MIN dB(A) and mean MAX dB(A) values, mean noise level dB(A) (calculated as the average of MIN and MAX values) (mean ± SE), park size, and NDVI values. PV, Parque de los Venados; PH, Parque Hundido; VC, Viveros de Coyoacán; PM, Parque México; CE, Cerro de la Estrella; PL, Parque Lira; CH1, Primera sección del Bosque de Chapultepec; CH2, Segunda sección del Bosque de Chapultepec; BT, Bosque de Tlalpan.
Urban ParksNumber of Count PointsMean MIN dB(A) ± SEMean MAX dB(A) ± SEMean Noise Level dB(A) ± SEPark Size (ha)NDVI
VC1244.68 ± 0.24051.70 ± 0.23548.19 ± 0.29039.950.59
PL550.49 ± 0.36555.34 ± 0.52552.91 ± 0.5256.150.5
CH21646.93 ± 0.22953.41 ± 0.24250.17 ± 0.291107.790.47
PM453.24 ± 0.42058.58 ± 0.47355.91 ± 0.5326.830.64
CE1541.58 ± 0.17748.24 ± 0.19944.91 ± 0.194145.150.24
PH551.59 ± 0.43857.14 ± 0.51054.36 ± 0.5298.50.52
PV451.91 ± 0.42458.94 ± 0.57155.42 ± 0.5319.010.62
BT1541.11 ± 0.18747.10 ± 0.17944.11 ± 0.194239.490.57
CH11548.91 ± 0.28054.92 ± 0.32051.91 ± 0.390116.470.49
Table 2. Observed species richness, rarefied richness, estimated richness (Chao 1), and Jackknife 1 with inventory completeness percentage for each study park. PV, Parque de los Venados; PH, Parque Hundido; VC, Viveros de Coyoacán; PM, Parque México; CE, Cerro de la Estrella; PL, Parque Lira; CH1, Primera sección del Bosque de Chapultepec; CH2, Segunda sección del Bosque de Chapultepec; BT, Bosque de Tlalpan.
Urban ParksObserved Richness Rarefied RichnessChao1 (%)Jackknife 1 (%)
VC5453.9396.3682.81
PL3029.9595.2386.75
CH26260.9593.0280.35
PM2726.969088.03
CE7675.9586.1177.55
PH3635.9385.4779.69
PV3534.9085.1180.92
BT7473.8884.0480.14
CH15150.9383.6181.05
Table 3. GLM results for species richness, functional guilds, and protected species in relation to park size and vegetation quality (NDVI) in Mexico City urban parks. Models used Poisson distribution. Coefficients represent log-scale effects. Park area measured in hectares; NDVI ranges 0–1. AIC values allow model comparison (lower values indicate better fit).
ModelVariableCoefficient (β)Standard Errorz-Valuep-ValueAIC
Foliage Insectivores 47.54
Intercept2.3540.4784.927<0.001
Park size0.0050.0013.582<0.001
NDVI−1.0040.852−1.1800.238
Ground Omnivores 34.49
Intercept1.0721.0471.0240.306
Park size−0.000070.003−0.0280.978
NDVI0.1991.8160.1100.913
Total Richness 66.78
Intercept4.0530.22218.262<0.001
Park size0.0030.00055.628<0.001
NDVI−0.8850.392−2.2580.024
Protected Species 31.74
Intercept1.0800.9171.1790.238
Park size0.0050.0032.0460.041
NDVI−1.3971.643−0.8500.395
Table 4. Variation explained by each environmental component in the variation partitioning analysis using mean noise level dB(A).
FractionVariation (adj)% of Explained Variance% of All Variance
A0.07130.87.2
B0.09239.99.3
C0.06829.36.8
Total explained0.23286100.0023.3
Table 5. Statistical significance of fraction combinations in variation partitioning analysis.
Test ComponentsFp
a + b + c1.80.044
a + c2.30.044
b + c1.80.046
Disclaimer/Publisher’s Note: The statements, opinions and data contained in all publications are solely those of the individual author(s) and contributor(s) and not of MDPI and/or the editor(s). MDPI and/or the editor(s) disclaim responsibility for any injury to people or property resulting from any ideas, methods, instructions or products referred to in the content.