
Assessing the Uncertainty of Total Seabird Bycatch Estimates Synthesized from Multiple Sources with a Scenario Analysis from the Western and Central Pacific


1
Department of Mathematics, Shandong University, Weihai 264209, China
2
Independent Researcher, Bryan, TX 77801, USA
*
Author to whom correspondence should be addressed.
Birds 2022, 3(3), 260-276; https://doi.org/10.3390/birds3030017
Submission received: 1 July 2022
/
Revised: 1 August 2022
/
Accepted: 8 August 2022
/
Published: 10 August 2022
(This article belongs to the Special Issue Feature Papers of Birds 2022–2023)
Abstract
:Simple Summary
Each year, billions of seabirds undertake extensive migrations, connecting remote regions of the world, potentially synchronizing population fluctuations among distant areas. This connectedness has implications for the uncertainty calculations of the total seabird bycatch estimate at a regional/global scale synthesized from individual assessments conducted at a local scale. Globally, fisheries bycatch poses an environmental problem in fishery management, and estimating the uncertainty associated with a regional/global seabird bycatch estimate is important, because it characterizes the accuracy and reliability of the fisheries’ impact on the seabird populations. In this study, we focus on the estimation of the variability of total seabird bycatch, synthesized from multiple sources. In addition to a theoretical exploration, we also provide a hypothetical scenario analysis based on data from the Western and Central Pacific Fisheries Commission convention area. The results show that the assumptions on the correlation between different areas has a big impact on the uncertainty estimates, especially when the number of areas to synthesize is large, and simplifying assumptions failed to capture the complex dynamics of seabird bycatch rates among different areas. It is recommended to empirically estimate the correlation of bycatch rates between each pair of sources when time series of bycatch rates are available.
Abstract
Each year, billions of seabirds undertake migrations, connecting remote regions of the world, potentially synchronizing population fluctuations among distant areas. This connectedness has implications for the uncertainty calculations of the total seabird bycatch estimate at a regional/global scale. Globally, fisheries bycatch poses a major problem in fishery management, and estimating the uncertainty associated with a regional/global seabird bycatch estimate is important because it characterizes the accuracy and reliability of the fisheries’ impact on the seabird populations. In this study, we evaluate different assumptions underlying the estimation of the variability of the total seabird bycatch at a regional/global scale based on local assessment reports. In addition to theoretical analysis, we also simulate multiple spatially distant separately managed areas with relatively low levels of observer coverage, based on bycatch data from the Western and Central Pacific Fisheries Commission convention area. The results show that assuming a completely synchronized variation produced the most conservative uncertainty estimate and it also missed an opportunity to improve the precision. Simplified correlation structures also failed to capture the complex dynamics of bycatch rates among spatially distant areas. It is recommended to empirically estimate the correlation of bycatch rates between each pair of sources based on bycatch rate time series.
1. Introduction
Fisheries’ bycatch poses a serious threat to seabird populations, especially albatrosses, petrels, and shearwaters at the global scale, with both direct and indirect consequences to ecosystem health and the trophic dynamics of ocean systems [1,2,3,4]. The latest global assessment ranks bycatch as the top threat by the number of seabirds affected, followed by impact from invasive species and climate change [5]. Recognizing seabird bycatch as a threat to sustainable fisheries, key tuna Regional Fisheries Management Organizations, such as the International Commission for the Conservation of Atlantic Tunas and the Western and Central Pacific Fisheries Commission (WCPFC), often mandate bycatch mitigation requirements, such as night setting, the use of streamer lines and/or hook shielding devices, in areas with historically high levels of bycatch [6].
Seabirds spend a substantial part of their time beyond national borders and their life history depends on the high seas [7,8]. Each year, billions of birds undergo extensive migrations, and long-distance travels across the seas are not uncommon [9]. These flights connect the remote regions of the world. The extensive overlap of the distribution of seabirds with the footprint of fishery operations is particularly concerning [10,11,12]. Globally, it has been estimated that at least 160 thousand seabirds are killed annually, with persistent data gaps in some regions and fleets [13]. Despite the global extent of the issue, seabird bycatch assessments are commonly completed at a local level, for example, the US North Atlantic pelagic longline fleet [14], the Chinese Atlantic longline fleet [15], longline vessels in the Western Mediterranean around Columbretes Islands [16], and the gillnets in the Polish exclusive economic zone of the Baltic Sea [17]. This can cause problems when one needs to evaluate the overall size of seabird bycatch at a regional or global scale, based on individual assessment reports at local scales. These regional/global assessments have direct consequences on policy making, and in directing conservation efforts at the national and international level.
Assessing the uncertainty in the total seabird bycatch estimate is important because it characterizes the accuracy and reliability of the estimate [13], and some management agency has set a direct target on its value [18]. In a benchmark review, Anderson, Small, Croxall, Dunn, Sullivan, Yates, and Black [13] compiled individual seabird bycatch assessments from 68 longline fisheries around the globe, and they found that the upper range of the total seabird bycatch approximately doubles the average estimate, and they could not calculate a lower range for their estimate, due to a high level of uncertainty in bycatch rate estimates. In their study, the upper ranges from individual assessments were added together to arrive at the upper range for the total count. This procedure seems harmless, but it almost always overestimates the upper range, because, for their estimate to be true, the upper ranges of the seabird bycatch estimate in all of the 68 fisheries need to co-occur, an unlikely event. So far, it is not clear if it is common for the seabird bycatch rates from the different fisheries to fluctuate in a completely synchronized way; in the case of the spatially distant sources, if it is safe to make the independence assumption; and if the answer is no for both of the questions, how to obtain an uncertainty estimate from individual seabird bycatch assessments at a local level.
The main goal of this study is to fill this knowledge gap by developing a workflow for the estimation of the uncertainty level of seabird bycatch at a regional/global scale, based on the assessment reports at local scales. It is assumed that the annual bycatch rates from each source have already been assessed and are available to the researcher, which is a common situation. The task of a local assessment is to provide an unbiased estimate of the seabird bycatch rate. At the local level, it is important to consider aspects affecting bycatch susceptibility, such as the species identity and life history stages. However, at a higher level, it is assumed that these aspects have already been incorporated into the reported bycatch rate from each source, and therefore, they do not further affect the calculation of the total seabird bycatch at a higher level.
In the following, in addition to a theoretical analysis, we also explore different scenarios, based on seabird bycatch records from the WCPFC convention area. These records were used to hypothetically simulate multiple spatially distant separately managed areas with a relatively low level of observer coverage, a common situation for the assessments conducted on a regional/global scale. We demonstrate how to obtain an uncertainty estimate of the total bycatch based on the individual assessments, show that the difference among the different assumptions can be substantial when the number of individual assessments is high, and provide some empirical evidence for the co-variability of the patterns of seabird bycatch rates.
2. Methods
2.1. Problem Statement
Given unbiased seabird bycatch rate estimates and the total fishing effort from multiple sources, the total seabird bycatch can be calculated as the sum of the product of the total fishing efforts and the estimated bycatch rates; the task is to estimate the level of uncertainty by the variance in the total seabird bycatch. The primary source of variation comes from the bycatch rate estimates. For each source, the seabird bycatch rate can be estimated, based on a sample of observed fishing operations. The seabird bycatch rate varies with natural factors, such as changes in the seabird abundance, spatial distribution, and the spatial–temporal overlap between the seabirds and fisheries. The other sources of variation include sampling error, intrinsic stochasticity, and changes in the distribution of the fishing effort in each region, and, for simplicity, these variations are assumed to be independent for each region. Specifically, the incomplete observer coverages (i.e., less than 100% coverage) contribute to the different levels of sampling errors. It is important for the estimation model to handle potentially different levels of sampling error from each source, due to the differences in observer coverage.
The bycatch rate also varies with technological and managerial factors, such as changes in the bycatch mitigation requirements, and these factors mainly affect its average value rather than the variability. In the following, we consider the common case where the fishing effort is known; when the fishing effort is not known, its variation also contributes to the uncertainty in the estimated total bycatch. The coefficient of variation (CV) is another commonly used measure of uncertainty in the bycatch studies [16,17]. In the US, the use of the CV is recommended for evaluating the bycatch uncertainty of the US fisheries, with a target precision of 20–30% by the National Bycatch Strategy of the National Marine Fisheries Service [18]. Therefore, both the variance and the CV were investigated in this study.
2.2. Correlation Structures of Seabird Bycatch Rates
When the total fishing effort is known from each source, for example, based on the fishery logbooks, the variance of the total bycatch can be calculated, based on the covariance matrix of bycatch rates. However, the covariance matrix is only partially known based on the individual assessments, and additional information is needed to fill in the missing entries. The key is to obtain the bycatch rate variability from each source and the co-variability of the bycatch rates among all of the sources. Biologically, the bycatch rate variability from each source is due to both sampling errors and factors such as abundance fluctuations and seasonal migration, and the bycatch rates from different areas may fluctuate synchronously/anti-synchronously. See File S1 for the formula when the total fishing effort is also estimated.
There are three special cases where additional knowledge of the covariance matrix is not needed for the calculation of the uncertainty estimate of the total bycatch. The first one is the completely synchronized case, where the bycatch rates from any two sources are perfectly correlated. For the second case, the bycatch rates from all of the sources are assumed to be independent from each other. For the third case, the variation of the bycatch rates is completely counter-balanced, and the total bycatch is perfectly determined. See File S1 for more technical details on these special cases.
Next, we motivate the development of the methodology by considering the biological processes that could naturally produce the correlation structures mentioned above. The processes that synchronize the variations in the bycatch rates include fluctuations in the seabird population’s abundance, and shrinkage and expansion in the distribution of seabirds (Figure 1 left panel). For example, a population decline would reduce the availability of the seabirds to incidental capture, and it would synchronize a declining trend in the bycatch rates for all of the fishing vessels operating within range without any other changes. Similarly, population growth would produce an increasing trend in the bycatch rates. The expansion and shrinkage of the seabird distribution in either space or time have the same effect as the fluctuating abundance discussed above. On the other hand, seabird distribution shifts in either space or time can produce the counter-balanced variation in the bycatch rates (Figure 1 right panel). Holding the overall population abundance constant, the distribution shifts will increase the availability of seabirds and thus a higher bycatch rate in some of the regions, and simultaneously decrease the availability of seabirds in some of the other regions and thus a lower bycatch rate. Realistically, the fluctuating population abundances and shifts in the temporal and spatial distribution act simultaneously on the bycatch rate, and the overall correlation will depend on the relative strength of these processes. Thus, the biological processes naturally give rise to correlated bycatch rates among the spatially separate areas. Note that the purpose of this thought experiment is to motivate the development of the methodology and provide some biological context to potential patterns, and it is by no means to provide any hypotheses to be tested here.
Generally, the bycatch rates from two different regions may vary between the completely synchronized case and the completely counter-balanced case, and the uncertainty estimation of the total bycatch would require additional knowledge of the missing correlation coefficients. When the time series of bycatch rates estimates from each source are available, these missing coefficients can be empirically estimated. However, when detailed information is unavailable, it is not clear which simplified case could be used as the default. In the following hypothetical example, we empirically estimate the correlation in bycatch rates among two configurations of spatial partitions in the Western and Central Pacific, and the results may provide guidance for uncertainty calculations in other regions.
2.3. Scenario Analysis: Seabird Bycatch in Longline Fisheries in the Western and Central Pacific
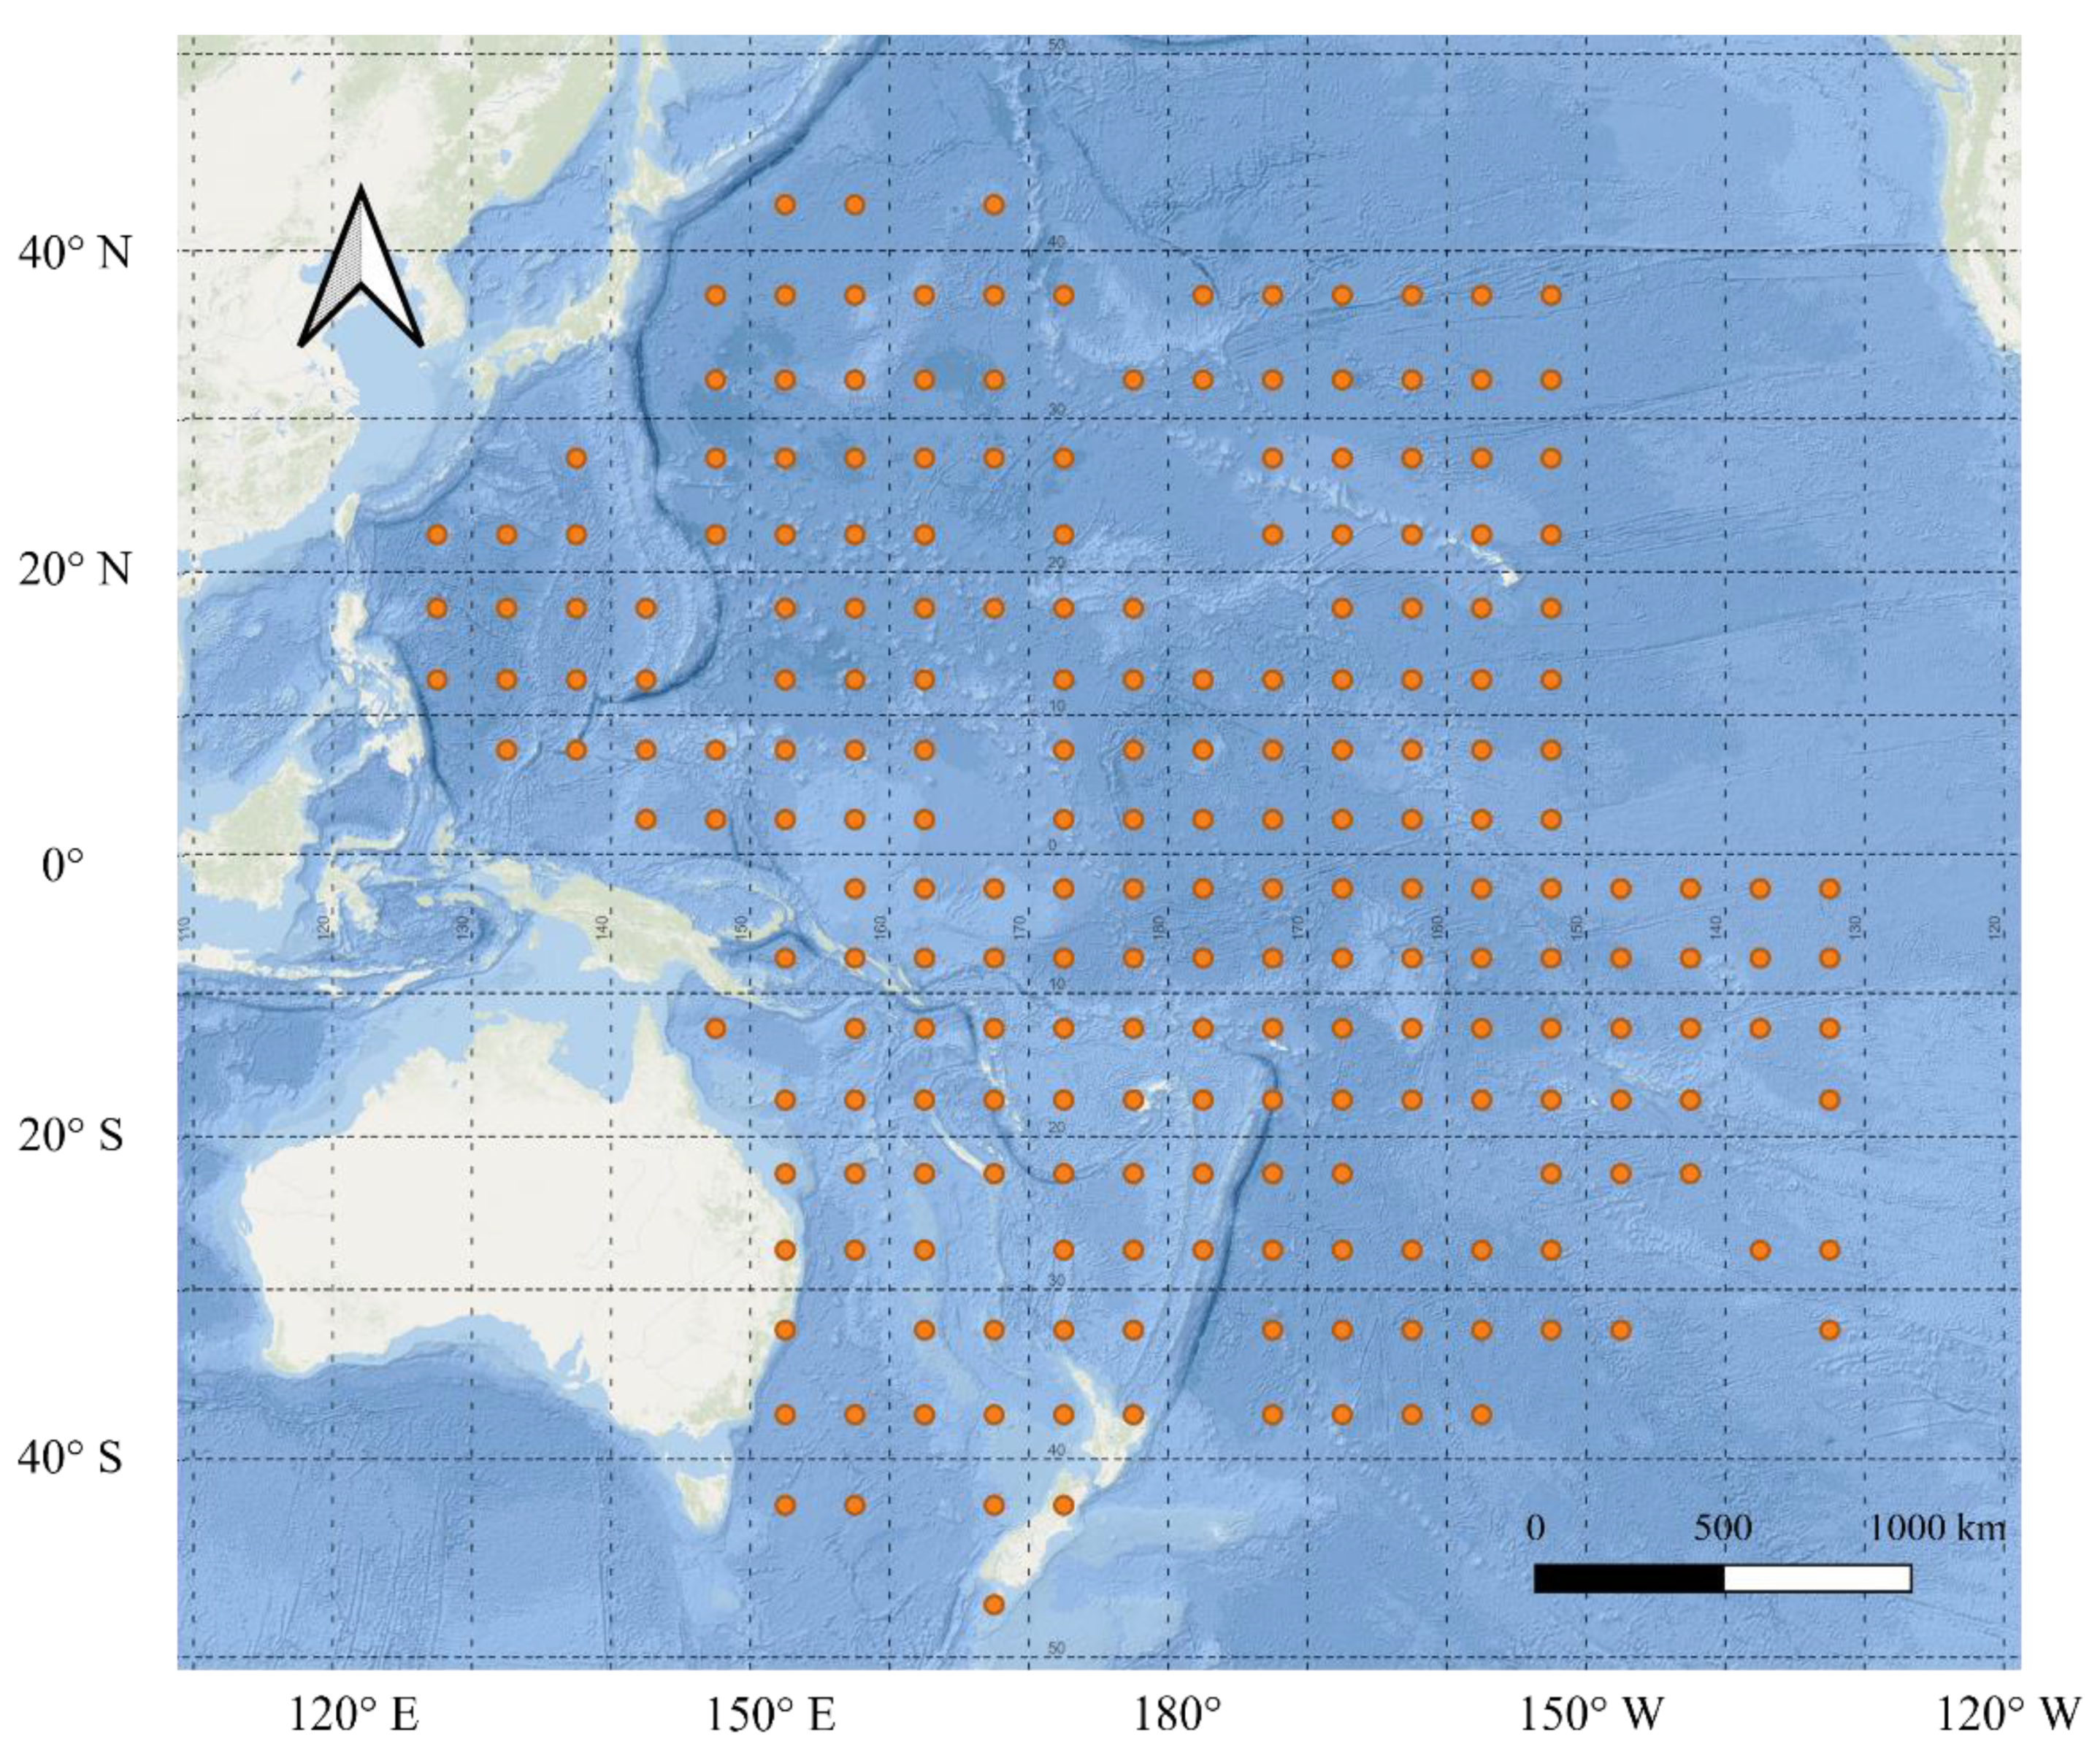
The WCPFC convention area covers a large proportion of the species range of the albatross species, many of which are globally threatened [19,20]. In this study, the public domain aggregate (5° × 5° latitude/longitude) seabird bycatch and target catch records from the WCPFC convention area were obtained (Figure 2). The temporal coverage of the analysis spans eight years from 2013 to 2020. The bycatch dataset used contains a total of 5224 seabird capture records from over 180 million observed hooks. In this study, no distinction is made between the different seabird species, as species identification is incomplete in this dataset, and the seabird bycatch rate is calculated as the number of captured seabirds per 1000 hooks.
The observer coverage of this dataset is approximately 2.5% of the total fishing effort in number of hooks. The observer coverage may be sporadic in some of the areas in this region, and it may contribute to a high level of uncertainty in the bycatch rate estimate. Globally, this situation is the common case rather than an exception. This study addresses the issue of how to properly propagate the uncertainty at a local scale to estimates at a higher level. Another relevant issue to investigate is the validity of independence assumption among spatially distant areas, and the large spatial extent of this dataset allows us to also address this issue. On the other hand, a dataset with a high observer coverage (100%, for example) and local spatial extent would not allow us to expose those important issues commonly encountered in the assessments conducted at a regional/global scale.
We need to emphasize that the purpose of this example is to demonstrate the workflow and explore some common issues in estimating the uncertainty of the total bycatch at a regional/global scale with a real-world dataset. It is not the purpose of this example to estimate the bycatch rates for this region, which falls under the scope of a local scale assessment. To prevent any potential misuse of the particular results reached in this example, the level of uncertainty was calculated based on a hypothetical vector of total fishing efforts. Again, it falls under the scope of local scale assessment reports to supply the estimated mean and variance of the bycatch rate for each area, which are subsequently used in a regional/global assessment. The total fishing effort can be either be known or also estimated with its mean and variance, and the corresponding formula for either case can be found in File S1.
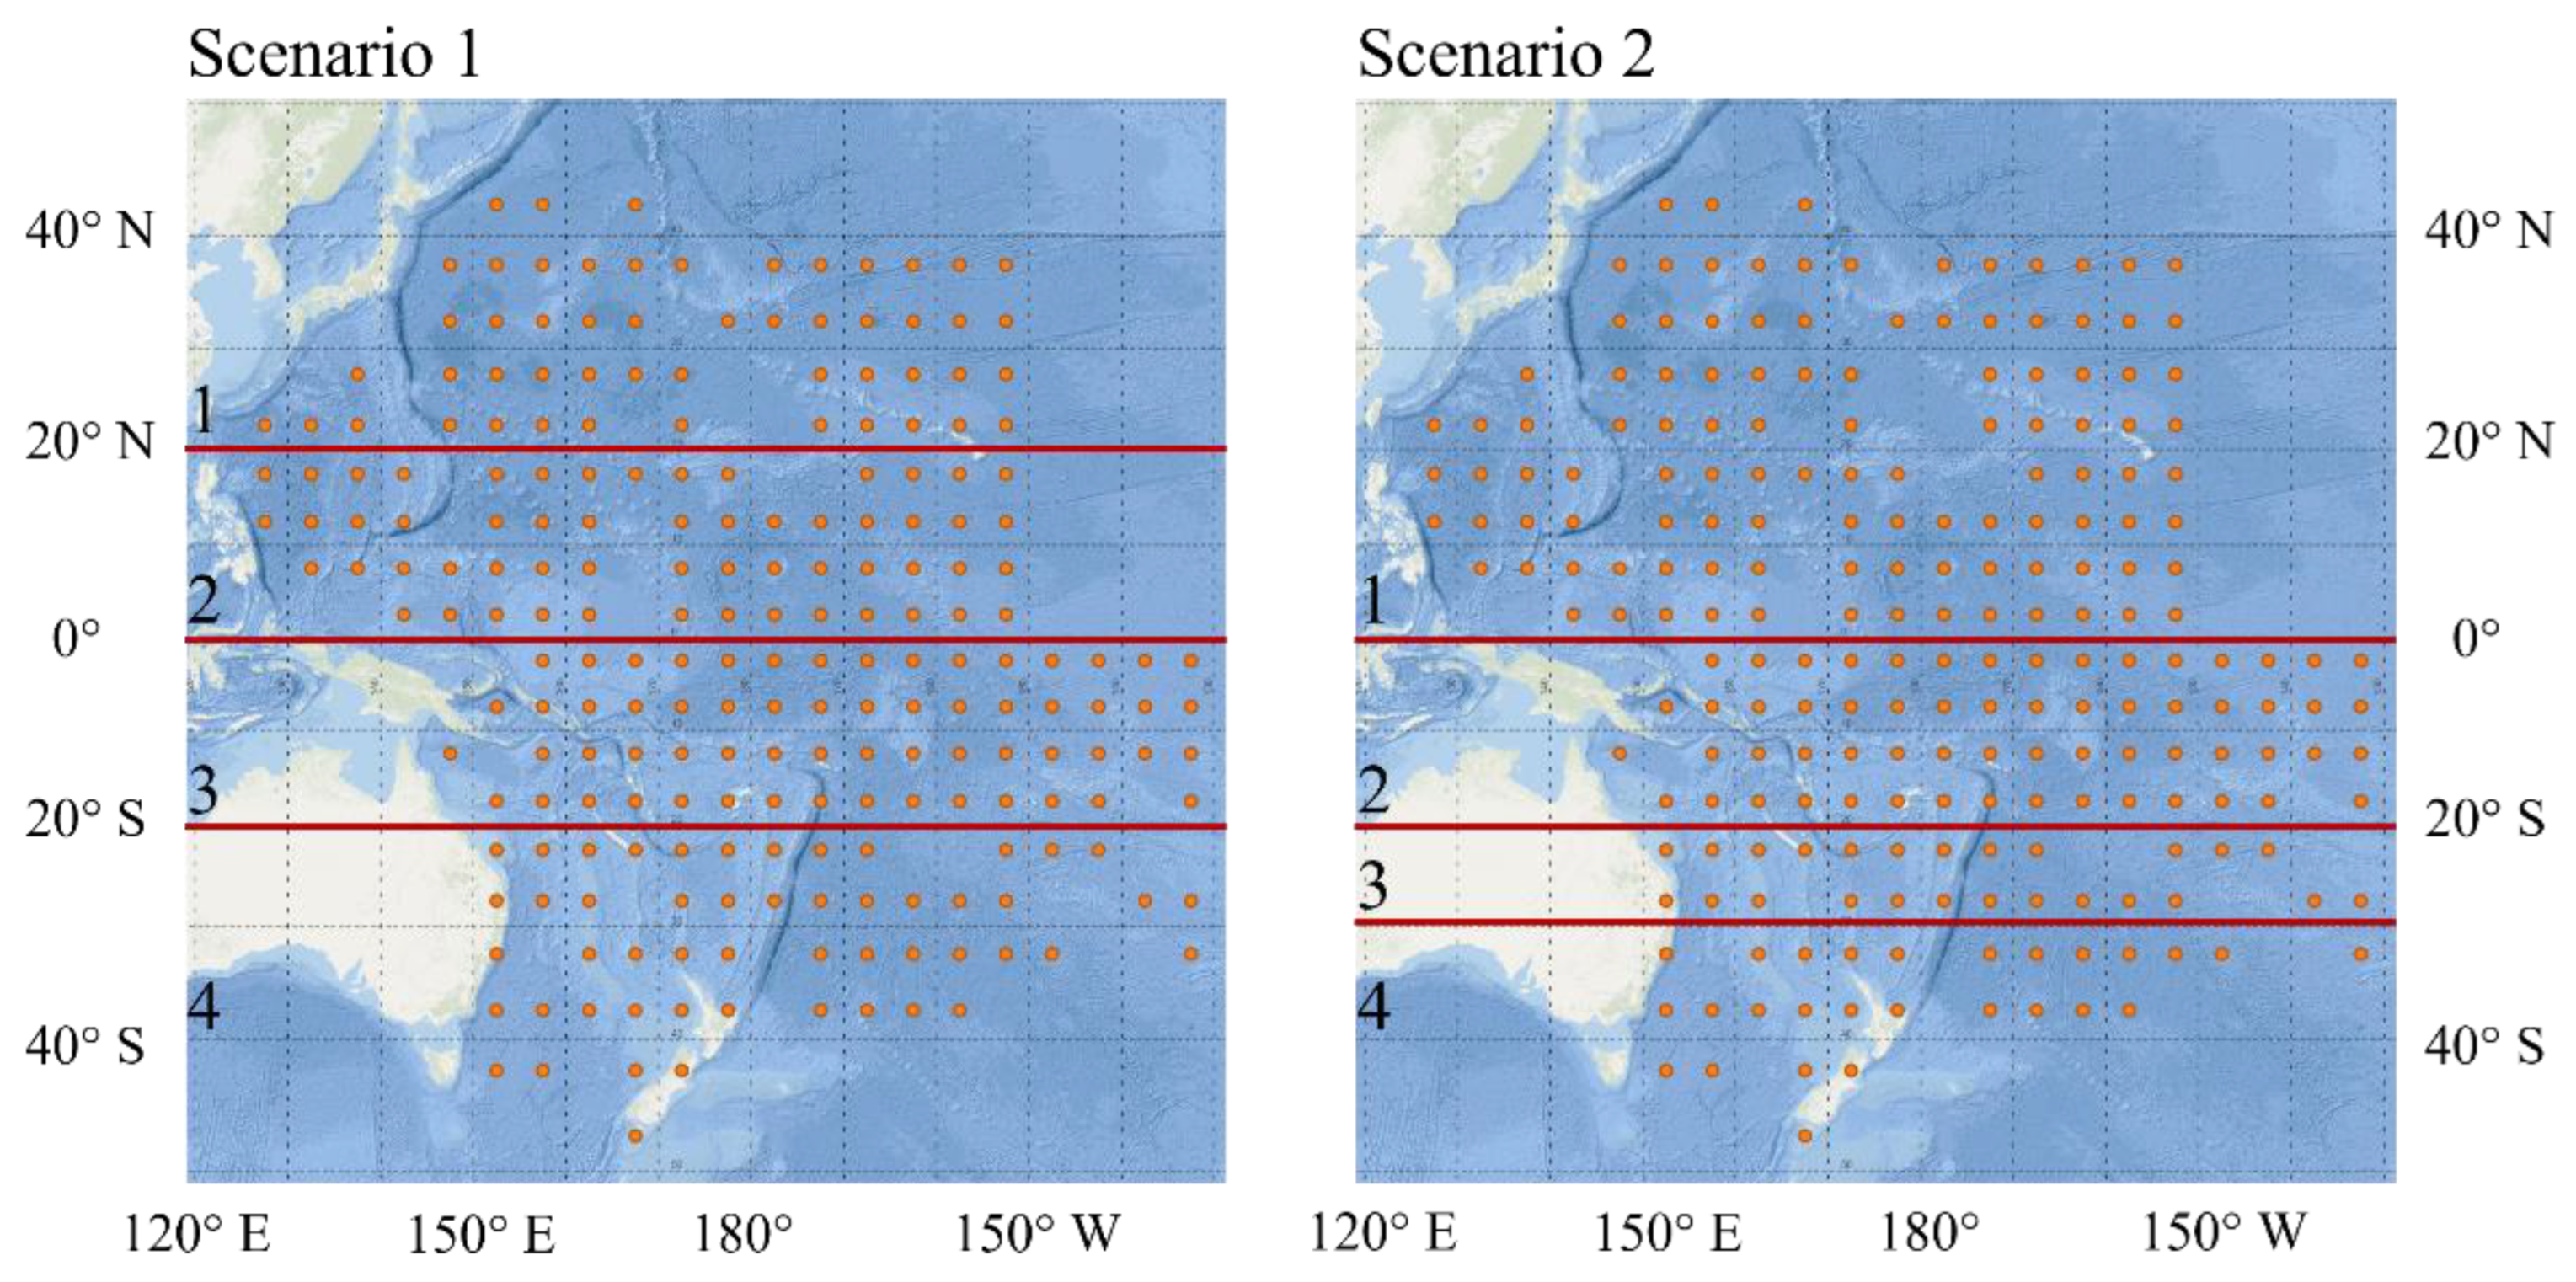
In this study, two scenarios of partitioning the whole region into adjacent latitude bands were investigated (Figure 3). In scenario one, the four adjacent areas were defined based on the latitude of the location: area one for locations to the north of 20° N, area two for the area between 20° N and the equator, area three for the area between the equator and 20° S, and area four for the area south of 20° S (Figure 3 left panel). These areas partition the whole region into approximately equal parts. Next, areas one and two in scenario one were combined to form area one in scenario two, area four in scenario one was divided into areas three and four in scenario two, and area two of scenario one remains unchanged and was renamed area two in scenario two (Figure 3, right panel).
The purpose of analyzing these configurations of the spatial partition is to show a real-world example of the synchronized and counter-balanced variation in the bycatch rates. The hard constraint for these areas is that they must be large enough such that there is a non-zero observer coverage in every year from 2013 to 2020 for each of the individual areas. The latitude bands were used due to the strong longitudinal gradient in seabird distribution in the Pacific [7], and seabird bycatch mitigation requirements in this region are also latitude based [21], such that the bycatch rates are more similar among the locations within each latitude band than across the different bands. To some degree, these individual areas are arbitrarily defined, and one can come up with other configurations to achieve qualitatively similar results.
For each area, the observed annual seabird bycatch rate was assumed to be given and calculated as the total number of the observed captures divided by the total observation effort in the thousands of hooks observed in that year, and the estimated annual total bycatch was the sum of the product of the observed bycatch rate and the total fishing effort in that area. The annual bycatch rate was assumed to have mean . The method of generalized least squares was used to estimate the type of correlation among the bycatch rates in different areas [22]. Three different correlation structures were tested. These included the independent, compound symmetry, and general symmetric correlation matrices. In the compound symmetry case, with the estimate of the common coefficient, we can test the validity of the three special cases of correlation in the bycatch rates (see File S1 for details).
All of the analyses were conducted in the R 4.1.3 statistical environment [23] with package nlme [24]. The model selection was based on AIC [25]. As a rule of thumb, models having have substantial support, those having have considerably less support, and models having have essentially no support [26].
3. Results
The model selection results indicate complex interactions between the seabird bycatch rates in the Western and Central Pacific scenario analysis. For both of the configurations of the spatial partition, the model with a general correlation matrix was selected as the best model, based on AIC (Table 1). For scenario one, the independent case was the second-best model, followed by the compound symmetry case with a similar fit, while for scenario two, the compound symmetry case was selected as the second-best model followed by the independence case, which fits the data rather poorly with .
The estimates of the general correlation matrices in the selected models show the existence of both a synchronized and counter-balanced variation. Both of the positive and negative components were present in the estimated correlation matrix of scenario one, and the large positive correlation (0.897) between the two spatially separated areas one and four was potentially mediated through their common negative correlation with area two located in the middle (Table 2). In contrast, all of the estimated correlation coefficients were positive in scenario two with no negative components (Table 3). By combining and splitting some of the individual areas (Figure 3), we obtained qualitative changes in the correlation matrix, suggesting that the correlation structure is sensitive to the spatial configuration of the individual areas.
Surprisingly, in both of the scenarios the strongest correlation appears between the areas most separated in distance, i.e., areas one and four (Table 2 and Table 3). Specifically, in scenario two, the correlation between the bycatch rate in area one and the other areas increases with distance (Table 3). These results suggest that the commonly used spatial correlation structures that dictate a monotonically declining correlation with distance will not provide a good fit for this particular dataset.
Even though the compound symmetry correlation structure is flexible enough to accommodate either zero, positive, or negative correlations among the areas, it failed to fit the data well. In the first scenario, a weakly positive correlation parameter was obtained ( in Table A2, Appendix A) whilst both of the positive and negative correlations were identified in the general model, and the negative correlations were masked by the positive correlation that is larger in magnitude (Table 2). In the second scenario, where all of the correlations were identified to be positive, but with different magnitudes in the general model, a moderate correlation parameter was obtained by assuming the compound symmetry structure ( in Table A4, Appendix A). In both of the cases, the assumption of a common correlation coefficient between the areas was not met by the data, and, as a result, a poor fit was provided as compared to the general case.
With both the variance structure and the correlation structure estimated based on the selected model (Table 2 and Table 3), the uncertainty estimate of the total bycatch can be readily calculated. For example, using the formula for the known total fishing efforts (see File S1 for details), for a hypothetical vector of the total fishing effort of 20, 30, 40, and 50 million hooks in areas one through four in scenario one and the associated vector of standard errors, as shown in Table 2, the total seabird bycatch is 5440 birds with a CV of 87.78%. Assuming complete synchronization gives the same average, but with a CV of 91.86%, and assuming independence gives a CV of 64.35%. Since the vector of standard errors comes from the time series model, the calculated uncertainty is for the expected total observed seabird bycatch averaged over all of the years. In this hypothetical example, since we know the observed seabird bycatch rate for all of the years across all of the areas, we can calculate the uncertainty directly from the data, and the CV is 86.81% based on a direct calculation, which matches closely with the value based on the selected model. Note that, in practice, the vector of standard errors would come from the local level assessment report from each area, and a direct calculation would not be possible. When any of the total fishing effort is also estimated, the area specific bycatch rate, which also comes from the local level assessment report, will also be used in the calculation with a different formula (also found in File S1). By making additional distributional assumptions on the bycatch rates, one can further obtain the confidence interval estimates on total bycatch. The order of the uncertainty estimates with different assumptions on the correlation structure is as expected, and the discrepancy among them is relatively small because the number of areas here is only four. In the following, we show that the discrepancy can be substantial when the number of areas is high.
On the other hand, the estimates of seabird bycatch rates are not sensitive to the assumptions in the correlation structure. For both of the scenarios, the estimates of the area specific seabird bycatch rate are similar among the models with different correlation structures (Table 2; Table A1 and Table A2 (Appendix A) for scenario one; Table 3; Table A3 and Table A4 (Appendix A) for scenario two). This is not unexpected, because the covariation of the seabird bycatch rates between the two areas does not concern the average bycatch rate in any of the areas. However, this does imply that finding the correct correlation structure is not important. As further illustrated below, and also described in the Methods section, the correlation structure becomes more important when we need to compile estimates from a large number of individual sources. Incidentally, the seabird bycatch rates from mid-latitudes in both of the hemispheres are significantly higher than those from the equatorial region (Table 2), despite the more stringent bycatch requirements in the higher latitudes, suggesting a review of the implementation and effectiveness of the bycatch mitigation measures in those areas.
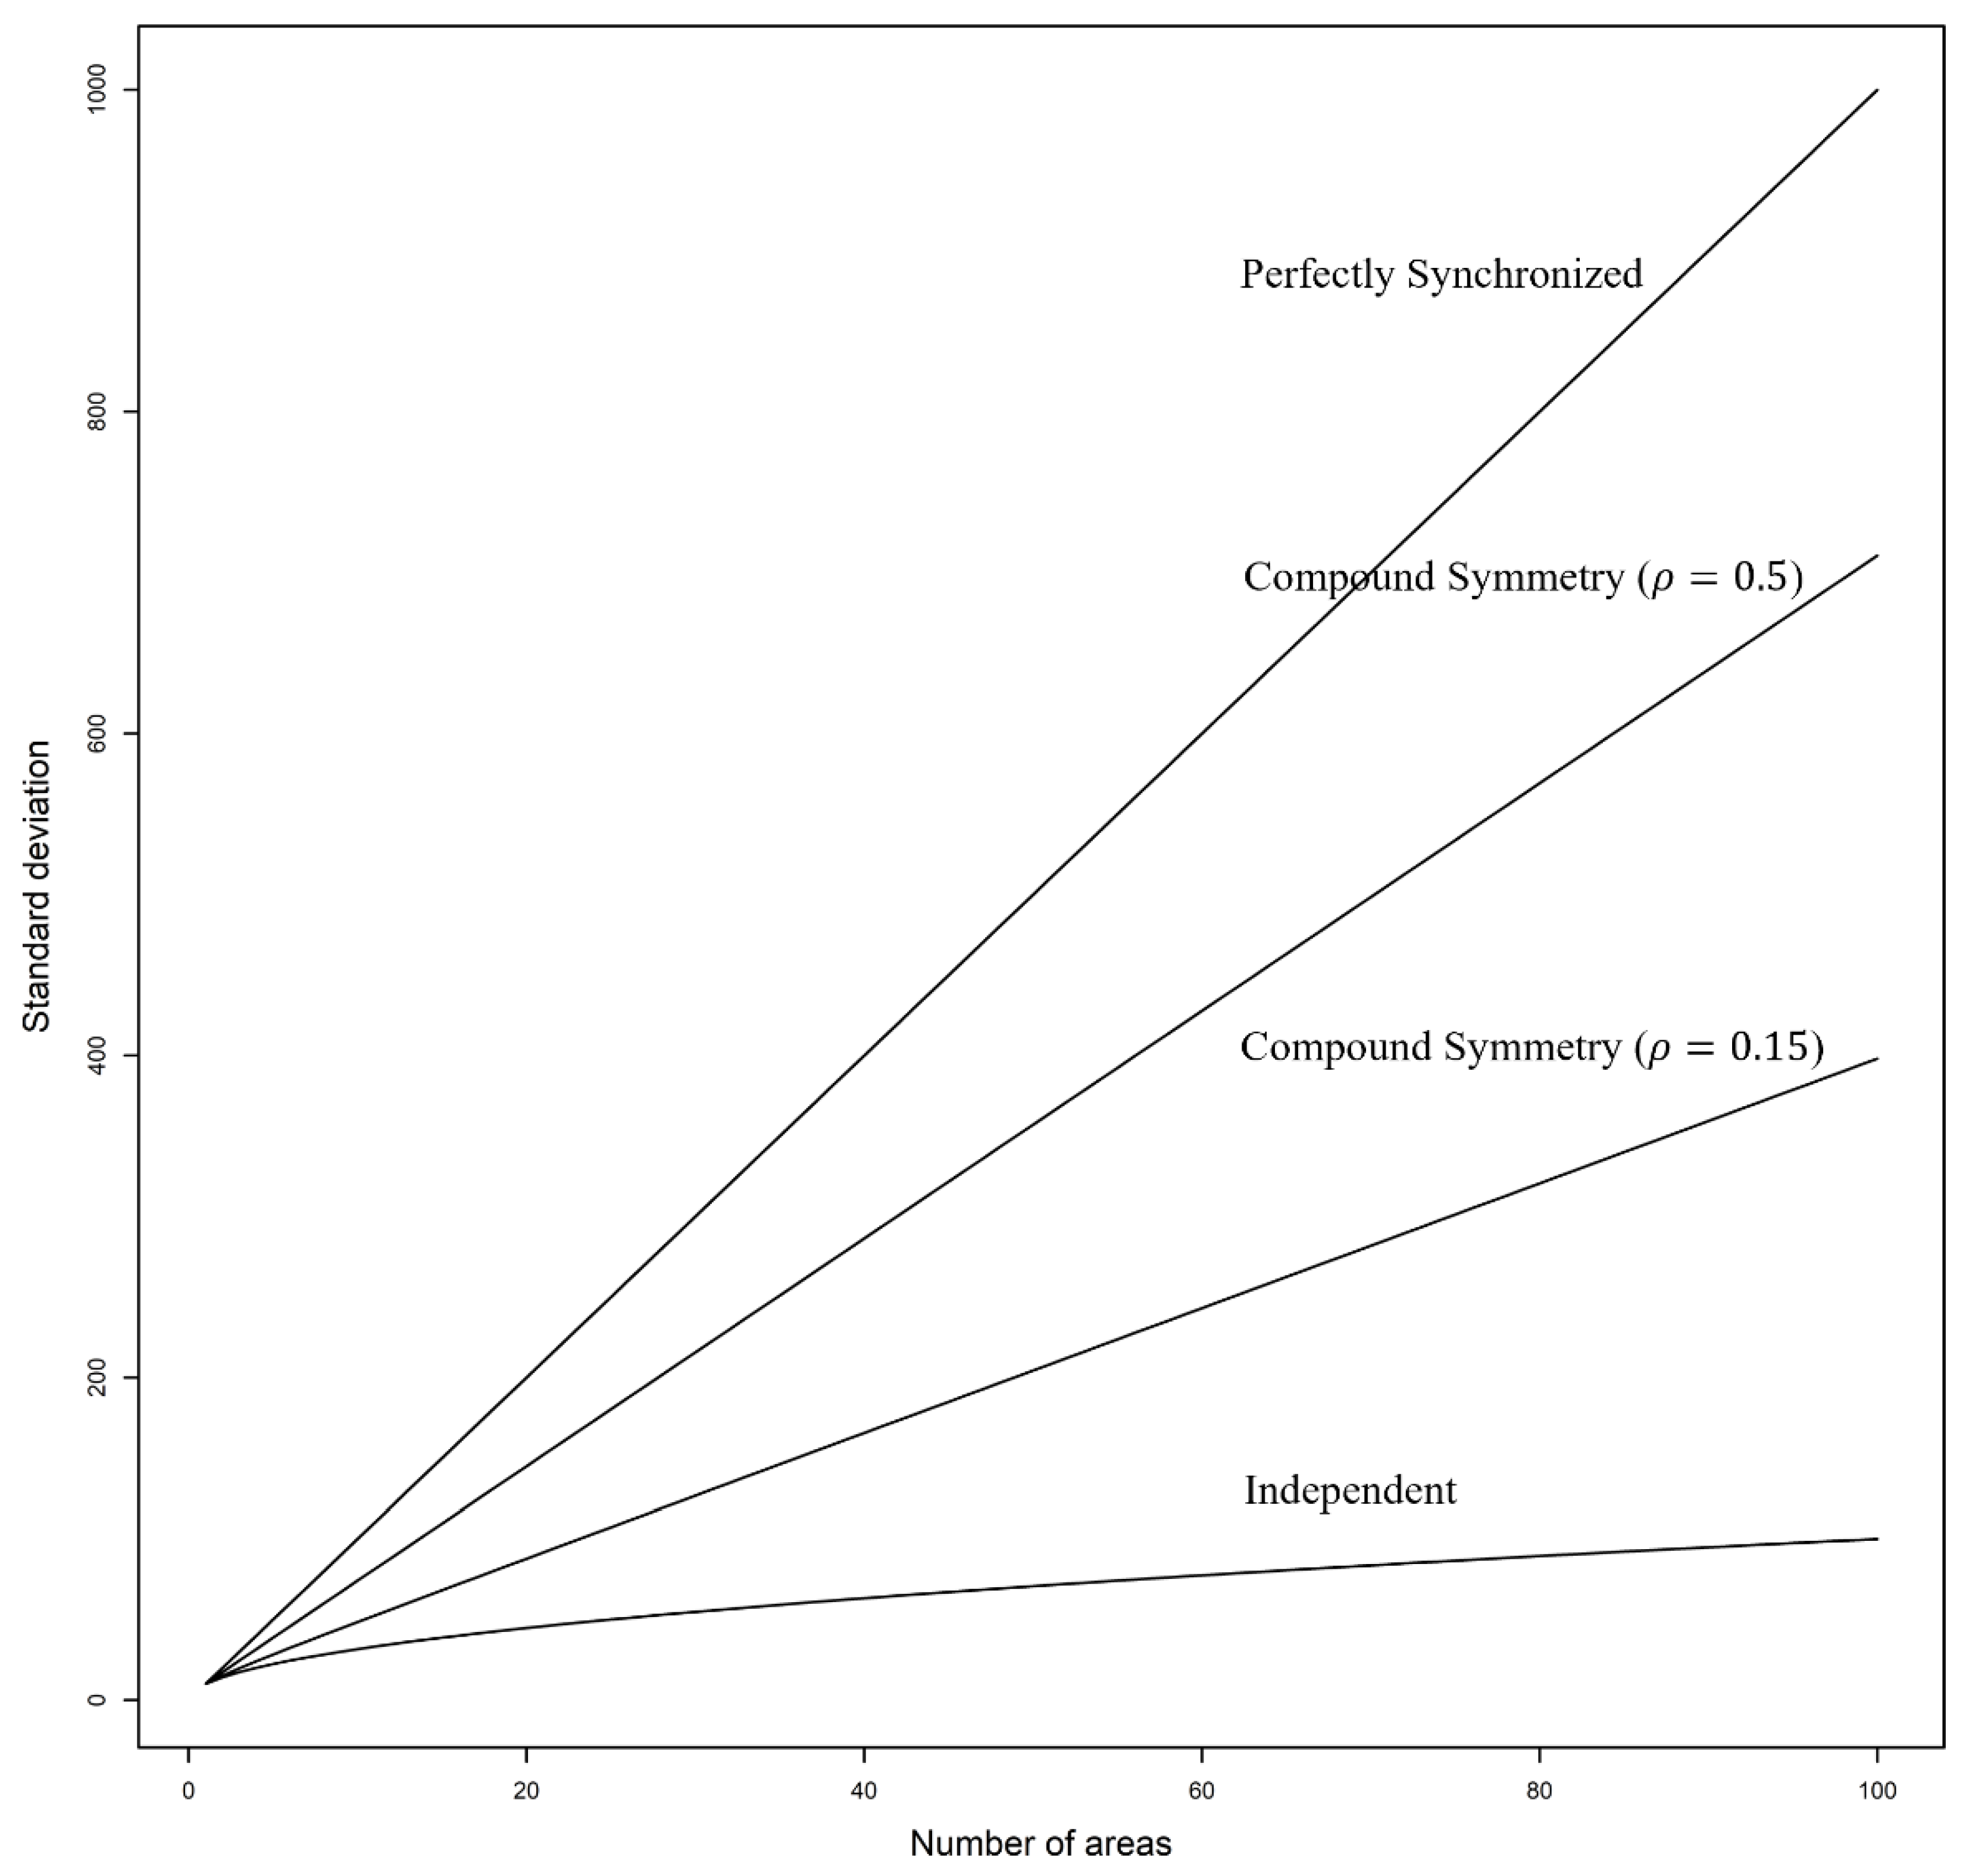
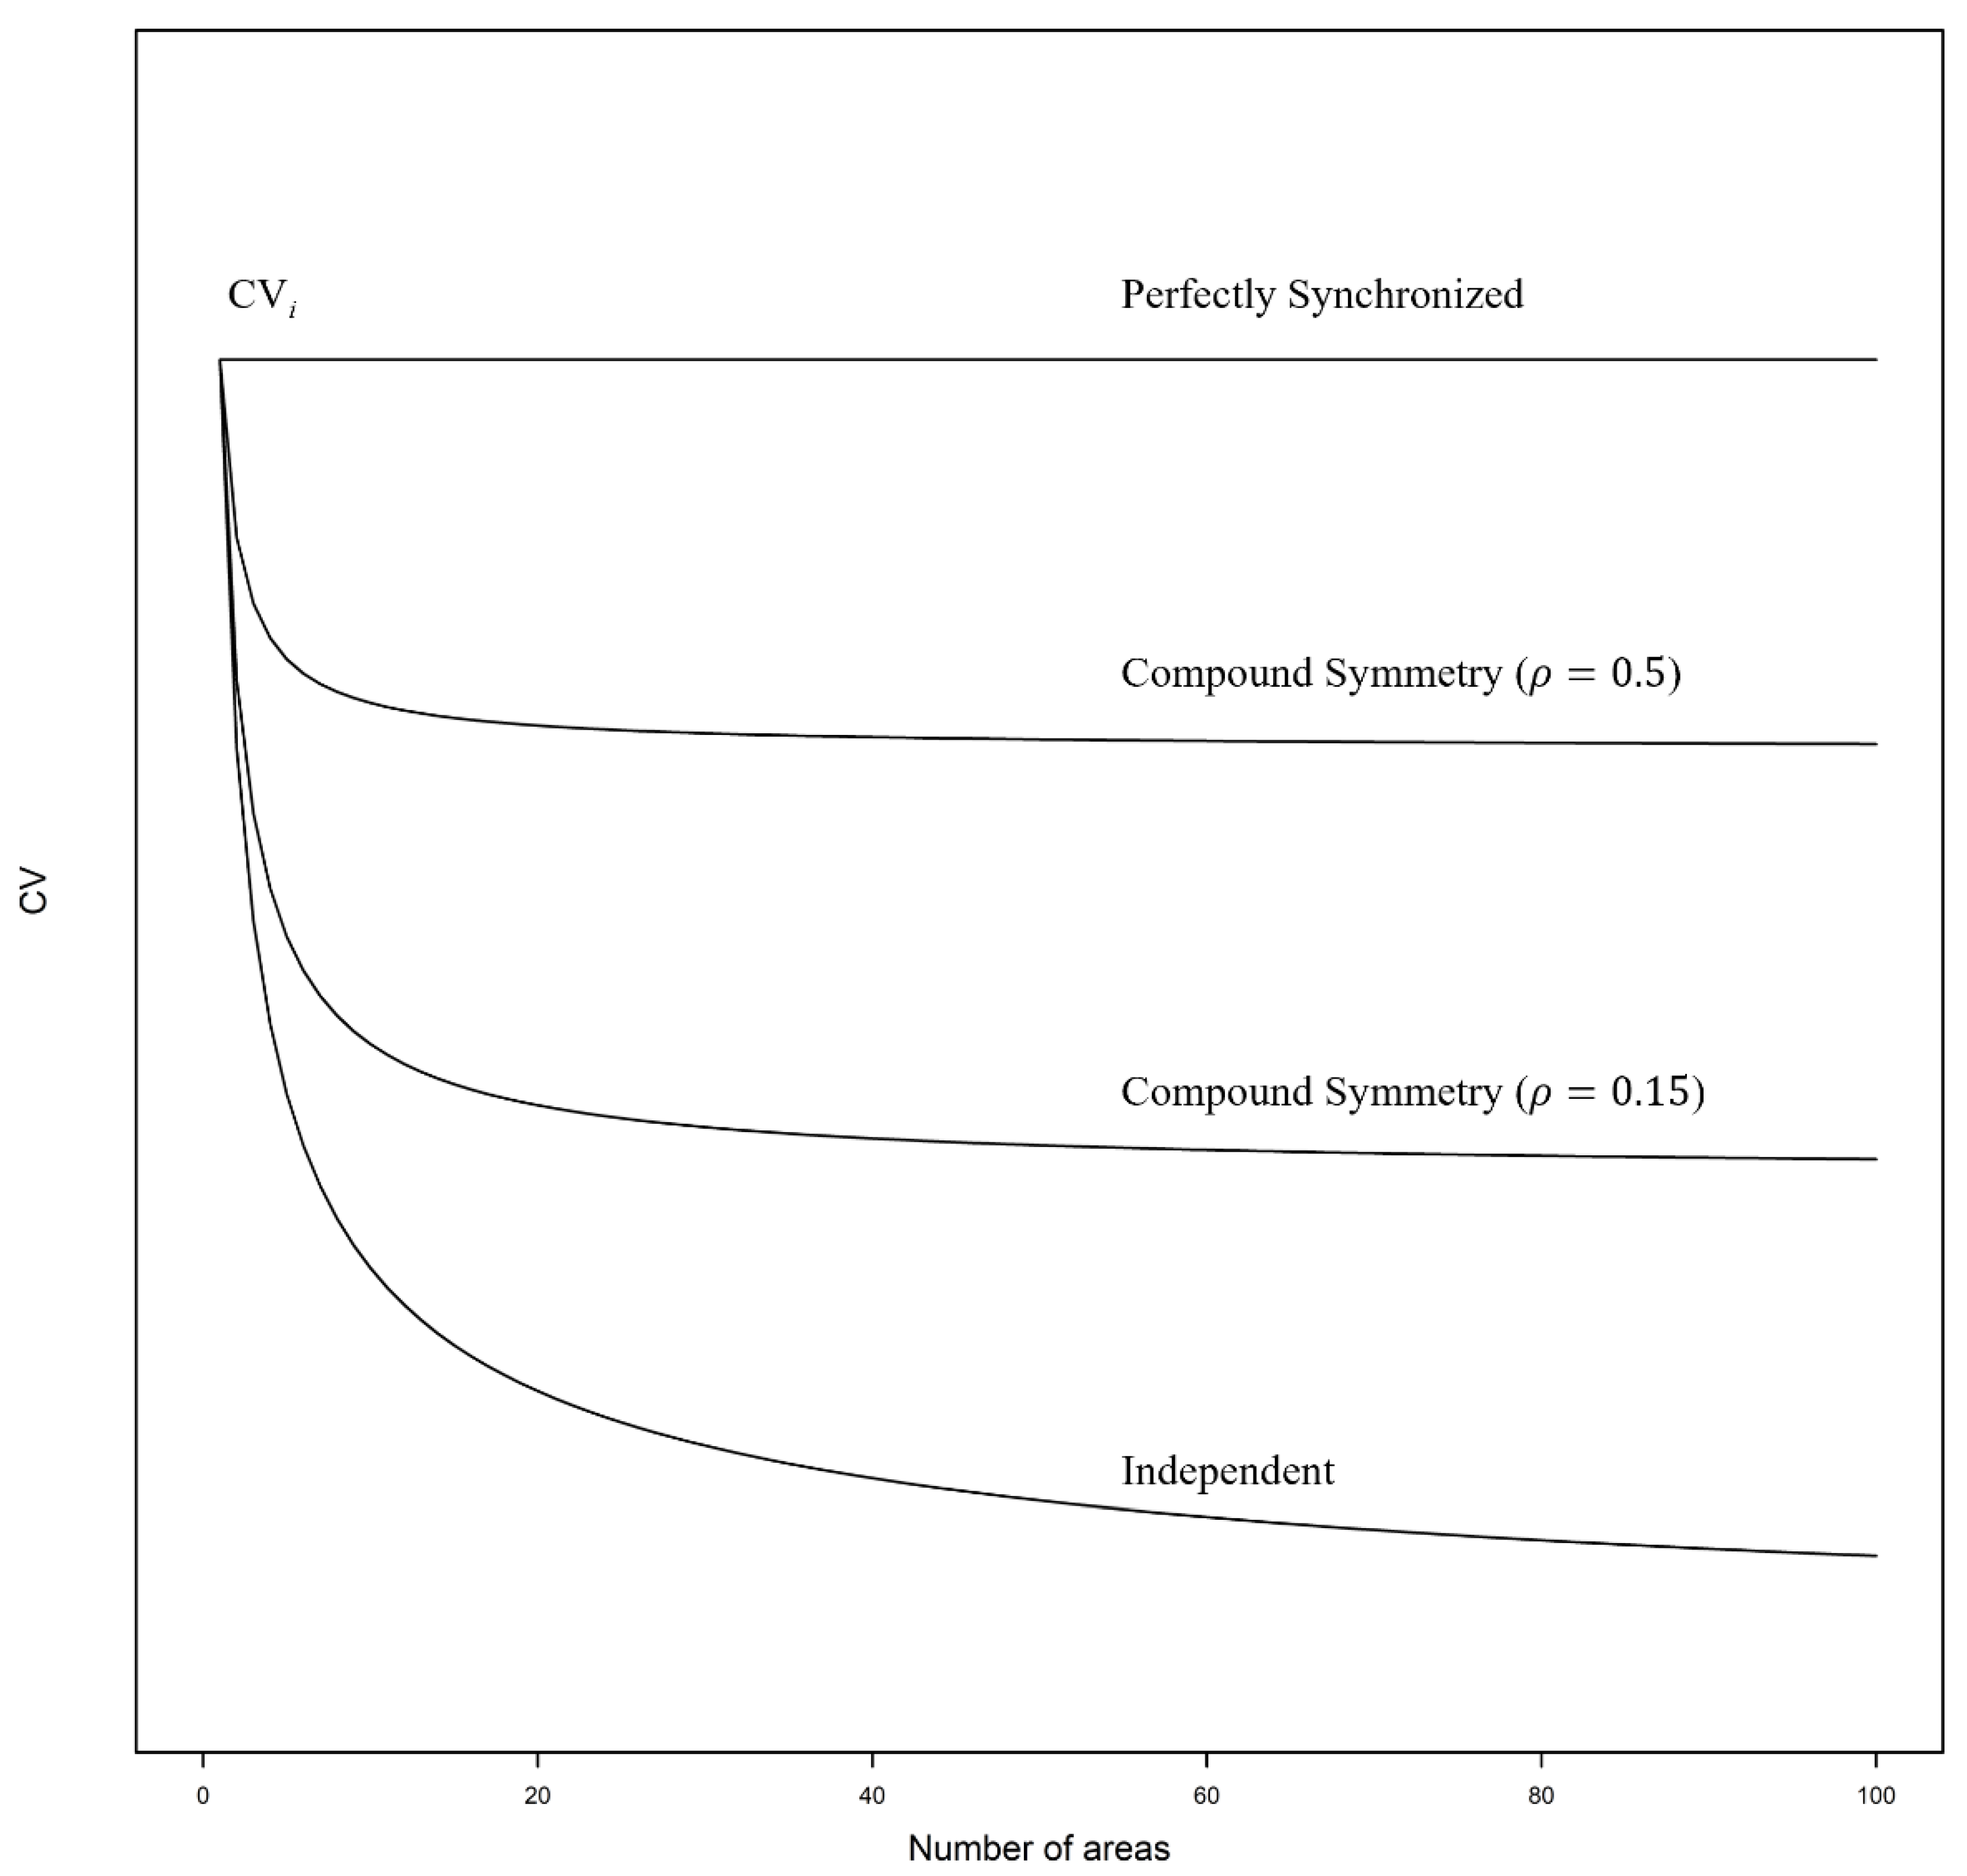
The synchronized variation drives a much faster growth of variability in the estimate of the total bycatch than the independent case, and the effect is more pronounced as we have more individual sources. Assuming that each area has the same fishing effort, and the seabird bycatch rate in each area has a common standard deviation, in the completely synchronized case, the standard deviation of the total bycatch scales linearly with the number of the individual sources, and in the independent case, the standard deviation only scales with the square root of the number of sources. The difference between the two estimates grows steadily with the number of sources (the upper and lower curves in Figure 4) and the difference is substantial when the number of sources is large. For reference, the latest global review of seabird bycatch in longline fisheries compiled estimates from 68 individual sources and still with gaps in some regions and fleets [13]. In terms of the CV, the level of uncertainty of the total seabird bycatch remains constant with respect to the number of sources in the completely synchronized case; for the compound symmetry correlation with an intermediate positive correlation, the CV quickly reaches a finite asymptote; for the independent case, the CV vanishes when the number of sources tends to infinity (Figure 5). These analytical results show that the penalty is large for choosing either the most conservative option (perfectly synchronized) or a wrong correlation structure when the number of individual reports to compile is large. See File S1 for additional details.
4. Discussion and Conclusions
The complex correlation structure among the seabird bycatch rates between the different sources is likely facilitated by underlying biological processes, such as long-distance migration and abundance fluctuations. For example, the Sooty Shearwater (Ardenna grisea), a common bycatch species in longline fisheries [27,28], is one of the most abundant seabird species in the world [29]. In the Pacific, its population conducts trans-equatorial post-breeding migrations during the summer, connecting remote regions in the mid-latitudes of both the Northern and Southern Hemispheres [30]. Even though abundant, its populations are in decline both in its primary breeding ground in the South Pacific and in its wintering grounds [31,32]. Other seabird species, such as the Great Shearwater (Ardenna gravis) and the Short-tailed Shearwater (Ardenna tenuirostris) [33], also undertake trans-equatorial migrations and they are also common fishery bycatch species. Potentially, the population fluctuations of these seabird species synchronized the strong correlation in seabird bycatch rates between areas one and four in both of the scenarios’ analyses. Other highly migratory bycatch species, such as marine mammals and turtles, may present similar issues, further complicating the assessment of the total fishery impact on their population [34].
The factors affecting seabird bycatch estimates are scale dependent. At the local scale, the primary task of a bycatch assessment is to provide an unbiased estimate of the bycatch rate specific to the area. At this level, many of the factors affect the observed bycatch rate, such as differences in foraging behavior due to species identity and season [35,36,37], density effect due to competition [38], and environmental factors [39,40]; and in the case of pelagic longlines, the time of setting is often an important factor [2,16,41,42], and species identity also affects the scaling factor used to recover the unobservable portion of the seabird bycatch [43]. Due to the non-random distribution of seabirds, it is important to standardize the seabird bycatch per unit effort (BPUE), through the use of distance-based random field at a local scale, for example [44]. The adoption of bycatch mitigation measures, for example, streamer lines [45,46], night setting [47], weighted hooks [48], and hook-shielding devices [49], can substantially reduce seabird interactions, and their effect should be considered in BPUE standardization. Meanwhile, because the effect of those mitigation measures often varies substantially between the experimental trials and the actual implementation [50], caution is needed when extrapolating their effect. Once the BPUE has been estimated, those local factors do not further complicate the calculation of the total bycatch at the higher level, because their impact has already been considered. The issue at a higher level is to properly account for the potential synchronous/anti-synchronous variations among the BPUEs from different areas, which can substantially impact on the uncertainty estimation, as shown in this study.
Completely synchronized seabird bycatch rates are likely not a common occurrence, and the scenario analysis provides no support for completely synchronized variation in the Western and Central Pacific. In the scenario analysis, the spatially adjacent areas are found to have either positive or negative correlations with small magnitudes. The weak correlation between the adjacent areas may be due to the relatively low observer coverage in the region. Seabird bycatch is a statistically rare event, and a minimum of 20% observer coverage is recommended for the estimation of bycatch rates of common bycatch species [51]. The current coverage percentage is vastly insufficient, and it will introduce a large amount of sampling variations into the bycatch rate estimates, and, in turn, it will degrade the level of correlation seen in the data. This is a common situation, as currently only three out of 17 regional fisheries management organizations require 100% observer coverage on the fishing vessels [52]. Thus, in most of the cases, we would not expect a completely synchronized variation due to sampling errors alone. Despite the relatively low coverage in the scenario analysis, the absolute observer effort is relatively high, with over 180 million hooks observed. This high effort level enables us to find the correlation structure substantially different from the independence case for this region, and to show that no simplified structures explored in this study can be used as the default case.
Simplified correlation structures failed to capture the interaction of seabird bycatch rates in the scenario analysis. Even though the compound symmetry correlation structure can accommodate both the positive and negative correlations, it cannot replicate the spatially heterogeneous correlation-pattern in the data. Neither can the commonly used distance-based spatial correlation structures replicate the patterns well, due to the presence of strong long-distance synchronized variations and negative correlations. The most common parametric models, such as Matern and exponential covariances [53,54], cannot handle the negative correlations [55]. The spatial correlations can be useful to infer the influence of oceanographical processes at a local scale, where geo-referenced bycatch records are available. This is usually carried out at the individual assessment report level. For example, based on the analysis of a Gaussian random field, gulf stream meanders have been suggested as having an influence on the seabird bycatch rates of the US Atlantic pelagic longline fleet in mid-Atlantic bight [56]. Similarly in the Pacific, the El Niño–Southern Oscillation (ENSO) events can limit prey availability to seabirds in certain areas [57], and drive distributional shifts in the species that cannot persist in low productivity waters [58,59]. At a regional or global level, however, the estimation of a general correlation matrix becomes necessary, due to the inter-connectiveness of seabirds at the global scale.
To assess the fisheries’ impact on the seabird populations on a global scale, the number of individual assessments to synthesize is likely to be in excess of 68, based on longline gear alone [13]. The inclusion of other gear types, such as gillnets [60,61,62,63] and trawls [64], will further increase the number of sources, and highlight the importance of choosing the correct correlation structure. In summary, this study addresses an important issue in uncertainty estimation of the total seabird bycatch on a regional/global scale. Assuming a completely synchronized variation then produces the most conservative uncertainty estimate, however it also misses any opportunity to improve the precision of the estimate when the time series of the bycatch rates is available. It is also dangerous to assume independence even between spatially distant areas, because it would lead to an underestimate of the uncertainty when there is some connectivity between those areas. The issue of both under- and over-estimation due to an invalid assumption is especially acute when the number of individual areas is high. When the time series of the bycatch rates is available, it is recommended to empirically estimate the correlation of the bycatch rates between each pair of sources, instead of relying on some unwarranted assumptions.
Supplementary Materials
The following supporting information can be downloaded at: https://www.mdpi.com/article/10.3390/birds3030017/s1, File S1: Further technical details on methods and additional results.
Author Contributions
Conceptualization, C.Z.; methodology, C.Z.; software, C.Z.; validation, C.Z. and B.L.; formal analysis, C.Z. and B.L.; investigation, C.Z. and B.L.; resources, C.Z. and B.L.; data curation, C.Z.; writing—original draft preparation, C.Z.; writing—review and editing, C.Z. and B.L.; visualization, C.Z.; supervision, C.Z. and B.L.; project administration, C.Z. and B.L.; funding acquisition, B.L. All authors have read and agreed to the published version of the manuscript.
Funding
This research was supported in part by Joint Funds of the National Natural Science Foundation of China (grant number U1806202).
Institutional Review Board Statement
Not applicable.
Data Availability Statement
All the data analyzed in this study were published as public domain information by the Western and Central Pacific Fisheries Commission (WCPFC). The aggregate catch data was accessed from https://www.wcpfc.int/public-domain, accessed on 1 June 2022, and the observed bycatch data was accessed from https://www.wcpfc.int/public-domain-bycatch, accessed on 1 June 2022.
Acknowledgments
We would like to thank the academic editor and two anonymous reviewers for their valuable input on the previous version of this manuscript.
Conflicts of Interest
The funders had no role in the design of the study; in the collection, analyses, or interpretation of data; in the writing of the manuscript; or in the decision to publish the results.
Appendix A

Table A1.
Parameter estimates of the model with an independent correlation structure in scenario 1. Areas 1 through 4 are latitude bands in the Western and Central Pacific as configured in the left panel of Figure 2 in the main text.
Table A1.
Parameter estimates of the model with an independent correlation structure in scenario 1. Areas 1 through 4 are latitude bands in the Western and Central Pacific as configured in the left panel of Figure 2 in the main text.
| Estimate | Standard Error | t-Value | p-Value | |
|---|---|---|---|---|
| Coefficient | ||||
| 0.10 | 0.049 | 2.13 | 0.042 | |
| 0.0022 | 0.00042 | 5.28 | <0.0001 | |
| 0.0022 | 0.00054 | 4.03 | 0.0004 | |
| 0.062 | 0.015 | 4.20 | 0.0002 | |
| Residual standard error | 0.14 | - | - | - |
| Variance structure | ||||
| area 1 | 1 | |||
| area 2 | 0.0085 | |||
| area 3 | 0.011 | |||
| area 4 | 0.3 |
Table A2.
Parameter estimates of the model with a compound symmetry correlation structure in scenario 1. Areas 1 through 4 are latitude bands in the Western and Central Pacific as configured in the left panel of Figure 2 in the main text.
Table A2.
Parameter estimates of the model with a compound symmetry correlation structure in scenario 1. Areas 1 through 4 are latitude bands in the Western and Central Pacific as configured in the left panel of Figure 2 in the main text.
| Estimate | Standard Error | t-Value | p-Value | |
|---|---|---|---|---|
| Coefficient | ||||
| 0.10 | 0.048 | 2.18 | 0.038 | |
| 0.0022 | 0.00044 | 5.00 | <0.0001 | |
| 0.0022 | 0.00053 | 4.90 | 0.0003 | |
| 0.062 | 0.015 | 4.25 | 0.0002 | |
| Residual standard error | 0.14 | - | - | - |
| Variance structure | ||||
| area 1 | 1 | |||
| area 2 | 0.0092 | |||
| area 3 | 0.011 | |||
| area 4 | 0.3 | |||
| Correlation structure | ||||
| 0.15 |
Table A3.
Parameter estimates of the model with an independent correlation structure in scenario 2. Areas 1 through 4 are latitude bands in the Western and Central Pacific as configured in the right panel of Figure 2 in the main text.
Table A3.
Parameter estimates of the model with an independent correlation structure in scenario 2. Areas 1 through 4 are latitude bands in the Western and Central Pacific as configured in the right panel of Figure 2 in the main text.
| Estimate | Standard Error | t-Value | p-Value | |
|---|---|---|---|---|
| Coefficient | ||||
| 0.027 | 0.012 | 2.24 | 0.033 | |
| 0.0022 | 0.00054 | 4.03 | 0.0004 | |
| 0.033 | 0.033 | 9.81 | <0.0001 | |
| 0.11 | 0.031 | 3.44 | 0.0019 | |
| Residual standard error | 0.034 | - | - | - |
| Variance structure | ||||
| area 1 | 1 | |||
| area 2 | 0.044 | |||
| area 3 | 0.28 | |||
| area 4 | 2.55 |
Table A4.
Parameter estimates of the model with a compound symmetry correlation structure in scenario 2. Areas 1 through 4 are latitude bands in the Western and Central Pacific as configured in the right panel of Figure 2 in the main text.
Table A4.
Parameter estimates of the model with a compound symmetry correlation structure in scenario 2. Areas 1 through 4 are latitude bands in the Western and Central Pacific as configured in the right panel of Figure 2 in the main text.
| Estimate | Standard Error | t-Value | p-Value | |
|---|---|---|---|---|
| Coefficient | ||||
| 0.027 | 0.011 | 2.36 | 0.025 | |
| 0.0022 | 0.00063 | 3.47 | 0.0017 | |
| 0.033 | 0.0033 | 10.04 | <0.0001 | |
| 0.11 | 0.029 | 3.62 | 0.0012 | |
| Residual standard error | 0.033 | - | - | - |
| Variance structure | ||||
| area 1 | 1 | |||
| area 2 | 0.054 | |||
| area 3 | 0.28 | |||
| area 4 | 2.54 | |||
| Correlation structure | ||||
| 0.49 |
References
- Komoroske, L.M.; Lewison, R.L. Addressing fisheries bycatch in a changing world. Front. Mar. Sci. 2015, 2, 83. [Google Scholar] [CrossRef] [Green Version]
- Brothers, N. Albatross mortality and associated bait loss in the Japanese longline fishery in the Southern Ocean. Biol. Conserv. 1991, 55, 255–268. [Google Scholar] [CrossRef]
- Croxall, J.P.; Butchart, S.H.M.; Lascelles, B.; Stattersfield, A.J.; Sullivan, B.; Symes, A.; Taylor, P. Seabird conservation status, threats and priority actions: A global assessment. Bird Conserv. Int. 2012, 22, 1–34. [Google Scholar] [CrossRef] [Green Version]
- Dayton, P.K.; Thrush, S.; Coleman, F.C. Ecological Effects of Fishing in Marine Ecosystems of the United States; Pew Oceans Commission: Arlington, VA, USA, 2002. [Google Scholar]
- Dias, M.P.; Martin, R.; Pearmain, E.J.; Burfield, I.J.; Small, C.; Phillips, R.A.; Yates, O.; Lascelles, B.; Borboroglu, P.G.; Croxall, J.P. Threats to seabirds: A global assessment. Biol. Conserv. 2019, 237, 525–537. [Google Scholar] [CrossRef]
- Wiedenfeld, D.A.; Iudicello, S.; Atkins, N.; Bricklemyer, E.C.; Gentner, B.; Johnson, A. Analysis of Seabird Bycatch in Fisheries Selling Seafood in the U.S. Market; American Bird Conservancy: The Plains, VA, USA, 2012; p. 135. [Google Scholar]
- Beal, M.; Dias, M.P.; Phillips, R.A.; Oppel, S.; Hazin, C.; Pearmain, E.J.; Adams, J.; Anderson, D.J.; Antolos, M.; Arata, J.A.; et al. Global political responsibility for the conservation of albatrosses and large petrels. Sci. Adv. 2021, 7, eabd7225. [Google Scholar] [CrossRef] [PubMed]
- Ashmole, N.P. Seabird ecology and the marine environment. Avian Biol. 1971, 1, 223–286. [Google Scholar]
- Newton, I. The Migration Ecology of Birds; Elsevier: Amsterdam, The Netherlands, 2010. [Google Scholar]
- Robertson, C.; Bell, E.; Sinclair, N.; Bell, B. Distribution of seabirds from New Zealand that overlap with fisheries worldwide. Sci. Conserv. 2003, 233, 102. [Google Scholar]
- Clay, T.A.; Small, C.; Tuck, G.N.; Pardo, D.; Carneiro, A.P.B.; Wood, A.G.; Croxall, J.P.; Crossin, G.T.; Phillips, R.A. A comprehensive large-scale assessment of fisheries bycatch risk to threatened seabird populations. J. Appl. Ecol. 2019, 56, 1882–1893. [Google Scholar] [CrossRef] [Green Version]
- Torres, L.G.; Sagar, P.M.; Thompson, D.R.; Phillips, R.A. Scaling down the analysis of seabird-fishery interactions. Mar. Ecol. Prog. Ser. 2013, 473, 275–289. [Google Scholar] [CrossRef] [Green Version]
- Anderson, O.R.J.; Small, C.J.; Croxall, J.P.; Dunn, E.K.; Sullivan, B.J.; Yates, O.; Black, A. Global seabird bycatch in longline fisheries. Endanger. Species Res. 2011, 14, 91–106. [Google Scholar] [CrossRef] [Green Version]
- Zhou, C.; Rujia, B.; Jiao, Y. Estimated Seabird Bycatch in the U.S. Atlantic Pelagic Longine Fishery during 1992–2017 Based on Observer and Logbook Data; Virginia Polytechnic Institute and State University: Blacksburg, VA, USA, 2018. [Google Scholar] [CrossRef]
- Pan, B.; Zhu, J.; Lin, Q.; Geng, Z.; Wu, F.; Zhang, Y. Study on the catch, bycatch and discard of Chinese pelagic longline fisheries in the Atlantic Ocean. Aquac. Fish. 2022, in press. [CrossRef]
- Belda, E.; Sánchez, A. Seabird mortality on longline fisheries in the western Mediterranean: Factors affecting bycatch and proposed mitigating measures. Biol. Conserv. 2001, 98, 357–363. [Google Scholar] [CrossRef]
- Marchowski, D. Bycatch of Seabirds in the Polish Part of the Southern Baltic Sea in 1970–2018: A Review. Acta Ornithol. 2022, 56, 139–158. [Google Scholar] [CrossRef]
- Benaka, L.R.; Dobrzynski, T.J. The national marine fisheries service’s national bycatch strategy. Mar. Fish. Rev. 2004, 66, 1–8. [Google Scholar]
- Filippi, D.; Waugh, S.; Nicol, S. Revised Spatial Risk Indicators for Seabird Interactions with Longline Fisheries in the Western and Central Pacific; Paper EB-IP-01 2010; Western and Central Pacific Fisheries Commission, Scientific Committee: Kolonia, Pohnpei, Federated States of Micronesia, 2010. [Google Scholar]
- IUCN. The IUCN Red List of Threatened Species. Version 2020-2. Available online: http://www.iucnredlist.org (accessed on 9 July 2020).
- Anonymous. Conservation and Management Measure to Mitigate the Impact of Fishing for Highly Migratory Fish Stocks on Seabirds; Conservation and Management Measure 2018-03; Western and Central Pacific Fisheries Commission, Scientific Committee: Kolonia, Pohnpei, Federated States of Micronesia, 2018. [Google Scholar]
- Pinheiro, J.; Bates, D. Mixed-Effects Models in S and S-PLUS; Springer Science & Business Media: Berlin/Heidelberg, Germany, 2006. [Google Scholar]
- R Core Team. R: A Language and Environment for Statistical Computing, R Foundation for Statistical Computing: Vienna, Austria, 2020; European Environment Agency: Copenhagen, Denmark, 2020. [Google Scholar]
- Pinheiro, J.; Bates, D.; DebRoy, S.; Sarkar, D.; R Core Team. nlme: Linear and Nonlinear Mixed Effects Models; RStudio: Boston, MA, USA, 2021. [Google Scholar]
- Akaike, H. Information Theory and an Extension of the Maximum Likelihood Principle. In Selected Papers of Hirotugu Akaike; Parzen, E., Tanabe, K., Kitagawa, G., Eds.; Springer Series in Statistics; Springer: New York, NY, USA, 1998; pp. 199–213. [Google Scholar]
- Burnham, K.P.; Anderson, D.R. Model Selection and Multimodel Inference: A Practical Information-Theoretic Approach; Springer: Berlin/Heidelberg, Germany, 2002; p. 2. [Google Scholar]
- Zhou, C.; Brothers, N. Seabird bycatch vulnerability in pelagic longline fisheries based on modelling of a long-term dataset. Bird Conserv. Int. 2021, 32, 259–274. [Google Scholar] [CrossRef]
- Brothers, N. How Accurate are Observer Reported Kills of Albatrosses on Longlines? Duke University and Blue Ocean Institute: Durham, NC, USA, 2008. [Google Scholar]
- Brooke, M. Albatrosses and Petrels Across the World; Oxford University Press: Oxford, UK, 2004. [Google Scholar]
- Shaffer, S.A.; Tremblay, Y.; Weimerskirch, H.; Scott, D.; Thompson, D.R.; Sagar, P.M.; Moller, H.; Taylor, G.A.; Foley, D.G.; Block, B.A.; et al. Migratory shearwaters integrate oceanic resources across the Pacific Ocean in an endless summer. Proc. Natl. Acad. Sci. USA 2006, 103, 12799–12802. [Google Scholar] [CrossRef] [Green Version]
- Scott, D.; Scofield, P.; Hunter, C.; Fletcher, D. Decline of Sooty Shearwaters, Puffinus griseus, on The Snares, New Zealand. Pap. Proc. R. Soc. Tasman. 2008, 142, 185–196. [Google Scholar]
- Möller, H.; Fletcher, D.; Johnson, P.N.; Bell, B.D.; Flack, D.; Bragg, C.; Scott, D.; Newman, J.; McKechnie, S.; Lyver, P.O. Changes in sooty shearwater (Puffinus griseus) abundance and harvesting on the Rakiura Titi Islands. N. Z. J. Zoöl. 2009, 36, 325–341. [Google Scholar] [CrossRef]
- Bonnet-Lebrun, A.-S.; Dias, M.P.; Phillips, R.A.; Granadeiro, J.P.; Brooke, M.d.L.; Chastel, O.; Clay, T.A.; Fayet, A.L.; Gilg, O.; González-Solís, J.; et al. Seabird Migration Strategies: Flight Budgets, Diel Activity Patterns, and Lunar Influence. Front. Mar. Sci. 2021, 8, 683071. [Google Scholar] [CrossRef]
- Lynch, P.D.; Graves, J.E.; Latour, R.J. Challenges in the assessment and management of highly migratory bycatch species: A case study of the Atlantic marlins. In Sustainable Fisheries: Multilevel Approaches to a Global Problem; American Fisheries Society: Bethesda, MD, USA, 2011; pp. 197–226. [Google Scholar]
- Zhou, C.; Jiao, Y.; Browder, J. Seabird bycatch vulnerability to pelagic longline fisheries: Ecological traits matter. Aquat. Conserv. Mar. Freshw. Ecosyst. 2019, 29, 1324–1335. [Google Scholar] [CrossRef]
- Bentley, L.K.; Kato, A.; Ropert-Coudert, Y.; Manica, A.; Phillips, R.A. Diving behaviour of albatrosses: Implications for foraging ecology and bycatch susceptibility. Mar. Biol. 2021, 168, 36. [Google Scholar] [CrossRef]
- Bonnet-Lebrun, A.; Catry, P.; Clark, T.; Campioni, L.; Kuepfer, A.; Tierny, M.; Kilbride, E.; Wakefield, E. Habitat preferences, foraging behaviour and bycatch risk among breeding sooty shearwaters Ardenna grisea in the Southwest Atlantic. Mar. Ecol. Prog. Ser. 2020, 651, 163–181. [Google Scholar] [CrossRef]
- Zhou, C.; Brothers, N. Interaction frequency of seabirds with longline fisheries: Risk factors and implications for management. ICES J. Mar. Sci. 2021, 78, 1278–1287. [Google Scholar] [CrossRef]
- Barbraud, C.; Rolland, V.; Jenouvrier, S.; Nevoux, M.; Delord, K.; Weimerskirch, H. Effects of climate change and fisheries bycatch on Southern Ocean seabirds: A review. Mar. Ecol. Prog. Ser. 2012, 454, 285–307. [Google Scholar] [CrossRef] [Green Version]
- Trebilco, R.; Gales, R.; Lawrence, E.; Alderman, R.; Robertson, G.; Baker, G.B. Characterizing seabird bycatch in the eastern Australian tuna and billfish pelagic longline fishery in relation to temporal, spatial and biological influences. Aquat. Conserv. Mar. Freshw. Ecosyst. 2010, 20, 531–542. [Google Scholar] [CrossRef]
- Cherel, Y.; Weimerskirch, H.; Duhamel, G. Interactions between longline vessels and seabirds in Kerguelen waters and a method to reduce seabird mortality. Biol. Conserv. 1996, 75, 63–70. [Google Scholar] [CrossRef]
- Murray, T.E.; Bartle, J.A.; Kalish, S.R.; Taylor, P.R. Incidental Capture of seabirds by Japanese southern bluefin tuna longline vessels in New Zealand waters, 1988-1992. Bird Conserv. Int. 1993, 3, 181–210. [Google Scholar] [CrossRef] [Green Version]
- Zhou, C.; Brothers, N.; Browder, J.; Jiao, Y. Seabird bycatch loss rate variability in pelagic longline fisheries. Biol. Conserv. 2020, 247, 108590. [Google Scholar] [CrossRef]
- Bi, R.; Jiao, Y.; Browder, J.A. Climate driven spatiotemporal variations in seabird bycatch hotspots and implications for seabird bycatch mitigation. Sci. Rep. 2021, 11, 20704. [Google Scholar] [CrossRef]
- Dietrich, K.S.; Melvin, E.F.; Conquest, L. Integrated weight longlines with paired streamer lines—Best practice to prevent seabird bycatch in demersal longline fisheries. Biol. Conserv. 2008, 141, 1793–1805. [Google Scholar] [CrossRef]
- Melvin, E.F.; Guy, T.J.; Read, L.B. Reducing seabird bycatch in the South African joint venture tuna fishery using bird-scaring lines, branch line weighting and nighttime setting of hooks. Fish. Res. 2013, 147, 72–82. [Google Scholar] [CrossRef]
- Jiménez, S.; Domingo, A.; Winker, H.; Parker, D.; Gianuca, D.; Neves, T.; Coelho, R.; Kerwath, S. Towards mitigation of seabird bycatch: Large-scale effectiveness of night setting and Tori lines across multiple pelagic longline fleets. Biol. Conserv. 2020, 247, 108642. [Google Scholar] [CrossRef]
- Santos, R.C.; Silva-Costa, A.; Sant’Ana, R.; Gianuca, D.; Yates, O.; Marques, C.; Neves, T. Improved line weighting reduces seabird bycatch without affecting fish catch in the Brazilian pelagic longline fishery. Aquat. Conserv. Mar. Freshw. Ecosyst. 2019, 29, 442–449. [Google Scholar] [CrossRef]
- Sullivan, B.; Kibel, B.; Kibel, P.; Yates, O.; Potts, J.; Ingham, B.; Domingo, A.; Gianuca, D.; Jiménez, S.; Lebepe, B. At-sea trailing of the Hookpod: A ‘one-stop’ mitigation solution for seabird bycatch in pelagic longline fisheries. Anim. Conserv. 2018, 21, 159–167. [Google Scholar] [CrossRef] [Green Version]
- Cox, T.M.; Lewison, R.L.; Žydelis, R.; Crowder, L.B.; Safina, C.; Read, A.J. Comparing Effectiveness of Experimental and Implemented Bycatch Reduction Measures: The Ideal and the Real. Conserv. Biol. 2007, 21, 1155–1164. [Google Scholar] [CrossRef]
- Babcock, E.; Pikitch, E.K.; Hudson, C.G. How Much Observer Coverage is Enough to Adequately Estimate Bycatch? Pew Institute for Ocean Science, Rosenstiel School of Marine and Atmospheric Science, University of Miami: Miami, FL, USA, 2003. [Google Scholar]
- Ewell, C.; Hocevar, J.; Mitchell, E.; Snowden, S.; Jacquet, J. An evaluation of Regional Fisheries Management Organization at-sea compliance monitoring and observer programs. Mar. Policy 2020, 115, 103842. [Google Scholar] [CrossRef]
- Gelfand, A.E.; Diggle, P.; Guttorp, P.; Fuentes, M. Handbook of Spatial Statistics; CRC Press: Boca Raton, FL, USA, 2010. [Google Scholar]
- Lindgren, F.; Rue, H. Bayesian Spatial Modelling with R-INLA. J. Stat. Softw. 2015, 63, 1–25. [Google Scholar] [CrossRef] [Green Version]
- Choi, I. Modeling Spatial Covariance Functions; Purdue University: West Lafayette, IN, USA, 2016. [Google Scholar]
- Bi, R.; Jiao, Y.; Bakka, H.; Browder, J.A. Long-term climate ocean oscillations inform seabird bycatch from pelagic longline fishery. ICES J. Mar. Sci. 2020, 77, 668–679. [Google Scholar] [CrossRef]
- Ancona, S.; Calixto-Albarrán, I.; Drummond, H. Effect of El Niño on the diet of a specialist seabird, Sula nebouxii, in the warm eastern tropical Pacific. Mar. Ecol. Prog. Ser. 2012, 462, 261–271. [Google Scholar] [CrossRef] [Green Version]
- Christine, A.R.; David, G.A.; Larry, B.S. Scale-related seabird-environmental relationships in Pacific equatorial waters, with reference to El Niño-Southern Oscillation events. Mar. Ecol. Prog. Ser. 1997, 156, 183–203. [Google Scholar]
- Tershy, B.R.; Breese, D.; Alvarez-Borrego, S. Increase in cetacean and seabird numbers in the Canal de Ballenas during an El Niño-Southern Oscillation event. Mar. Ecol. Prog. Ser. 1991, 69, 299–302. [Google Scholar] [CrossRef]
- Morkūnas, J.; Oppel, S.; Bružas, M.; Rouxel, Y.; Morkūnė, R.; Mitchell, D. Seabird bycatch in a Baltic coastal gillnet fishery is orders of magnitude larger than official reports. Avian Conserv. Ecol. 2022, 17, 31. [Google Scholar] [CrossRef]
- Sonntag, N.; Schwemmer, H.; Fock, H.O.; Bellebaum, J.; Garthe, S. Seabirds, set-nets, and conservation management: Assessment of conflict potential and vulnerability of birds to bycatch in gillnets. ICES J. Mar. Sci. 2012, 69, 578–589. [Google Scholar] [CrossRef] [Green Version]
- Žydelis, R.; Bellebaum, J.; Österblom, H.; Vetemaa, M.; Schirmeister, B.; Stipniece, A.; Dagys, M.; van Eerden, M.; Garthe, S. Bycatch in gillnet fisheries—An overlooked threat to waterbird populations. Biol. Conserv. 2009, 142, 1269–1281. [Google Scholar] [CrossRef]
- Žydelis, R.; Small, C.; French, G. The incidental catch of seabirds in gillnet fisheries: A global review. Biol. Conserv. 2013, 162, 76–88. [Google Scholar] [CrossRef]
- Croxall, J.P. Seabird mortality and trawl fisheries. Anim. Conserv. 2008, 11, 255–256. [Google Scholar] [CrossRef]
Figure 1.
Abundance and distributional changes in seabird population (blue ovals) can lead to synchronized (left) and counter-balanced variation (right) in bycatch rate between two areas. Left: Fluctuating abundance and/or shrinkage and expansion of seabird populations synchronize positive correlation in the availability of seabirds to incidental capture between two areas; Right: Holding the population abundance constant, shifts in the distribution produce negatively correlated bycatch rates between two areas. In both examples, it is assumed that the fishing effort is distributed uniformly in each area. Variation in the distribution of fishing effort introduce additional variation to the bycatch rate.
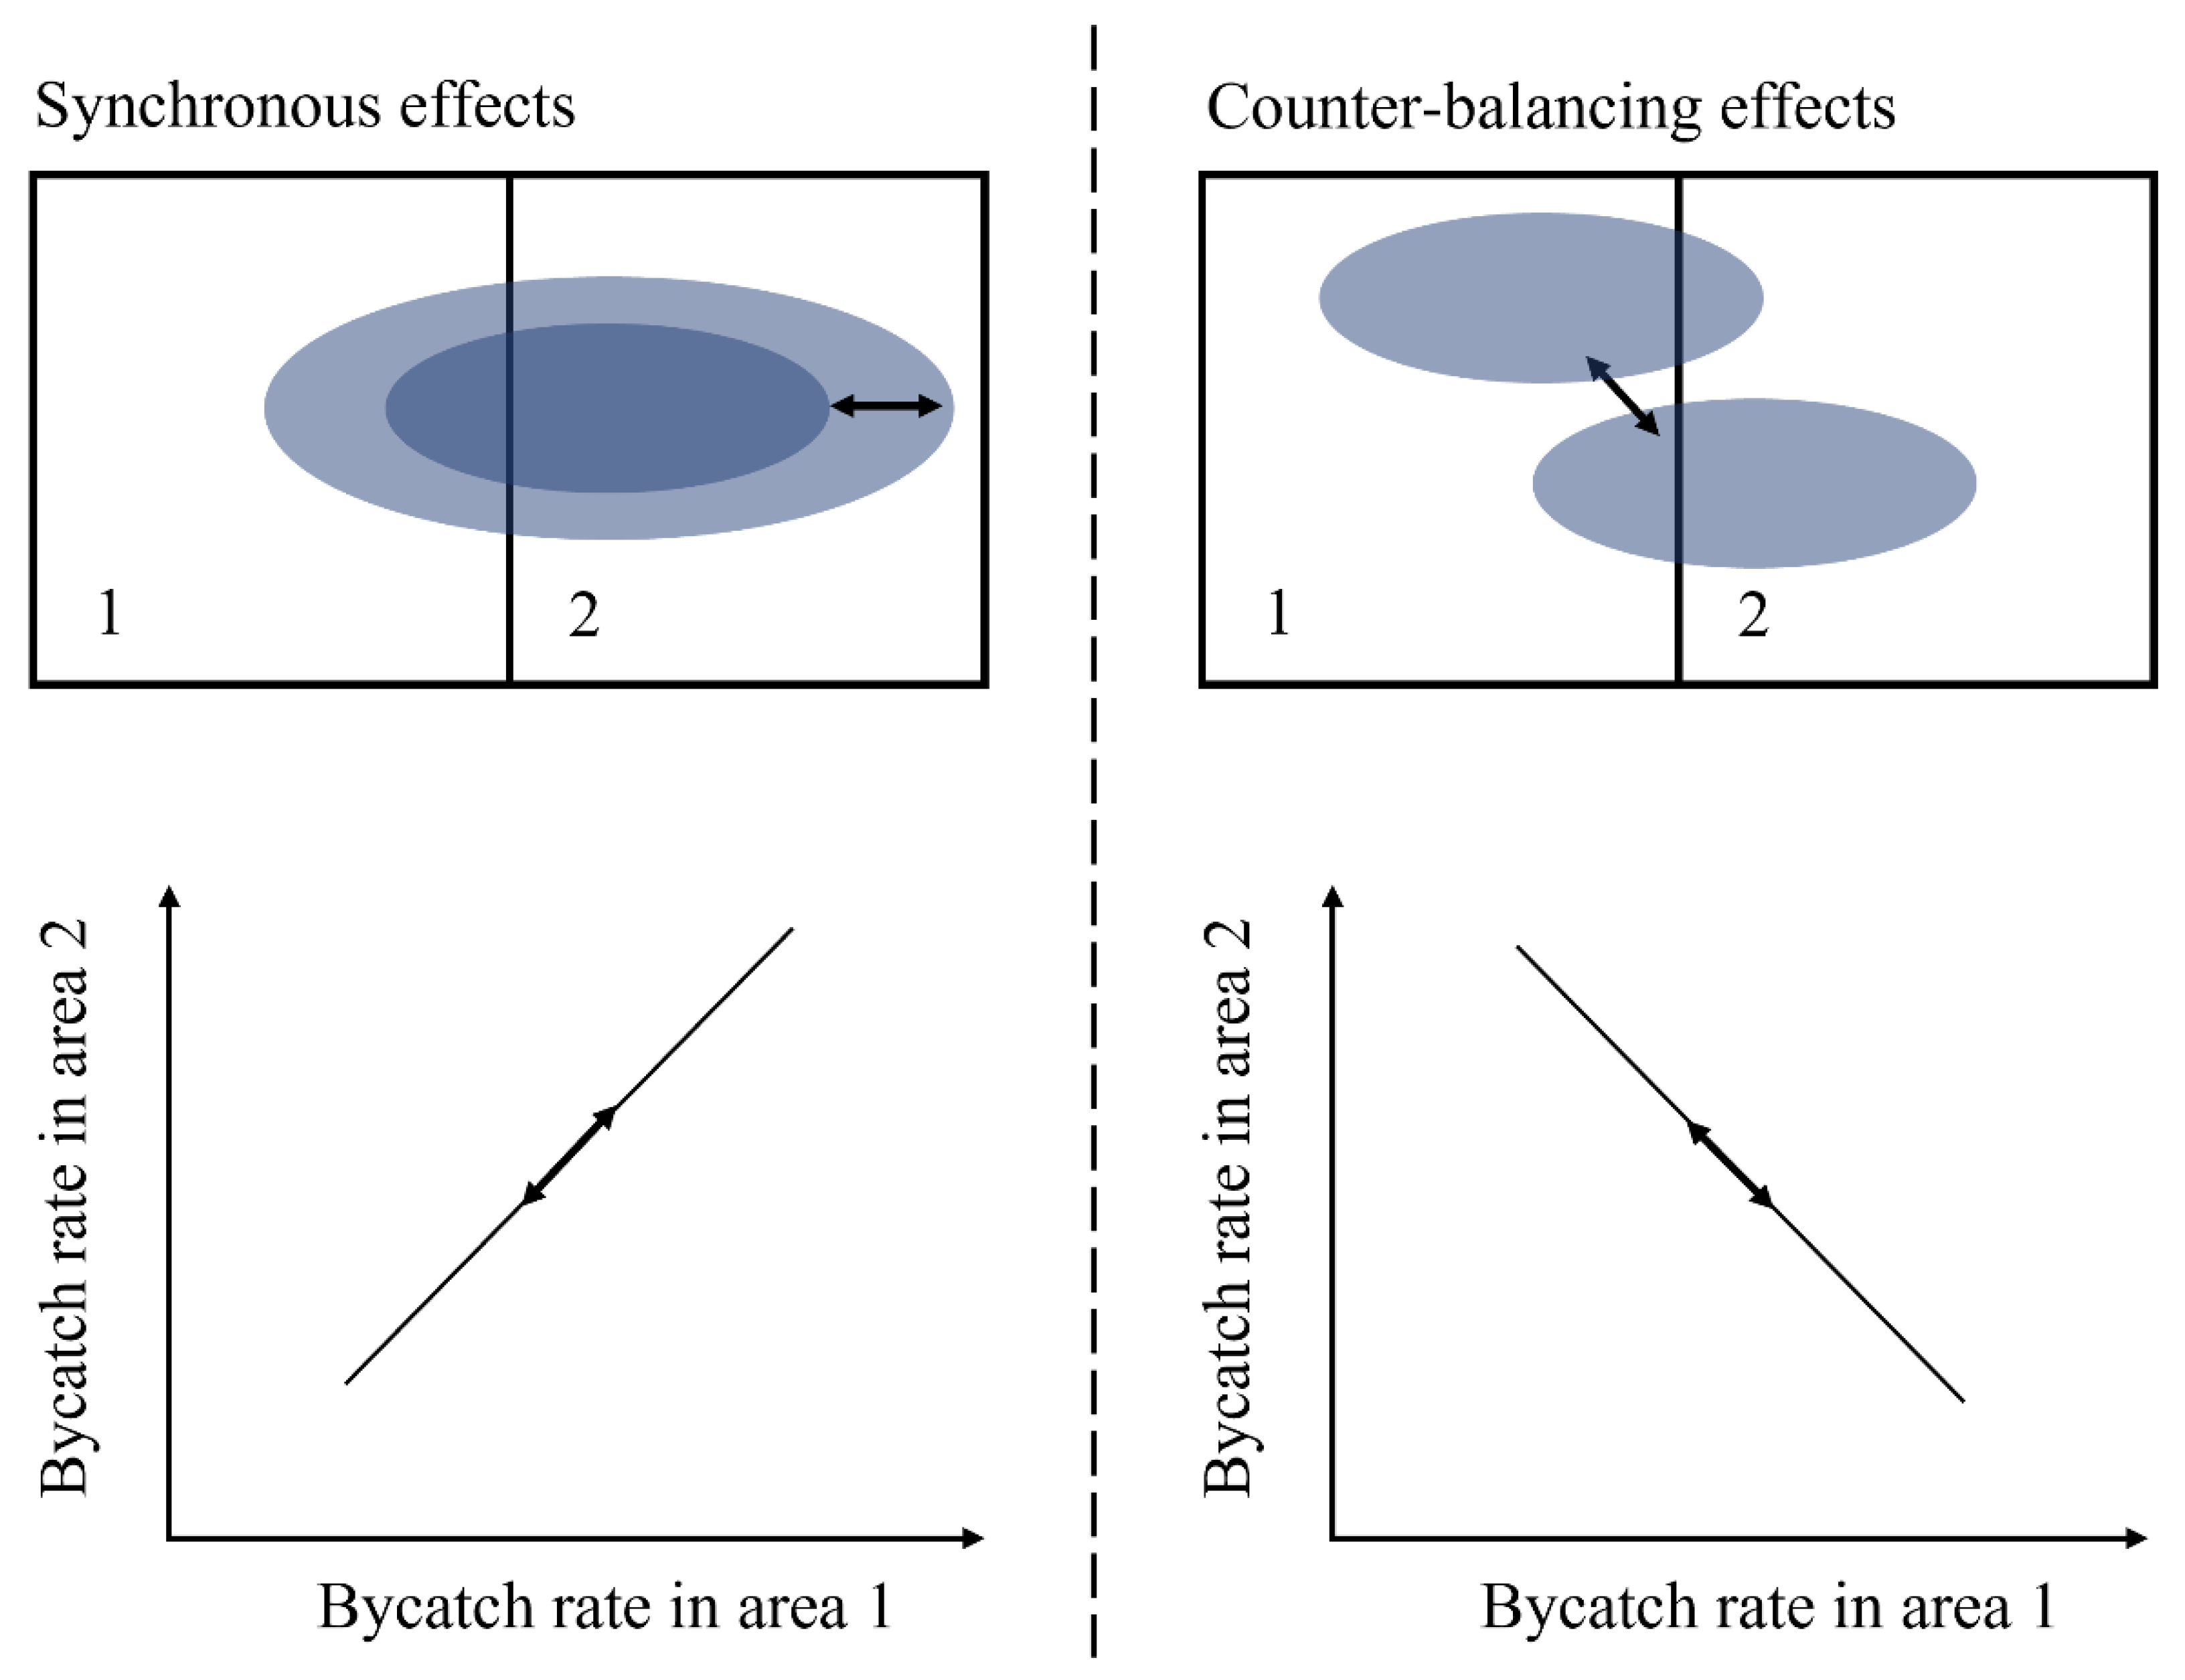
Figure 2.
A map of the observer coverage in the Western and Central Pacific Fisheries Commission (WCPFC) convention area. Orange dots mark the 5° by 5° cells with an observer coverage in any year from 2013 to 2020. Plotted using QGIS 3.24 with ESRI Ocean base layer.
Figure 2.
A map of the observer coverage in the Western and Central Pacific Fisheries Commission (WCPFC) convention area. Orange dots mark the 5° by 5° cells with an observer coverage in any year from 2013 to 2020. Plotted using QGIS 3.24 with ESRI Ocean base layer.

Figure 3.
The latitude bands (dark red lines) used in scenario 1 (left) and scenario 2 (right) of the scenario analysis in the Western and Central Pacific. These latitude bands are referred to from north to south as area 1 to 4 in each scenario. Orange dots mark the 5° by 5° cells with an observer coverage in any year from 2013 to 2020.

Figure 4.
The growth of the standard deviation of total bycatch estimates as a function of number of areas for different correlation structures. In this example, it is assumed that each area has the same fishing effort (1 million hooks annually), and the seabird bycatch rate in each area has a common standard deviation of 0.01. Here, the size of the fishing effort and common standard deviation are scaling factors and they do not change the relative size of these functions.

Figure 5.
The change in the coefficient of variation (CV) of the total seabird bycatch estimate as a function of number of areas for different correlation assumptions. In this example, it is assumed that each area has the same fishing effort, and the seabird bycatch rate in each area has a common mean and standard deviation. In the plot, CVi marks the CV of the seabird bycatch rate of an individual area.

Table 1.
A brief description of candidate models and model selection results.
| Model | Description | ΔAIC | |
|---|---|---|---|
| Scenario 1 | Scenario 2 | ||
| Independent | Seabird bycatch rates are assumed to be independent among areas | 3.4 | 11.2 |
| Compound symmetry | Seabird bycatch rates in different areas have the same correlation | 4.7 | 5.8 |
| General | General symmetric correlation matrix | 0 | 0 |
Table 2.
Parameter estimates of the model with a general correlation structure in scenario 1. Areas 1 through 4 are latitude bands in the Western and Central Pacific as configured in the left panel of Figure 3.
Table 2.
Parameter estimates of the model with a general correlation structure in scenario 1. Areas 1 through 4 are latitude bands in the Western and Central Pacific as configured in the left panel of Figure 3.
| Estimate | Standard Error | t-Value | p-Value | |
|---|---|---|---|---|
| Coefficient | ||||
| 0.110 | 0.049 | 2.13 | 0.0422 | |
| 0.002 | 0.00042 | 5.28 | <0.0001 | |
| 0.002 | 0.00054 | 4.03 | 0.0004 | |
| 0.062 | 0.015 | 4.20 | 0.0002 | |
| Residual standard error | 0.14 | - | - | - |
| Variance structure | ||||
| area 1 | 1 | |||
| area 2 | 0.0085 | |||
| area 3 | 0.011 | |||
| area 4 | 0.3 | |||
| Correlation structure | ||||
| area 1 | area 2 | area 3 | area 4 | |
| area 1 | 1 | |||
| area 2 | −0.315 | 1 | ||
| area 3 | 0.255 | 0.301 | 1 | |
| area 4 | 0.897 | −0.465 | 0.147 | 1 |
Table 3.
Parameter estimates of the model with a general correlation structure in scenario 2. Areas 1 through 4 are latitude bands in the Western and Central Pacific as configured in the right panel of Figure 3.
Table 3.
Parameter estimates of the model with a general correlation structure in scenario 2. Areas 1 through 4 are latitude bands in the Western and Central Pacific as configured in the right panel of Figure 3.
| Estimate | Standard Error | t-Value | p-Value | |
|---|---|---|---|---|
| Coefficient | ||||
| 0.027 | 0.012 | 2.24 | 0.033 | |
| 0.0022 | 0.0054 | 4.03 | 0.0004 | |
| 0.033 | 0.0033 | 9.81 | <0.0001 | |
| 0.11 | 0.031 | 3.44 | 0.0019 | |
| Residual standard error | 0.14 | - | - | - |
| Variance structure | ||||
| area 1 | 1 | |||
| area 2 | 0.044 | |||
| area 3 | 0.28 | |||
| area 4 | 2.55 | |||
| Correlation structure | ||||
| area 1 | area 2 | area 3 | area 4 | |
| area 1 | 1 | |||
| area 2 | 0.282 | 1 | ||
| area 3 | 0.616 | 0.134 | 1 | |
| area 4 | 0.883 | 0.050 | 0.819 | 1 |
Publisher’s Note: MDPI stays neutral with regard to jurisdictional claims in published maps and institutional affiliations. |
© 2022 by the authors. Licensee MDPI, Basel, Switzerland. This article is an open access article distributed under the terms and conditions of the Creative Commons Attribution (CC BY) license (https://creativecommons.org/licenses/by/4.0/).
Share and Cite
MDPI and ACS Style
Zhou, C.; Liao, B. Assessing the Uncertainty of Total Seabird Bycatch Estimates Synthesized from Multiple Sources with a Scenario Analysis from the Western and Central Pacific. Birds 2022, 3, 260-276. https://doi.org/10.3390/birds3030017
AMA Style
Zhou C, Liao B. Assessing the Uncertainty of Total Seabird Bycatch Estimates Synthesized from Multiple Sources with a Scenario Analysis from the Western and Central Pacific. Birds. 2022; 3(3):260-276. https://doi.org/10.3390/birds3030017
Chicago/Turabian StyleZhou, Can, and Baochao Liao. 2022. "Assessing the Uncertainty of Total Seabird Bycatch Estimates Synthesized from Multiple Sources with a Scenario Analysis from the Western and Central Pacific" Birds 3, no. 3: 260-276. https://doi.org/10.3390/birds3030017