Article

New Evidence on the Linkage of Population Trends and Species Traits to Long-Term Niche Changes

1
Department of Earth and Environmental Sciences, University of Milano-Bicocca, Piazza Della Scienza 1, 20126 Milano, Italy
2
World Biodiversity Association Onlus c/o NAT LAB Forte Inglese, Portoferraio, 57037 Livorno, Italy
*
Author to whom correspondence should be addressed.
Birds 2022, 3(1), 149-171; https://doi.org/10.3390/birds3010011
Submission received: 14 February 2022 / Revised: 11 March 2022 / Accepted: 14 March 2022 / Published: 16 March 2022
(This article belongs to the Special Issue Feature Papers of Birds 2021)

Abstract

:

Simple Summary

Temporal changes of ecological niches in relation to both population trends and species traits (life-history and ecological characteristics) are a poorly investigated topic in animal ecology even though they can provide crucial information for investigating how species respond to ongoing environmental changes. To fill this gap, we assessed niche changes from 1992 to 2017 for 71 common breeding birds in Northern Italy, using several niche metrics and relating them with both population trends and species traits. Our results showed that 32% of the species tended to change their niche in relation to the accessible environmental conditions. We found a tendency to adjust the niche towards warmer thermal conditions. This process may depend on several drivers, which act differently across species. Species undergoing a niche expansion showed increasing populations, while species tending to retain their niche showed a tendency to be associated with decreasing populations. We also found evidence for a non-random association between niche temporal changes and species traits. Investigating these relationships is a pivotal point to implement effective conservation strategies for wildlife.

Abstract

Despite the assessment of long-term niche dynamics could provide crucial information for investigating species responses to environmental changes, it is a poorly investigated topic in ecology. Here, we present a case study of multi-species niche analysis for 71 common breeding birds in Northern Italy, exploring long-term niche changes from 1992 to 2017 and their relationship with both population trends and species traits. We (i) quantified the realized Grinnellian niche in the environmental space, (ii) compared variations in niche breadth and centroid, (iii) tested niche divergence and conservatism through equivalency and similarity tests, (iv) calculated niche temporal overlap, expansion and unfilling indices, and (v) investigated their association with both population changes and species traits. Results supported niche divergence (equivalency test) for 32% of species, although two-thirds were not supported by the similarity test. We detected a general tendency to adjust the niche centroids towards warmer thermal conditions. Increasing populations were positively correlated with niche expansion, while negatively correlated with niche overlap, albeit at the limit of the significance threshold. We found moderate evidence for a non-random association between niche changes and species traits, especially for body size, clutch size, number of broods per year, inhabited landscape type, and migration strategy. We encourage studies correlating long-term population trends and niche changes with species traits’ information and a specific focus on cause-effect relationship at both the single and multiple-species level.

1. Introduction

The quantification of the realized niche of a species [1] (sensu Grinnell [2,3,4,5], hereafter niche) and how it varies across space and time has received increasing attention in ecological studies, with important implications in evolution, biogeography, and conservation [6,7,8,9,10,11,12,13,14,15]. Many studies have focused on niche evolution in related taxa [16,17,18,19,20,21,22,23], or on niche quantification of alien species to assess their potential as invaders in non-native ranges [24,25,26,27,28,29,30,31,32]. However, niche quantification and change in avian species remain poorly investigated aspects, especially if compared to other research topics (e.g., population trend assessment). As well as the general tendency in ecology, in ornithology most studies on niche also have focused on evolutionary aspects or on invasive species. Moreover, several studies have focused on niche-tracking under climate change by a correlative modeling approach (e.g., species distribution models [33]) in order to predict future changes in species distributional range [34,35,36,37,38]. Both the niche-tracking concept and its application in predictive species distribution modeling assume niche conservatism [5], which implies that in the future a species will occupy the same environmental conditions that it occupies today. Several studies have supported niche conservatism on both ecological and evolutionary timescales [6,39,40]. However, these studies focused on conservation of the fundamental niche, while a separate issue is whether the realized niche is also conserved. Some studies have highlighted that species may not retain their realized niche between the native and invaded range [41,42] and that variations may be expected under climate changes [43].
Very little attention has been given to within-species niche changes in the same geographic area over time. Assessing the change of the niche of a species in a relatively long-term period (e.g., decades) could allow measuring the environmental plasticity of the species in adapting to suboptimal environmental conditions and in colonizing new habitats, as well as the tendency in moving the niche boundaries or position towards different combinations of environmental gradients. This information may be combined with population trends to shed light on mechanisms that regulate species capability in responding to environmental changes, which can be pivotal to plan effective conservation actions. We ascertained a lack of studies on this potential relationship (but see [44,45]), although long time-series data coming from standardized bird monitoring programs (e.g., North American Breeding Bird Surveys [46]) exist. Ralston et al. [44] found a positive association between changes in climatic niche breadth and population trends. Ralston et al. [45] also showed that increasing species tended to show greater levels of climatic niche expansion compared to declining species, while declining species had significantly greater climatic niche unfilling compared to increasing species. Notwithstanding the relevance and the novelty of their results, these two studies did not consider the habitat characteristics (e.g., land cover variables) in niche quantification, thus omitting important scenopoetic variables—i.e., variables that are invariant to species [47]—constituting the realized Grinnellian niche. Another important question is how temporal changes in niche occupancy (i.e., variations of the density of occurrence corrected by the environmental availability in the multidimensional niche space) are related to population trends. The inference on the cause-effect relationship between niche changes and population trends needs to be carefully evaluated [45]. Indeed, it is reasonable to expect that a change (both an expansion and an unfilling) in a species niche could be the reason for the observed population trend (e.g., [48] for the isotopic niche). However, it is also reasonable that the variation in a species niche may be the result of a change in the species population abundance (due to niche-independent potential factors, e.g., epidemic, interspecific competition, density-dependent factors), which could have led to a niche reshaping with expansion, unfilling, centroid shift, variations in breadth or density of occurrence.
Beyond the relevance of a species-specific approach, in the past decade the increasing attention on a trait-based approach allowed highlighting emergent ecological patterns in groups of birds sharing similar life-history and ecological traits [49,50,51,52,53]. The relationship between the ecological niche and species traits has been mainly explored under an evolutionary perspective ( [54,55,56]), but there is a lack of studies focusing on ecological aspects (but see [57,58]). Revealing such types of ecological signal would point out a non-random evolution of niche changes, suggesting the existence of shared ecological pressures within groups of species sharing similar characteristics.
Here, we present a multi-species niche analysis on 71 common breeding birds in Northern Italy (Lombardy region), exploring long-term niche changes from 1992 to 2017 and relating niche changes to species population trends, life-history and ecological traits. Specifically, we tried to answer the following questions: (i) did birds vary their niche over a long-term period? (ii) Are niche expansion and unfilling associated with increasing and decreasing populations, respectively? (iii) Is the intensity of niche overlap—i.e., the tendency to not vary the niche occupancy—related to population change? (iv) How do niche changes relate to species traits?

2. Materials and Methods

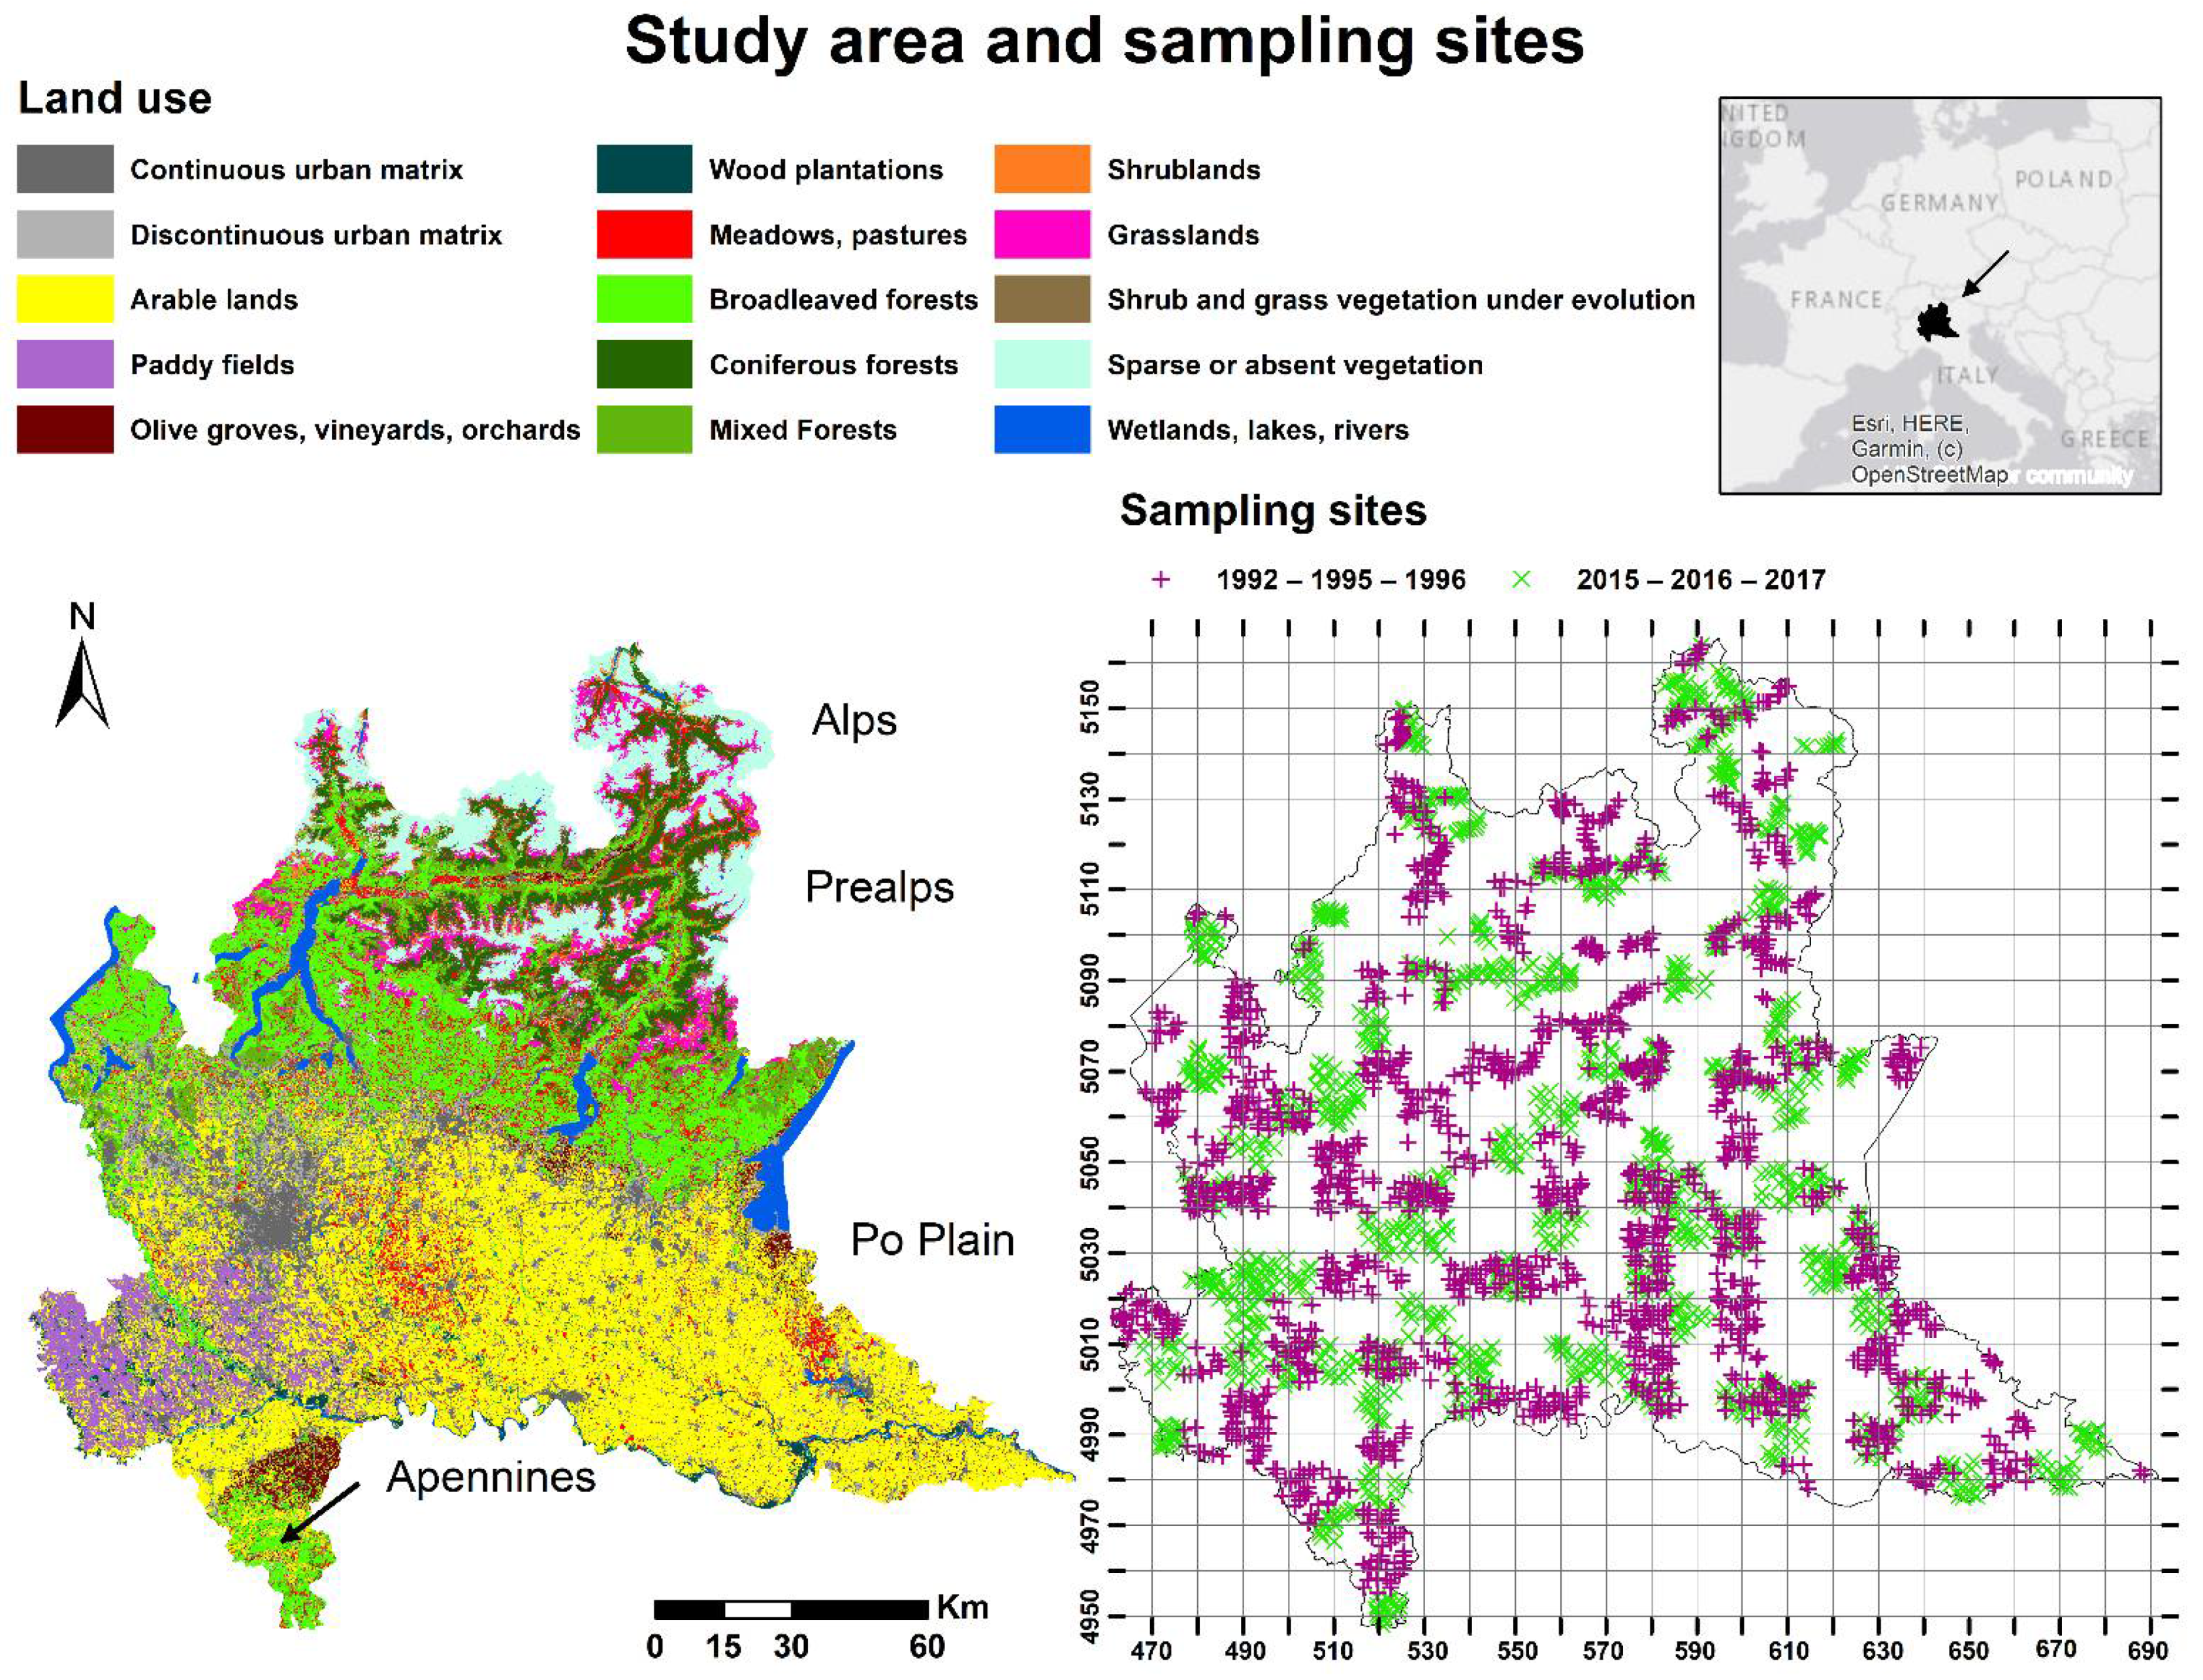
2.1. Study Area and Bird Data

The study was carried out in Lombardy, a region of 23,861 km2 in Northern Italy (45° N, 9° E). The area presents diversified landscapes: mountain chains in the North (Alps and Prealps), a large West–East alluvial plain of more than 12,000 km2 in the central part (Po Plain), and a portion of Apennines mountains in the southwestern corner. Overall, land use is characterized by urban areas (14.7%), agricultural lands (42.2%), and natural and semi-natural lands (39.6%, of which 61.4% are forests; data derived from digital land cover map DUSAF [59]). Continuous forests and meadows occupy the territory of Alps and Prealps up to the wood limit, where natural shrublands and grasslands extend at higher altitudes. The Po Plain is heavily men-modified, with intensive cereal cultivations (mainly maize) in the central and eastern part, and dense urban areas and paddy fields in the West. Extensive farming and deciduous and mixed forests characterize the Apennines. During the time span considered in this study, the region underwent some land-use changes. Forest cover increased (+1%), agricultural lands declined (−3.3%), and urban areas increased (+2.1%) (comparison of digital land-cover maps DUSAF [59,60]).
Bird data were obtained from the Long-Term Monitoring Program of Breeding Birds in Lombardy [61]. The project has been carrying out yearly surveys since 1992 (no data are available for 1993, 1994, 1997, 1998) following a stratified random design [53]. Data were collected through a single-visit point-count method with unlimited distance [62], whereby all birds heard or seen (including over-flying individuals) in 10 min were recorded [63]. Surveys were carried out each year during the breeding season (10 May–20 June), from sunrise to 11 a.m. and only in good weather conditions. The technique is effective in detecting bird species belonging to the orders Columbiformes, Cuculiformes, Apodiformes, Coraciiformes, Piciformes, and Passeriformes, but can also be used to survey some other common species, such as the Common Buzzard (Buteo buteo) and the Common Kestrel (Falco tinnunculus) [61]. To investigate the long-term changes of species niche, we defined two temporal windows (T1 and T2) of a three-year time interval: T1 includes point counts performed in 1992 (n = 373), 1995 (n = 650), and 1996 (n = 696), while T2 includes point counts performed in 2015 (n = 855), 2016 (n = 749), and 2017 (n = 542) (Figure 1). This procedure allows limiting the effect of inter-annual abundance variability and obtaining a more representative sample ([44,50,64]). Since the project did not include multiple surveys within the same season, species detection probability could not be explicitly considered. Nevertheless, the large amount of data used for this study and their aggregation into three-year time intervals overcomes the potential limit of imperfect detection, lowering the noise generated by stochasticity in species detection [65,66]. Moreover, 10-min point counts have been indicated as an effective survey technique to detect a sufficiently high percentage of the species present in a site [67], and surveys were performed by a restricted pool of expert surveyors, thus limiting the presence of inter-observer detection bias. For the purpose of this study, we retained the most common species [53] with a frequency of occurrence higher than or equal to 1% in both T1 and T2 (number of species = 71).

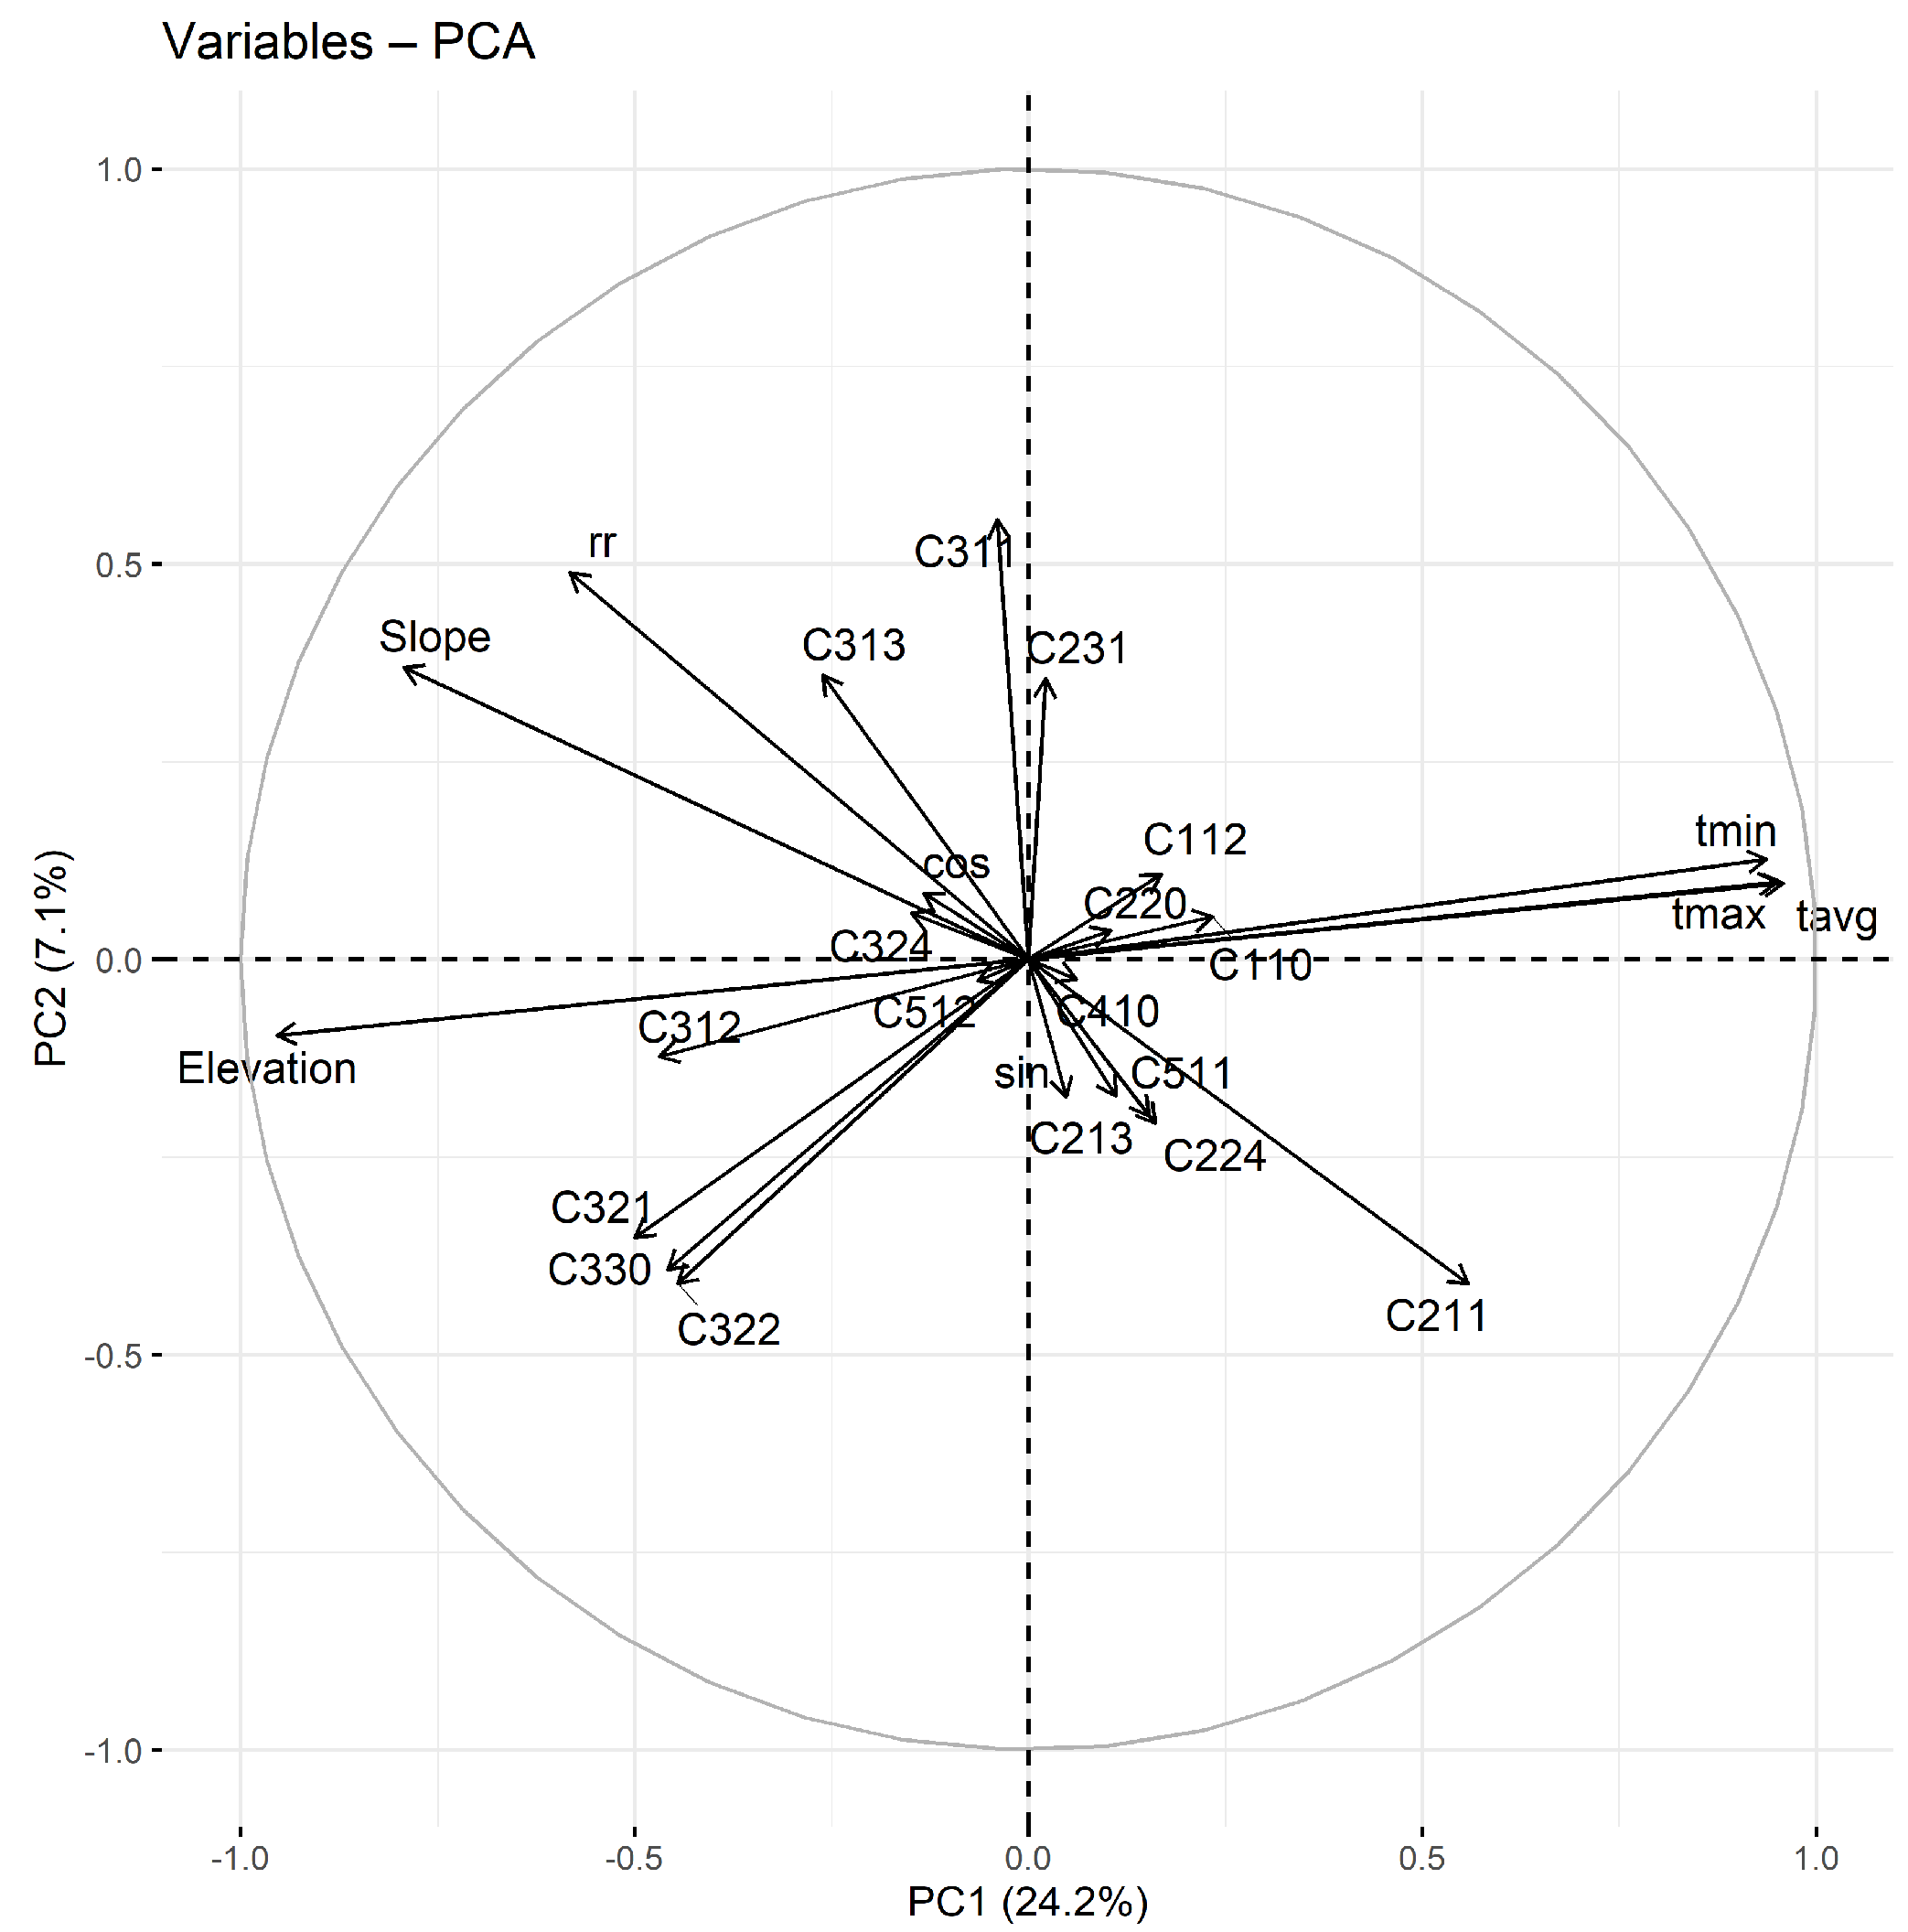
2.2. Habitat and Climatic Variables

Species niche was quantified by using 17 land-cover variables, four topographic variables and four climatic variables. Land-cover variables were recorded on the field as fractional cover within a 250-m circular buffer around each point count and were classified according to the 3rd-level of DUSAF digital map [59]. Some variables were merged because they were strongly underrepresented in the dataset and indicated similar types of land covers (Table S1). Land-cover variables included continuous urban matrix (e.g., dense urban areas, industrial areas, infrastructures; C110), discontinuous urban matrix (e.g., farmsteads; C112), arable lands (e.g., maize, wheat, horticulture; C211) paddy fields (C213), permanent orchard plantations (olive groves, vineyards, orchards; C220), wood plantations (C224), meadows and pastures (C231), broadleaved forests (C311), coniferous forests (C312), mixed forests (C313), grasslands (C321), shrublands (C322), no tree vegetation under evolution (C324), areas with sparse or absent vegetation (e.g., outcrops, debris deposits, glaciers; C330), wetland vegetation (C410), rivers and streams (C511), and natural and artificial lakes (C512). Topographic variables were derived from the Digital Elevation Model (DEM, 20-m ground-resolution, downloadable from http://www.geoportale.regione.lombardia.it/, (accessed on 21 September 2021)), and included sine (sin) and cosine (cos) of the aspect (adimensional), slope (grades) and elevation (m), all measured by averaging pixel values within a 250-m circular buffer around each survey site. Climatic variables were obtained from the European Climate Assessment & Dataset (ECAD) with a resolution of 0.1 degree [68]. They included the annual cumulative rainfall (rr), and the annual average (tavg), minimum (tmin) and maximum (tmax) temperature. For each period, after trimming the original grid by our study area, we spatially associated the value of each climatic variable to the corresponding point count, by averaging values within a period between the two years immediately preceding the first year of the time interval and the last year—i.e., 1990–1996 for T1 and 2013–2017 for T2. This way, we obtained values representative of climatic conditions in the two periods, limiting the effects of climatic oscillation that might be detected during a single year and taking into account that birds could have exhibited a delayed response to climatic parameters [69].
Geospatial analyses were conducted in ESRI ArcMap v. 10.7.1 [70] and in R software v. 4.0.2 [71].

2.3. Niche Quantification and Temporal Changes

In recent years, the quantification and the analysis of spatio-temporal niche changes benefited from novel methodological insights [72,73,74,75,76,77]. The most important progress concerns the use of the environmental space (E-space [72,73,74,76]) instead of the geographical space (G-space [33,78,79]). This way, no assumptions are required for the model-based approach [72,74]. The use of the E-space permits better assessment of the niche overlap because it takes into account the environmental availability and the analogy between ranges [72,80], and it overcomes some limitations on the inference of niche similarity [76].
Niche analysis was performed separately for the 71 bird species using the R package ecospat [81]. The E-space was assessed through an ordination technique using a PCA-environment framework, retaining the two main axes resulting from the input of the 25 habitat and climatic variables presented in Section 2.2. The axes of the PCA maximize the ecological variance present in the study area for both periods. The PCA scores of species occurrence in each period were projected onto a grid of cells bounded by the minimum and maximum PCA scores of both periods—i.e., gridded E-space—and a kernel density function was used to estimate the density of occurrence of the species in each cell of the grid [74].
We evaluated the species niche breadth and centroid along each of the PCA axes for each period, by computing the variance and the median of the scores along the principal components, respectively. To detect a significant variation in the niche breadth and centroid between the two periods across all species, we performed the Wilcoxon rank sum test. To compare the overlap of the environmental niche of each species between T1 and T2, we used the metric Schoener’s D [72,82]. This index quantifies the amount of niche overlap by computing, for every grid cell in the E-space, the absolute differences in densities of occurrence—corrected by the prevalence of the environments in their range, i.e., niche occupancy—between the two periods. It varies from zero (no overlap) to one (complete overlap). Additionally, we calculated three niche dynamic indices between the two periods, namely the expansion, unfilling, and stability index (all varying from a minimum of zero to a maximum of one). The expansion index represents the E-space occupied by the species in T2 only, the unfilling index indicates the E-space occupied by the species in T1 only, and the stability index represents the E-space where the species occurred in both periods (T1 ∩ T2) [8]. This decomposition can provide more information about the drivers of niche change between the two periods. We computed the three indices by limiting their calculation to the shared available E-space (intersection = 0), in order to exclude that the observed values were due to differences in the accessible E-space [76]. Since the stability index is complementary to the expansion index, it was not reported in the results in order to avoid redundant information. We evaluated the correlation among Schoener’s D, and expansion and unfilling indices by the non-parametric Kendall test [83]. To test the statistical significance of niche overlap (Schoener’s D), we ran equivalency and similarity tests, comparing the overlap of the two observed niches to the overlap of simulated niches. The equivalency test assesses whether two niches are more or less equivalent than expected by chance when randomly reallocating all occurrences between the two ranges. The similarity test assesses whether the overlap between observed niches in two ranges is different from the overlap between niches when their occurrence density grids are randomly shifted in the background environment [72,74,78]. To ensure a robust statistical inference, each test was performed based on 1000 simulations [84,85]. For both tests, we assessed the hypotheses of both niche divergence and niche conservatism—i.e., one-side tests—and for the similarity test both niches were randomly shifted. For both the equivalency and similarity tests, a significant p-value (≤0.05) means that the two niches are less (niche divergence) or more (niche conservatism) equivalent/similar than a random expectation.

2.4. Relationship between Niche Temporal Changes, Population Trends and Species Traits

To assess the relationship between niche temporal changes and population trends we performed a Kendall non-parametric correlation analysis [83] between each of the niche metrics (Schoener’s D, expansion and unfilling index) and the species population trends (% change). Compared to the Spearman rho statistic, Kendall tau provides more accurate p-values when the sample dimension is small and there are many ties in the data [86], as in our case. We derived species trends from [53], where long-term trends (1992–2019) for the species considered in this study were assessed in the same study area, using data derived from the same bird monitoring program. We assigned a zero value to species with non-significant trends.
To investigate the relationship between niche metrics (Schoener’s D, expansion and unfilling index) and species traits, we performed distinct analyses for continuous traits (12 life-history traits, namely body length, wing length, tail length, bill length, tarsus length, body weight, clutch size, incubation period, fledging period [87]; number of broods per breeding season [53,87]; annual fecundity [88]; dispersal ratio [89,90]; and six species specialization indices, namely foraging habitat, acquisition behavior, nesting habitat, foraging substrate, diet [53,91,92]; overall [53]) and categorical traits (four uncorrelated traits of interest [53], namely migration strategy [53], nest type [53,87], landscape type—i.e., habitat preferences at landscape scales [53]—, and diet [53,93]). For continuous traits, we performed a principal component analysis (PCA) using all 18 traits as input variables. This way, we reduced the dimensionality of traits into new uncorrelated components representing species life-history and ecological characteristics. Then, we analyzed the correlation between the main axes of the PCA—picked out through eigenvalues, scree plots and percentage of variance explained—and the niche metrics, which were input as supplementary quantitative variables. PCA was performed using the R packages FactoMineR [94] and factoextra [95]. For categorical traits, we performed a Kruskal–Wallis rank sum test separately for each combination of niche metric and trait. In the case of overall significance (p-value ≤ 0.05), we ran a Dunn’s test (significant threshold = 0.05) for pairwise comparisons between trait levels with the Bonferroni adjustment [96]. See Table S2 for details and referencing literature about traits. All statistical analyses were performed in R software v. 4.0.2 [71].

3. Results

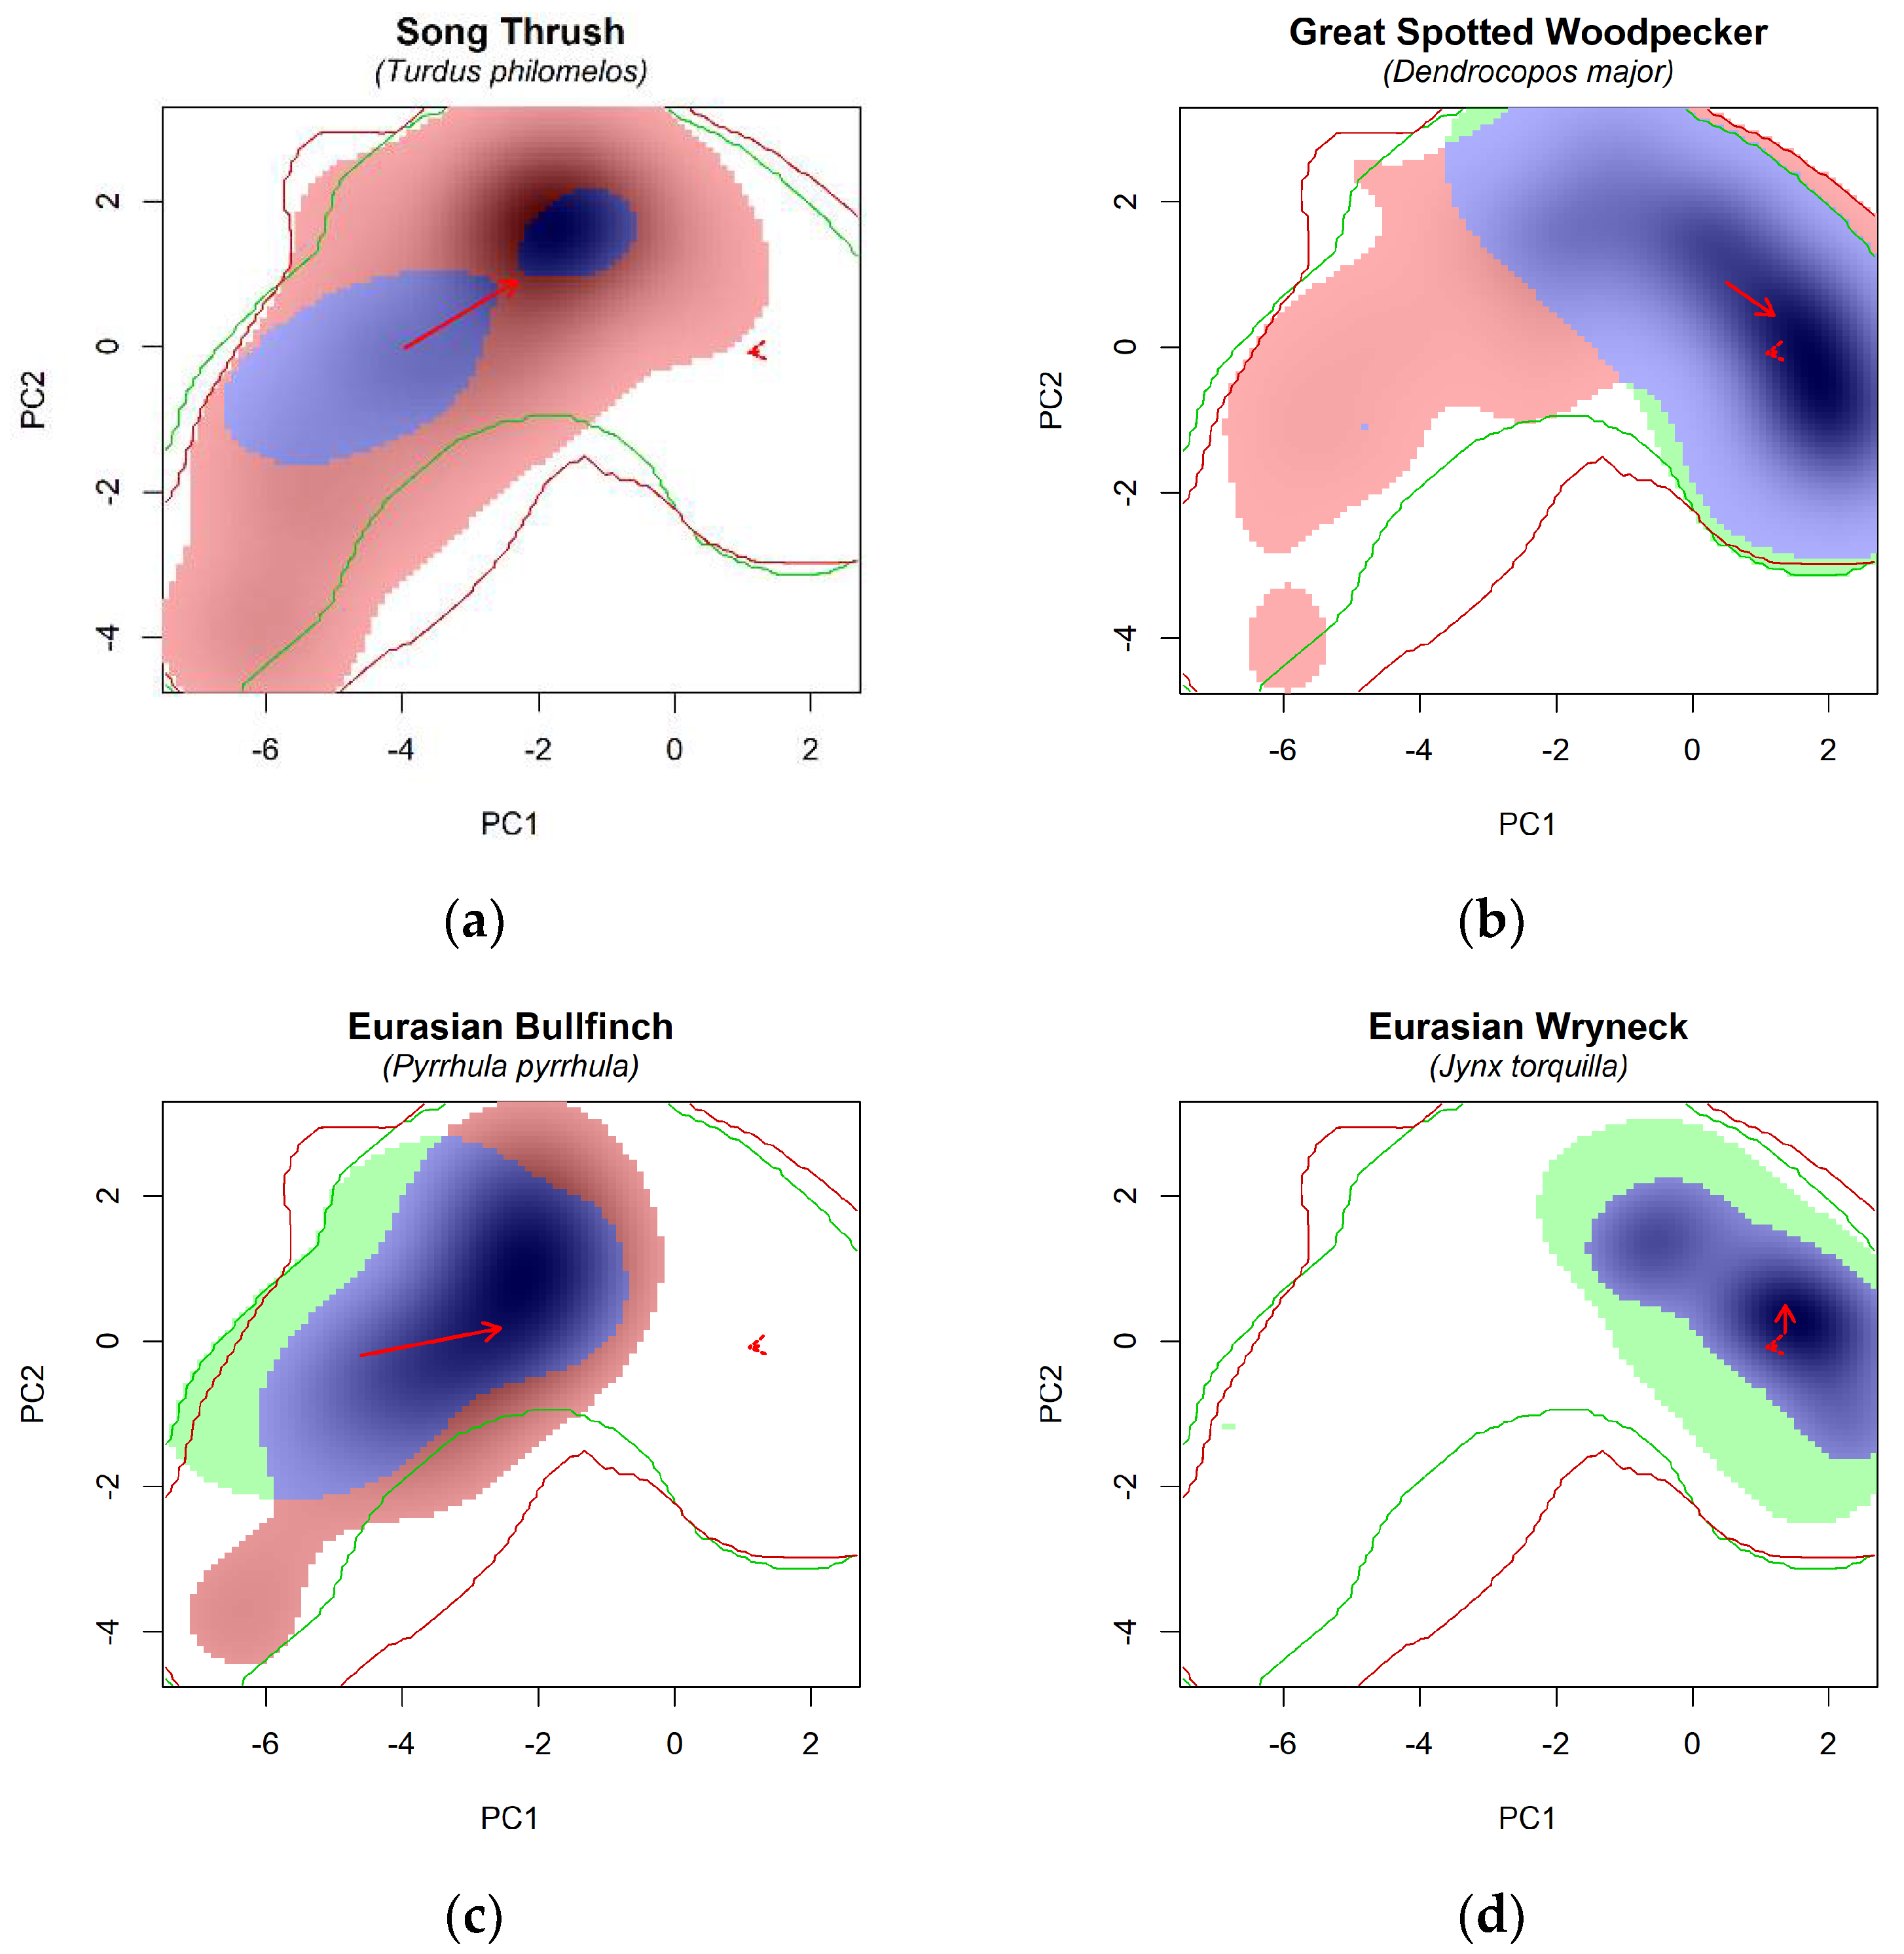
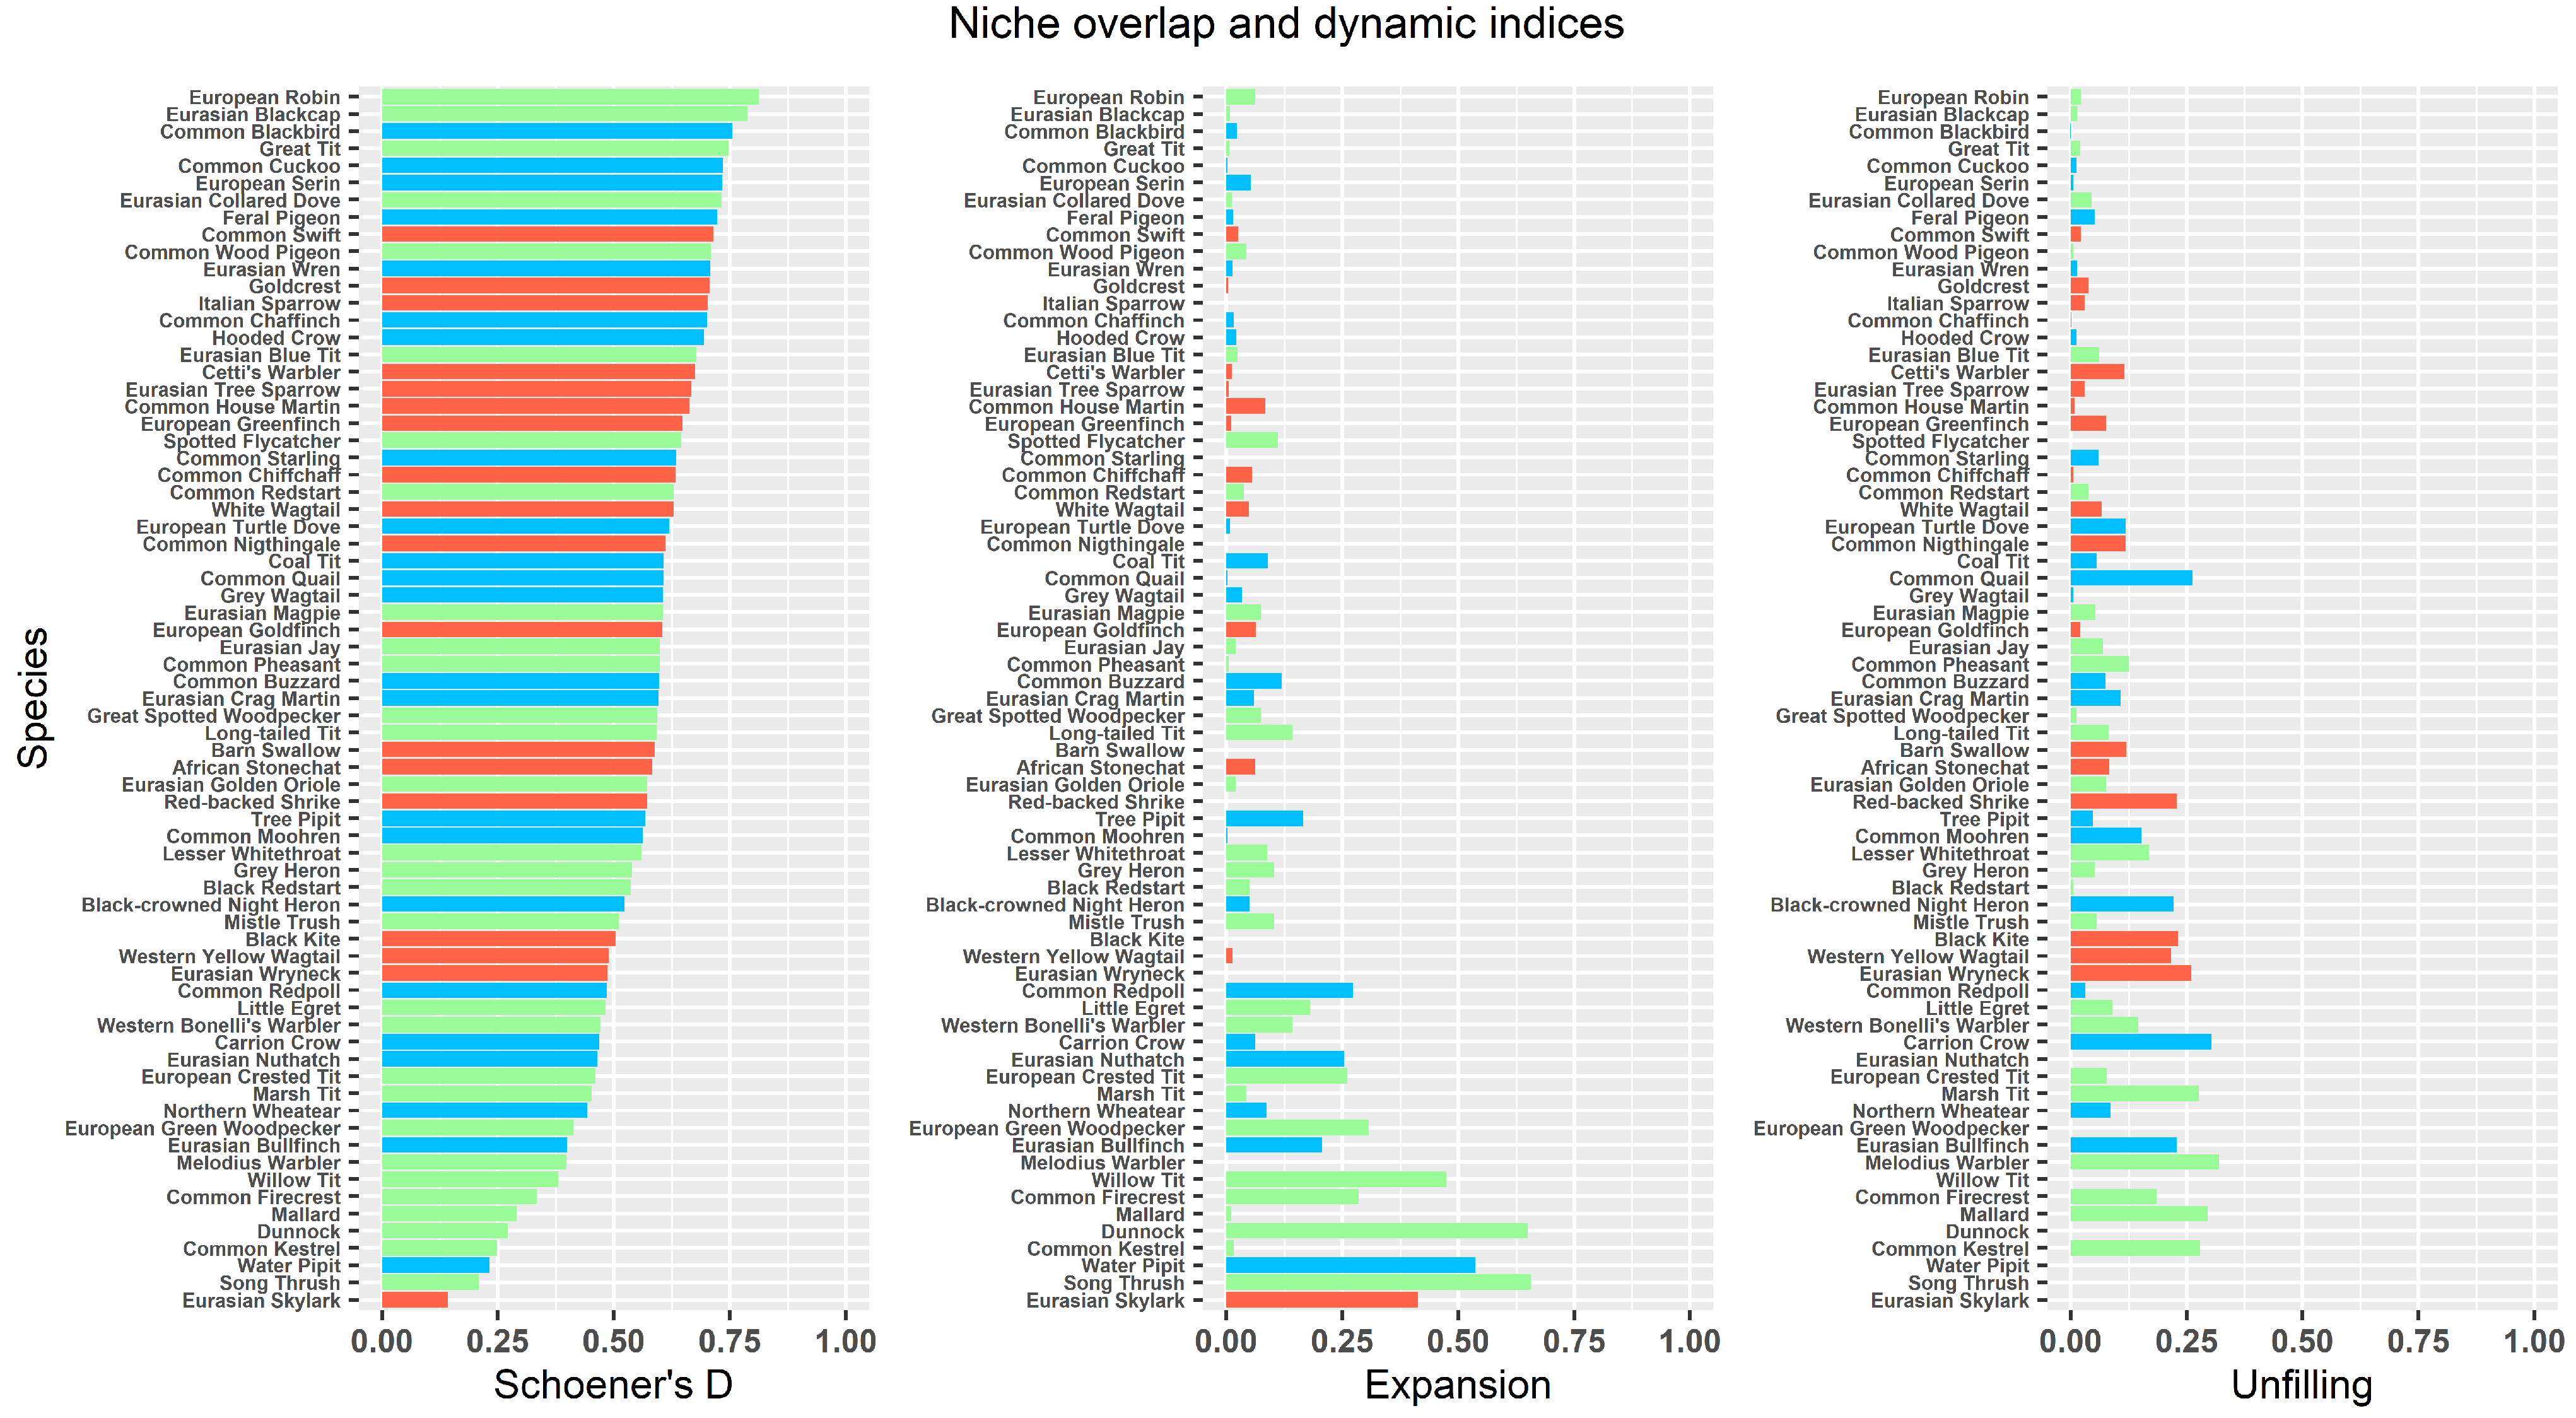
3.1. Niche Quantification and Temporal Changes

In defining the E-space, the first two PCA axes explained 31.3% of the total variance. PC1 explained 24.2% of the variance, while PC2 7.1%. The first axis represents a thermal gradient, showing a strong negative correlation with elevation and a strong positive correlation with temperatures (Figure 2, Table S3 and Figure S1a). The major contributions to PC2 were given by nine variables (Figure S1b). Annual rainfall (rr), broadleaved forests (C311), mixed forests (C313), meadows and pastures (C231), and slope were positively correlated with this component, while arable lands (C211), grasslands (C321), shrublands (C322), and areas with sparse or absent vegetation (C330), showed a negative correlation (Figure 2 and Table S3). The second niche component reflects habitat characteristics along an ecological gradient of open (variables negatively correlated with PC2) vs closed (variables positively correlated with PC2) habitats, despite the inclusion of meadows and pastures in the latter group. The strong contribution of annual rainfall to PC2 could reflect the major water requirements of natural habitats such as broadleaved and mixed forests.
Niche breadths and centroids showed a large variability across species along each of the two PCA axes (Table S4). Despite differences within species, we detected a general change only for the niche centroid along PC1 between T1 and T2, representing a shift towards warmer climatic conditions (W = 1991, p-value = 0.031; Figure S2).
Niche quantification in T1 and T2, and niche temporal changes of the 71 species were reported in Figure S3. The whole extent and the centroids’ position of the available E-space (solid lines and dashed arrows in Figure 3a–d and Figure S3) were largely similar between T1 and T2, meaning that the background E-space in the two periods was comparable. Only a small portion in the bottom area of the available E-space in T2 did not match with the E-space in T1 (shrublands, grasslands and areas with sparse or absent vegetation at higher altitudes). Some species (e.g., Common Quail Coturnix coturnix, Western Yellow Wagtail Motacilla flava, and Cetti’s Warbler Cettia cetti) tended to fill a small portion of the total available E-space, while others (e.g., Common Cuckoo Cuculus canorus, Grey Wagtail Motacilla cinerea, Eurasian Wren Troglodytes troglodytes, Common Chaffinch Fringilla coelebs) occurred in most of the available E-space. Regarding changes between T1 and T2 of the density of occurrence and the occupied E-space, different types of patterns can be identified (Figure S3). Some species, such as the Song Thrush (Turdus philomelos, Figure 3a), extended their niche in most of the whole E-space. Other species exhibited a directional expansion along one of the niche components. For example, the Great Spotted Woodpecker (Dendrocopos major, Figure 3b) showed an expansion (without remarkable niche unfilling) towards coniferous forests and scattered vegetation at higher altitudes. Conversely, other species mainly showed a shift with unfilling and expansion along the same dimension, such as the Eurasian Bullfinch Pyrrhula pyrrhula along PC1 towards warmer climatic conditions, lower altitudes and mixed/broadleaved forests (Figure 3c). Other species showed a relatively stable niche, with moderate areas of unfilling/expansion and non-directional patterns (e.g., the Eurasian Blackcap Sylvia atricapilla, Figure S3). Finally, 17 species (e.g., the Eurasian Wryneck Jynx torquilla, Figure 3d) exhibited an overall niche contraction.
Across the 71 species, the median value of niche overlap between T1 and T2, assessed through the Schoener’s D index, was 0.60 (range = 0.14–0.81). Most species showed low or moderate values of the expansion index (median = 0.04, range = 0–0.66), but the Dunnock (Prunella modularis), the Song Thrush, the Water Pipit (Anthus spinoletta), the Willow Tit (Poecile montanus), and the Eurasian Skylark (Alauda arvensis) experienced a large expansion (>0.40). Similarly, the median of the unfilling index was 0.06 (range = 0–0.32), but the Mallard (Anas platyrhyncos), the Common Kestrel (Falco tinnunculus), the Common Quail, the Eurasian Wryneck, the Melodius Warbler (Hippolais polyglotta), the Marsh Tit (Poecile palustris) and the Carrion Crow (Corvus corone) showed higher unfilling values (>0.25) (Figure 4 and Table S5). The Schoener’s D resulted negatively correlated with both the expansion (Kendall tau = −0.34, p-value < 0.001) and the unfilling (Kendall tau = −0.27, p-value = 0.001), and the expansion was negatively correlated with the unfilling (Kendall tau = −0.26, p-value = 0.001).
Niche equivalency and similarity tests were summarized in Table 1. Twenty-three of the 71 species showed a niche equivalency significantly smaller than expected by chance (equivalency test: p-value ≤ 0.05 for the niche divergence hypothesis), suggesting the existence of differences in niches between T1 and T2. On the other hand, seven species (Common Cuckoo, Eurasian Wren, European Robin Erithacus rubecula, Common Blackbird Turdus merula, Lesser Whitethroat Curruca curruca, Eurasian Blackcap, Goldcrest Regulus regulus) significantly conserved their niche between the two periods (equivalency test: p-value ≤ 0.05 for the niche conservatism hypothesis). The similarity test did not accept the niche divergence hypothesis for any species (p-value > 0.05). However, the niche conservatism hypothesis was accepted for 56 species (p-value ≤ 0.05 whose Schoener’s D resulted to be among the 59 highest values, showing that most species retained their own niche over time when both occurrence density grids were randomly shifted into the background environment.

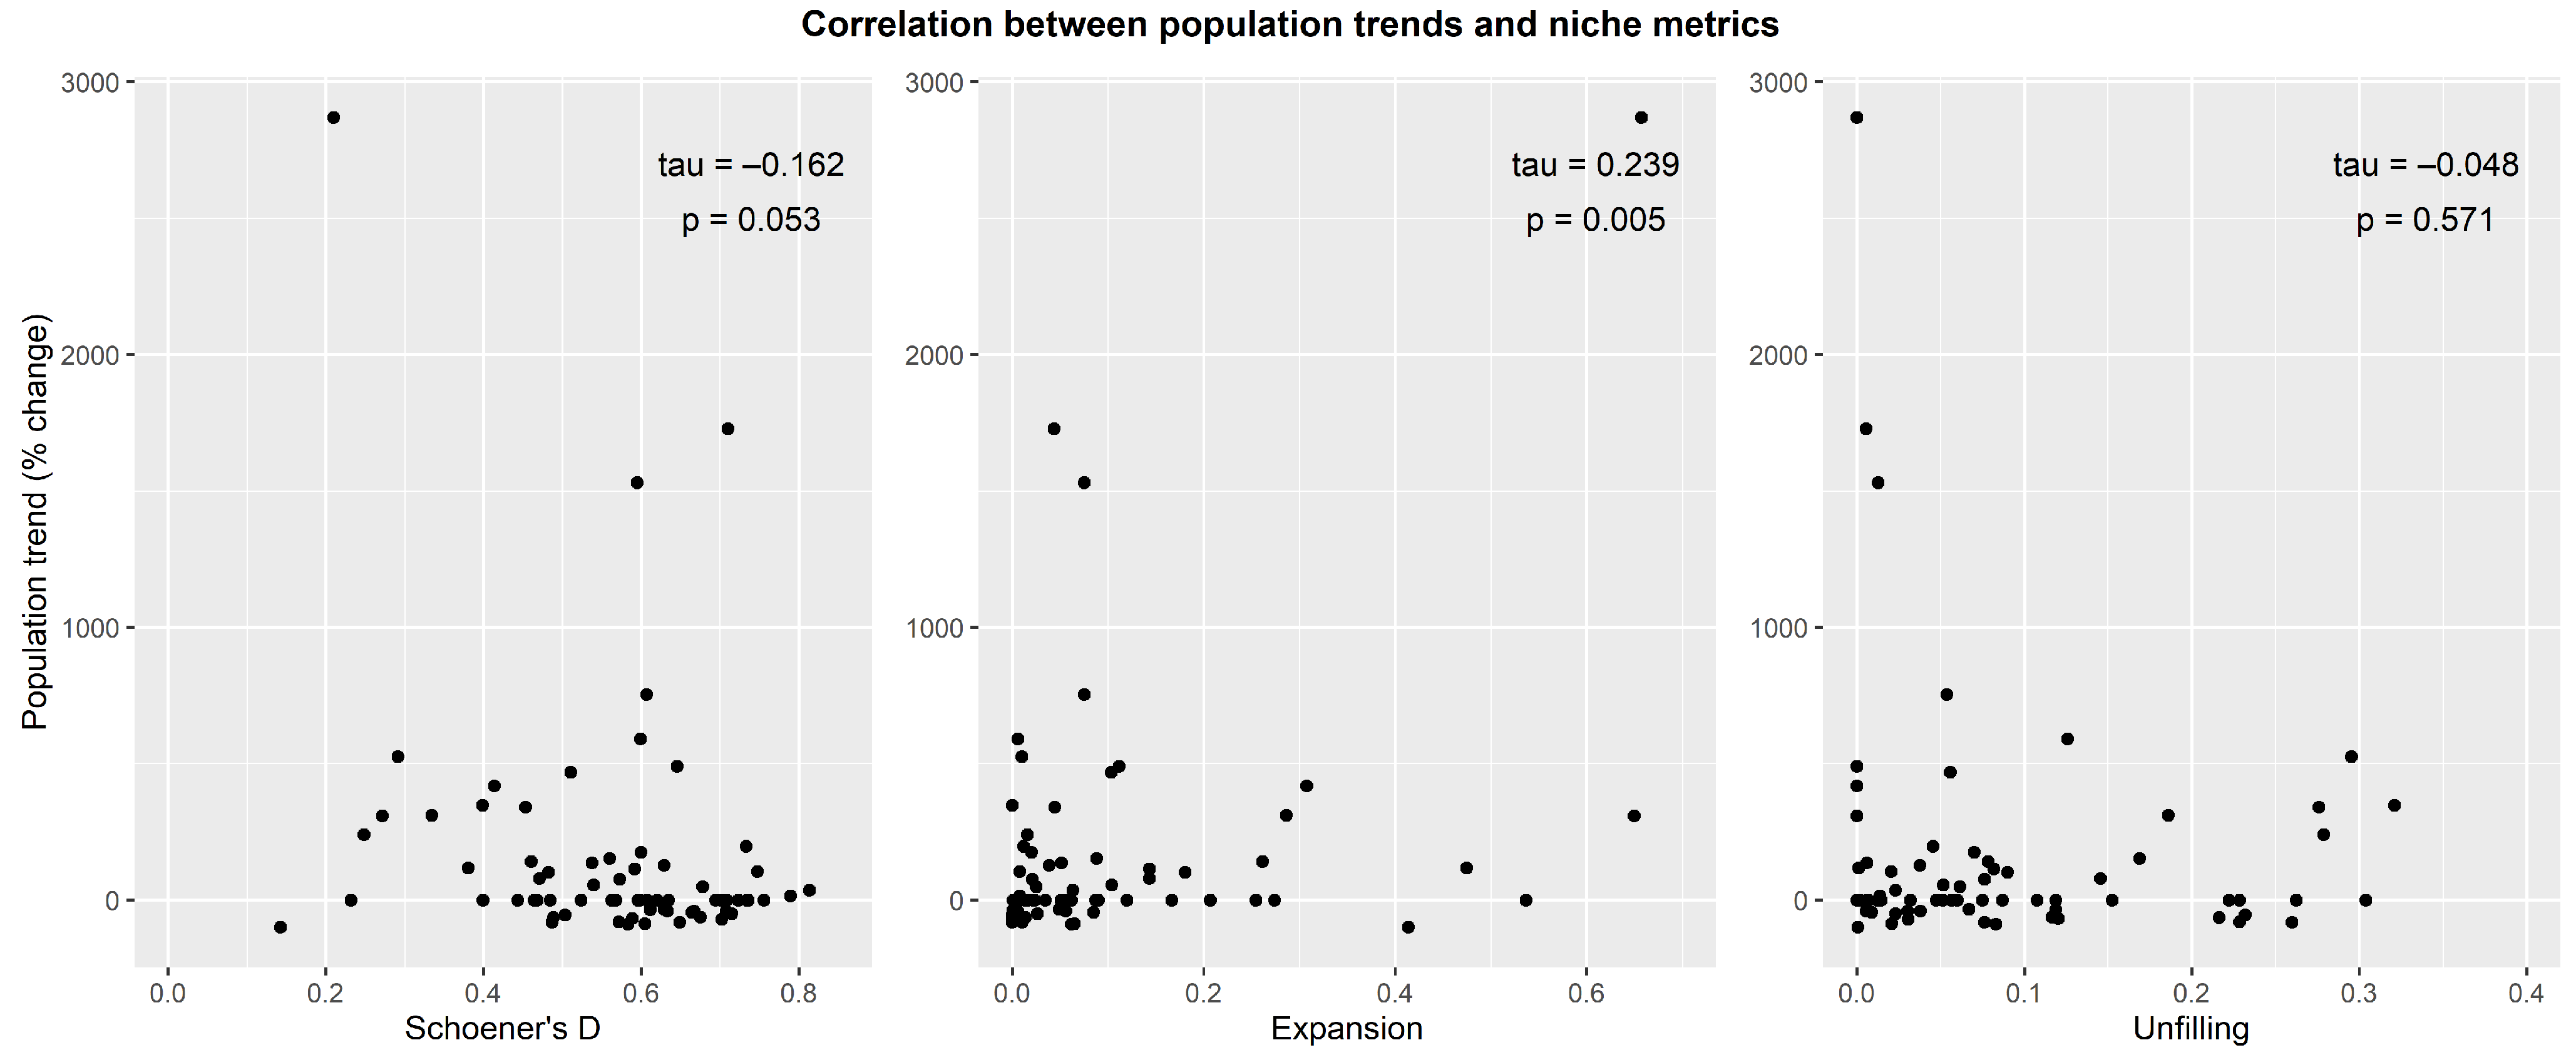
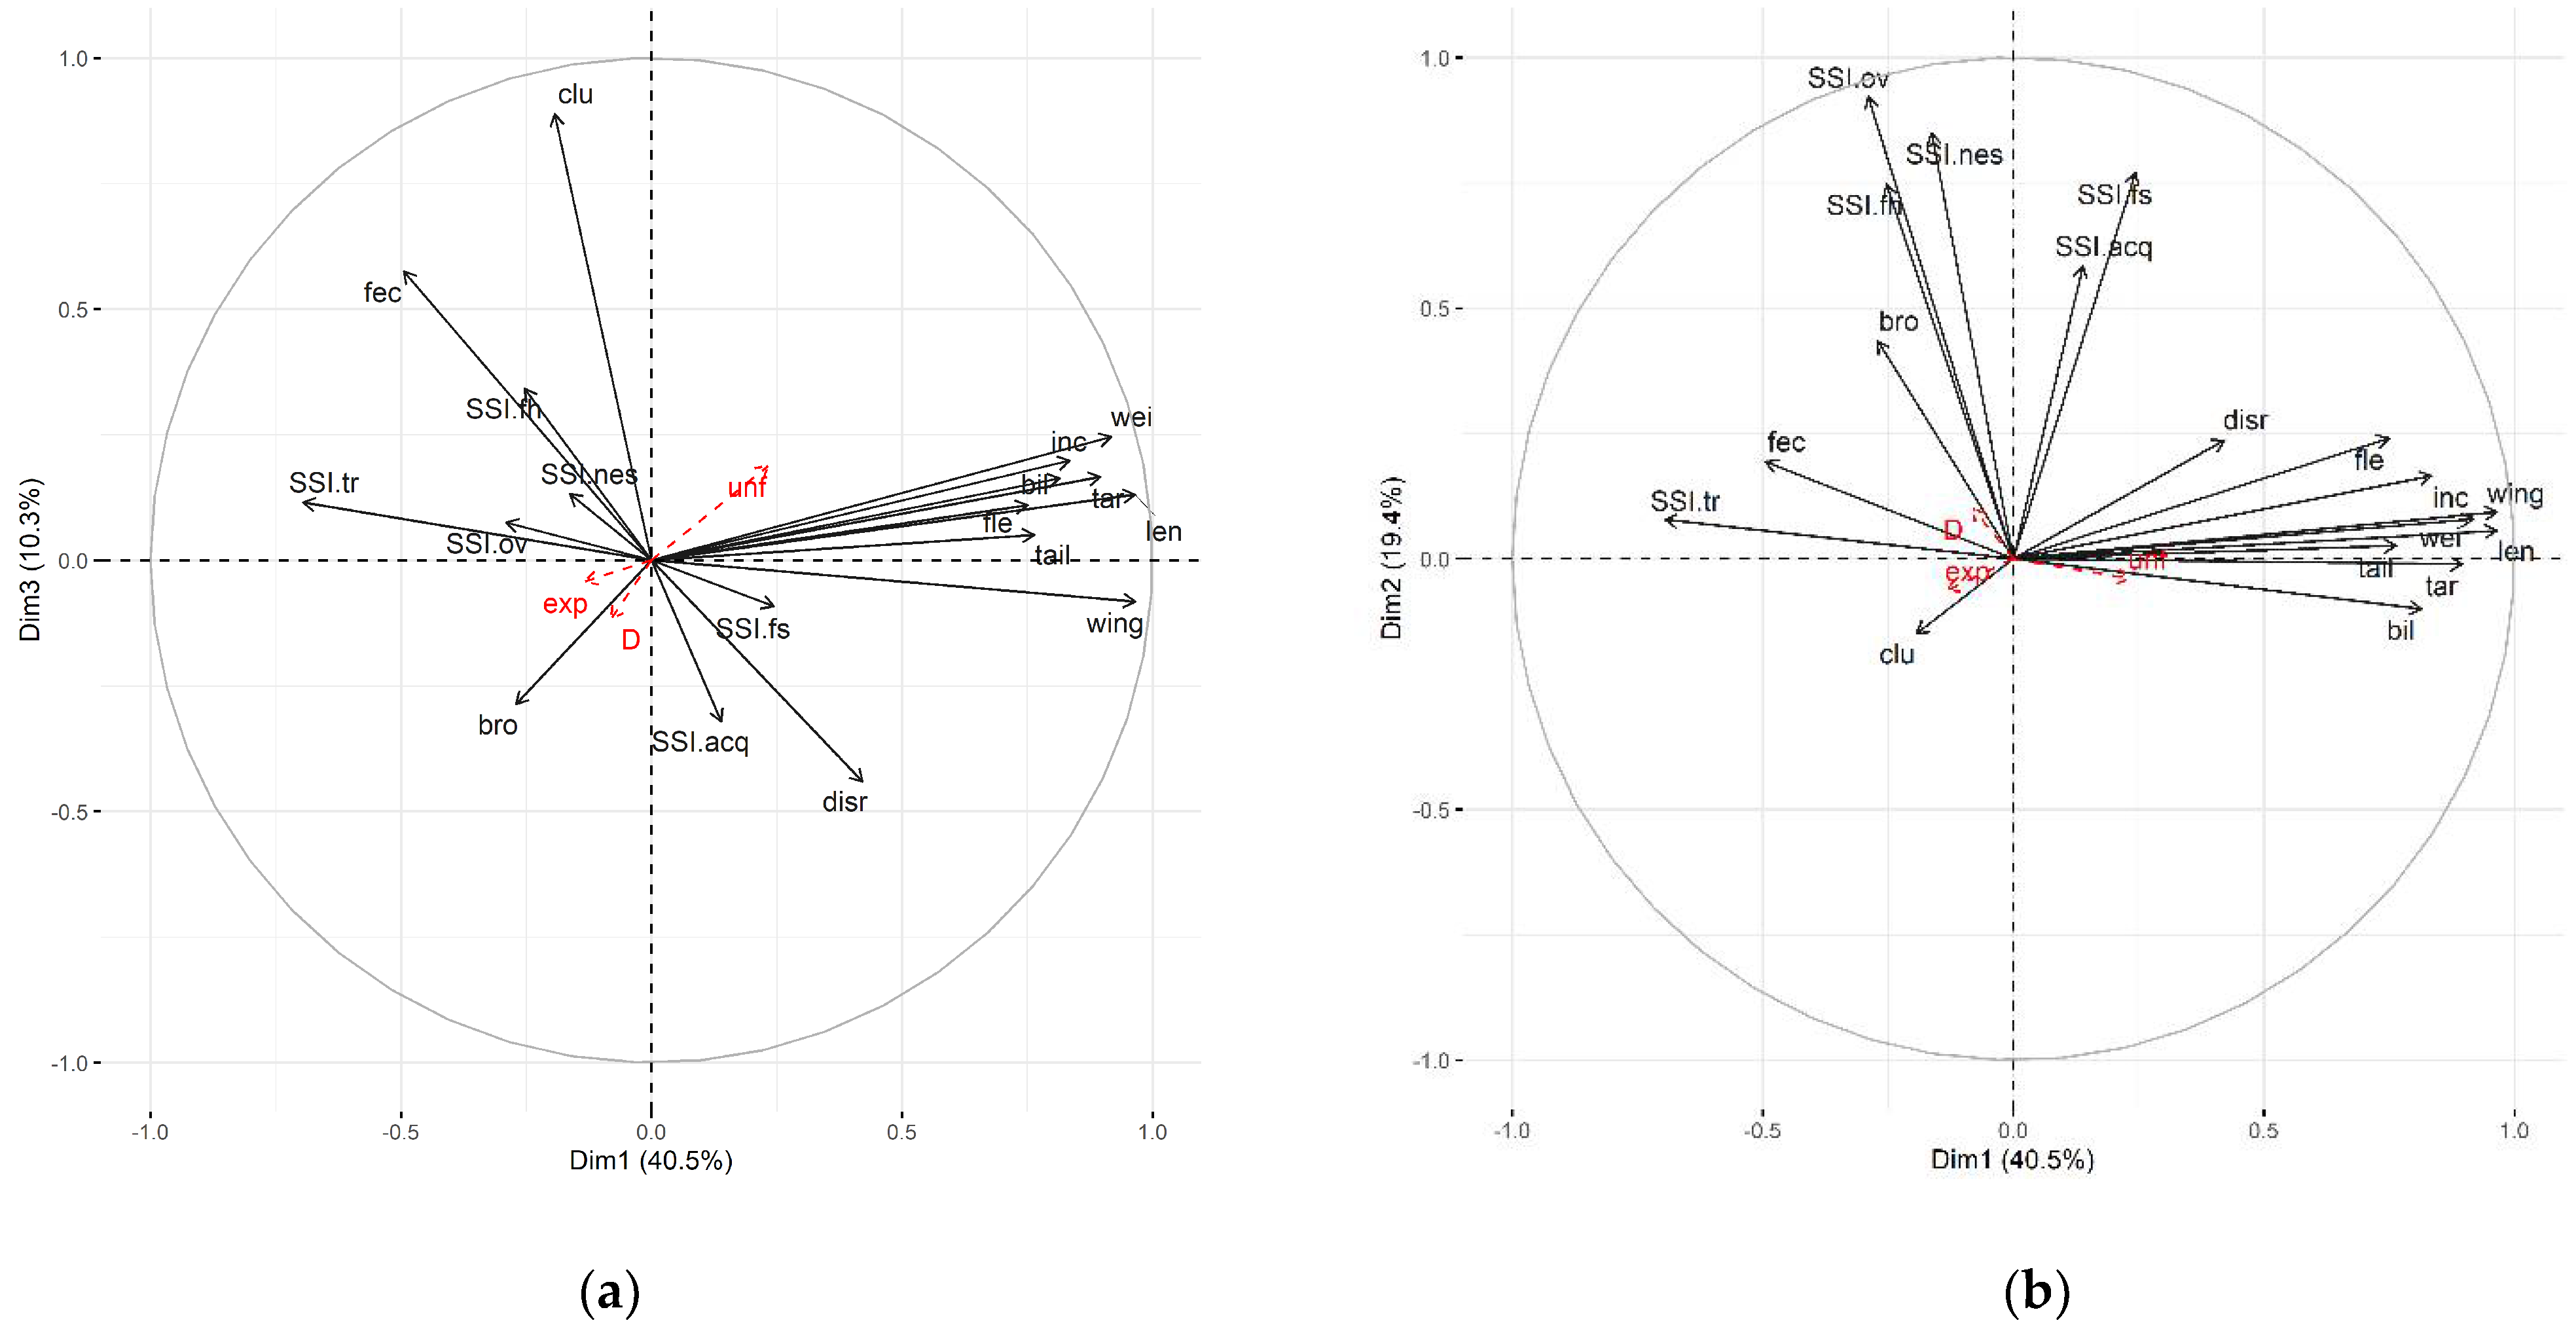
3.2. Relationship between Niche Temporal Changes, Population Trends and Species Traits

A Kendall correlation analysis (Figure 5) highlighted a negative association between the Schoener’s D index and population trends (tau = −0.162), though it was only marginally significant (p-value = 0.053). A moderate significant positive correlation was underlined between population trends and the expansion index (tau = 0.239, p-value = 0.005), while we did not detect any association for the unfilling index (tau = −0.048, p-value = 0.571). The results were consistent even when trends close to the threshold of significance (p-value ≤ 0.10) were not set to zero value (Schoener’s D: tau = −0.164, p-value = 0.049; expansion index: tau = 0.249, p-value = 0.003; unfilling index: tau = −0.070, p-value = 0.403).
Regarding the relationship between niche metrics and continuous traits, PCA reordered them into four principal axes. Dim1 (40.5% of the total variance explained) represented a gradient in body size (positive correlation), Dim2 (19.4%) was related to most of the species specialization indices (positive correlation), Dim3 (10.3%) to clutch size (positive correlation), and Dim4 (7.9%) was positively correlated with the number of broods per year. Dispersal ratio was negatively correlated with both Dim3 and Dim4, and positively correlated with Dim1 (Table S6). Analyses revealed a weak relationship among the niche metrics and the four PCA dimensions (Table S6). Specifically, the unfilling index showed a slight positive correlation with Dim1 (0.23)—i.e., body size—and Dim3 (0.19)—i.e., clutch size—(Figure 6a), and a weak negative correlation with Dim4 (–0.17), thus demonstrating an association with species producing fewer broods (Figure S4a,b). The expansion index resulted in a weak and negative correlation (−0.13) with Dim1—i.e., the higher the expansion, the smaller the body size (Figure 6a,b)—and a weak and positive correlation (0.10) with Dim4—i.e., the higher the expansion, the higher is the number of broods—(Figure S4a,b). The dispersal ratio showed a weak negative association with the expansion index (Figure 6a and Figure S4a) and a non-unidirectional relationship with the unfilling index (Figure 6a). The Schoener’s D highlighted a slight negative correlation (−0.12) with Dim3 (Figure 6a) and a slight positive correlation (0.10) with Dim2 (Figure 6b), the latter suggesting that specialist species tended to retain their niche more than generalist species.
Regarding categorical traits, significant differences were detected for the unfilling index respect to migration strategy (Kruskal–Wallis χ2 = 7.91, df = 2, p-value = 0.019), wherein Dunn’s test highlighted a significant greater unfilling for long-distance compared to short-distance migrants (p-value = 0.020; Figure 7a). Moreover, all niche metrics showed differences with respect to the landscape type (unfilling index: Kruskal–Wallis χ2 = 10.24, df = 3, p-value = 0.017; expansion index: Kruskal–Wallis χ2 = 19.74, df = 3, p-value < 0.001; Schoener’s D index: Kruskal–Wallis χ2 = 13.48, df = 3, p-value = 0.004). Specifically, pairwise comparisons showed a greater unfilling for farmland birds compared to species inhabiting several types of landscapes (group “several”, p-value = 0.014; Figure 7b), and a greater expansion for woodland birds and species inhabiting natural-open habitats compared to farmland species (p-value = 0.010 and p-value < 0.001, respectively; Figure 7c). Finally, species of natural-open habitats showed a lower niche overlap (Schoener’s D) compared to both the group of “farmland” and “several” (p-value = 0.044 and p-value = 0.002, respectively; Figure 7d).

4. Discussion

4.1. Niche Quantification and Temporal Changes

Niche temporal changes of 71 common breeding birds in a wide region of northern Italy over 26 years revealed a high complexity of patterns across species. The equivalency tests supported the niche divergence hypothesis for 23 species (32%). This means that their niche occupancy in the E-space differed between T1 and T2, suggesting that these species changed their niche in relation to the accessible environmental conditions over time. Evidence for niche divergence requires two conditions [78,98]: (1) niche characteristics differ between ranges, and (2) these differences are greater than background environmental divergence. However, Rodriguez-Rodriguez et al. [99] and Cuervo et al. [100] argued that niches are already divergent when found less equivalent than expected by chance—i.e., significant equivalency test—and the niche conservatism hypothesis evaluated by the similarity test is not accepted. In our study, only seven species (Mallard, Common Kestrel, Eurasian Skylark, Dunnock, Song Thrush, Melodius Warbler, and Eurasian Bullfinch) satisfied this criterion, thus showing statistical evidence of niche divergence. For the other 16 of the 23 species, for which the equivalency test supported niche divergence (Table 1), we cannot confirm this hypothesis since the similarity test retained a larger niche similarity. We found strong evidence of niche conservatism (both the equivalency and the similarity tests supported the hypothesis) for the Common Cuckoo, the Eurasian Wren, the European Robin, the Common Blackbird, the Eurasian Blackcap, the Lesser Whitethroat, and the Goldcrest. The first five species occupied a large portion of the available E-space in both periods (Figure S3), showing they were able to use a wide spectrum of climatic and habitat conditions. On one hand, it is possible they did not undergo great ecological pressures in the occupied E-space, on the other hand the environmental changes that occurred in the study area may have not significantly affected their niche because of a large range of environmental tolerance. Conversely, the Goldcrest is a forest specialist species and it is likely less prone to modify its habitat and climatic requirements even under ongoing environmental changes (it is actually the only woodland bird along with the Common Chiffchaff Phylloscopus collybita suffering a population decline in the study area [53]). Regarding the Lesser Whitethroat, we underline that the species showed a Schoener’s D (0.56) just smaller than the overall median, and we did not exclude that the species rarity, especially in the first period (frequency of occurrence = 1%), could have affected the significance of the tests. Caution is in fact recommended when inference is conducted on rare species [44].
The niche dynamic indices, expansion and unfilling provided useful additional information on niche temporal changes. Differently from the Schoener’s D, they assess the niche overlap regardless of the density of occurrence. We observed that 27% and 31% of the species experienced a niche expansion and unfilling greater than 10% (values > 0.1), respectively. Moreover, as highlighted by the correlation analysis between the two indices, species showing an expansion tended to not experience a niche unfilling, and vice versa. Furthermore, our findings suggested that decreasing niche overlap (Schoener’s D) is associated alternatively with niche expansion or unfilling, underlining the role of occupying new habitats, or losing original habitats, in determining differences in the observed niches.
We found an overall shift of the niche centroids towards greater values along PC1. This means a general tendency to experience higher thermal conditions, but the relationship between habitat and climate, often acting in a synergistic way [101,102,103], should be considered. Our study area is characterized by an important altitudinal range (from 2 m to 4000 m a.s.l.), and habitat types, as well as anthropization intensity, are strictly associated with the elevational gradient and thus with temperatures. The characteristics of open and closed habitats differ according to the altitudinal range (e.g., open habitats are essentially wild in uplands while mainly anthropized in lowlands), and such differences must be taken into account to understand niche temporal changes. The general centroids’ shift towards warmer climates can actually depend on several drivers that can be species-specific. Firstly, a species may undergo higher temperatures because of an increase of temperatures in the environment (we found an increase of the average temperature from 9.53 °C to 10.54 °C during the study period in the whole study area; data elaborated from the ECAD dataset [68]). Several studies underlined the ability of birds to track their climatic niche (e.g., [104,105]), while lags may be observed especially under rapid environmental change on a short timescale [34,43,106]. In the presence of such lag-effects, or the absence of niche-tracking for several reasons (e.g., species thermal physiological tolerances, species dispersal ability, habitat availability and landscape connectivity), raising temperatures might result in a passive shift of niche centroids towards warmer climates. Species responses to this phenomenon may be idiosyncratic and difficult to predict [106], although some groups are expected to suffer more than others (e.g., mountain birds [107,108,109,110]). Secondly, a species may move towards lower altitudes, and therefore to warmer climates, in response to fine-scale changes in the habitat structure and characteristics (including anthropogenic ones as forestry management, agricultural practices, intensity of grazing and mowing). For example, we found that the Song Thrush, the Common Firecrest (Regulus ignicapilla), and the Eurasian Bullfinch showed a shift in density of occurrence from high-altitude coniferous to middle and low-altitude mixed and broadleaved forests (Figure S3). Fine-scale changes, not detectable in our study, can directly affect the species occurrence and habitat suitability within a specific type of habitat [84,111]. In addition, modifications in habitat availability due to land uses changes might push a species to track the habitat component of its niche to find similar conditions. In our study, for example, the Mistle Thrush (Turdus viscivorus) moved its centroid towards high-altitude shrublands, maybe as response to an expansion of forests upwards and neo-colonization of wood at the expense of abandoned meadows in uplands [112]. We also remark that some species may have extended their niche towards lower altitudes independently from environmental pressures, but as response of density-dependent factors (e.g., increasing populations, [45] and see Section 4.2) leading to colonize new environments. For example, the Black Redstart (Phoenicurus ochruros), a species originally associated with open-natural habitats, showed a meaningful increment in density of occurrence in closed habitats (mixed and broadleaved forests) and in lowland open habitats (where it colonized human buildings).
Despite we are confident of consistency of our results, we acknowledge that some limitations could affect species niche quantification. Specifically, we could not account for species detection probability because data did not include multiple surveys in the same site. Detection probability may represent an issue when comparing niche across species [113]. However, intra-species niche comparisons are not supposed to be considerably affected by detection probability when comparing niche metrics of a species across different geographic areas [15] or over time. In fact, in the case of a standardized sampling design, the species habitat-specific detection function is supposed to be constant over time [114], and its effect on niche comparison may be considered negligible. Moreover, our data collection and its aggregation into three-year time intervals further reduced the potential noise arising from imperfect detection (see Section 2.1). Measuring the effect of detection probability in niche modeling is certainly an issue that deserves attention in future research.

4.2. Relationship between Nyche Temporal Changes, Population Trends and Species Traits

The assessment of the relationship between niche metrics and population trends highlighted interesting patterns, partially confirming findings from Ralston et al. [45]. We found a positive correlation between population trends and niche expansion, while unfilling did not correlate with trends. Metapopulation theory predicts that in growing metapopulations with many individuals dispersing from local “source” populations, it is likely that local “sink” populations settled in suboptimal environments exist. On the contrary, in declining metapopulations it is probable that only the largest local populations persist in the most suitable environments, but not enough migrants are generated to colonize suboptimal environments and to support local “sink” populations [115,116,117]. However, we cannot exclude that a niche expansion due to stochastic phenomena, interspecific interactions with competitive exclusions, and/or fine-scale increase of habitat quality, could have pushed the species to extend the niche with a positive secondary effect on population size. In any case, some meaningful exceptions can be found for the positive relationship between niche expansion and population trends. We remark that the Eurasian Skylark, the bird undergoing the most negative population trend in Lombardy from 1992 to 2019 [53], showed one of the highest niche expansions during this time interval. In the first period (1992–1995–1996) the niche of the species was limited to open habitats in lowlands (mainly arable lands), while in the second period (2015–2016–2017) it extended in a new portion characterized by open habitats in uplands, though retaining the original core of the niche in lowlands. Changes of agricultural practices perhaps acted as ecological pressures for the species [118,119,120,121], and the fact that the Eurasian Skylark retained the original core area may be due to a partial lag-effect for which the species remains present in unsuitable environments that were previously suitable [122]. Additionally, we do not exclude that the two local populations that seem to emerge may undergo different ecological pressures leading to divergent population dynamics between the two areas. This example highlights the importance of integrating demographic responses with niche temporal changes, especially to implement conservation efforts and actions for threatened species.
Ralston et al. [45] reported a significant relationship between niche unfilling and bird trends for the realized climatic niche in 46 birds breeding in North America. By also including habitat characteristics in our niche modeling, we did not find any association. Overlooking the fact that our study was carried out in a different biogeographic area and at very smaller spatial scale, increasing the complexity of the niche multidimensional space can reveal different patterns. Embracing this complexity can be the key to a better interpretation of the niche-trend relationship. Niche shifts in the occupied E-space—i.e., unfilling followed by expansion—could also mask the actual relationship between unfilling and population trends, but the negative correlation emerged between the unfilling and the expansion indices suggests excluding this hypothesis. We also found a negative correlation between the niche overlap and population trends very close to the significance threshold (p-value = 0.053). This finding might suggest that species tending to retain their niche more than others (in terms of niche occupancy within the E-space), may be more prone to demographic declines. This static response may represent a drawback when changes occur in the environment or in interspecific relationships, leading to population decline in a long-term perspective. Finally, dispersal limitation, depending on habitat configuration but also on species-specific characteristics, may play a crucial role in metapopulation and niche changes [117], and integrating this parameter in the modeling framework may improve our ability to understand this complex relation.
Regarding our last question, results highlighted a moderate relationship between niche temporal changes and species traits. Overall, the unfilling index was the most related with continuous traits. Findings suggested that birds with larger body size are more related with niche unfilling compared to smaller species. Large-bodied species have generally smaller population sizes, lower reproductive rates, and larger home or geographic range requirements than small-bodied species; moreover, they typically occupy higher trophic levels [123]. All of these characteristics make these species more prone to extinction [124,125], and understanding their niche changes could provide important insights to enhance conservation strategies.
Interesting findings also emerged for the relationship between unfilling and the reproduction-related traits (number of broods per year, average clutch size, fecundity). Niche unfilling grew with increasing clutch size—average number of eggs laid within a single brood—and with decreasing number of broods per year. It may suggest that species investing much effort in increasing the number of broods, rather than producing more eggs per brood, might be more adaptable to environmental changes and may be able to expand their niche. However, annual fecundity—a product of clutch size and number of broods [88]—did not show a straightforward relationship with niche unfilling, and further studies should investigate the issue.
Dispersal ratio, a surrogate of species mobility and dispersal ability [89,90], showed that species with higher dispersal ability would not tend to expand the niche, but findings were inconclusive in respect to unfilling. We also have to consider that the dispersal ratio could be an inappropriate indicator of the dispersal ability [64,126], as well as that habitat configuration and landscape connectivity significantly affect the dispersal process [127], leading to idiosyncratic responses between species. Regarding the degree of species specialization (Dim2 of PCA), niche metrics were not linked with it, although a weak signal showed that specialist birds tend to retain their niche more than generalist ones. It supports the hypothesis that specialists require a narrow combination of environmental characteristics [128], and they are less prone to modify their ecological needs in response to environmental change [65].
Concerning the categorical ecological traits, neither nest type nor diet showed a relationship with niche metrics. Conversely, long-distance migrants—wintering in Sub-Saharan Africa—showed a higher niche unfilling compared to short-distance migrants—wintering in Europe or North Africa—and sedentary species, although statistically significant differences emerged only in the first comparison. Phenological mismatch [129,130] may represent a putative driver for long-distance migrants. Despite the fact that species can attempt to adjust to advancement in spring phenophases through behavioral plasticity, for example, by a reduction in time between arrival and breeding [131] or anticipating the breeding ground arrival [132,133], these adjustments may remain insufficient to track phenological shift [129,134,135]. Mismatches might lead, for example, to an asynchrony between food availability and species demand, generating spatially consistent directional selection on timing, which could promote rapid evolutionary change [135]. Moreover, prey availability may affect habitat suitability, as recently documented in raptors [136], leading to potential niche mismatch over time. Under climate and environmental changes, long-distance migrants may be outcompeted by sedentary species having similar niches, due to the residents’ ability to better judge the onset of the breeding season [137]. Such effects could affect long-distance migrants more than short-distance ones, which may be more capable of anticipating breeding ground conditions due to the proximity of their wintering areas to the breeding areas [138]. In addition, niches could differ between wintering and breeding grounds [58], with separate dynamics over time also due to different drivers acting in wintering and breeding areas [139]. Exploring long-term niche dynamics throughout several phases of the annual cycle (breeding, migration, wintering) represents a key point to look at for future research.
We also found that species inhabiting natural-open landscapes (which are all birds inhabiting mountain areas) and woodland birds underwent a higher niche expansion in respect to farmland species. Overall, birds of natural-open habitats extended the niche along the open-closed habitat gradient, within the limit of their ecological requirements, as well as towards greater thermal conditions (see Section 4.1 for discussion on this point) and, as in the case of the Black Redstart, towards lowlands. Within woodland species, the direction of expansion showed a large interspecific variability. Some species extend the niche towards different type of forests (e.g., the Eurasian Bullfinch), other towards multiple directions of the available E-space (e.g., the Eurasian Nuthatch Sitta europaea) or along boundaries of the niche (e.g., the Common Chiffchaff). Forest species populations are increasing in Lombardy [53]. This can further support the hypothesis that population demography may act as a driver to affect niche expansion over time. On the contrary, farmland birds experienced a greater niche unfilling compared to species inhabiting several types of landscapes. Farmland birds are negatively influenced by intensification of agricultural practices [140]. They could suffer fine-scale environmental changes (e.g., grazing intensity, mowing, use of pesticides, land consolidation) affecting habitat suitability, as well as a reduction of available habitats because of the reduction of agricultural lands that occurred in our study area over the considered period. Finally, the greater niche overlap of species inhabiting several types of landscapes and farmland birds compared to species of natural-open landscapes may reflect a larger environmental tolerance for the first group and more niche fidelity for the second group, leading, in the latter case, to an overall niche unfilling when environmental changes occurred.

5. Conclusions

Even though the study of long-term species niche dynamic could provide crucial information for investigating species responses to environmental changes, it is a poorly investigated topic in ecology. Our results provided evidence of the complexity of patterns in niche temporal changes across 71 birds breeding in a temperate region. Results supported niche divergence (equivalency test) for 32% of species, although two-thirds were not supported by the similarity test. We highlighted a general tendency to adjust the niche centroids towards warmer thermal conditions, which may depend on several drivers acting in an idiosyncratic way between species. Embracing different niche metrics, as well as tests for niche inference, is essential to understand niche changes.
To date, a totally overlooked aspect is the potential relationship between niche changes and population trends (but see [44,45]) and species traits (but see [57,58]). We found a positive association between niche expansion and increasing populations, and a signal that species retaining their niche over time could be more prone to undergo population declines. Moreover, we found moderate evidence for a non-random association between niche changes and species traits, especially for body size, clutch size, number of broods per year, inhabited landscape type, and migration strategy.
We encourage the implementation of studies incorporating long-term population trends and niche dynamics with a focus on cause-effect relationship. Moreover, we highlight the importance of enhancing knowledge about the role of species traits in determining niche changes over time, but also working at the single-species level due to the specificity of responses. Implementing the modeling framework by including the potential variations of niche throughout several phases of annual cycle (breeding, migration, wintering), bionomic variables (biotic interactions and resource-consumer dynamics [47,141]), and dispersal dynamics represents a crucial point. We believe that this research roadmap could provide meaningful insights to improve conservation plans aimed at preserving threatened species and biodiversity.

Supplementary Materials

The following are available online at https://www.mdpi.com/article/10.3390/birds3010011/s1, Table S1: Land-cover variables used in PCA (E-space), Table S2: List of species traits and referencing literature, Table S3: Coordinates of each variable respect to the PCA-axes (E-space), Figure S1: Contribution of each variable (%) to PC1 (a) and PC2 (b) (E-space), Table S4: Niche breadth and centroid for each species along the PCA-axes (E-space) in T1 and T2, Figure S2: Notched box plots of niche breadth and centroid for each PCA-axis (E-space) in T1 and T2, Figure S3: Niche quantification in the E-space for each species in T1 (1992–95–96) and T2 (2015–16–17) and niche changes between the two periods, Table S5: Schoener’s D, expansion and unfilling index for each species, Table S6: Coordinates of the 18 continuous species traits and of niche metrics respect to the four retained PCA axes (trait space), Figure S4: Biplots between niche metrics and PCA axes (trait space). (a) Dim1-Dim4. (b) Dim3-Dim4.

Author Contributions

Conceptualization, P.T., V.O., O.D., and L.B.; methodology, P.T., V.O., and O.D.; formal analysis, P.T.; investigation, V.O., and L.B; data curation, P.T., V.O., and L.B.; writing—original draft preparation, P.T.; writing—review and editing, P.T., V.O., O.D., and L.B. All authors have read and agreed to the published version of the manuscript.

Funding

This study was co-funded by the General Directorate for Agriculture of the Lombardy Region (D.G. Agricoltura della Regione Lombardia), the Regional Agency for Agricultural and Forestry Development (ERSAF, Ente Regionale per lo Sviluppo Agricolo e Forestale), and the Research Fund of the University of Milano-Bicocca.

Institutional Review Board Statement

Not applicable.

Informed Consent Statement

Not applicable.

Data Availability Statement

Restrictions apply to the availability of data. Part of the data was obtained from the General Directorate for Agriculture of the Lombardy Region and part was collected by authors. Full dataset is available at the Department of Earth and Environmental Sciences, University of Milan-Bicocca, Piazza della Scienza 1, 20126, Milan, Italy, upon request to the corresponding author, after the permission from the General Directorate for Agriculture of the Lombardy Region.

Acknowledgments

We thank the surveyors that contributed to data collection, and all bachelor’s and master’s degree students for their help in field surveys and data digitalization.

Conflicts of Interest

The authors declare no conflict of interest.

References

  1. Hutchinson, G.E. Concluding remarks. Cold Spring Harb. Symp. Quant. Biol. 1957, 22, 415–427. [Google Scholar] [CrossRef]
  2. Grinnell, J. Barriers to distribution as regards birds and mammals. Am. Nat. 1914, 48, 248–254. [Google Scholar] [CrossRef]
  3. Grinnell, J. The niche-relationships of the California Thrasher. Auk 1917, 34, 427–433. [Google Scholar] [CrossRef]
  4. Soberón, J. Grinnellian and eltonian niches and geographic distributions of species. Ecol. Lett. 2007, 10, 1115–1123. [Google Scholar] [CrossRef] [PubMed]
  5. Soberón, J.; Nakamura, M. Niches and distributional areas: Concepts, methods, and assumptions. Proc. Natl. Acad. Sci. USA 2009, 106, 19644–19650. [Google Scholar] [CrossRef] [PubMed] [Green Version]
  6. Wiens, J.J.; Graham, C.H. Niche conservatism: Integrating evolution, ecology, and conservation biology. Annu. Rev. Ecol. Evol. Syst. 2005, 36, 519–539. [Google Scholar] [CrossRef] [Green Version]
  7. Pearman, P.B.; Guisan, A.; Broennimann, O.; Randin, C.F. Niche dynamics in space and time. Trends Ecol. Evol. 2008, 23, 149–158. [Google Scholar] [CrossRef] [PubMed]
  8. Petitpierre, B.; Kueffer, C.; Broennimann, O.; Randin, C.; Daehler, C.; Guisan, A. Climatic niche shifts are rare among terrestrial plant invaders. Science 2012, 335, 1344–1348. [Google Scholar] [CrossRef] [PubMed] [Green Version]
  9. Strubbe, D.; Broennimann, O.; Chiron, F.; Matthysen, E. Niche conservatism in non-native birds in Europe: Niche unfilling rather than niche expansion. Glob. Ecol. Biogeogr. 2013, 22, 962–970. [Google Scholar] [CrossRef]
  10. Breiner, F.T.; Guisan, A.; Nobis, M.P.; Bergamini, A. Including environmental niche information to improve IUCN Red List assessments. Divers. Distrib. 2017, 23, 484–495. [Google Scholar] [CrossRef] [Green Version]
  11. Mothes, C.C.; Stroud, J.T.; Clements, S.L.; Searcy, C.A. Evaluating ecological niche model accuracy in predicting biotic invasions using South Florida’s exotic lizard community. J. Biogeogr. 2019, 46, 432–441. [Google Scholar] [CrossRef]
  12. Rather, T.A.; Kumar, S.; Khan, J.A. Multi-scale habitat modelling and predicting change in the distribution of tiger and leopard using random forest algorithm. Sci. Rep. 2020, 10, 11473. [Google Scholar] [CrossRef] [PubMed]
  13. Zink, R.M.; Botero-Cañola, S.; Martinez, H.; Herzberg, K.M. Niche modeling reveals life history shifts in birds at La Brea over the last twenty millennia. PLoS ONE 2020, 15, e0227361. [Google Scholar] [CrossRef] [PubMed]
  14. Ahmadi, M.; Hemami, M.-R.; Kaboli, M.; Nazarizadeh, M.; Malekian, M.; Behrooz, R.; Geniez, P.; Alroy, J.; Zimmermann, N.E. The legacy of Eastern Mediterranean mountain uplifts: Rapid disparity of phylogenetic niche conservatism and divergence in mountain vipers. BMC Ecol. Evol. 2021, 21, 130. [Google Scholar] [CrossRef] [PubMed]
  15. Liordos, V.; Jokimäki, J.; Kaisanlahti-Jokimäki, M.-L.; Valsamidis, E.; Kontsiotis, V.J. Niche analysis and conservation of bird species using urban core areas. Sustainability 2021, 13, 6327. [Google Scholar] [CrossRef]
  16. Losos, J.B. Phylogenetic niche conservatism, phylogenetic signal and the relationship between phylogenetic relatedness and ecological similarity among species. Ecol. Lett. 2008, 11, 995–1003. [Google Scholar] [CrossRef]
  17. Broennimann, O.; Ursenbacher, S.; Meyer, A.; Golay, P.; Monney, J.-C.; Schmocker, H.; Guisan, A.; Dubey, S. Influence of climate on the presence of colour polymorphism in two montane reptile species. Biol. Lett. 2014, 10, 20140638. [Google Scholar] [CrossRef] [PubMed] [Green Version]
  18. Moreno-Contreras, I.; Sánchez-González, L.A.; Arizmendi, M.C.; Prieto-Torres, D.A.; Navarro-Sigüenza, A.G. Climatic niche evolution in the Arremon brunneinucha complex (Aves: Passerellidae) in a mesoamerican landscape. Evol. Biol. 2020, 47, 123–132. [Google Scholar] [CrossRef]
  19. Sillero, N.; Argaña, E.; Matos, C.; Franch, M.; Kaliontzopoulou, A.; Carretero, M.A. Local segregation of realised niches in lizards. ISPRS Int. J. Geo-Inf. 2020, 9, 764. [Google Scholar] [CrossRef]
  20. Escoriza, D.; Pascual, G.; Mestre, L. Climate and habitat niche diversification in a southwest European squamate assemblage. Evol. Ecol. 2021, 35, 761–777. [Google Scholar] [CrossRef]
  21. Hending, D. Niche-separation and conservation biogeography of Madagascar’s fork-marked lemurs (Cheirogaleidae: Phaner): Evidence of a new cryptic species? Glob. Ecol. Conserv. 2021, 29, e01738. [Google Scholar] [CrossRef]
  22. Lin, X.; Shih, C.; Hou, Y.; Shu, X.; Zhang, M.; Hu, J.; Jiang, J.; Xie, F. Climatic-niche evolution with key morphological innovations across clades within Scutiger boulengeri (Anura: Megophryidae). Ecol. Evol. 2021, 11, 10353–10368. [Google Scholar] [CrossRef] [PubMed]
  23. Liu, H.; Jacquemyn, H.; Chen, W.; Janssens, S.B.; He, X.; Yu, S.; Huang, Y. Niche evolution and historical biogeography of lady slipper orchids in North America and Eurasia. J. Biogeogr. 2021, 48, 2727–2741. [Google Scholar] [CrossRef]
  24. Broennimann, O.; Mráz, P.; Petitpierre, B.; Guisan, A.; Müller-Schärer, H. Contrasting spatio-temporal climatic niche dynamics during the eastern and western invasions of spotted knapweed in North America. J. Biogeogr. 2014, 41, 1126–1136. [Google Scholar] [CrossRef] [Green Version]
  25. Li, Y.; Liu, X.; Li, X.; Petitpierre, B.; Guisan, A. Residence time, expansion toward the equator in the invaded range and native range size matter to climatic niche shifts in non-native species. Glob. Ecol. Biogeogr. 2014, 23, 1094–1104. [Google Scholar] [CrossRef]
  26. Jänes, H.; Herkül, K.; Kotta, J. Environmental niche separation between native and non-native benthic invertebrate species: Case study of the northern Baltic Sea. Mar. Environ. Res. 2017, 131, 123–133. [Google Scholar] [CrossRef] [PubMed]
  27. Louppe, V.; Leroy, B.; Herrel, A.; Veron, G. Current and future climatic regions favourable for a globally introduced wild carnivore, the raccoon Procyon lotor. Sci. Rep. 2019, 9, 9174. [Google Scholar] [CrossRef] [Green Version]
  28. Changjun, G.; Yanli, T.; Linshan, L.; Bo, W.; Yili, Z.; Haibin, Y.; Xilong, W.; Zhuoga, Y.; Binghua, Z.; Bohao, C. Predicting the potential global distribution of Ageratina adenophora under current and future climate change scenarios. Ecol. Evol. 2021, 11, 12092–12113. [Google Scholar] [CrossRef]
  29. Liu, C.; Wolter, C.; Xian, W.; Jeschke, J.M. Most invasive species largely conserve their climatic niche. Proc. Natl. Acad. Sci. USA 2020, 117, 23643–23651. [Google Scholar] [CrossRef]
  30. Olivera, L.; Minghetti, E.; Montemayor, S.I. Ecological niche modeling (ENM) of Leptoglossus clypealis a new potential global invader: Following in the footsteps of Leptoglossus occidentalis? Bull. Entomol. Res. 2021, 111, 289–300. [Google Scholar] [CrossRef]
  31. Tang, X.; Yuan, Y.; Liu, X.; Zhang, J. Potential range expansion and niche shift of the invasive Hyphantria cunea between native and invasive countries. Ecol. Entomol. 2021, 46, 910–925. [Google Scholar] [CrossRef]
  32. Zachariah Atwater, D.; Barney, J.N. Climatic niche shifts in 815 introduced plant species affect their predicted distributions. Glob. Ecol. Biogeogr. 2021, 30, 1671–1684. [Google Scholar] [CrossRef]
  33. Guisan, A.; Thuiller, W. Predicting species distribution: Offering more than simple habitat models. Ecol. Lett. 2005, 8, 993–1009. [Google Scholar] [CrossRef]
  34. Devictor, V.; Julliard, R.; Couvet, D.; Jiguet, F. Birds are tracking climate warming, but not fast enough. Proc. R. Soc. B Biol. Sci. 2008, 275, 2743–2748. [Google Scholar] [CrossRef] [Green Version]
  35. Reino, L.; Triviño, M.; Beja, P.; Araújo, M.B.; Figueira, R.; Segurado, P. Modelling landscape constraints on farmland bird species range shifts under climate change. Sci. Total Environ. 2018, 625, 1596–1605. [Google Scholar] [CrossRef]
  36. Jose, V.S.; Nameer, P.O. The expanding distribution of the Indian Peafowl (Pavo cristatus) as an indicator of changing climate in Kerala, southern India: A modelling study using MaxEnt. Ecol. Indic. 2020, 110, 105930. [Google Scholar] [CrossRef]
  37. Bladon, A.J.; Donald, P.F.; Collar, N.J.; Denge, J.; Dadacha, G.; Wondafrash, M.; Green, R.E. Climatic change and extinction risk of two globally threatened Ethiopian endemic bird species. PLoS ONE 2021, 16, e0249633. [Google Scholar] [CrossRef]
  38. Sierra-Morales, P.; Rojas-Soto, O.; Ríos-Muñoz, C.A.; Ochoa-Ochoa, L.M.; Flores-Rodríguez, P.; Almazán-Núñez, R.C. Climate change projections suggest severe decreases in the geographic ranges of bird species restricted to Mexican humid mountain forests. Glob. Ecol. Conserv. 2021, 30, e01794. [Google Scholar] [CrossRef]
  39. Peterson, A.T.; Soberón, J.; Sánchez-Cordero, V. Conservatism of ecological niches in evolutionary time. Science 1999, 285, 1265–1267. [Google Scholar] [CrossRef]
  40. Peterson, A.T. Ecological niche conservatism: A time-structured review of evidence. J. Biogeogr. 2011, 38, 817–827. [Google Scholar] [CrossRef]
  41. Medley, K.A. Niche shifts during the global invasion of the Asian tiger mosquito, Aedes albopictus Skuse (Culicidae), revealed by reciprocal distribution models. Glob. Ecol. Biogeogr. 2010, 19, 122–133. [Google Scholar] [CrossRef]
  42. Lauzeral, C.; Leprieur, F.; Beauchard, O.; Duron, Q.; Oberdorff, T.; Brosse, S. Identifying climatic niche shifts using coarse-grained occurrence data: A test with non-native freshwater fish. Glob. Ecol. Biogeogr. 2011, 20, 407–414. [Google Scholar] [CrossRef]
  43. Sutton, W.B.; Barrett, K.; Moody, A.T.; Loftin, C.S.; de Maynadier, P.G.; Nanjappa, P. Predicted changes in climatic niche and climate refugia of conservation priority salamander species in the Northeastern United States. Forests 2015, 6, 1–26. [Google Scholar] [CrossRef]
  44. Ralston, J.; DeLuca, W.V.; Feldman, R.E.; King, D.I. Realized climate niche breadth varies with population trend and distribution in North American birds. Glob. Ecol. Biogeogr. 2016, 25, 1173–1180. [Google Scholar] [CrossRef]
  45. Ralston, J.; DeLuca, W.V.; Feldman, R.E.; King, D.I. Population trends influence species ability to track climate change. Glob. Chang. Biol. 2017, 23, 1390–1399. [Google Scholar] [CrossRef]
  46. Sauer, J.R.; Pardieck, K.L.; Ziolkowski, D.J., Jr.; Smith, A.C.; Hudson, M.-A.R.; Rodriguez, V.; Berlanga, H.; Niven, D.K.; Link, W.A. The first 50 years of the North American breeding bird survey. Condor Ornithol. Appl. 2017, 119, 576–593. [Google Scholar] [CrossRef]
  47. Hutchinson, G.E. An Introduction to Population Ecology; Yale University Press: New Haven, CT, USA, 1978. [Google Scholar]
  48. Cheeseman, A.E.; Tanis, B.P.; Finck, E.J. Quantifying temporal variation in dietary niche to reveal drivers of past population declines. Funct. Ecol. 2021, 35, 930–941. [Google Scholar] [CrossRef]
  49. Sullivan, M.J.P.; Newson, S.E.; Pearce-Higgins, J.W. Using habitat-specific population trends to evaluate the consistency of the effect of species traits on bird population change. Biol. Conserv. 2015, 192, 343–352. [Google Scholar] [CrossRef]
  50. Rocchia, E.; Luppi, M.; Dondina, O.; Orioli, V.; Bani, L. Can the effect of species ecological traits on birds’ altitudinal changes differ between geographic areas? Acta Oecol. 2018, 92, 26–34. [Google Scholar] [CrossRef]
  51. Bowler, D.E.; Heldbjerg, H.; Fox, A.D.; de Jong, M.; Böhning-Gaese, K. Long-term declines of European insectivorous bird populations and potential causes. Conserv. Biol. 2019, 33, 1120–1130. [Google Scholar] [CrossRef]
  52. Kamp, J.; Frank, C.; Trautmann, S.; Busch, M.; Dröschmeister, R.; Flade, M.; Gerlach, B.; Karthäuser, J.; Kunz, F.; Mitschke, A.; et al. Population trends of common breeding birds in Germany 1990–2018. J. Ornithol. 2021, 162, 1–15. [Google Scholar] [CrossRef]
  53. Tirozzi, P.; Orioli, V.; Dondina, O.; Kataoka, L.; Bani, L. Species traits drive long-term population trends of common breeding birds in northern Italy. Animals 2021, 11, 3426. [Google Scholar] [CrossRef]
  54. Pigot, A.L.; Sheard, C.; Miller, E.T.; Bregman, T.P.; Freeman, B.G.; Roll, U.; Seddon, N.; Trisos, C.H.; Weeks, B.C.; Tobias, J.A. Macroevolutionary convergence connects morphological form to ecological function in birds. Nat. Ecol. Evol. 2020, 4, 230–239. [Google Scholar] [CrossRef]
  55. Pelegrin, N.; Winemiller, K.O.; Vitt, L.J.; Fitzgerald, D.B.; Pianka, E.R. How do lizard niches conserve, diverge or converge? Further exploration of saurian evolutionary ecology. BMC Ecol. Evol. 2021, 21, 149. [Google Scholar] [CrossRef]
  56. Shaner, P.-J.L.; Chen, Y.-K.; Hsu, Y.-C. Niche–trait relationships at individual and population level in three co-occurring passerine species. Ecol. Evol. 2021, 11, 7378–7389. [Google Scholar] [CrossRef]
  57. Zurell, D.; Gallien, L.; Graham, C.H.; Zimmermann, N.E. Do long-distance migratory birds track their niche through seasons? J. Biogeogr. 2018, 45, 1459–1468. [Google Scholar] [CrossRef]
  58. Schumm, Y.R.; Metzger, B.; Neuling, E.; Austad, M.; Galea, N.; Barbara, N.; Quillfeldt, P. Year-round spatial distribution and migration phenology of a rapidly declining trans-Saharan migrant—Evidence of winter movements and breeding site fidelity in European turtle doves. Behav. Ecol. Sociobiol. 2021, 75, 152. [Google Scholar] [CrossRef]
  59. ERSAF. Uso del Suolo in Regione Lombardia. I Dati DUSAF, Destinazione d’Uso dei Suoli Agricoli e Forestali. 2018. Available online: https://www.geoportale.regione.lombardia.it/ (accessed on 21 September 2021).
  60. ERSAF. Uso del Suolo in Regione Lombardia. I Dati DUSAF, Destinazione d’Uso dei Suoli Agricoli e Forestali. 1999. Available online: https://www.geoportale.regione.lombardia.it/ (accessed on 21 September 2021).
  61. Bani, L.; Massimino, D.; Orioli, V.; Bottoni, L.; Massa, R. Assessment of population trends of common breeding birds in Lombardy, Northern Italy, 1992–2007. Ethol. Ecol. Evol. 2009, 21, 27–44. [Google Scholar] [CrossRef]
  62. Blondel, J.; Ferry, C.; Frochot, B. Point counts with unlimited distance. Stud. Avian Biol. 1981, 6, 414–420. [Google Scholar]
  63. Fornasari, L.; Bani, L.; De Carli, E.; Massa, R. Optimum design in monitoring common birds and their habitat. Gibier Faune Sauvag. 1998, 15, 309–322. [Google Scholar]
  64. Dondina, O.; Orioli, V.; Tirozzi, P.; Bani, L. Long-term dynamic of nestedness in bird assemblages inhabiting fragmented landscapes. Landsc. Ecol. 2022. [Google Scholar] [CrossRef]
  65. Dondina, O.; Orioli, V.; D’Occhio, P.; Luppi, M.; Bani, L. How does forest species specialization affect the application of the island biogeography theory in fragmented landscapes? J. Biogeogr. 2017, 44, 1041–1052. [Google Scholar] [CrossRef]
  66. Bani, L.; Luppi, M.; Rocchia, E.; Dondina, O.; Orioli, V. Winners and losers: How the elevational range of breeding birds on Alps has varied over the past four decades due to climate and habitat changes. Ecol. Evol. 2019, 9, 1289–1305. [Google Scholar] [CrossRef] [PubMed] [Green Version]
  67. Fuller, R.J.; Langslow, D.R. Estimating numbers of birds by point counts: How long should counts last? Bird Study 1984, 31, 195–202. [Google Scholar] [CrossRef]
  68. European Climate Assessment & Dataset, ECAD, Version 23.1e. Available online: https://surfobs.climate.copernicus.eu/dataaccess/access_eobs.php#datafiles (accessed on 26 October 2021).
  69. Lindström, Å.; Green, M.; Paulson, G.; Smith, H.G.; Devictor, V. Rapid changes in bird community composition at multiple temporal and spatial scales in response to recent climate change. Ecography 2013, 36, 313–322. [Google Scholar] [CrossRef]
  70. ESRI. ArcGIS Desktop; Release 10.7.1; Environmental Systems Research Institute: Redlands, CA, USA, 2019. [Google Scholar]
  71. R Core Development Team. R: A Language and Environment for Statistical Computing; R Foundation for Statistical Computing: Vienna, Austria, 2020; Available online: https://www.R-project.org/ (accessed on 10 October 2021).
  72. Broennimann, O.; Fitzpatrick, M.C.; Pearman, P.B.; Petitpierre, B.; Pellissier, L.; Yoccoz, N.G.; Thuiller, W.; Fortin, M.-J.; Randin, C.; Zimmermann, N.E.; et al. Measuring ecological niche overlap from occurrence and spatial environmental data. Glob. Ecol. Biogeogr. 2012, 21, 481–497. [Google Scholar] [CrossRef] [Green Version]
  73. Qiao, H.; Peterson, A.T.; Campbell, L.P.; Soberón, J.; Ji, L.; Escobar, L.E. NicheA: Creating virtual species and ecological niches in multivariate environmental scenarios. Ecography 2016, 39, 805–813. [Google Scholar] [CrossRef] [Green Version]
  74. Di Cola, V.; Broennimann, O.; Petitpierre, B.; Breiner, F.T.; D’Amen, M.; Randin, C.; Engler, R.; Pottier, J.; Pio, D.; Dubuis, A.; et al. Ecospat: An R package to support spatial analyses and modeling of species niches and distributions. Ecography 2017, 40, 774–787. [Google Scholar] [CrossRef]
  75. Nunes, L.A.; Pearson, R.G. A null biogeographical test for assessing ecological niche evolution. J. Biogeogr. 2017, 44, 1331–1343. [Google Scholar] [CrossRef]
  76. Brown, J.L.; Carnaval, A.C. A tale of two niches: Methods, concepts, and evolution. Front. Biogeogr. 2019, 11, e44158. [Google Scholar] [CrossRef] [Green Version]
  77. Warren, D.L.; Matzke, N.J.; Cardillo, M.; Baumgartner, J.B.; Beaumont, L.J.; Turelli, M.; Glor, R.E.; Huron, N.A.; Simões, M.; Iglesias, T.L.; et al. ENMTools 1.0: An R package for comparative ecological biogeography. Ecography 2021, 44, 504–511. [Google Scholar] [CrossRef]
  78. Warren, D.L.; Glor, R.E.; Turelli, M. Environmental niche equivalency versus conservatism: Quantitative approaches to niche evolution. Evolution 2008, 62, 2868–2883. [Google Scholar] [CrossRef] [PubMed]
  79. Warren, D.L.; Glor, R.E.; Turelli, M. ENMTools: A toolbox for comparative studies of environmental niche models. Ecography 2010, 33, 607–611. [Google Scholar] [CrossRef]
  80. Guisan, A.; Petitpierre, B.; Broennimann, O.; Daehler, C.; Kueffer, C. Unifying niche shift studies: Insights from biological invasions. Trends Ecol. Evol. 2014, 29, 260–269. [Google Scholar] [CrossRef] [PubMed] [Green Version]
  81. Broennimann, O.; Di Cola, V.; Guisan, A. Ecospat: Spatial Ecology Miscellaneous Methods. R Package Version 3.1. 2020. Available online: https://CRAN.R-project.org/package=ecospat (accessed on 10 October 2021).
  82. Schoener, T.W. The Anolis lizards of Bimini: Resource partitioning in a complex fauna. Ecology 1968, 49, 704–726. [Google Scholar] [CrossRef]
  83. Kendall, M.G. A new measure of rank correlation. Biometrika 1938, 30, 81–93. [Google Scholar] [CrossRef]
  84. Koma, Z.; Grootes, M.W.; Meijer, C.W.; Nattino, F.; Seijmonsbergen, A.C.; Sierdsema, H.; Foppen, R.; Kissling, W.D. Niche separation of wetland birds revealed from airborne laser scanning. Ecography 2021, 44, 907–918. [Google Scholar] [CrossRef]
  85. Lei, Y.; Liu, Q. Tolerance niche expansion and potential distribution prediction during Asian openbill bird range expansion. Ecol. Evol. 2021, 11, 5562–5574. [Google Scholar] [CrossRef]
  86. Kendall, M.G. The treatment of ties in rank problems. Biometrika 1945, 33, 239–251. [Google Scholar] [CrossRef]
  87. Storchová, L.; Hořák, D. Life-history characteristics of European birds. Glob. Ecol. Biogeogr. 2018, 27, 400–406. [Google Scholar] [CrossRef]
  88. Jiguet, F.; Gadot, A.-S.; Julliard, R.; Newson, S.E.; Couvet, D. Climate envelope, life history traits and the resilience of birds facing global change. Glob. Chang. Biol. 2007, 13, 1672–1684. [Google Scholar] [CrossRef]
  89. Fischer, J.; Lindenmayer, D.B. Nestedness in fragmented landscapes: A case study on birds, arboreal marsupials and lizards. J. Biogeogr. 2005, 32, 1737–1750. [Google Scholar] [CrossRef]
  90. Li, C.; Zhao, B.; Wang, Y. Nestedness of waterbird assemblages in the subsidence wetlands recently created by underground coal mining. Curr. Zool. 2018, 65, 155–163. [Google Scholar] [CrossRef] [PubMed] [Green Version]
  91. Julliard, R.; Clavel, J.; Devictor, V.; Jiguet, F.; Couvet, D. Spatial segregation of specialists and generalists in bird communities. Ecol. Lett. 2006, 9, 1237–1244. [Google Scholar] [CrossRef] [PubMed]
  92. Pearman, P.B.; Lavergne, S.; Roquet, C.; Wüest, R.; Zimmermann, N.E.; Thuiller, W. Phylogenetic patterns of climatic, habitat and trophic niches in a European avian assemblage. Glob. Ecol. Biogeogr. 2014, 23, 414–424. [Google Scholar] [CrossRef] [PubMed]
  93. Wilman, H.; Belmaker, J.; Simpson, J.; de la Rosa, C.; Rivadeneira, M.M.; Jetz, W. EltonTraits 1.0: Species-level foraging attributes of the world’s birds and mammals. Ecology 2014, 95, 2027. [Google Scholar] [CrossRef] [Green Version]
  94. Lê, S.; Josse, J.; Husson, F. FactoMineR: An R package for multivariate analysis. J. Stat. Softw. 2014, 25, 1–18. [Google Scholar] [CrossRef] [Green Version]
  95. Kassambara, A.; Mundt, F. Factoextra: Extract and Visualize the Results of Multivariate Data Analyses. R Package Version 1.0.7. 2020. Available online: https://CRAN.R-project.org/package=factoextra (accessed on 28 November 2021).
  96. Dunn, O.J. Multiple comparisons using rank sums. Technometrics 1964, 6, 241–252. [Google Scholar] [CrossRef]
  97. Gill, F.; Donsker, D.; Rasmussen, P. (Eds.) IOC World Bird List (v12.1); International Ornithologists Union: Baton Rouge, LA, USA, 2022. [Google Scholar] [CrossRef]
  98. Broennimann, O.; Guisan, A. Predicting current and future biological invasions: Both native and invaded ranges matter. Biol. Lett. 2008, 4, 585–589. [Google Scholar] [CrossRef]
  99. Rodríguez-Rodríguez, E.J.; Beltrán, J.F.; Tejedo, M.; Nicieza, A.G.; Llusia, D.; Márquez, R.; Aragón, P. Niche models at inter- and intraspecific levels reveal hierarchical niche differentiation in midwife toads. Sci. Rep. 2020, 10, 10942. [Google Scholar] [CrossRef]
  100. Cuervo, P.F.; Flores, F.S.; Venzal, J.M.; Nava, S. Niche divergence among closely related taxa provides insight on evolutionary patterns of ticks. J. Biogeogr. 2021, 48, 2865–2876. [Google Scholar] [CrossRef]
  101. Peterson, A.T. Projected climate change effects on Rocky Mountain and Great Plains birds: Generalities of biodiversity consequences. Glob. Change Biol. 2003, 9, 647–655. [Google Scholar] [CrossRef]
  102. Mantyka-Pringle, C.S.; Martin, T.G.; Rhodes, J.R. Interactions between climate and habitat loss effects on biodiversity: A systematic review and meta-analysis. Glob. Change Biol. 2012, 18, 1239–1252. [Google Scholar] [CrossRef] [Green Version]
  103. Oliver, T.H.; Morecroft, M.D. Interactions between climate change and land use change on biodiversity: Attribution problems, risks, and opportunities. WIREs Clim. Change 2014, 5, 317–335. [Google Scholar] [CrossRef] [Green Version]
  104. Tingley, M.W.; Monahan, W.B.; Beissinger, S.R.; Moritz, C. Birds track their Grinnellian niche through a century of climate change. Proc. Natl. Acad. Sci. USA 2009, 106, 19637–19643. [Google Scholar] [CrossRef] [PubMed] [Green Version]
  105. Tayleur, C.; Caplat, P.; Massimino, D.; Johnston, A.; Jonzén, N.; Smith, H.G.; Lindström, A. Swedish birds are tracking temperature but not rainfall: Evidence from a decade of abundance changes. Glob. Ecol. Biogeogr. 2015, 24, 859–872. [Google Scholar] [CrossRef]
  106. La Sorte, F.A.; Jetz, W. Tracking of climatic niche boundaries under recent climate change. J. Anim. Ecol. 2012, 81, 914–925. [Google Scholar] [CrossRef] [PubMed]
  107. Chamberlain, D.E.; Negro, M.; Caprio, E.; Rolando, A. Assessing the sensitivity of alpine birds to potential future changes in habitat and climate to inform management strategies. Biol. Conserv. 2013, 167, 127–135. [Google Scholar] [CrossRef]
  108. Pearce-Higgins, J.W.; Beale, C.M.; Oliver, T.H.; August, T.A.; Carroll, M.; Massimino, D.; Ockendon, N.; Savage, J.; Wheatley, C.J.; Ausden, M.A.; et al. A national-scale assessment of climate change impacts on species: Assessing the balance of risks and opportunities for multiple taxa. Biol. Conserv. 2017, 213, 124–134. [Google Scholar] [CrossRef]
  109. Scridel, D.; Brambilla, M.; Martin, K.; Lehikoinen, A.; Iemma, A.; Matteo, A.; Jähnig, S.; Caprio, E.; Bogliani, G.; Pedrini, P.; et al. A review and meta-analysis of the effects of climate change on Holarctic mountain and upland bird populations. IBIS 2018, 160, 489–515. [Google Scholar] [CrossRef] [Green Version]
  110. Lehikoinen, A.; Brotons, L.; Calladine, J.; Campedelli, T.; Escandell, V.; Flousek, J.; Grueneberg, C.; Haas, F.; Harris, S.; Herrando, S.; et al. Declining population trends of European mountain birds. Glob. Chang. Biol. 2019, 25, 577–588. [Google Scholar] [CrossRef] [PubMed] [Green Version]
  111. Brambilla, M.; Gustin, M.; Cento, M.; Ilahiane, L.; Celada, C. Habitat, climate, topography and management differently affect occurrence in declining avian species: Implications for conservation in changing environments. Sci. Total Environ. 2020, 742, 140663. [Google Scholar] [CrossRef] [PubMed]
  112. Calvo, E.; Piccardi, B.; Celona, F.; Guglini, M.; Galani, G.; Ravanelli, G.; Ciampitti, M.; Bazzoli, M.; Craveri, L.; Ballardini, P.; et al. Rapporto Sullo Stato delle Foreste in Lombardia 2017; Piccardi, B., Celona, F., Eds.; ERSAF: Milan, Italy, 2017; pp. 8–11. Available online: https://www.ersaf.lombardia.it/it/servizi-alle-filiere/foreste-legno/rapporto-stato-delle-foreste (accessed on 28 January 2022).
  113. Paniccia, C.; Di Febbraro, M.; Frate, L.; Sallustio, L.; Santopuoli, G.; Altea, T.; Posillico, M.; Marchetti, M.; Loy, A. Effect of imperfect detection on the estimation of niche overlap between two forest dormice. IForest 2018, 11, 482–490. [Google Scholar] [CrossRef]
  114. Newson, S.E.; Massimino, D.; Johnston, A.; Baillie, S.R.; Pearce-Higgins, J.W. Should we account for detectability in population trends? Bird Study 2013, 60, 384–390. [Google Scholar] [CrossRef] [Green Version]
  115. Pulliam, H.R. Sources, sinks, and population regulation. Am. Nat. 1988, 132, 652–661. [Google Scholar] [CrossRef]
  116. Hanski, I. Metapopulation dynamics. Nature 1998, 396, 41–49. [Google Scholar] [CrossRef]
  117. Pulliam, H.R. On the relationship between niche and distribution. Ecol. Lett. 2000, 3, 349–361. [Google Scholar] [CrossRef]
  118. Chamberlain, D.E.; Siriwardena, G.M. The effects of agricultural intensification on Skylarks (Alauda arvensis): Evidence from monitoring studies in Great Britain. Environ. Rev. 2000, 8, 95–113. [Google Scholar] [CrossRef]
  119. Chamberlain, D.E.; Vickery, J.A.; Gough, S. Spatial and temporal distribution of breeding Skylarks Alauda arvensis in relation to crop type in periods of population increase and decrease. Ardea 2000, 88, 61–73. [Google Scholar]
  120. Eraud, C.; Marie Boutin, J. Density and productivity of breeding Skylarks Alauda arvensis in relation to crop type on agricultural lands in Western France. Bird Study 2002, 49, 287–296. [Google Scholar] [CrossRef]
  121. Koleček, J.; Reif, J.; Weidinger, K. The abundance of a farmland specialist bird, the skylark, in three European regions with contrasting agricultural management. Agric. Ecosyst. Environ. 2015, 212, 30–37. [Google Scholar] [CrossRef]
  122. Schurr, F.M.; Pagel, J.; Cabral, J.S.; Groeneveld, J.; Bykova, O.; O’Hara, R.B.; Hartig, F.; Kissling, W.D.; Linder, H.P.; Midgley, G.F.; et al. How to understand species’ niches and range dynamics: A demographic research agenda for biogeography. J. Biogeogr. 2012, 39, 2146–2162. [Google Scholar] [CrossRef]
  123. Gaston, K.J.; Blackburn, T.M. Birds, body size and the threat of extinction. Philos. Trans. R. Soc. B Biol. Sci. 1995, 347, 205–212. [Google Scholar] [CrossRef]
  124. Henle, K.; Davies, K.; Kleyer, M.; Margules, C.; Settele, J. Predictors of species sensitivity to fragmentation. Biodivers. Conserv. 2004, 13, 207–251. [Google Scholar] [CrossRef]
  125. Wang, Y.; Si, X.; Bennett, P.M.; Chen, C.; Zeng, D.; Zhao, Y.; Wu, Y.; Ding, P. Ecological correlates of extinction risk in Chinese birds. Ecography 2018, 41, 782–794. [Google Scholar] [CrossRef]
  126. Dardanelli, S.; Bellis, L.M. Nestedness structure of bird assemblages in a fragmented forest in central argentina: The role of selective extinction and colonization processes. Anim. Biodivers. Conserv. 2021, 44, 17–29. [Google Scholar] [CrossRef]
  127. Dondina, O.; Orioli, V.; Colli, L.; Luppi, M.; Bani, L. Ecological network design from occurrence data by simulating species perception of the landscape. Landsc. Ecol. 2018, 33, 275–287. [Google Scholar] [CrossRef]
  128. Clavel, J.; Julliard, R.; Devictor, V. Worldwide decline of specialist species: Toward a global functional homogenization? Front. Ecol. Environ. 2011, 9, 222–228. [Google Scholar] [CrossRef] [Green Version]
  129. Saino, N.; Ambrosini, R.; Rubolini, D.; von Hardenberg, J.; Provenzale, A.; Hüppop, K.; Hüppop, O.; Lehikoinen, A.; Lehikoinen, E.; Rainio, K.; et al. Climate warming, ecological mismatch at arrival and population decline in migratory birds. Proc. R. Soc. B Biol. Sci. 2011, 278, 835–842. [Google Scholar] [CrossRef] [Green Version]
  130. Taylor, C.M.; Laughlin, A.J.; Hall, R.J. The response of migratory populations to phenological change: A migratory flow network modelling approach. J. Anim. Ecol. 2016, 85, 648–659. [Google Scholar] [CrossRef]
  131. Newton, I. The Migration Ecology of Birds, 1st ed.; Elsevier Academic Press: Amsterdam, The Netherlands, 2007. [Google Scholar] [CrossRef]
  132. Jonzén, N.; Lindén, A.; Ergon, T.; Knudsen, E.; Vik, J.O.; Rubolini, D.; Piacentini, D.; Brinch, C.; Spina, F.; Karlsson, L.; et al. Rapid advance of spring arrival dates in long-distance migratory birds. Science 2006, 312, 1959–1961. [Google Scholar] [CrossRef] [PubMed]
  133. Newson, S.E.; Moran, N.J.; Musgrove, A.J.; Pearce-Higgins, J.W.; Gillings, S.; Atkinson, P.W.; Miller, R.; Grantham, M.J.; Baillie, S.R. Long-term changes in the migration phenology of UK breeding birds detected by large-scale citizen science recording schemes. IBIS 2016, 158, 481–495. [Google Scholar] [CrossRef]
  134. Mayor, S.J.; Guralnick, R.P.; Tingley, M.W.; Otegui, J.; Withey, J.C.; Elmendorf, S.C.; Andrew, M.E.; Leyk, S.; Pearse, I.S.; Schneider, D.C. Increasing phenological asynchrony between spring green-up and arrival of migratory birds. Sci. Rep. 2017, 7, 1902. [Google Scholar] [CrossRef] [PubMed] [Green Version]
  135. Burgess, M.D.; Smith, K.W.; Evans, K.L.; Leech, D.; Pearce-Higgins, J.W.; Branston, C.J.; Briggs, K.; Clark, J.R.; du Feu, C.R.; Lewthwaite, K.; et al. Tritrophic phenological match–mismatch in space and time. Nat. Ecol. Evol. 2018, 2, 970–975. [Google Scholar] [CrossRef] [PubMed] [Green Version]
  136. Bangerter, A.B.; Heiser, E.R.; Carlisle, J.D.; Miller, R.A. Local weather explains annual variation in northern goshawk reproduction in the Northern Great Basin, USA. J. Raptor Res. 2021, 55, 471–484. [Google Scholar] [CrossRef]
  137. Wittwer, T.; O’Hara, R.B.; Caplat, P.; Hickler, T.; Smith, H.G. Long-term population dynamics of a migrant bird suggests interaction of climate change and competition with resident species. Oikos 2015, 124, 1151–1159. [Google Scholar] [CrossRef]
  138. Møller, A.P.; Rubolini, D.; Lehikoinen, E. Populations of migratory bird species that did not show a phenological response to climate change are declining. Proc. Natl. Acad. Sci. USA 2008, 105, 16195–16200. [Google Scholar] [CrossRef] [Green Version]
  139. Howard, C.; Stephens, P.A.; Pearce-Higgins, J.W.; Gregory, R.D.; Butchart, S.H.M.; Willis, S.G. Disentangling the relative roles of climate and land cover change in driving the long-term population trends of European migratory birds. Divers. Distrib. 2020, 26, 1442–1455. [Google Scholar] [CrossRef]
  140. Newton, I. The recent declines of farmland bird populations in Britain: An appraisal of causal factors and conservation actions. IBIS 2004, 146, 579–600. [Google Scholar] [CrossRef]
  141. Elton, C. Animal Ecology; Sedgwick and Jackson: London, UK, 1927. [Google Scholar]
Figure 1. Main land covers in the study area and locations of the sampling sites. Land covers are represented according to 3rd-level of DUSAF land-cover map [59] with some mergers (see Table S1). 10-km square grid (WGS84, UTM 32N) is superimposed on sampling sites. X and Y coordinates are in km.
Birds 03 00011 g001
Figure 2. First two axes of the principal component analysis (PCA) that define the E-space, based on 25 input variables. See Section 2.2 for variables’ abbreviations and Table S3 for variables’ coordinates.
Birds 03 00011 g002
Figure 3. Examples of niche comparison between T1 (1992–95–96) and T2 (2015–16–17) projected in the E-space for four species. (a) Song Thrush; (b) Great Spotted Woodpecker; (c) Eurasian Bullfinch; (d) Eurasian Wryneck. In each graph, the red area represents the E-space exclusively occupied in T2, the green area the E-space exclusively occupied in T1, and the blue area the E-space occupied in both T1 and T2. The color intensity of the filled area represents the density of occurrence of the species in T2. Green and red solid lines represent the whole extent of the available E-space in T1 and T2, respectively. Arrows indicate the centroids’ shift from T1 to T2 for the available E-space (dashed arrow, where we did not detect any shift) and for the occupied E-space (solid arrow).
Birds 03 00011 g003
Figure 4. Niche overlap and dynamic indices between T1 (1992–95–96) and T2 (2015–16–17). The Schoener’s D index (observed niche overlap), the expansion and unfilling (dynamic indices) are given for each species. The length of the bar is proportional to the value of the index. Species were reported with the common name [97] and listed in descending order in respect to the Schoener’s D value. Bar colors reflect species trend: increasing populations, green; non-significant population trends, light blue; decreasing populations, red.
Birds 03 00011 g004
Figure 5. Kendall correlation between species population trends and niche metrics. Each dot represents a species (n = 71). Species population trends were reported as percentage of change (% change) of the population index from 1992 to 2019. Values of % change below zero indicate decreasing populations. Kendall’s rank coefficient tau and the corresponding p-values (p) are shown in the upper right corner.
Birds 03 00011 g005
Figure 6. Relationship between niche metrics, life-history and ecological continuous traits. PCA biplot between the Schoener’s D (D), unfilling (unf) and expansion (exp) niche metrics (red and dashed arrows) and the 18 continuous traits (solid black arrows) respect to Dim1 and Dim3 (a) and to Dim1 and Dim2 (b). Abbreviations’ meaning for the continuous traits: len = body length; wing = wing length; tail = tail length; bil = bill length; tar = tarsus length; wei = body weight; clu = clutch size; bro = number of broods per breeding season; fec = annual fecundity; inc = incubation period; fle = fledging period; disr = dispersal ratio; SSI. = prefix for the specialization indices; fh = foraging habitat; acq = acquisition behavior; nes = nesting habitat; fs = foraging substrate; tr = diet; ov = overall. See Table S2 for further details on species traits.
Birds 03 00011 g006
Figure 7. Box plots and significance level of Dunn’s test for pairwise comparisons for categorical traits for which Kruskal–Wallis test detected significant differences. (a) Migration strategy and unfilling; number of species per group: long-distance = 20, short-distance = 29, sedentary = 22; Landscape type and (b) unfilling, (c) expansion, (d) Schoener’s D (niche overlap); number of species per group: farmland = 28, woodland = 16, natural-open= 8; several = 19. Whiskers are 1.5 × IQR. Black dots represent outliers. Horizontal bars in the upper area indicate which group comparisons showed statistically significant differences. Asterisks represent the significance level: ≤0.001: ***, ≤0.01: **, ≤0.05: *. See Table S2 for further details on species traits.
Birds 03 00011 g007
Table 1. Schoener’s D index and p-values for the equivalency (E) and similarity (S) test for niche divergence (D) and conservatism (C). Significant p-values (≤0.05) are marked in bold. Species are listed in taxonomic order with the common and scientific names according to Gill et al. [97].
SpeciesSchoener’s DE (D)E (C)S (D)S (C)
Black-crowned Night Heron (Nycticorax nycticorax)0.520.0070.9940.9680.026
Little Egret (Egretta garzetta)0.480.0230.9770.9470.038
Grey Heron (Ardea cinerea)0.540.0031.0000.9500.035
Mallard (Anas platyrhynchos)0.290.0040.9960.8120.211
Black Kite (Milvus migrans)0.500.1720.8400.9650.042
Common Buzzard (Buteo buteo)0.600.2970.6900.9900.011
Common Kestrel (Falcon tinnunculus)0.250.0340.9700.7620.229
Common Quail (Coturnix coturnix)0.610.3990.6270.9950.012
Common Pheasant (Phasianus colchicus)0.600.0360.9790.9680.018
Common Moohren (Gallinula chloropus)0.560.0100.9950.9680.032
Feral Pigeon (Columba livia domestica)0.720.0330.9660.9930.010
Common Wood Pigeon (Columba palumbus)0.710.4350.5910.9980.009
Eurasian Collared Dove(Streptopelia decaocto)0.730.1190.8640.9910.008
European Turtle Dove (Streptopelia turtur)0.620.0330.9840.9620.028
Common Cuckoo (Cuculus canorus)0.740.999<0.0011.0000.002
Common Swift (Apus apus)0.710.9330.0610.9950.010
Eurasian Wryneck (Jinx torquilla)0.490.7090.2950.9680.048
European Green Woodpecker (Picus viridis)0.410.0540.9560.9150.114
Great Spotted Woodpecker (Dendrocopos major)0.590.4440.5890.9610.032
Eurasian Skylark (Alauda arvensis)0.14<0.0011.0000.8360.179
Eurasian Crag Martin (Ptyonoprogne rupestris)0.600.5310.4870.9420.033
Barn Swallow (Hirundo rustica)0.59<0.0011.0000.9710.021
Common House Martin (Delichon urbicum)0.660.4540.5350.9960.018
Tree Pipit (Anthus trivialis)0.570.8420.1680.9760.015
Water Pipit (Anthus spinoletta)0.230.1810.8210.9050.101
Western Yellow Wagtail (Motacilla flava)0.49<0.0011.0000.9590.036
Grey Wagtail (Motacilla cinerea)0.610.7520.2590.9870.008
White Wagtail (Motacilla alba)0.630.4400.5640.9970.006
Eurasian Wren (Troglodytes troglodytes)0.710.9930.0030.9990.002
Dunnock (Prunella modularis)0.270.0290.9820.8840.101
European Robin (Erithacus rubecula)0.811.000<0.0011.000<0.001
Common Nigthingale (Luscinia megarhynchos)0.61<0.0011.0000.9740.031
Black Redstart(Phoenicurus ochruros)0.540.5140.5060.9680.027
Common Redstart (Phoenicurus phoenicurus)0.630.0630.9340.9870.012
African Stonechat(Saxicola torquatus)0.580.4830.5240.9570.028
Northern Wheatear (Oenanthe oenanthe)0.440.7820.2130.8860.112
Common Blackbird (Turdus merula)0.760.9980.0020.9970.002
Song Thrush (Turdus philomelos)0.210.0490.9460.9080.105
Mistle Trush (Turdus viscivorus)0.510.9260.0740.9110.082
Cetti’s Warbler (Cettia cetti)0.680.8120.2000.9880.012
Melodius Warbler (Hippolais polyglotta)0.400.0460.9420.9130.083
Lesser Whitethroat (Curruca curruca)0.560.9740.0250.9700.029
Eurasian Blackcap (Sylvia atricapilla)0.791.000<0.0011.000<0.001
Western Bonelli’s Warbler (Phylloscopus bonelli)0.470.2530.7540.8810.118
Common Chiffchaff (Phylloscopus collybita)0.630.4100.5950.9880.019
Goldcrest (Regulus regulus)0.710.9790.0280.9980.007
Common Firecrest (Regulus ignicapilla)0.330.1900.8330.8320.175
Spotted Flycatcher (Muscicapa striata)0.650.1020.8920.9880.014
Long-tailed Tit (Aegithalos caudatus)0.590.0580.9560.9820.013
Marsh Tit (Poecile palustris)0.450.0090.9940.9550.041
Willow Tit (Poecile montanus)0.380.2070.7380.9630.057
European Crested Tit (Lophophanes cristatus)0.460.5260.4990.8730.168
Coal Tit (Periparus ater)0.610.2310.7840.9450.046
Eurasian Blue Tit (Cyanistes caeruleus)0.680.0920.8900.9950.004
Great Tit (Parus major)0.750.4150.5360.9950.003
Eurasian Nuthatch (Sitta europea)0.460.0990.9090.9380.048
Eurasian Golden Oriole (Oriolus oriolus)0.570.0550.9370.9700.018
Red-backed Shrike (Lanius collurio)0.570.0630.9390.9930.014
Eurasian Jay (Garrulus glandarius)0.600.0360.9680.9430.050
Eurasian Magpie(Pica pica)0.610.0030.9990.9740.018
Carrion Crow (Corvus corone)0.470.5820.4250.9580.047
Hooded Crow (Corvus cornix)0.690.4020.6440.9940.010
Common Starling (Sturnus vulgaris)0.63<0.0011.0000.9930.020
Italian Sparrow (Passer italiae)0.700.0610.9260.9920.009
Eurasian Tree Sparrow (Passer montanus)0.670.0021.0000.9880.009
Common Chaffinch (Fringilla coelebs)0.700.9310.0690.9990.002
European Serin (Serinus serinus)0.730.3130.6910.9910.010
European Greenfinch (Chloris chloris)0.650.1040.8930.9940.007
European Goldfinch (Carduelis carduelis)0.600.0040.9960.9920.016
Common Redpoll (Acanthis flammea)0.480.6130.3740.9790.021
Eurasian Bullfinch (Pyrrhula pyrrhula)0.400.0350.9610.9430.067
Publisher’s Note: MDPI stays neutral with regard to jurisdictional claims in published maps and institutional affiliations.

