Article

Predicting Tumor Progression in Patients with Cervical Cancer Using Computer Tomography Radiomic Features

by
Shopnil Prasla
1,
Daniel Moore-Palhares
2,3,
Daniel Dicenzo
2,3,
LaurentiusOscar Osapoetra
1,
Archya Dasgupta
2,3,
Eric Leung
2,3,
Elizabeth Barnes
2,3,
Alexander Hwang
1,
Amandeep S. Taggar
2,3 and
Gregory Jan Czarnota
2,3,4,*
1
Department of Physical Sciences, Sunnybrook Research Institute, Toronto, ON M4N 3M5, Canada
2
Department of Radiation Oncology, University of Toronto, Toronto, ON M5S 1A1, Canada
3
Department of Radiation Oncology, Sunnybrook Health Sciences Centre, Toronto, ON M4N 3M5, Canada
4
Department of Medical Biophysics, University of Toronto, Toronto, ON M5S 1A1, Canada
*
Author to whom correspondence should be addressed.
Radiation 2024, 4(4), 355-368; https://doi.org/10.3390/radiation4040027
Submission received: 17 August 2024 / Revised: 16 November 2024 / Accepted: 24 November 2024 / Published: 4 December 2024

Simple Summary

Cervical cancer continues to pose a major health challenge for women, especially in advanced stages. While standard treatments such as radiation and chemotherapy are effective for many, about 20% of patients experience incomplete responses, and relapse remains a significant concern. CT radiomics, an innovative technique that extracts and analyzes complex patterns from CT scans, reveals tumor characteristics that are often undetectable by the human eye. This technology holds the potential to help clinicians predict treatment responses earlier, paving the way for personalized therapeutic strategies to improve outcomes for each patient.

Abstract

The objective of this study was to evaluate the effectiveness of utilizing radiomic features from radiation planning computed tomography (CT) scans in predicting tumor progression among patients with cervical cancers. A retrospective analysis was conducted on individuals who underwent radiotherapy for cervical cancer between 2015 and 2020, utilizing an institutional database. Radiomic features, encompassing first-order statistical, morphological, Gray-Level Co-Occurrence Matrix (GLCM), Gray-Level Run Length Matrix (GLRLM), and Gray-Level Dependence Matrix (GLDM) features, were extracted from the primary cervical tumor on the CT scans. The study encompassed 112 CT scans from patients with varying stages of cervical cancer ((FIGO Staging of Cervical Cancer 2018): 24% at stage I, 47% at stage II, 21% at stage III, and 10% at stage IV). Of these, 31% (n = 35/112) exhibited tumor progression. Univariate feature analysis identified three morphological features that displayed statistically significant differences (p < 0.05) between patients with and without progression. Combining these features enabled a classification model to be developed with a mean sensitivity, specificity, accuracy, and AUC of 76.1% (CI 1.5%), 70.4% (CI 4.1%), 73.6% (CI 2.1%), and 0.794 (CI 0.029), respectively, employing nested ten-fold cross-validation. This research highlights the potential of CT radiomic models in predicting post-radiotherapy tumor progression, offering a promising approach for tailoring personalized treatment decisions in cervical cancer.

1. Introduction

Cervical cancer is the fourth most prevalent female malignancy globally and the second leading cause of death among young patients [1]. Approximately 40% of patients are diagnosed with locally advanced disease (stages IIB-IVA) [2], for which a combination of external beam radiotherapy, concurrent platinum chemotherapy, and brachytherapy is the standard of care. Despite radical-intent treatment, about 20% of patients do not achieve a complete response, and approximately one-third experience a relapse [3], often detected months after the initial treatment, potentially causing delays in administering further treatments. Therefore, there is an unmet need to develop models that can predict therapeutic responses and long-term outcomes early in the course of radiotherapy to permit the development of risk-adapted personalized treatment care. The prediction of reliable biomarkers facilitates timely interventions, including the administration of adjuvant chemotherapy and escalated radiation dosages, particularly for patients at a higher risk of recurrence [4]. Over the past years, imaging texture analysis has emerged as an effective method for predicting treatment outcomes [5,6,7]. This technique has the capability of gathering a large amount of quantitative information that is not perceptible to the human eye and can be used to decipher inherent biological tumor characteristics, such as intratumoral heterogeneity, which ultimately enables the prediction of clinical outcomes [5,6,8,9,10].
Oncology research has been gaining popularity with the advent of radiomics, a method that involves the high-throughput extraction of quantitative image features from radiological images, leading to enhanced prognostic, diagnostic, and predictive accuracy when integrated into clinical decision-support systems. Radiomics analysis is a powerful technique in modern medicine that utilizes image-based characteristics for precise diagnosis and treatment alongside advanced imaging analysis software and rapid development and authentication of medical imaging data [11]. Typically, MRI is used for diagnostic purposes in cervix cancer due to its superior contrast based on inherent tissue properties and better contrast resolution when compared to CT, especially for evaluating soft tissues. CT, however, remains the standard for radiation planning due to the direct input of pixel Hounsfield units into dose-distribution software, and only now is MRI being used in fusion with CT for radiation planning. Most studies have focused on MRI features, whereas the work here deliberately explores CT features due to the ubiquitous use of CT in radiation planning.
Previous studies have investigated the application of MRI and positron emission tomography (PET) radiomic features to predict the outcomes of patients with cervical cancer [12,13,14]. In one such study, Kawarha et al. used a radiomics model with baseline T1- and T2-weighted MRI to predict recurrences. In a LASSO analysis, they selected twenty-five features from unnormalized T1w images and four from T2w images. After normalization, eleven T1w and twenty-seven T2w features were selected. The normalized model outperformed the unnormalized one, achieving an accuracy, specificity, sensitivity, and AUC of 83%, 72%, 89%, and 0.90 with normalized T1w images, 93%, 91%, 94%, and 0.96 with normalized T2w images, and 96%, 93%, 99%, and 1.00 when combining both [15]. Similarly, Lucia et al. developed a recurrence prediction model for locally advanced cervical cancer using combined radiomic features from MRI and PET images across multiple institutions, achieving 90% accuracy for predicting disease-free survival and 98% accuracy for locoregional control [16].
These studies highlight the potential for texture analysis to predict outcomes in cervical cancer. However, there is limited evidence for using CT-based radiomic models to predict tumor recurrence, specifically for this population. Therefore, the work here specifically investigates and reports a pre-treatment CT radiomic classification model for predicting the recurrence of cervical cancer.

2. Material and Methods

This retrospective study was conducted in accordance with the principles of good clinical practice outlined in the Declaration of Helsinki. The institutional research ethics board at the Sunnybrook Health Sciences Centre in Canada (REB #3036) approved this study and granted a waiver for the informed consent requirement. This study included patients diagnosed with stage IB-IV cervical cancer who underwent external beam radiotherapy and were having baseline planning CT between 2015 and 2020. All patients diagnosed during this period were included in this study. In Canada, cervical cancer is becoming increasingly uncommon. The cases analyzed reflect the total number treated during this timeframe at the country’s largest radiotherapy center, which handles over 800 new patients each year. The only exceptions were those who had already received treatment for cervical cancer or presented with a recurrent tumor, as these cases were excluded from the analysis. After treatment completion, patients were typically followed up with a physical examination and pelvic magnetic resonance imaging (MRI) every three months until achieving a known response. Patients who achieved a complete clinical and/or radiological response were scheduled for physical examinations every three to six months. Additionally, pelvic MRIs were performed as needed based on clinical indications. The follow-up period lasted up to three years, providing a comprehensive and ongoing evaluation of their condition.
Patient demographic, tumor, and treatment data were collected from electronic medical records, whereas radiotherapy data were collected from a treatment planning system.
The primary endpoint was to develop a CT-based prediction model for tumor progression using radiomic data obtained from the radiation planning CT imaging of the primary cervical tumor. Tumor progression was defined per RECIST 1.1 [17] and included any locoregional or distant progression.

2.1. Image Preprocessing and Feature Determination

Four-stage data preprocessing was applied to arrive at well-formed data. This included data consolidation, data cleaning, data transformation, and data reduction [18].
The pre-treatment CT data were obtained from our institutional imaging-planning database. The planning CT images were captured using a Philips Brilliance CT Big Bore scanner with a slice thickness of 1.5 mm. For a better tumor prediction, 80 mL of Omnipaque contrast medium (350 mg/mL) was injected, with the scan initiated after a calculated delay of 45 s, allowing an optimal contrast distribution. The imaging database was reviewed for all eligible candidates and included the planning CT scan data, image registration parameters, and tumor segmentation for the study analysis. The primary cervical tumor was meticulously delineated as the region of interest (ROI) on each slice of the baseline computed tomography (CT) images, with fused MRI scans providing enhanced precision. These MRI scans, featuring both T1 and T2-weighted imaging, played vital roles in guiding the contouring process. Multiple oncologists performed the contouring, with all contours reviewed collectively to ensure consistency as part of the standard clinical care. The DICOM and contour images were exported and converted into Neuroimaging Informatics Technology Initiative (NIfTI) files. An open-source software package called Pyradiomics [19] was used to determine the radiomic features from computed tomography (CT) images of cervical cancers. One hundred features were determined computationally, which included first-order statistical features, shape or morphological features, and textural features. Textural features included those derived from the Gray-Level Co-Occurrence Matrix (GLCM) [20], Gray-Level Run Length Matrix (GLRLM) [21,22], and Gray-Level Dependence Matrix (GLDM) used for features analysis [23]. The feature extraction process was carried out by first discretizing the pixel intensities into a 128 fixed bin count. The GLCM methodology described the frequency of co-occurrences of pixel value pairs, whereas the GLRLM methodology quantified the frequency of consecutive occurrences of the same voxel value, and the GLDM methodology quantified the number of connected voxels within a distance that is dependent on a center voxel. These are different mathematical approaches to describing textures in images.

2.2. Data Cleaning and Transformation

Outliers were removed from the data using an isolation forest technique [24]. Subsequently, data were standardized by transforming each feature to have a zero mean and unit variance. This was carried out in order to ensure a uniform pixel value range with less extreme differences in intensity values among different texture features. We utilized a “Robust scaler” method that was less prone to outliers as it utilized the median value as opposed to the mean value as a measure of central tendency when performing standardization. The standardization of features is important when building a model. However, since the outliers were removed or, at the very least, reduced, the “Standard scaler” method should work equivalently. We argue that although the outlier removal procedure was implemented, it was only an approximation, and it was still possible that not all outliers were removed. So, the “robust scaler” served as a catching net if this was the case. If all outliers were caught, then both scaling methods should be equivalent.

2.3. Data Reduction

The data reduction stage included feature reduction and data balancing. Here, the initial feature reduction stage removed correlated features. Correlations between all features were calculated and features that had a Pearson correlation coefficient greater than 0.9 were identified. For those features with a correlation of 0.9 or greater, one of the correlated features was removed. This reduced the number of features from 100 to 36. For the 36 texture features, the differences in feature values between patients with recurrence (R) and those with no recurrence (NR) were compared. In order to test for a statistically significant difference between the two groups, either an independent t-test or Mann–Whitney U Test was performed. For a particular feature, if the data were normally distributed, a t-test was utilized, and if the data were not normally distributed, a Mann–Whitney U Test was employed. A Shapiro–Wilk normality test was utilized to see if the data were normally distributed. For statistical tests, a p-value of 0.05 or less was used as the threshold for significance.
Prior to model building, training data were balanced by oversampling the minority class using a Synthetic Minority Oversampling technique (SMOTE) [25]. The ratio of imbalances was not extreme, but it was still necessary to have a balanced dataset.

2.4. Model Building and Evaluation

Given the well-formed data obtained from the preprocessing stage, a multivariate model was developed to predict the target response t ∈ {‘R’, ‘NR’} associated with recurrence (R) and non-recurrence (NR), respectively. The feature selection process was used to determine the best seven classifying features as those with the highest feature importance. A Random Forest classifier [26] was used to assess the feature importance.
Three model validation and evaluation strategies were implemented. These included leave-one-out cross-validation (LOOCV), ten-fold cross-validation (CV), and nested ten-fold cross-validation (CV). Among these strategies, only the last method reserved an independent test set from each fold.
In LOOCV, the whole dataset was partitioned into k = N development-validation folds in which each partition of the validation set consisted of one sample. We fitted a classifier on the N folds of N − 1 samples and assessed its performance on the leave-one-out sample. The final model determined was the one with the best average classification performance with the leave-one-out observations.
In the ten-fold cross-validation (CV), the samples were divided into k = 10 cross-validation (CV) folds. In each partition, the development set consisted of 9/10th of the whole dataset, while the validation set consisted of 1/10th of the whole dataset. Classifiers were fitted on the development set, and their performance was assessed on the validation set. The final model was the one with the best average classification performance on the ten validation sets.
In the nested ten-fold cross-validation (CV), the whole dataset was partitioned into ten development-test partitions. In each partition, the development set consisted of 9/10th samples, while the test set consisted of 1/10th samples. Subsequently, we partitioned each development set into ten train-validation folds. In each fold, the training and validation sets consisted of 9/10th and 1/10th of the samples in a development fold, respectively. A grid search was performed in order to optimize the hyper-parameters of the classifier using the train-validation partitions. The same cross-validation (CV) folds were used to select an optimum model. The final model was the one with the best average performance on the validation sets. Subsequently, the generalization performance of the final model on the test sets was evaluated. The final nested cross-validation (CV) performance was averaged over all ten test folds. The mean classification performance over ten iterations and at 95% confidence intervals were reported. Figure 1 represents the flowchart of the study methodology.

3. Results

3.1. Patient Characteristics

Patients (n = 112) with cervix cancer were included in this study (Table 1). The median age was 57 years (range of 29–93), and 78.5% had squamous cell carcinoma. Most patients had stage IB (21%), IIB (45%), and IIIC (16%) disease. Lymph node involvement was present in 23% of patients, with 20% in pelvic nodes and 3% in para-ortic nodes. Most patients (94%) underwent 45 Gy in 25 fractions, with 43% treated with intensity-modulated radiotherapy and the remaining 57% treated with 3D radiotherapy. Eighty-four percent (n = 94) of patients underwent concurrent chemo-radiotherapy consisting of cis-platinum administered weekly at a dose of 40 mg given intravenously. However, not all patients completed the full treatment course. The remaining patients (n = 18) either declined chemotherapy or had contraindications. All except three patients (97%) underwent brachytherapy following external beam radiotherapy completion. One-third of patients (31%, n = 35/112) developed tumor progression. Among these cases, 17 patients exhibited locoregional metastasis, while 18 patients presented with distant metastasis.

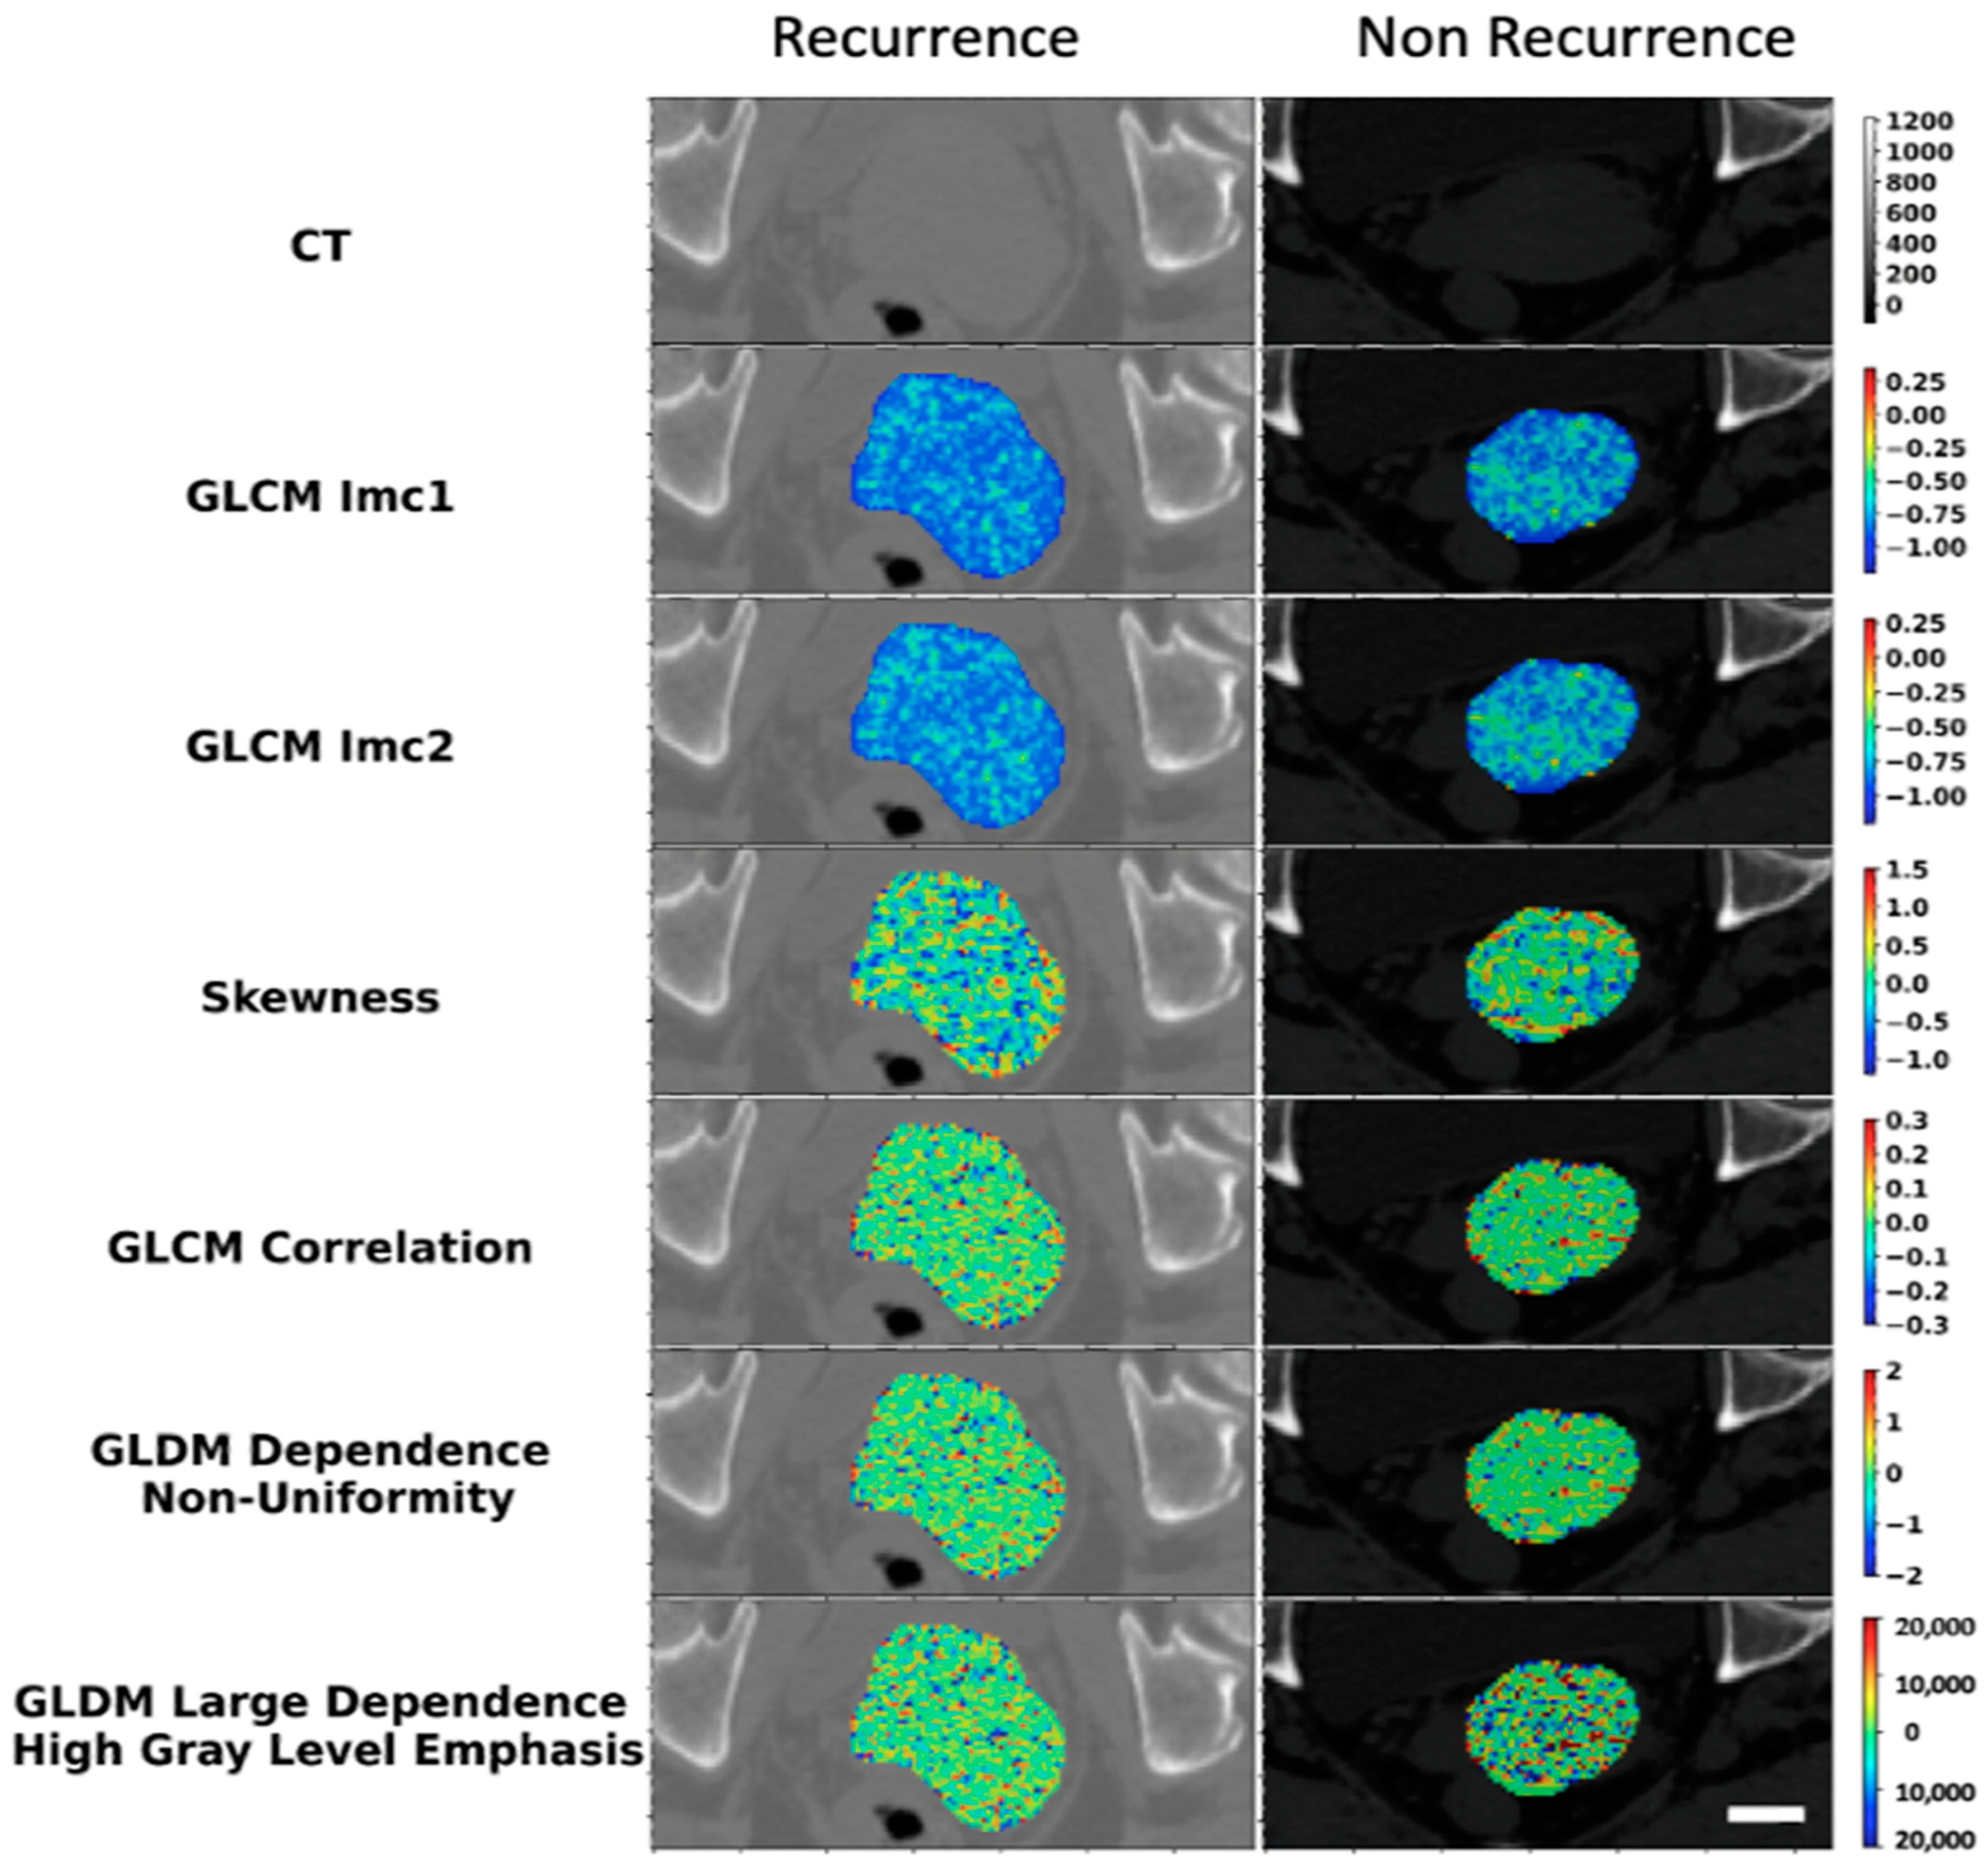
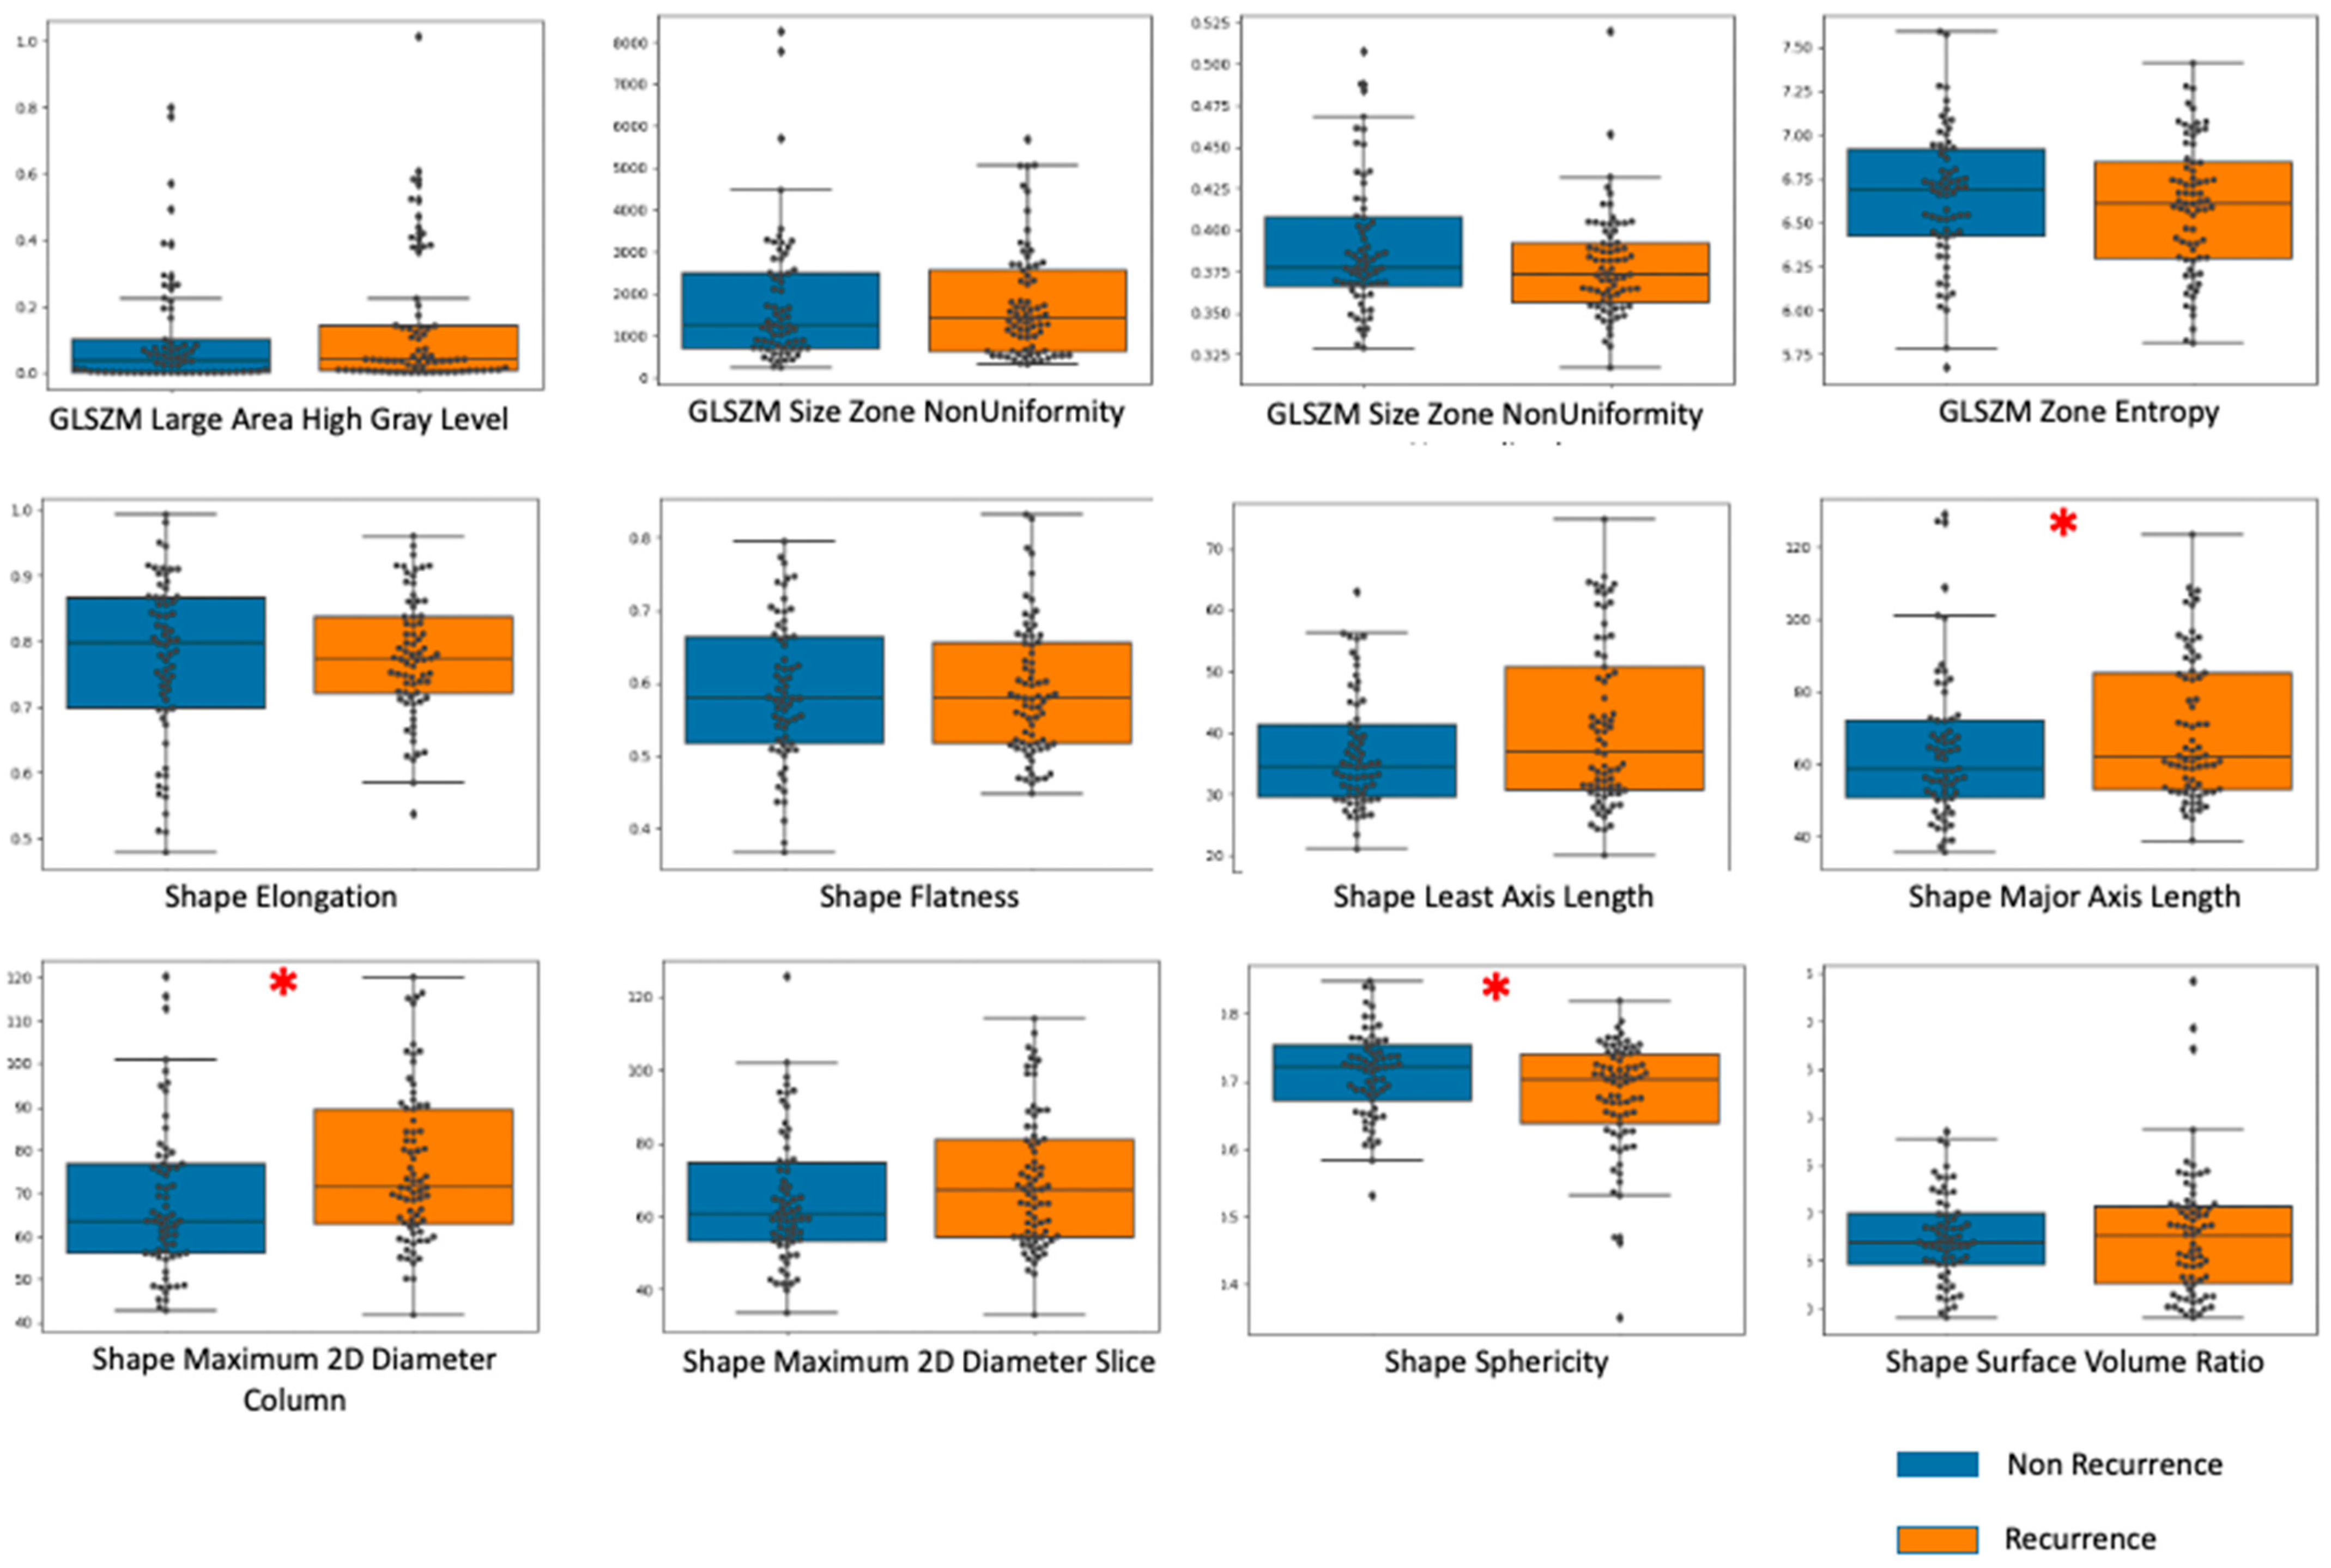
3.2. Imaging Features Analysis

Figure 2 shows a representative anatomical (CT) image of the pelvic region overlaid with radiomic texture maps of the cervical tumor from recurrence and non-recurrence patient groups. The texture maps in Figure 2 include first-order statistical skewness, the GLCM information measure of correlation (IMC) 1, GLCM IMC 2, GLCM correlation, GLDM dependence non-uniformity, and GLDM Large-dependence High Gray-Level Emphasis for features analysis. These represent some of the features that were most distinct between the recurrence and non-recurrence patient groups.
Figure 3 depicts the box-scatter and distribution plots of radiomic feature values for the recurrence ‘R’ and non-recurrence ‘NR’ groups for all 36 radiomic features that have been shown in Supplementary Figure S1. Among these features, three morphological-based attributes demonstrated statistically significant differences (p < 0.05), as indicated by the asterisks (*). These included sphericity, major axis length, and maximum 2D diameter column. The mean values and standard deviations for sphericity were 0.68 ± 0.06 versus 0.64 ± 0.09 for non-recurrence ‘NR’ and recurrence ‘R’ groups, respectively. The mean values and standard deviations for the major axis length were 67.5 ± 27.1 versus 72.6 ± 24.5 for non-recurrence ‘NR’ and recurrence ‘R’ groups, respectively. The mean values and standard deviations for the maximum 2D diameter column were 70.2 ± 22.8 versus 78.2 ± 21.4 for non-recurrence ‘NR’ and recurrence ‘R’, respectively.
The differentiation between recurrence ‘R’ and non-recurrence ‘NR’ groups using the image texture feature shows first-order statistical features, morphological features, the Gray-Level Co-Occurrence Matrix (GLCM), Gray-Level Run Length Matrix (GLRLM), and Gray-Level Dependence Matrix (GLDM) features. Figure 4 and Supplementary Figure S2 shows the correlation between these radiomic features and demonstrates the best classifier based on their importance.

3.3. Classification Performance

Table 2, Table 3 and Table 4 tabulates the classification performances across different model building and evaluation strategies, including (A) LOOCV, (B) ten-fold CV, and (C) nested ten-fold CV. In each strategy, we aimed to determine which machine learning classifier works best for the particular dataset at hand. The CV approaches, including LOOCV, ten-fold CV, and nested LOOCV, serve as frameworks/constructions for model building and evaluation.
Across strategies, the SVM-RBF classifier obtained the highest classification performance; for example, using LOOCV, we obtained 86% sensitivity, 82% specificity, 84% accuracy, and 0.82 AUC.
Amongst the strategies, only the nested ten-fold cross-validation (CV) presented an out-of-sample test set for assessment of model generalization performance. The SVM-RBF model demonstrated average performances of 76% sensitivity, 70% specificity, 74% accuracy, and 0.79 AUC.

4. Discussion

CT-Based texture analysis has been shown to be a powerful tool for outcome predictions for other primary malignancies. For example, Moghadas-Dastjerdi et al. constructed a multivariate classification model using Gray Level Co-Occurrence Matrix (GLCM) features from the baseline contrast-enhanced CT images of LABC tumors. They found that AdaBoost decision tree models using these features predict the patient response with a cross-validated AUC, accuracy, sensitivity, and specificity of 0.89, 84%, 80%, and 88%, respectively. Their findings supported the significant potential of CT-based radiomics in predicting breast tumor response to therapy and can be a powerful tool for outcome predictions [27,28]. Our work represents an approach that applies this to computed tomography data, indicating accuracies from 74% to 84%.
Several studies in the past have demonstrated the significant contribution of radiomics and imaging modalities to develop recurrence prediction models, specifically for cervical cancers [29,30,31]. One such study published by Reuzé et al. [29] utilized the texture analysis of 18F-FDG positron emission tomography (PET) images to predict local recurrence in locally advanced cervical cancer (LACC) patients treated with combined chemoradiotherapy (CRT) and brachytherapy. A combination of four features achieved the best validation performance of AUC = 0.76 (CI = 0.66–0.87). The study demonstrated that a multivariate model was more accurate in predicting local recurrence than a model based on the maximum standardized uptake value (SUVmax) feature of the PET image. For the comparison of prognostic values between a radiomics model and clinical parameters, Lucia et al. [30] used the radiomic features from both PET/CT and MRI to predict the prognosis of cervical cancer with clinical comparison. The results showed significantly higher prognostic power of the radiomics feature from diffusion-weighted magnetic resonance imaging (DW-MRI) and (PET) images as an independent predictor of local failure (accuracy of 94%) and locoregional failure (100% accuracy) compared to clinical parameters (50–60%). However, a combination model of radiomics and clinical characteristics has, overall, displayed excellent improvements in accuracy and outcomes, as seen in the study conducted by Zhang et al. [31]. Their study was conducted to observe the radiomic signature for overall survival (OS) and disease-free survival (DFS), as well as to show that a clinical parameter model could display improvements in the model performance. The authors reported that the combination model, which included a radiomics score and clinical parameter model, outperformed other models in survival and prediction evaluation with the training cohort (AUC, 0.860; 95% CI: 0.747–0.973) and validation cohort (AUC, 0.862; 95% CI: 0.738–0.986).
The use of a CT radiomics model would be a potential alternative to the MIR/PET radiomics model, considering the cost and accessibility involved and that such images are standard in planning radiation treatments. Specifically, CT imaging is cost-effective and easily accessible since the majority of patients undergo CT planning during their clinical evaluation, which can be utilized for the analysis. There are studies that report the application of computed tomography (CT) based radiomics for the prediction of treatment response in locally advanced breast cancer (LABC) [27,28]. Nevertheless, the application of CT-based radiomics for predicting recurrence in cervical cancers is lacking overall.
This study was conducted with the intention of addressing the importance of recurrence prediction early in the disease course, to guide personalized treatment care, and to study the benefit of more intense treatments for those patients most likely to have a recurrence or to have a shorter follow-up as they are likely to have a recurrence. A model was developed utilizing baseline (CT) scans that predicted recurrences in cervical cancer following radical-intent radiotherapy. Our radiomics model for the prediction of recurrence in cervical cancers demonstrated a very favorable classification performance beyond the development set. This was demonstrated by the nested ten-fold cross-validation (CV) performance with the mean sensitivity, specificity, accuracy, and AUC of 76% (95% confidence interval [CI] 1.5%), 70% (95% CI 4.1%), 74% (95% CI 2.1%), and 0.79 (95% CI 0.029), respectively. The accuracy increased to 84% with the leave-one-out cross-validation. The proposed model demonstrated promising results, and the numbers herein are very favorable for objectively proving the model performance in deployment tests, which is crucial for demonstrating its generalization.
Univariate analysis of the radiomic features showed that three morphological features were statistically and significantly different between the two groups (p < 0.05). Although this analysis only indicated a limited number of discriminating features, the combination of features can often result in interactions that result in models with decent classification performance. Here, the best combination of seven features resulted in the highest validation performance, including the GLCM IMC 1, GLCM IMC 2, GLCM correlation, GLDM Large Dependence High Gray Level Emphasis, GLDM non-uniformity, first-order statistics skewness, and shape sphericity.
We conformed to the highest standard in statistical learning for model building and evaluation by implementing a nested cross-validation (CV). For a relatively small dataset, the cross-validation (CV) approach mitigates the risk of model bias due to data granularity resulting from partitioning into train-validation-test folds. Still, we required separate training, validation, and test partitions to fit a model, optimize and select a final model, and finally assess the model’s performance beyond the development dataset. A nested cross-validation (CV) allowed for the estimation of the model generalization in deployment. With only a relatively small patient cohort (n = 112), the leave-one-out analysis may be a performance overestimate, but the nested cross-validation may be an underestimate of performance.
To the best of our knowledge, this research represents one of a few studies documented in the literature that employs a radiomics model based on computed tomography (CT) for predicting recurrence in cervical cancer, demonstrating good predictive performance. However, certain limitations may impact the classifier’s performance. Firstly, the relatively small cohort size of cervical cancer patients may have decreased our ability to detect promising outcomes. In addition, the prediction model was developed and evaluated utilizing data from a single institution, where treatment planning, follow-up care, and tumor recurrence or persistence evaluation were all uniform across all patients in the cohort. In a global prediction model, using a large number of cases in a multicenter setting and carrying out subgroup analysis will require attention to data acquisition uniformity and the high quality of data. Considering the encouraging findings of our study and the prevailing concerns regarding the robustness, reproducibility, and standardization in radiomics research, conducting a large-scale cohort analysis in a multicenter setting remains essential to validate that multiple centers can execute the required methodology to an acceptable standard [32].

5. Conclusions

In conclusion, this study emphasizes the noticeable potential for computed tomography (CT)-based radiomic models in predicting the recurrence of cervical cancer. These models could play a pivotal role in shaping personalized treatment strategies in the future. Ongoing research aims to broaden the predictive capabilities by incorporating larger cohorts and exploring alternative radiomic models, thereby laying a solid foundation for further advancements. This work offers valuable insights into the development of an optimal and standardized radiomic approach, enhancing the accuracy and reliability of predicting cervical cancer response.

Supplementary Materials

The following supporting information can be downloaded at: https://www.mdpi.com/article/10.3390/radiation4040027/s1, Figure S1: The box-scatter and distribution plots of radiomic feature values for the recurrence ‘R’ and non-recurrence ‘NR’ groups for all 36 radiomic features Figure S2: The differentiation between recurrence ‘R’ and non-recurrence ‘NR’ groups using the image texture feature shows first-order statistical features, morphological features, the Gray-Level Co-Occurrence Matrix (GLCM), Gray-Level Run Length Matrix (GLRLM), and Gray-Level Dependence Matrix (GLDM) features.

Author Contributions

Conceptualization, D.D., A.S.T. and G.J.C.; methodology, D.D., S.P. and G.J.C.; software, D.D. and L.O.; formal analysis, D.D., L.O. and S.P.; investigation, G.J.C.; data curation, S.P., D.M.-P., E.L., E.B., A.S.T., A.D. and A.H.; writing—original draft preparation, S.P.; writing—review and editing, S.P., D.M.-P., L.O. and G.J.C.; visualization, G.J.C.; supervision, G.J.C.; project administration, G.J.C.; funding acquisition, G.J.C. All authors have read and agreed to the published version of the manuscript.

Funding

This work was funded through funds from the Terry Fox Foundation New Frontiers Program Project Grant in Ultrasound and MRI for Cancer Therapy and the Lotte and John Hecht Foundation, with funds from the Natural Sciences and Engineering Research Council of Canada.

Institutional Review Board Statement

The study was conducted in accordance with the Declaration of Helsinki, and approved by the institutional research ethics board, Sunnybrook Health Sciences Centre, Canada REB #3036.

Informed Consent Statement

Informed consent was waived as the study was conducted retrospectively.

Data Availability Statement

Data will be shared upon receipt of a request to the corresponding author and the institutional ethics committee according to the policy of Sunnybrook Health Sciences Centre, Toronto.

Acknowledgments

We would like to thank all the patients for their participation in this study. Our sincere gratitude is extended to the physicians and other healthcare staff for their support with patient care. We express our regard to the Terry Fox Foundation for funding support.

Conflicts of Interest

The authors declare no conflict of interest.

Abbreviations

CRTConcurrent chemo-radiotherapy
RTRadiation Therapy
RRecurrence
NRNon-recurrence
CTComputed Tomography
MRIMagnetic Resonance Imaging
DW-MRIDiffusion-Weighted Magnetic Resonance Imaging
PETPositron Emission Tomography
GLCMGray-Level Co-Occurrence Matrix
GLDMGray-Level Dependence Matrix
SMOTESynthetic Minority Oversampling technique
LOOCVLeave-One-Out Cross-Validation
GLRLMGray-Level Run Length Matrix
GLSZMGray-Level Size Zone Matrix
CVCross-Validation
ROIRegion of Interest
CIConfidence Interval
LABCLocally Advanced Breast Cancer
NACNeoadjuvant Chemotherapy

References

  1. Sung, H.; Ferlay, J.; Siegel, R.L.; Laversanne, M.; Soerjomataram, I.; Jemal, A.; Bray, F. Global Cancer Statistics 2020: GLOBOCAN Estimates of Incidence and Mortality Worldwide for 36 Cancers in 185 Countries. CA Cancer J. Clin. 2021, 71, 209–249. [Google Scholar] [CrossRef] [PubMed]
  2. Monk, B.J.; Tan, D.S.P.; Hernández Chagüi, J.D.; Takyar, J.; Paskow, M.J.; Nunes, A.T.; Pujade-Lauraine, E. Proportions and Incidence of Locally Advanced Cervical Cancer: A Global Systematic Literature Review. Int. J. Gynecol. Cancer 2022, 32, 1531–1539. [Google Scholar] [CrossRef] [PubMed]
  3. Datta, N.R.; Stutz, E.; Liu, M.; Rogers, S.; Klingbiel, D.; Siebenhüner, A.; Singh, S.; Bodis, S. Concurrent Chemoradiotherapy vs. Radiotherapy Alone in Locally Advanced Cervix Cancer: A Systematic Review and Meta-Analysis. Gynecol. Oncol. 2017, 145, 374–385. [Google Scholar] [CrossRef]
  4. Kawahara, D.; Nishibuchi, I.; Kawamura, M.; Yoshida, T.; Koh, I.; Tomono, K.; Sekine, M.; Takahashi, H.; Kikuchi, Y.; Kudo, Y.; et al. Radiomic Analysis for Pretreatment Prediction of Recurrence Post-Radiotherapy in Cervical Squamous Cell Carcinoma Cancer. Diagnostics 2022, 12, 2346. [Google Scholar] [CrossRef]
  5. Ren, K.; Shen, L.; Qiu, J.; Sun, K.; Chen, T.; Xuan, L.; Yang, M.; She, H.-Y.; Shen, L.; Zhu, H.; et al. Treatment Planning Computed Tomography Radiomics for Predicting Treatment Outcomes and Haematological Toxicities in Locally Advanced Cervical Cancer Treated with Radiotherapy: A Retrospective Cohort Study. BJOG 2023, 130, 222–230. [Google Scholar] [CrossRef]
  6. Park, H.; Kim, K.A.; Jung, J.-H.; Rhie, J.; Choi, S.Y. MRI Features and Texture Analysis for the Early Prediction of Therapeutic Response to Neoadjuvant Chemoradiotherapy and Tumor Recurrence of Locally Advanced Rectal Cancer. Eur. Radiol. 2020, 30, 4201–4211. [Google Scholar] [CrossRef]
  7. Liu, Z.; Wang, S.; Dong, D.; Wei, J.; Fang, C.; Zhou, X.; Sun, K.; Li, L.; Li, B.; Wang, M.; et al. The Applications of Radiomics in Precision Diagnosis and Treatment of Oncology: Opportunities and Challenges. Theranostics 2019, 9, 1303–1322. [Google Scholar] [CrossRef] [PubMed]
  8. Ikushima, H.; Haga, A.; Ando, K.; Kato, S.; Kaneyasu, Y.; Uno, T.; Okonogi, N.; Yoshida, K.; Ariga, T.; Isohashi, F.; et al. Prediction of Out-of-Field Recurrence after Chemoradiotherapy for Cervical Cancer Using a Combination Model of Clinical Parameters and Magnetic Resonance Imaging Radiomics: A Multi-Institutional Study of the Japanese Radiation Oncology Study Group. J. Radiat. Res. 2022, 63, 98–106. [Google Scholar] [CrossRef]
  9. Yip, S.S.F.; Aerts, H.J.W.L. Applications and Limitations of Radiomics. Phys. Med. Biol. 2016, 61, R150–R166. [Google Scholar] [CrossRef]
  10. Verma, V.; Simone, C.B.; Krishnan, S.; Lin, S.H.; Yang, J.; Hahn, S.M. The Rise of Radiomics and Implications for Oncologic Management. J. Natl. Cancer Inst. 2017, 109, djx055. [Google Scholar] [CrossRef]
  11. Lambin, P.; Leijenaar, R.T.H.; Deist, T.M.; Peerlings, J.; de Jong, E.E.C.; van Timmeren, J.; Sanduleanu, S.; Larue, R.T.H.M.; Even, A.J.G.; Jochems, A.; et al. Radiomics: The Bridge between Medical Imaging and Personalized Medicine. Nat. Rev. Clin. Oncol. 2017, 14, 749–762. [Google Scholar] [CrossRef] [PubMed]
  12. Fang, M.; Kan, Y.; Dong, D.; Yu, T.; Zhao, N.; Jiang, W.; Zhong, L.; Hu, C.; Luo, Y.; Tian, J. Multi-Habitat Based Radiomics for the Prediction of Treatment Response to Concurrent Chemotherapy and Radiation Therapy in Locally Advanced Cervical Cancer. Front. Oncol. 2020, 10, 563. [Google Scholar] [CrossRef] [PubMed]
  13. Bowen, S.R.; Yuh, W.T.C.; Hippe, D.S.; Wu, W.; Partridge, S.C.; Elias, S.; Jia, G.; Huang, Z.; Sandison, G.A.; Nelson, D.; et al. Tumor Radiomic Heterogeneity: Multiparametric Functional Imaging to Characterize Variability and Predict Response Following Cervical Cancer Radiation Therapy. J. Magn. Reson. Imaging 2018, 47, 1388–1396. [Google Scholar] [CrossRef] [PubMed]
  14. Gui, B.; Autorino, R.; Miccò, M.; Nardangeli, A.; Pesce, A.; Lenkowicz, J.; Cusumano, D.; Russo, L.; Persiani, S.; Boldrini, L.; et al. Pretreatment MRI Radiomics Based Response Prediction Model in Locally Advanced Cervical Cancer. Diagnostics 2021, 11, 631. [Google Scholar] [CrossRef] [PubMed]
  15. Kawahara, D.; Nishibuchi, I.; Kawamura, M.; Yoshida, T.; Nagata, Y. Radiomic Analysis for Pretreatment Prediction of Recurrence after Radiotherapy in Locally Advanced Cervical Cancer. Int. J. Radiat. Oncol. 2021, 111, e93. [Google Scholar] [CrossRef]
  16. Lucia, F.; Visvikis, D.; Vallières, M.; Desseroit, M.-C.; Miranda, O.; Robin, P.; Bonaffini, P.A.; Alfieri, J.; Masson, I.; Mervoyer, A.; et al. External Validation of a Combined PET and MRI Radiomics Model for Prediction of Recurrence in Cervical Cancer Patients Treated with Chemoradiotherapy. Eur. J. Nucl. Med. Mol. Imaging 2019, 46, 864–877. [Google Scholar] [CrossRef]
  17. Eisenhauer, E.A.; Therasse, P.; Bogaerts, J.; Schwartz, L.H.; Sargent, D.; Ford, R.; Dancey, J.; Arbuck, S.; Gwyther, S.; Mooney, M.; et al. New Response Evaluation Criteria in Solid Tumours: Revised RECIST Guideline (Version 1.1). Eur. J. Cancer 2009, 45, 228–247. [Google Scholar] [CrossRef]
  18. Sharda, R.; Delen, D.T.E. Analytics, Data Sciences, & Artificial Intelligence: System for Decision Support, 11th ed.; Pearson: Harlow, UK, 2021. [Google Scholar]
  19. van Griethuysen, J.J.M.; Fedorov, A.; Parmar, C.; Hosny, A.; Aucoin, N.; Narayan, V.; Beets-Tan, R.G.H.; Fillion-Robin, J.-C.; Pieper, S.; Aerts, H.J.W.L. Computational Radiomics System to Decode the Radiographic Phenotype. Cancer Res. 2017, 77, e104–e107. [Google Scholar] [CrossRef]
  20. Haralick, R.M.; Shanmugam, K.; Dinstein, I. Textural Features for Image Classification. IEEE Trans. Syst. Man. Cybern. 1973, SMC-3, 610–621. [Google Scholar] [CrossRef]
  21. Chu, A.; Sehgal, C.M.; Greenleaf, J.F. Use of Gray Value Distribution of Run Lengths for Texture Analysis. Pattern Recognit. Lett. 1990, 11, 415–419. [Google Scholar] [CrossRef]
  22. Tang, X. Texture Information in Run-Length Matrices. IEEE Trans. Image Process. 1998, 7, 1602–1609. [Google Scholar] [CrossRef] [PubMed]
  23. Haralick, R.M. Statistical and Structural Approaches to Texture. Proc. IEEE 1979, 67, 786–804. [Google Scholar] [CrossRef]
  24. Liu, F.T.; Ting, K.M.; Zhou, Z.-H. Isolation Forest. In Proceedings of the 2008 Eighth IEEE International Conference on Data Mining, Pisa, Italy, 15 December 2008; IEEE: Piscataway, NJ, USA, 2008; pp. 413–422. [Google Scholar] [CrossRef]
  25. Chawla, N.V.; Bowyer, K.W.; Hall, L.O.; Kegelmeyer, W.P. SMOTE: Synthetic Minority Over-Sampling Technique. J. Artif. Intell. Res. 2002, 16, 321–357. [Google Scholar] [CrossRef]
  26. Breiman, L. Random Forests. Mach. Learn. 2021, 45, 5–32. [Google Scholar] [CrossRef]
  27. Moghadas-Dastjerdi, H.; Sha-E-Tallat, H.R.; Sannachi, L.; Sadeghi-Naini, A.; Czarnota, G.J. A Priori Prediction of Tumour Response to Neoadjuvant Chemotherapy in Breast Cancer Patients Using Quantitative CT and Machine Learning. Sci. Rep. 2020, 10, 10936. [Google Scholar] [CrossRef]
  28. Moghadas-Dastjerdi, H.; Rahman, S.-E.-T.H.; Sannachi, L.; Wright, F.C.; Gandhi, S.; Trudeau, M.E.; Sadeghi-Naini, A.; Czarnota, G.J. Prediction of Chemotherapy Response in Breast Cancer Patients at Pre-Treatment Using Second Derivative Texture of CT Images and Machine Learning. Transl. Oncol. 2021, 14, 101183. [Google Scholar] [CrossRef]
  29. Reuzé, S.; Orlhac, F.; Chargari, C.; Nioche, C.; Limkin, E.; Riet, F.; Escande, A.; Haie-Meder, C.; Dercle, L.; Gouy, S.; et al. Prediction of Cervical Cancer Recurrence Using Textural Features Extracted from 18F-FDG PET Images Acquired with Different Scanners. Oncotarget 2017, 8, 43169–43179. [Google Scholar] [CrossRef]
  30. Lucia, F.; Visvikis, D.; Desseroit, M.-C.; Miranda, O.; Malhaire, J.-P.; Robin, P.; Pradier, O.; Hatt, M.; Schick, U. Prediction of Outcome Using Pretreatment 18F-FDG PET/CT and MRI Radiomics in Locally Advanced Cervical Cancer Treated with Chemoradiotherapy. Eur. J. Nucl. Med. Mol. Imaging 2018, 45, 768–786. [Google Scholar] [CrossRef] [PubMed]
  31. Zhang, Y.; Liu, L.; Zhang, K.; Su, R.; Jia, H.; Qian, L.; Dong, J. Nomograms Combining Clinical and Imaging Parameters to Predict Recurrence and Disease-Free Survival After Concurrent Chemoradiotherapy in Patients with Locally Advanced Cervical Cancer. Acad. Radiol. 2023, 30, 499–508. [Google Scholar] [CrossRef]
  32. Zheng, R.; Cai, M.; Lan, L.; Huang, X.W.; Yang, Y.J.; Powell, M.; Lin, F. An MRI-Based Radiomics Signature and Clinical Characteristics for Survival Prediction in Early-Stage Cervical Cancer. Br. J. Radiol. 2022, 95, 20210838. [Google Scholar] [CrossRef]
Figure 1. Flowchart showing the study methodology. General steps include patient selection, data acquisition, feature extraction, and analysis and development of machine learning models.
Radiation 04 00027 g001
Figure 2. Representative radiomics feature maps overlaid on axial CT anatomical images of cervical tumors from recurrence (R) and non-recurrence (NR) groups. The representative maps are those that contribute to the best-performing seven features. The white scale bar indicates 2 cm. The color bar indicates −1.20 to 0.35 for the GLCM lmc 1 parameter, −1.20 to 0.35 for the GLCM lmc 2 parameter, −1.20 to 1.50 for the Skewness parameter, −0.30 to 0.30 for the GLCM Correlation parameter, −2.00 to 2.00 for the GLDM Dependence Non-Uniformity parameter, and −20,000.00 to 20,000.00 for the GLDM Large Dependence High Gray-Level Emphasis parameter. These are the original ranges of the parameters, prior to the feature normalization procedure. These texture parameters and their representation as parametrized images reflect the tumor structure and heterogeneity. Differences can be subtle and require machine learning approaches for interpretation.
Radiation 04 00027 g002
Figure 3. Box and scatter plots for selected radiomic features from the recurrence (‘R’) and the non-recurrence (‘NR’) groups. These demonstrate the presence of discriminating features potentially useful for building a classification model to separate recurrence samples from non-recurrence ones. The asterisk (*) mark demonstrates a statistical significant difference (p-value < 0.05). Blue indicates non-recurrence. Orange indicates recurrence.
Radiation 04 00027 g003
Figure 4. Correlation between image texture features using the Random Forest classifier model for determining the best classifying feature. This figure displays inter-feature correlation. We observed the presence of highly correlated features as indicated by the lighter coloring. If there was more than one feature that was highly correlated, we selected only a single feature from this pool of correlated features. Redundant features do not add quality to the classification model. Figure S2 (1: GLCM Dependence Non-Uniformity, 2: Shape Maximum 2D Diameter Slice, 3: First Order Energy, 4: Shape Maximum 2D Diameter Column, 5: Shape Major Axis Length, 6: First Order Kurtosis, 7: First Order Maximum, 8: Shape Least Axis Length, 9: GLDM Large Area High Gray-Level Emphasis, 10: GLDM Large Area Emphasis, 11: GLSZM Gray-Level Non-uniformity Normalized, 12: GLDM Gray-Level Non-Uniformity, 13: GLSZM Size Zone Non-uniformity, 14: GLCM Imc1, 15: First Order 10 percentile, 16: First Order Mean, 17: First Order Skewness, 18: First Order Minimum, 19: First Order Entropy, 20: GLSZM Zone Entropy, 21: GLSZM Size Non-uniformity Normalized, 22: GLCM Difference Average, 23: Shape Surface Volume Ratio, 24: GLDM Small Dependence High Gray-Level Emphasis, 25: GLDM Dependence Entropy, 26:GLCM Contrast, 27: GLDM Large Dependence Low Gray-Level Emphasis, 28: GLCM Correlation, 29: First Order Interquartile Range, 30: First Order 90 percentile, 31: GLCM Imc2, 32: GLCM Autocorrelation, 33: GLDM Large Dependence High Gray-Level Emphasis, 34: Shape Elongation, 35: Shape Flatness, and 36: Shape Sphericity).
Radiation 04 00027 g004
Table 1. Cohort demographics for recurrence and non-recurrence groups.
Recurrence (n = 35)Non-Recurrence (n = 77)Total (n = 112)
Age (Median, range)58 (33–81)57 (29–93)57 (33–93)
Primary Tumor Size (median)4.8 cm (2.0–8.2)3.9 cm (1.5–8.9)4.4 cm (1.5–8.9)
FIGO Staging of Cervical Cancer 2018
IB2 (1.7%)22 (19.6%)24 (21.4%)
IIA1 (0.89%)2 (1.7%)3 (2.6%)
IIB10 (8.9%)40 (35.7%)50 (44.6%)
IIIA0 (0.0%)0 (0.0%)0 (0.0%)
IIIB4 (3.5%)2 (1.7%)6 (5.3%)
IIIC10 (8.9%)8 (7.1%)18 (16.0%)
IVA8 (7.1%)3 (2.6%)11 (9.8%)
Lymph Node Involvement
Pelvic13 (11.6%)10 (8.9%)23 (20.5%)
Para-aortic3 (2.6%)0 (0.0%)3 (2.6%)
Tumor Histology
Squamous Cell Carcinoma26 (23.2%)62 (55.3%)88 (78.5%)
Adenocarcinoma7 (6.2%)10 (8.9%)17 (15.1%)
Adenosquamous1 (1.7%)3 (2.6%)4 (3.5%)
Neuroendocrine1 (1.7%)2 (1.7%)3 (2.6%)
Histologic Tumor Grade
Well-differentiated0 (0.0%)6 (5.3%)6 (5.3%)
Moderately differentiated11 (9.8%)23 (20.5%)34 (30.3%)
Poorly differentiated14 (12.5%)21 (18.7%)35 (31.2%)
Not available10 (8.9%)27 (24.1%)37 (33.0%)
Radiation Dose
4500 Gy in 25 fractions33 (29.4%)76 (67.8%)109 (97.3%)
3000 Gy in 10 fractions *0 (0.0%)1 (0.89%)1 (0.8%)
3750 Gy in 15 fractions1 (0.8%)0 (0.0%)1 (0.8%)
5040 Gy in 28 fractions1 (0.8%)0 (0.0%)1 (0.8%)
Brachytherapy Dose
2800 Gy in 4 fractions24 (21.4%)41 (36.6%)65 (58.0%)
2400 Gy in 3 fractions7 (6.2%)25 (22.3%)32 (28.5%)
2750 Gy in 5 fractions1 (0.8%)8 (7.1%)9 (8.0%)
800 Gy in 1 fractions1 (0.8%)0 (0.0%)1 (0.8%)
700 Gy in 1 fractions0 (0.0%)1 (0.8%)1 (0.8%)
550 Gy in 1 fractions0 (0.0%)1 (0.8%)1 (0.8%)
None2 (1.7%)1 (0.8%)3 (2.6%)
Concurrent chemotherapy
Yes30 (26.7%)64 (57.1%)94 (83.9%)
No5 (4.4%)13 (11.6%)18 (16.0%)
* One elderly and frail patient with stage IIB disease was treated with 30 Gy in 10 fractions and died due to non-oncological causes in the absence of tumor progression.
Table 2. Classification performances Leave-one-out cross-validation (LOOCV).
ClassifierSensitivitySpecificityPrecisionNPVAccuracyF1 ScoreAUC
K-NN79.762.571.172.771.775.20.666
RF79.775.078.776.277.579.20.784
SVM Linear73.042.259.357.558.765.50.517
SVM-RBF85.982.183.684.684.184.70.824
Table 3. Classification performances in Ten-fold cross-validation (CV).
ClassifierSensitivitySpecificityPrecisionAccuracyF1 ScoreAUC
K-NN71.862.967.867.468.80.716
RF71.468.374.170.471.50.740
SVM Linear52.166.961.558.654.70.635
SVM-RBF75.080.081.377.476.80.830
Table 4. Classification performances in Nested ten-fold cross-validation (CV). Mean over 10 trials (95% confidence interval).
ClassifierSensitivitySpecificityPrecisionAccuracyF1 ScoreAUC
K-NN71.4 (3.87)57.2 (2.56)65.9 (1.96)64.7 (2.01)67.3 (2.61)0.689 (0.030)
RF69.3 (3.34)60.2 (3.20)67.8 (2.00)65.1 (1.90)67.6 (2.17)0.705 (0.018)
SVM Linear52.0 (3.17)58.0 (3.66)59.3 (3.07)54.7 (2.37)53.6 (2.62)0.563 (0.028)
SVM-RBF76.1 (1.47)70.4 (4.09)75.7 (2.81)73.6 (2.06)74.5 (1.72)0.794 (0.029)
Disclaimer/Publisher’s Note: The statements, opinions and data contained in all publications are solely those of the individual author(s) and contributor(s) and not of MDPI and/or the editor(s). MDPI and/or the editor(s) disclaim responsibility for any injury to people or property resulting from any ideas, methods, instructions or products referred to in the content.

