Simple Summary
Thyroid diseases are commonly treated with 131I due to the physiological uptake of iodine in thyroid tissue. Children are in general more sensitive compared to adults, and an increased number of thyroid malignancies were seen in children but not in adults after the Chernobyl accident. However, the long-term radiobiological mechanisms and responses are widely unknown. Thus, there is a need to increase knowledge of these effects and identify if there are differences between children and adults.
Abstract
The physiological process of iodine uptake in the thyroid is used for 131I treatment of thyroid diseases. Children are more sensitive to radiation compared to adults and may react differently to 131I exposure. The aims of this study were to evaluate the effects on thyroid protein expression in young and adult rats one year after 131I injection and identify potential biomarkers related to 131I exposure, absorbed dose, and age. Twelve Sprague Dawley rats (young and adults) were i.v. injected with 50 kBq or 500 kBq 131I and killed twelve months later. Twelve untreated rats were used as age-matched controls. Quantitative proteomics, statistical analysis, and evaluation of biological effects were performed. The effects of irradiation were most prominent in young rats. Protein biomarker candidates were proposed related to age, absorbed dose, thyroid function, and cancer, and a panel was proposed for 131I exposure. In conclusion, the proteome of rat thyroid was differentially regulated twelve months after low-intermediate dose exposure to 131I in both young and adult rats. Several biomarker candidates are proposed for 131I exposure, age, and many of them are known to be related to thyroid function or thyroid cancer. Further research on human samples is needed for validation. Data are avaiable via ProteomeXchange with identifier PXD024786.
1. Introduction
To maintain normal body function, the thyroid is essential for various cellular processes in different tissues [1]. The thyroid produces, for example, the T4 and T3 thyroid hormones that are important early in life, and an underproduction of thyroid hormone is associated with, for example, mental retardation and decreased length growth. However, overproduction of these hormones is associated with difficulties in controlling muscle function and increased length growth [2]. In addition, both types of malfunction (increased or decreased) can lead to cardiovascular issues [2]. The thyroid hormones are also needed to maintain a normal metabolism during an individual’s lifetime [3], and hypo- and hyperthyroidism are functional disorders that are vital to treat. Since the thyroid hormones contain iodine, physiological uptake of iodine occurs in the thyroid.
Several studies have shown that exposure to ionizing radiation can affect thyroid cellular function, primarily at higher absorbed doses, either by external (X-rays and gamma radiation) or internal irradiation (alpha particles and electrons) [4,5,6,7]. Irradiation of the thyroid can lead to, for example, hypothyroidism and thyroid cancer, depending on several important factors, including dose, dose rate, and type of irradiation [4,5,6,7]. This was seen in the increased incidence of thyroid cancers among children but not adults after the Chernobyl accident due to 131I irradiation [8,9,10,11,12,13]. The acute effects (hours to weeks) of 131I irradiation on, for example, organ functions are most important for high absorbed doses, while long-term effects (months to years) are also important for low-absorbed doses. Late effects of 131I exposure are also of importance after cancer treatment with 131I-labeled radiopharmaceuticals, for example, 131I-MIBG therapy for neuroblastoma in children and pheochromocytoma and paraganglioma in adults [14,15]. These effects are functional changes in 131I avid tissues, such as the thyroid and salivary glands, but also a risk of secondary cancer induction.
We still have limited knowledge of the long-term effects of radiation, especially for low absorbed doses. Radiation-induced biomarkers, for example, proteins, would enable us to evaluate and eventually predict the effects of exposure to ionizing radiation [14,16]. We have previously proposed several biomarker candidates from mouse and rat thyroid tissue after 131I injection. For short-term effects (24 h after injection), the Agpat9, Klk1, Klk1b family, Plau, Prf1, and S100a8 transcripts were suggested. For long-term effects (three to nine months after injection), we identified the following groups of transcripts and proteins: (a) exposure-related: the Afp and RT1-Bb transcripts and the ARF3, DLD, IKBKB, NONO, RAB6A, RPN2, SLC25A5, PTH, KRT13, and eEF1A1 proteins; (b) dose-related: the APRT, LDHA, TGM3, and DSG4 proteins; and (c) thyroid function-related: the Vegfb transcript, the ACADL, SORBS2, TPO, and TG proteins [17,18,19,20].
The aim of this study was to identify protein biomarker candidates in thyroid tissue for long-term effects (12 months) of radiation exposure, absorbed dose, and age at exposure in young and adult rats irradiated with low to moderate absorbed doses of 131I. Further, their relationship to thyroid function and thyroid cancer was discussed.
2. Material and Methods
2.1. Rat Model and Experimental Design
This study was performed on 36 healthy Sprague Dawley rats (Charles River; Germany). The animals had free access to food and water and were under daily supervision. This study was approved by the Ethical Committee on Animal Experiments in Gothenburg, Sweden (Permit Number: 145-2015).
Twelve five-week-old rats, representing young rats, were i.v. injected with 50 or 500 kBq 131I (n = 6/group), and six rats of the same age were mock treated with saline solution (controls). The remaining 18 rats (17 week old adults) were treated in a similar manner as the young rats (n = 6/group). The absorbed dose to the thyroid after i.v. injection of 50 or 500 kBq 131I was estimated to be 0.1 and 1 Gy for young rats and 0.07 and 0.7 Gy for adult rats, respectively. These values were based on data from a previous dosimetric study, correcting for differences in thyroid mass and assuming a similar fraction of thyroidal uptake of 131I [21,22].
Twelve months after 131I injection, the rats were killed by cardiac puncture after a pentabarbitalnatrium injection (APL; Kungens kurva, Sweden). Thyroid tissue was surgically removed from each rat and each divided into two pieces—one flash-frozen in liquid nitrogen and the other fixed in formalin and imbedded in paraffin for histological analysis.
2.2. Histological Evaluation of Rat Thyroid Tissue
Paraffin sections (4 µm) of thyroid tissue were stained with hematoxylin and eosin. The sections were evaluated by a certified pathologist for thyroid tissue morphology, abnormal tissue structure, and the presence of neoplastic cells.
2.3. Mass Spectrometry Analysis of Proteins
2.3.1. Protein Extraction, Digestion, and TMT-Labelling
The samples were homogenized using the lysis matrix D on the FastPrep®-24 instrument (MP Biomedicals, Solon, OH, USA) in lysis buffer (50 mM triethylammonium bicarbonate (TEAB), 2% sodium dodecyl sulfate (SDS)), and 5 cycles of 40 s each. The samples were centrifuged at maximum speed for 15 min, and the supernatant was transferred to a new vial and washed with the lysis buffer, followed by centrifugation at maximum speed. The supernatants were combined, and protein concentration was determined using the Pierce™ BCA Protein Assay (Thermo Fisher Scientific, Waltham, MA, USA) and the Benchmark Plus microplate reader (BIO-RAD, Richmond, CA, USA) with BSA solutions as standards. A representative reference containing equal amounts from each group was made.
Aliquots containing 30 μg from each protein extraction were digested with trypsin using the filter-aided sample preparation (FASP) method [23]. Briefly, samples were reduced with 100 mM dithiothreitol at 60 °C for 30 min, transferred to 30 kDa MWCO Pall Nanosep centrifugation filters (Sigma-Aldrich, Merck, Darmstadt, Germany), washed repeatedly with 8 M urea, and once with digestion buffer prior (1% sodium deoxycholate (SDC) in 50 mM TEAB) to alkylation with 10 mM methyl methanethiosulfonate in digestion buffer for 30 min. Digestion was performed in digestion buffer by the addition of 0.5 µg Pierce MS-grade Trypsin (Thermo Fisher Scientific, Waltham, MA, USA) at 37 °C and incubated overnight. Additional trypsin was added and incubated for another two hours. Peptides were collected by centrifugation.
Digested peptides were labeled using TMT 10-plex isobaric mass tagging reagents (Thermo Fisher Scientific, Waltham, MA, USA) according to the manufacturer’s instructions. Samples were randomized across the four TMT-sets each containing also one reference. Sodium deoxycholate was removed by acidification with 10% TFA. The combined sets were pre-fractionated into 40 fractions with basic reversed-phase chromatography (bRP-LC) using a Dionex Ultimate 3000 UPLC system (Thermo Fischer Scientific, Waltham, MA, USA). Peptide separations were performed using a reversed-phase XBridge BEH C18 column (3.5 μm, 3.0 × 150 mm, Waters Corporation, Milford, MA, USA) and a linear gradient from 3% to 40% solvent B over 18 min, followed by an increase to 100% B over 5 min. Solvent A was 10 mM ammonium formate buffer at pH 10.00, and solvent B was 90% acetonitrile and 10% 10 mM ammonium formate at pH 10.00. The fractions were concatenated into 20 fractions (1 + 21, 2 + 22, …, 20 + 40), dried, and reconstituted in 3% acetonitrile and 0.2% formic acid.
2.3.2. Nanoliquid Chromatography Tandem Mass Spectrometry (nLC-MS/MS)
The labeled peptide fractions were analyzed by an Orbitrap Fusion™ Lumos™ Tribrid™ mass spectrometer interfaced with an Easy-nLC1200 liquid chromatography system (Thermo Fisher Scientific, Waltham, MA, USA). Peptides were trapped on an Acclaim Pepmap 100 C18 trap column (100 μm × 2 cm, particle size 5 μm, Thermo Fisher Scientific, Waltham, MA, USA) and separated on an in-house packed analytical column (75 μm × 30 cm, particle size 3 μm, Reprosil-Pur C18, Dr. Maisch) using a linear gradient from 5% to 33% B over 77 min, followed by an increase to 100% B for 3 min, and 100% B for 10 min at a flow of 300 nL/min. Solvent A was 0.2% formic acid, and solvent B was 80% acetonitrile and 0.2% formic acid. Precursor ion mass spectra were acquired at 120 000 resolution, and MS/MS analysis was performed in a data-dependent multinotch mode, where CID spectra of the most intense precursor ions were recorded in an ion trap at a collision energy setting of 35% for 3 s (‘top speed’ setting). Precursors were isolated in the quadrupole with a 0.7 m/z isolation window, charge states 2 to 7 were selected for fragmentation, and dynamic exclusion was set to 45 s and 10 ppm. MS3 spectra for reporter ion quantitation were recorded at 50,000 resolution with HCD fragmentation at a collision energy of 65 using synchronous precursor selection.
2.3.3. Proteomics Data Analysis
The generated data files for each TMT set were merged for identification and relative quantification using Proteome Discoverer version 2.2 (Thermo Fisher Scientific, Waltham, MA, USA). The search was against Uniprot Rattus norwegicus (appoximately 38,000 sequences) using Mascot version 2.5.1 (Matrix Science, London, UK) as a search engine. The precursor mass tolerance was set to 5 ppm, and the fragment mass tolerance was set to 0.6 Da. Tryptic peptides were accepted with zero missed cleavage, variable modifications of methionine oxidation and fixed cysteine alkylation, and TMT-label modifications of N-terminal and lysine. The reference samples were used as the denominator during the calculation of the ratios of protein abundances. A percolator was used for the validation of the identified proteins. TMT reporter ions were identified in the MS3 HCD spectra with a 3 mmu mass tolerance, and the TMT reporter intensity values for each sample were normalized based on the total peptide amount. The quantified proteins were filtered at 5% FDR and grouped by sharing the same sequences to minimize redundancy. Unique peptides for a given protein were considered for quantification of the proteins. The mass spectrometry proteomics data have been deposited with the ProteomeXchange Consortium via the PRIDE [24] partner repository with the dataset identifier PXD024786.
2.4. Statistical Analysis of Protein Expression Data
Protein expression was compared between exposed and non-exposed groups. Log2 ratios were calculated by dividing corresponding logarithmized protein expression values (50 kBq or 500 kBq divided by control). A two-fold upregulation is hence a value of 1, whereas a two-fold down-regulation results in a value of −1.
The Perseus 1.6.7.0 software (Max-Planck-Institute of Biochemistry, Germany) was used for statistical analysis. The proteins that appeared in less than three of the replicates were discharged. The fold change value for a protein and each test group was calculated using a geometrical mean value and log2 transformed. Statistically significant protein regulation was determined using Anova (p < 0.05). To find proteins that were statistically significantly different between different groups, Welsh t-tests (p < 0.05) were performed. The log2 ratio cutoff was set to >0.58 and <−0.58. A heat map was generated in Perseus using the “heretical clustering” function on the statistically significant proteins.
2.5. Ingenuity Pathway Analysis
Ingenuity Pathway Analysis (IPA; Ingenuity Systems, EMEA Qiagen, Aarhus, Denmark) was used to identify and analyze canonical pathways, biological functions, and diseases, as well as upstream regulators related to the proteins significantly regulated. To identify regulated pathways and upstream regulators that may explain the protein expression alterations, Fisher’s exact test was used to calculate the overlap p-value, with p < 0.05 considered statistically significant. The z-score was calculated for each identified pathway and upstream regulator to examine the overall direction of activation. The z-score cutoff was set to +2 and −2 to denote activation and inhibition, respectively.
3. Results
Hereafter, the groups are denoted A for adult, Y for young, 50 for 50 kBq, and 500 for 500 kBq 131I activity. Hence, the group names are denoted A50, A500, Y50, and Y500.
In total, 7.147 proteins were quantified using nLC-MS/MS in thyroid tissue from exposed versus non-exposed rats. Of these, 1,799 significantly regulated proteins compared to controls with a log2 ratio of >0.58 or <−0.58 were identified. The majority of the identified proteins affected were down-regulated to a moderate extent (log2 ratio of −0.58–(−4.5), and only a few proteins were upregulated (log2 ratio of 0.58–4.5) (Figure 1). The young rats had fewer clusters in common compared to adult rats, which had a larger similarity of clusters. Of the 1799 significant proteins, 758 were identified in only one of the groups, and the remaining 1041 proteins were identified in at least two groups (Figure 2). Interestingly, 24 proteins were identified in all groups (exposure-related but not dose-related), all of which showed decreased expression levels, except the timeless circadian regulator (TIMELESS), which displayed elevated expression in the A500 group (Figure 3).
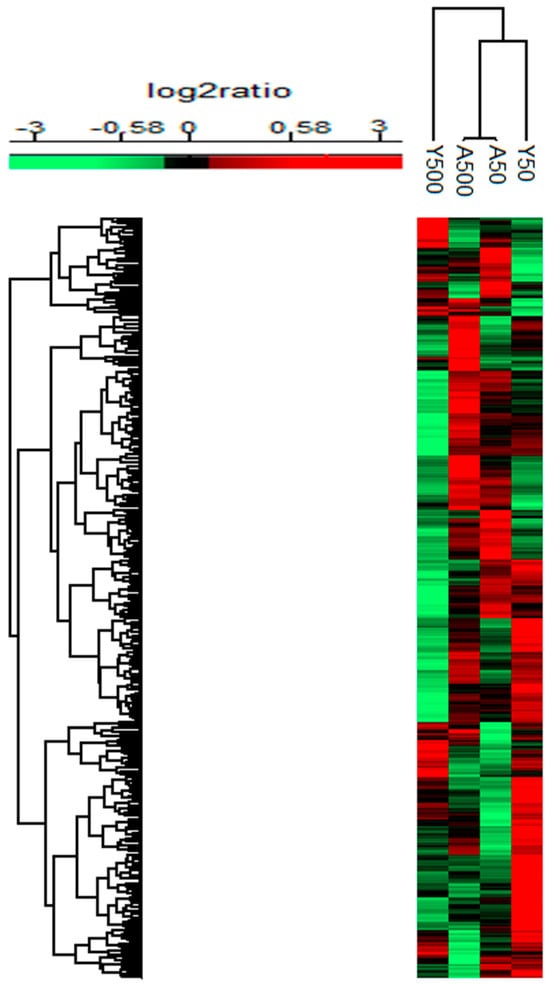
Figure 1.
Heat map for the significantly regulated proteins with a mean log2 ratio of >0.58 or <−0.58 and p-value < 0.05 after 131I exposure (injection of 50 or 500 kBq 131I) in young and adult rats compared to age-matched non-exposed rats. Upregulation is represented in red, and down-regulation is represented in green colour.
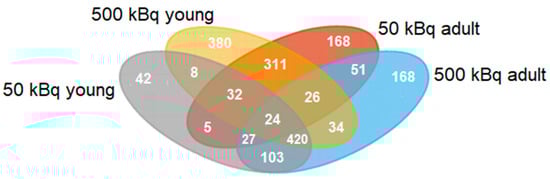
Figure 2.
Venn diagram for the significantly regulated proteins after 131I exposure (injection of 50 or 500 kBq 131I) in young and adult rats compared to age-matched non-exposed rats. The 50 kBq young rat group (Y50) is represented in gray, the 500 kBq young (Y500) is represented in yellow, the 50 kBq adult (A50) is represented in red, and the 500 kBq adult (A500) is represented in blue.
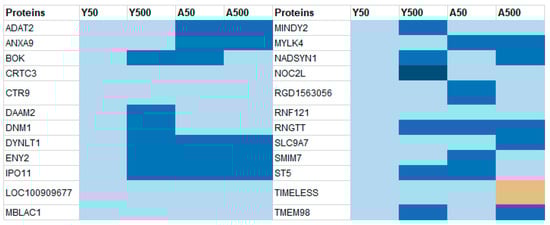
Figure 3.
The 24 proteins that were in common for all four groups. All the proteins, but TIMELESS, had decreased expression in all groups. A log2ratio between −0.58–(−1.0), −1.0–(−1.5), −1.5–(−2.0), and 0.58–1.0 is marked in light blue, blue, dark blue, and red, respectively.
3.1. Group-Specific (Unique) Proteins
Compared to the controls, 758 proteins were differentially expressed in only one of the groups, that is, 42, 380, 168, and 168 proteins for the Y50, Y500, A50, and A500, respectively (Supplementary Table S1). A higher log2 ratio was generally seen for the proteins identified in the groups exposed to 500 kBq of 131I. The top 10 differentially expressed proteins with the highest increased and decreased expression for each group were identified (Figure 4). Of these 40 proteins, eight had a log2 ratio below −1.5, and six had a log2 ratio above 1.5. The following proteins had a log2 ratio in the interval of −1.5–(−2): cytochrome P450 family 2 subfamily U member 1 protein (CYP2U1; Y500), enoyl-CoA delta isomerase 2 (ECI3; Y500), alcohol dehydrogenase 1 (ADH1; Y500), arylformamidase (AFMID; Y500), myosin heavy chain (MYHC; A50), Rh blood group D antigen (RHD; A50), potassium inwardly rectifying channel subfamily J member 16 (KCNJ16; A500), PPARGC1 and ESRR induced regulator, and muscle 1 (PERM1; A500). The proteins with a log2 ratio in the interval of 1.5–2 were as follows: adenosine deaminase (ADA; Y500), hornerin (HRNR; Y500), myosin XVIIIB (MYO18B; A500), and kininogen 1 (KNG1; A500). The myosin heavy chain 8 (MYH8; Y500) and repetin (RPTN; Y500) proteins had a log2 ratio in the interval of 2–4.
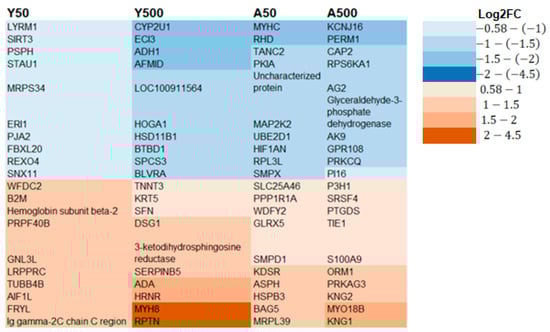
Figure 4.
The top 10 significantly regulated unique proteins for each group with the highest decreased (blue) or increased (brown) expression levels. A trend of higher expression was seen for the 500 kBq groups compared to the 50 kBq groups.
3.2. Age-Related Proteins
In total, 59 significantly regulated proteins were found in only young or adult rats, irrespective of the amount of 131I activity level, that is, 8 were detected in young and 51 in adult individuals (Figure 2 and Table 1). All proteins seen in young individuals had decreased expression levels. Furthermore, 39 of the 51 proteins seen in adults had decreased expression, 10 had increased expression in both groups (A50 and A500), and 2 had decreased expression in A50 and increased expression in A500. For the Y50 and A50 groups, 42 and 168 unique proteins were regulated, respectively. The corresponding numbers of unique proteins were 380 and 168 for the Y500 and A500 groups, respectively (Supplementary Table S1).

Table 1.
Age-related proteins in common for young and adult rats, respectively, irrespective of 131I activity injected. In total, eight proteins were significantly down-regulated in young individuals. For adults, 51 proteins were significantly regulated, the majority of which were down-regulated.
3.3. Dose-Related Proteins
Thirty-nine unique proteins were significantly regulated for the different doses (50 and 500 kBq), irrespective of age at exposure, that is, 5 for the 50 kBq groups (unique for Y50 and A50) and 34 for the 500 kBq groups (unique for Y500 and A500; Figure 2 and Table 2). Of these, 5 had increased expression, 27 had decreased expression, and 7 had increased expression in young and decreased expression in adult rats.
Table 2.
Dose-related proteins for an injected 131I activity of 50 or 500 kBq, irrespective of age. Five significant proteins were seen in the 50 kBq groups and 34 in the 500 kBq group. Positive and negative log2 ratios indicate up-regulation and down-regulation, respectively.
3.4. IPA Analysis
Using the 1799 significantly regulated proteins, the canonical pathway analysis resulted in the identification of 37 statistically significant pathways (Table 3). The vast majority of these pathways were seen in young rats, with 18 and 15 for the Y50 and Y500 groups, respectively. A few canonical pathways related to signaling were significant in the adult groups, that is, one in the A50 group (the xenobiotic metabolism CAR signaling pathway) and three in the A500 group (IKL signaling, the apelin cardiomyocyte signaling pathway, and actin cytoskeleton signaling). Altogether, four upstream regulators were identified, where none was found in the Y50 group, ephrin A2 (EFNA2) in the Y500 group, lethal-7 miRNA (let-7) and insulin-like growth factor 1 (IGF1) in the A50 group, and myocardin (MYOCD) in the A500 group (Table 4).
Table 3.
Results from ingenuity canonical pathway analysis using the IPA software. The vast majority of pathways obtained were seen in young individuals, and only a few were found in adult rats. The p value was defined by Fisher’s exact test, with p < 0.05 considered statistically significant, and z > 2 and z < 2 denoting activation and inhibition, respectively.
Table 4.
Results from upstream regulator analysis using the IPA software. Four upstream regulators were obtained; EFNA2 in the Y500 group, let-7 and IGF1 in the A50 group, and MYOCD in the 500 kBq group. The p value was defined by Fisher’s exact test, with p < 0.05 considered statistically significant and z > 2 and z < 2 denoting activation and inhibition, respectively.
3.5. Histological Evaluation of Rat Thyroid Tissue
Individual thyroid tissue samples were morphologically evaluated for each rat. The Y50 group 3/6, the Y500 group 2/6, the A50 group 1/6, and the A500 3/6 group had neoplastic changes, respectively. The young control group 4/6 and the adult control group 3/6 had neoplastic changes.
4. Discussion
In the present study, we investigated the late age- and dose-related effects of 131I exposure on protein expression in the thyroid tissue of young and adult rats twelve months after injection. The absorbed dose to the thyroid was 0.1 and 1 Gy for young rats and 0.07 and 0.7 Gy for adult rats after i.v. injections of 50 and 500 kBq, respectively. Just based on size differences between rat and man, 50 kBq for a rat would correspond to about 30 MBq 131I for a human based on the size of the thyroid (30 mg in rat and 19 g in man) or 6 MBq 131I based on body weight (600 g for rat and 70 kg for man).
In total, 7147 proteins were quantified, of which 1799 were significantly regulated, of which 758 were unique to only one of the exposed groups, and the remaining 1041 proteins were seen in at least two of the exposed groups. Several canonical pathways were thereby identified using these 1799 proteins in the IPA analysis. Furthermore, different types of biomarker candidates related to 131I exposure, age, absorbed dose, thyroid function, and thyroid cancer were proposed.
Ideally, a suitable biomarker candidate should have increased expression since it is technically easier to analyze compared to decreased expression, especially when using conventional protein detection methods such as Western blotting or ELISA. To be able to use down-regulated biomarkers, the expression levels need to be sufficiently low compared to normal expression to be technically detectable. More specifically, exposure-related biomarkers should be present in all groups, age-related biomarkers should only be present in young or adult individuals, and dose-related biomarkers should only be present in the 50 or 500 kBq groups. The unique biomarkers are only present in one of the groups (Y50, Y500, A50, or A500), which could be used to propose combined age- and dose-dependent biomarker candidates.
When evaluating the 24 common proteins identified in all groups in the present study as potential exposure-related biomarkers, no single protein had increased expression in all four test groups; 23 of the proteins were under-expressed in all groups, and the TIMELESS protein was under-expressed in all groups except the A500 group. All of these down-regulated proteins had low protein expression levels (log2 ratio of −0.58–(−1.5)). Thus, none of these proteins would be suitable as biomarkers. Furthermore, none of these proteins have, as far as we know, previously been proposed as potential biodosimeters [25].
The aldehyde dehydrogenase family 1, subfamily A7 (ALDH1A7), apolipoprotein B mRNA editing enzyme catalytic subunit 2 (APOBEC2), ATP synthase C subunit lysine N-methyltransferase (ATPSCKMT), immunoglobulin heavy constant gamma (IGHG), lipocalin 2 (LCN2), galectin-5 (LGALS5), proline rich 33 (PRR33), proteasome 20S subunit beta 8 (PSMB8), one of the heterogeneous ribonucleoparticle complexes A1b (RT1-A1B), and type IV pilus assembly (TAPC2) proteins were over-expressed in adult rats (log2 ratio 0.58–4.5) and were age-related, dose-independent biomarker candidates. In young rats, no protein with increased expression levels was seen in both the Y50 and Y500 groups, and the expression level of the down-regulated proteins was too low to be considered suitable biomarker candidates (log2 ratio of −0.58–(−1)). Previously, the LCN2 protein was suggested as a diagnostic biomarker for well differentiated thyroid cancer, including PTC (increased expression in thyroid cancer tissue both in children and adults and in plasma in children) [26,27,28,29]. Interestingly, increased LNC2 expression was not shown in young rats in the present study, possibly due to translational effects related to biological differences between rats and humans.
Here, we propose the NME/NM23 nucleoside diphosphate kinase 3 (NME3) and paralemmin 2 (PALM2) (50 kBq groups, log2 ratio of 0.58–2) and chloride channel CLIC like 1 (CLCC1), carnitine palmitoyl transferase 2 (CPT2), and haptoglobin (HP) (500 kBq groups, log2 ratio of 0.58–1.5) proteins as dose-related and age-independent candidate biomarkers with increased expression. Of these proteins, HP protein levels in serum were related to thyroid hormone levels, with increased expression levels in patients with hyperthyroidism and thyroid cancer and reduced in hypothyroidism [30,31]. The down-regulated dose-related and age-independent proteins in the present study had too low a fold change to be considered biomarker candidates.
If single biomarkers are not available or suitable, a panel of unique proteins with increased expression for each age and activity level (Y50, Y500, A50, and A500) can be used both for age- and dose-dependence. One suggestion for such a panel is to include the top 10 proteins uniquely expressed for each of the four groups, with the highest increased expression (altogether 40 proteins). Several of the proposed biomarkers have previously been identified in thyroid diseases. Increased beta-2-microglobulin (B2M) expression was seen in thyroid cancer [32,33,34]. Increased enzymatic activity of ADA was seen in thyrotoxicosis, thyroid cancer, adenomas, and thyroiditis [35]. Aberrant methylation patterns for serpin family B member 5 (SERPINB5) (together with TIMP3, RARB2, RASSF1, TPO, and TSHR) were used to distinguish between papillary thyroid cancer (PTC) and normal thyroid tissue [36]. Increased sphingomyelin phosphodiesterase 1 (SMPD1) protein expression was related to aging and thyroid cancer in mice [37]. Increased BAG cochaperone 5 (BAG5) (together with FN1) protein expression was correlated with increased PTC invasiveness [38]. The tyrosine kinase with immunoglobulin-like and EGF-like domains (TIE1) protein has been suggested to be involved in the early progression of PTC [39]. The S100A9 protein has an increased expression in serum for patients with autoimmune thyroiditis [40]. Increased expression of the S100 calcium-binding protein A9 (S100A9) protein is uncommon in well differentiated thyroid cancers but related to poorly differentiated types, for example, anaplastic thyroid cancer [41,42].
When comparing our present findings with those from our previous studies on similar types of rats at earlier time points (24 h, and 3, 6, and 9 months), none of the previously suggested protein biomarkers were seen in the present study [20,43,44]. However, the thyroid hormone metabolism signaling pathway, has previously been seen using the IPA software at 24 h postirradiation for similar dose levels [17]. This might be due to differences between the studies regarding time points. Another explanation is the use of individual samples in the present study, while pooled samples were used in the previous experiments. When irradiating with low-intermediate absorbed doses (a few particles hit each cell), the impact on individual cells in various organs can vary, and thus the proteomics expression may be different for each individual.
Furthermore, the biliverdin reductase A (BLVRA; Y500), haptoglobin (HP; 500 and A500), orosomucoid 1 (ORM1; A500), retinoblastoma transcriptional corepressor 1 (RB1; A50 and A500), ribosomal protein S6 kinase A1 (RPS6KA1; A500), and mitogen-activated protein kinase 2 (MAP2K2; A50) proteins were previously suggested as radiation biodosimeters [45]. It should be noted that the proposed biodosimeters were mainly identified based on results from in vitro and in vivo studies using various cell types, usually after much higher absorbed doses than in the present study. The present study addressed low and moderately absorbed doses to the thyroid in an in vivo setting, where non-targeted effects due to exposure to other tissues in the body and thyroid hormone-related effects may be included [25].
From the IPA analysis of young rats, several of the canonical pathways were related to the deregulation of hormones (serotonin and melanin), nicotine, bupropion, and acetone. Furthermore, pathways related to metabolism were affected, including thyroid hormone metabolism in both groups (Y50 and Y500). Signaling pathways related to synthesis were also identified, for example, gluconeogenesis and stearate, bile acid, retinoale, and cholesterol biosynthesis. The xenobiotic metabolism CAR signaling pathway was found in the A50 group. Previous studies showed that CAR receptor activation by hepatic drug-metabolizing enzymes is positively correlated with increased serum TSH levels and thyroid cell proliferation [46]. IKL signaling, the apelin cardiomyocyte signaling pathway, and actin cytoskeleton signaling were seen in the A500 group. The apelin receptor is important for the development and function of heart muscles [47]. The ILK protein is involved in the actin cytoskeleton function (involved in cellular motion and maintenance of the cell structure), and ILK inhibition may cause proliferative defects and induce cell-cycle arrest and apoptosis [48].
Four upstream regulators were detected in the IPA analysis as follows: EFNA2 (Y500), Let-7 and IGF1 (A50), and MYOCD (A500). The EFNA2 protein is a member of the Ephrin family and is a receptor tyrosine kinase that is important for development, in particular of the nervous system [47]. This protein is located in the plasma membrane and interacts with the keratin 13 (KRT13), keratin 4 (KRT4), plakophilin-1 (PKP1), and transglutaminase-1 (TGM1) proteins [47], and to our knowledge, none of them have been connected to thyroid gland or thyroid cancer. The Let-7 micoRNA is involved in suppression of the RAS oncogene, leading to suppression of PTC development [49]. The Let-7 upstream regulator interacts with the adenomatous polyposis coli (APC), insulin-like growth factor 1 receptor (IGF1R), and myeloid differentiation primary response 88 (MYD88) proteins and has direct contact with the block of proliferation 1 ribosomal biogenesis factor (BOP1) and StAR-related lipid transfer domain protein 13 (STARD13) [47]. Mutations in the APC gene are found in patients with familial adenomatous polyposis, which may manifest in PTC in a few of these patients [50,51,52]. MYD88 has been related to thyroid dysfunction and FTC [53,54,55,56]. BOP1 and STARD13 are not related to thyroid function. The IGF1 protein functions similarly to insulin but promotes growth to a greater extent [47]. The IGF1 upstream regulator (inhibition) interacts with glial fibrillary acidic protein (GFAP), proteasome 20S subunit beta 8 (PSMB8), and solute carrier family 20 member 1 (SLC20A1), and has direct contact with insulin-like growth factor 1 receptor (IGF1R) and insulin-like growth factor binding protein 3 (IGFBP3) [47]. No previous association with thyroid function was seen for GFAP. PSMB8 has been suggested as a target for miR-451a, which is a biomarker candidate for PTC [57]. Elevated serum levels and thyroid tissue expression of IGF1R are associated with PTC and ATC [58,59]. IGFBP3 is suggested to affect the prognosis and induction of lymph node metastasis in PTC, but decreased serum levels of IGFBP3 are associated with hypothyroidism and elevated levels with hyperthyroidism [60,61,62]. MYOCD is a nuclear protein and transcription factor that is highly expressed in the heart and smooth muscles [47]. The MYOCD upstream regulator (inhibition) is located in the nucleus and influences the actinin alpha 2 (ACTN2), calsequestrin 2 (CASQ2), calponin 1 (CNN1), collagen type I alpha 1 chain (COL1A1), heat shock protein family b (small) member 7 (HSPB7), myosin heavy chain 6 (MYH6), myosin heavy chain 7 (MYH7), myosin light chain 2 (MYL2), troponin c1, slow skeletal and cardiac type (TNNC1), troponin I1, slow skeletal type (TNNI1), and titin (TTN) proteins by expression. No previous association with thyroid disease was seen for CNN1, MYH6, MYH7, MYL2, TNNC1, TNNI1, or TNN. Increased expression of CASQ2 in thyroid tissue is correlated with Graves ophthalmopathy [63]. COL1A1 gene expression is seen in PTC and relates to the progression of these tumors [64,65].
When evaluating the morphology of the thyroid tissue, neoplastic changes were seen in about half of the individuals in all of the groups except the A50 group, where one abnormal sample was identified. It should be noted that the morphological and proteomic analyses were made on different parts of the thyroid samples. Previous studies have shown that thyroid morphology changes with age in Sprague Dawley rats [22], which may explain the results for the control groups. However, to fully evaluate any potential cancer induction, a longer follow-up time would have been needed. Furthermore, the result in the present study is in consistency with the results from screening of 360,000 children in the Fukushima region, where about 200 thyroid tumor cases were found [66]. In that study, the estimated absorbed dose to the thyroid was low (20 mGy), and these cases are most probably a result of detailed high-resolution ultrasonography screening. When similar examinations were performed on age-matched children living in three other areas of Japan, the incidence of thyroid nodules and cysts was in the same range as for the children exposed at the Fukushima accident [67]. It is thus probable that the morphological changes found in children in Japan and in our study are sporadic changes, not depending on radiation exposure.
5. Conclusions
In the present study, long-term proteomic effects were investigated in young and adult rats for exposure to low activities of 131I (50–500 kBq). Several biomarker candidates are proposed for 131I exposure and age, many of which are known to be related to thyroid function or thyroid cancer. A panel of 40 proteins for 131I exposure, dose-related biomarker candidates, and age-related biomarker candidates are suggested. These potential biomarkers need to be validated before being implemented in clinical or radiation protection-related practice.
Several ingenuity canonical pathways were obtained for young rats and could be categorized into hormone regulation, metabolism, and synthesis. In the adult rats, signaling pathways were related to TSH levels and thyroid cell proliferation.
Supplementary Materials
The following supporting information can be downloaded at: https://www.mdpi.com/article/10.3390/radiation4020012/s1, Table S1: Proteins that were significantly regulated in only one of the groups (Y50, Y500, A50 or A500) compared to controls.
Author Contributions
Conceptualization: M.D., E.S., J.S., B.L. and E.F.-A.; methodology: M.D., E.B., E.S., J.S., T.Z.P., B.L., K.H. and E.F.-A.; validation: M.D., K.H. and E.F.-A.; formal analysis: M.D., E.B., J.S., T.Z.P., B.L. and C.Y.; investigation: M.D., E.S., J.S., T.Z.P. and B.L. resources: M.D., E.S., J.S., T.Z.P., B.L., K.H. and E.F.-A.; data curation: M.D. and E.B. writing—original draft: M.D.; writing—review and editing: M.D., E.S., J.S., T.Z.P., B.L., C.Y., E.B., K.H. and E.F.-A.; visualization: M.D., J.S., T.Z.P., B.L., K.H. and E.F.-A.; supervision: K.H. and E.F.-A.; project administration: K.H. and E.F.-A.; funding acquisition: M.D. and E.F.-A. All authors have read and agreed to the published version of the manuscript.
Funding
This study was supported by grants from BioCARE—a National Strategic Research Program at the University of Gothenburg, the Swedish Cancer Society (grant nos. 20 1293 and 23 2975), the Swedish Research Council (grant no. 2021-02636), the Swedish state under the agreement between the Swedish government and the county councils—the ALF-agreement (ALFGBG-966074), Swedish Radiation Safety Authority (SSM), the King Gustav V Jubilee Clinic Cancer Research Foundation, the Sahlgrenska University Hospital Research Funds, the Assar Gabrielsson Cancer Research Foundation, the Adlerbertska Research Foundation, the Knut and Alice Wallenberg Foundation, the Royal Society of Arts and Sciences in Gothenburg (KVVS), and the Wilhelm and Martina Lundgren Research Foundation.
Institutional Review Board Statement
This animal experiment was approved by the Ethical Committee on Animal Experiments in Gothenburg, Sweden (Permit Number: 146-2015).
Informed Consent Statement
Not applicable.
Data Availability Statement
The mass spectrometry proteomics data have been deposited with the ProteomeXchange Consortium via the PRIDE partner repository with the dataset identifier PXD024786.
Acknowledgments
Quantitative proteomics analysis was performed at the Proteomics Core Facility at Sahlgrenska Academy, University of Gothenburg. The Proteomics Core Facility is grateful to the Inga-Britt and Arne Lundberg Research Foundation for the donation of the Orbitrap Fusion Tribrid MS instrument. The authors also thank Daniella Pettersson and Amin Al-Awar for their help with haematoxylin and eosin staining of the tissue sections and the certified pathologist Ghayeb Mohammad at Sahlgrenska University Hospital for the evaluation of the tissue sections.
Conflicts of Interest
The authors declare no conflicts of interest.
References
- Nussey, S.; Whitehead, S. Endocrinology: An Integrated Approach; BIOS Scientific Publishers: Oxford, UK, 2001. [Google Scholar]
- Raymond, J.; LaFranchi, S.H. Fetal and neonatal thyroid function: Review and summary of significant new findings. Curr. Opin. Endocrinol. Diabetes Obes. 2010, 17, 1–7. [Google Scholar] [CrossRef]
- Mullur, R.; Liu, Y.Y.; Brent, G.A. Thyroid hormone regulation of metabolism. Physiol. Rev. 2014, 94, 355–382. [Google Scholar] [CrossRef]
- Srikantia, N.; Rishi, K.S.; Janaki, M.G.; Bilimagga, R.S.; Ponni, A.; Rajeev, A.G.; Kaushik, K.; Dharmalingam, M. How common is hypothyroidism after external radiotherapy to neck in head and neck cancer patients? Indian J. Med. Paediatr. Oncol. Off. J. Indian. Soc. Med. Paediatr. Oncol. 2011, 32, 143–148. [Google Scholar] [CrossRef]
- Holm, L.E. Thyroid cancer after exposure to radioiodine. Strahlenschutz Forsch. Prax. 1985, 25, 36–56. [Google Scholar] [PubMed]
- DeGroot, L.J. Effects of irradiation on the thyroid gland. Endocrinol. Metab. Clin. N. Am. 1993, 22, 607–615. [Google Scholar] [CrossRef]
- Inskip, P.D. Thyroid cancer after radiotherapy for childhood cancer. Med. Pediatr. Oncol. 2001, 36, 568–573. [Google Scholar] [CrossRef] [PubMed]
- Robbins, J.; Schneider, A.B. Radioiodine-induced thyroid cancer: Studies in the aftermath of the accident at Chernobyl. Trends Endocrinol. Metab. 1998, 9, 87–94. [Google Scholar] [CrossRef] [PubMed]
- Ron, E.; Lubin, J.H.; Shore, R.E.; Mabuchi, K.; Modan, B.; Pottern, L.M.; Schneider, A.B.; Tucker, M.A.; Boice, J.D., Jr. Thyroid cancer after exposure to external radiation: A pooled analysis of seven studies. Radiat. Res. 1995, 141, 259–277. [Google Scholar] [CrossRef] [PubMed]
- Weiss, W. Chernobyl Thyroid Cancer: 30 Years of Follow-up Overview. Radiat. Prot. Dosimetry 2018, 182, 58–61. [Google Scholar] [CrossRef]
- International Atomic Energy Agency; Kinly, D., III (Eds.) Chernobyl’s Legacy: Health, Environmental and Socio-Economic Impacts and Recommendations to the Governments of Belarus, the Russian Federation and Ukraine; International Atomic Energy Agency (IAEA): Vienna, Austria, 2005. [Google Scholar]
- Zablotska, L.B.; Ron, E.; Rozhko, A.V.; Hatch, M.; Polyanskaya, O.N.; Brenner, A.V.; Lubin, J.; Romanov, G.N.; McConnell, R.J.; O’Kane, P.; et al. Thyroid cancer risk in Belarus among children and adolescents exposed to radioiodine after the Chornobyl accident. Br. J. Cancer 2011, 104, 181–187. [Google Scholar] [CrossRef]
- Tronko, M.D.; Howe, G.R.; Bogdanova, T.I.; Bouville, A.C.; Epstein, O.V.; Brill, A.B.; Likhtarev, I.A.; Fink, D.J.; Markov, V.V.; Greenebaum, E.; et al. A cohort study of thyroid cancer and other thyroid diseases after the chornobyl accident: Thyroid cancer in Ukraine detected during first screening. J. Natl. Cancer Inst. 2006, 98, 897–903. [Google Scholar] [CrossRef] [PubMed]
- Amundson, S.A.; Fornace, A.J., Jr. Gene expression profiles for monitoring radiation exposure. Radiat. Prot. Dosimetry 2001, 97, 11–16. [Google Scholar] [CrossRef] [PubMed]
- Chin, R.I.; Wu, F.S.; Menda, Y.; Kim, H. Radiopharmaceuticals for Neuroendocrine Tumors. Semin. Radiat. Oncol. 2021, 31, 60–70. [Google Scholar] [CrossRef]
- Chaudhry, M.A. Biomarkers for human radiation exposure. J. Biomed. Sci. 2008, 15, 557–563. [Google Scholar] [CrossRef] [PubMed]
- Rudqvist, N.; Spetz, J.; Schuler, E.; Parris, T.Z.; Langen, B.; Helou, K.; Forssell-Aronsson, E. Transcriptional response to 131I exposure of rat thyroid gland. PLoS ONE 2017, 12, e0171797. [Google Scholar] [CrossRef] [PubMed]
- Rudqvist, N.; Schuler, E.; Parris, T.Z.; Langen, B.; Helou, K.; Forssell-Aronsson, E. Dose-specific transcriptional responses in thyroid tissue in mice after (131)I administration. Nucl. Med. Biol. 2015, 42, 263–268. [Google Scholar] [CrossRef]
- Langen, B.; Rudqvist, N.; Parris, T.Z.; Helou, K.; Forssell-Aronsson, E. Circadian rhythm influences genome-wide transcriptional responses to (131)I in a tissue-specific manner in mice. EJNMMI Res. 2015, 5, 75. [Google Scholar] [CrossRef] [PubMed]
- Larsson, M.; Rudqvist, N.; Spetz, J.; Shubbar, E.; Parris, T.Z.; Langen, B.; Helou, K.; Forssell-Aronsson, E. Long-term transcriptomic and proteomic effects in Sprague Dawley rat thyroid and plasma after internal low dose 131I exposure. PLoS ONE 2020, 15, e0244098. [Google Scholar] [CrossRef] [PubMed]
- Spetz, J.; Rudqvist, N.; Forssell-Aronsson, E. Biodistribution and dosimetry of free 211At, 125I- and 131I- in rats. Cancer Biother. Radiopharm. 2013, 28, 657–664. [Google Scholar] [CrossRef]
- Rao-Rupanagudi, S.; Heywood, R.; Gopinath, C. Age-related changes in thyroid structure and function in Sprague-Dawley rats. Vet. Pathol. 1992, 29, 278–287. [Google Scholar] [CrossRef]
- Wisniewski, J.R.; Zougman, A.; Nagaraj, N.; Mann, M. Universal sample preparation method for proteome analysis. Nat. Methods 2009, 6, 359–362. [Google Scholar] [CrossRef]
- Perez-Riverol, Y.; Csordas, A.; Bai, J.; Bernal-Llinares, M.; Hewapathirana, S.; Kundu, D.J.; Inuganti, A.; Griss, J.; Mayer, G.; Eisenacher, M.; et al. The PRIDE database and related tools and resources in 2019: Improving support for quantification data. Nucleic Acids Res 2019, 47, D442–D450. [Google Scholar] [CrossRef] [PubMed]
- Langen, B.; Rudqvist, N.; Parris, T.Z.; Schuler, E.; Helou, K.; Forssell-Aronsson, E. Comparative analysis of transcriptional gene regulation indicates similar physiologic response in mouse tissues at low absorbed doses from intravenously administered 211At. J. Nucl. Med. 2013, 54, 990–998. [Google Scholar] [CrossRef]
- Celestino, R.; Nome, T.; Pestana, A.; Hoff, A.M.; Goncalves, A.P.; Pereira, L.; Cavadas, B.; Eloy, C.; Bjoro, T.; Sobrinho-Simoes, M.; et al. CRABP1, C1QL1 and LCN2 are biomarkers of differentiated thyroid carcinoma, and predict extrathyroidal extension. BMC Cancer 2018, 18, 68. [Google Scholar] [CrossRef]
- Tai, J.; Wang, S.; Zhang, J.; Ge, W.; Liu, Y.; Li, X.; Liu, Y.; Deng, Z.; He, L.; Wang, G.; et al. Up-regulated lipocalin-2 in pediatric thyroid cancer correlated with poor clinical characteristics. Eur. Arch. Otorhinolaryngol. 2018, 275, 2823–2828. [Google Scholar] [CrossRef]
- Rosignolo, F.; Sponziello, M.; Durante, C.; Puppin, C.; Mio, C.; Baldan, F.; Di Loreto, C.; Russo, D.; Filetti, S.; Damante, G. Expression of PAX8 Target Genes in Papillary Thyroid Carcinoma. PLoS ONE 2016, 11, e0156658. [Google Scholar] [CrossRef] [PubMed]
- Ma, H.; Xu, S.; Yan, J.; Zhang, C.; Qin, S.; Wang, X.; Li, N. The value of tumor markers in the diagnosis of papillary thyroid carcinoma alone and in combination. Pol. J. Pathol. 2014, 65, 202–209. [Google Scholar] [CrossRef] [PubMed]
- Ghoshal, A.; Garmo, H.; Arthur, R.; Carroll, P.; Holmberg, L.; Hammar, N.; Jungner, I.; Malmstrom, H.; Lambe, M.; Walldius, G.; et al. Thyroid cancer risk in the Swedish AMORIS study: The role of inflammatory biomarkers in serum. Oncotarget 2018, 9, 774–782. [Google Scholar] [CrossRef]
- Fan, Y.; Shi, L.; Liu, Q.; Dong, R.; Zhang, Q.; Yang, S.; Fan, Y.; Yang, H.; Wu, P.; Yu, J.; et al. Discovery and identification of potential biomarkers of papillary thyroid carcinoma. Mol. Cancer 2009, 8, 79. [Google Scholar] [CrossRef]
- Mitteldorf, C.A.; de Sousa-Canavez, J.M.; Massumoto, C.; da Camara-Lopes, L.H. Fine-needle aspiration biopsy of thyroid nodules as a possible source for molecular studies: Analysis of RNA obtained from routine cases. Diagn. Cytopathol. 2008, 36, 899–903. [Google Scholar] [CrossRef]
- Weber, R.; Bertoni, A.P.; Bessestil, L.W.; Brasil, B.M.; Brum, L.S.; Furlanetto, T.W. Validation of reference genes for normalization gene expression in reverse transcription quantitative PCR in human normal thyroid and goiter tissue. Biomed. Res. Int. 2014, 2014, 198582. [Google Scholar] [CrossRef]
- Razavi, S.A.; Afsharpad, M.; Modarressi, M.H.; Zarkesh, M.; Yaghmaei, P.; Nasiri, S.; Tavangar, S.M.; Gholami, H.; Daneshafrooz, A.; Hedayati, M. Validation of Reference Genes for Normalization of Relative qRT-PCR Studies in Papillary Thyroid Carcinoma. Sci. Rep. 2019, 9, 15241. [Google Scholar] [CrossRef] [PubMed]
- Goldberg, D.M.; Goudie, R.B. Nucleases and adenosine deaminase in malignant and non-malignant lesions of the human thyroid. Br. J. Cancer 1968, 22, 220–236. [Google Scholar] [CrossRef] [PubMed]
- Stephen, J.K.; Chen, K.M.; Merritt, J.; Chitale, D.; Divine, G.; Worsham, M.J. Methylation markers differentiate thyroid cancer from benign nodules. J. Endocrinol. Investig. 2018, 41, 163–170. [Google Scholar] [CrossRef] [PubMed]
- Traina, G.; Cataldi, S.; Siccu, P.; Loreti, E.; Ferri, I.; Sidoni, A.; Codini, M.; Gizzi, C.; Sichetti, M.; Ambesi-Impiombato, F.S.; et al. Mouse Thyroid Gland Changes in Aging: Implication of Galectin-3 and Sphingomyelinase. Mediat. Inflamm. 2017, 2017, 8102170. [Google Scholar] [CrossRef] [PubMed]
- Zhang, D.L.; Wang, J.M.; Wu, T.; Du, X.; Yan, J.; Du, Z.X.; Wang, H.Q. BAG5 promotes invasion of papillary thyroid cancer cells via upregulation of fibronectin 1 at the translational level. Biochim. Biophys. Acta Mol. Cell Res. 2020, 1867, 118715. [Google Scholar] [CrossRef] [PubMed]
- Ito, Y.; Yoshida, H.; Uruno, T.; Nakano, K.; Takamura, Y.; Miya, A.; Kobayashi, K.; Yokozawa, T.; Matsuzuka, F.; Kuma, K.; et al. Tie-1 tyrosine kinase expression in human thyroid neoplasms. Histopathology 2004, 44, 318–322. [Google Scholar] [CrossRef] [PubMed]
- Korkmaz, H.; Tabur, S.; Savas, E.; Ozkaya, M.; Aksoy, S.N.; Aksoy, N.; Akarsu, E. Evaluation of Serum S100A8/S100A9 Levels in Patients with Autoimmune Thyroid Diseases. Balkan Med. J. 2016, 33, 547–551. [Google Scholar] [CrossRef]
- Ito, Y.; Arai, K.; Nozawa, R.; Yoshida, H.; Hirokawa, M.; Fukushima, M.; Inoue, H.; Tomoda, C.; Kihara, M.; Higashiyama, T.; et al. S100A8 and S100A9 expression is a crucial factor for dedifferentiation in thyroid carcinoma. Anticancer. Res. 2009, 29, 4157–4161. [Google Scholar]
- Ito, Y.; Arai, K.; Ryushi; Nozawa; Yoshida, H.; Tomoda, C.; Uruno, T.; Miya, A.; Kobayashi, K.; Matsuzuka, F.; et al. S100A9 expression is significantly linked to dedifferentiation of thyroid carcinoma. Pathol. Res. Pract. 2005, 201, 551–556. [Google Scholar] [CrossRef]
- Rudqvist, N. Radiobiological Effects of the Thyroid Gland. PhD Thesis, University of Gothenburg, Gothenburg, Sweden, 2015. Available online: https://gupea.ub.gu.se/bitstream/2077/38006/1/gupea_2077_38006_1.pdf (accessed on 1 January 2020).
- Larsson, M.R.N.; Spetz, J.; Shubbar, E.; Parris, T.Z.; Langen, B.; Helou, K.; Forssell-Aronsson, E. Age related long-term response in rat thyroid tissue and plasma after internal low dose exposure to 131I 2021. Sci Rep. 2022, 12, 2107. [Google Scholar] [CrossRef] [PubMed]
- Marchetti, F.; Coleman, M.A.; Jones, I.M.; Wyrobek, A.J. Candidate protein biodosimeters of human exposure to ionizing radiation. Int. J. Radiat. Biol. 2006, 82, 605–639. [Google Scholar] [CrossRef] [PubMed]
- Qatanani, M.; Zhang, J.; Moore, D.D. Role of the constitutive androstane receptor in xenobiotic-induced thyroid hormone metabolism. Endocrinology 2005, 146, 995–1002. [Google Scholar] [CrossRef]
- Stelzer, G.; Rosen, N.; Plaschkes, I.; Zimmerman, S.; Twik, M.; Fishilevich, S.; Stein, T.I.; Nudel, R.; Lieder, I.; Mazor, Y.; et al. The GeneCards Suite: From Gene Data Mining to Disease Genome Sequence Analyses. Curr. Protoc. Bioinform. 2016, 54, 1–30. [Google Scholar] [CrossRef] [PubMed]
- Yen, C.F.; Wang, H.S.; Lee, C.L.; Liao, S.K. Roles of integrin-linked kinase in cell signaling and its perspectives as a therapeutic target. Gynecol. Minim. Invasive Ther. 2014, 3, 67–72. [Google Scholar] [CrossRef]
- Perdas, E.; Stawski, R.; Nowak, D.; Zubrzycka, M. The Role of miRNA in Papillary Thyroid Cancer in the Context of miRNA Let-7 Family. Int. J. Mol. Sci. 2016, 17, 909. [Google Scholar] [CrossRef] [PubMed]
- Nieminen, T.T.; Walker, C.J.; Olkinuora, A.; Genutis, L.K.; O’Malley, M.; Wakely, P.E.; LaGuardia, L.; Koskenvuo, L.; Arola, J.; Lepisto, A.H.; et al. Thyroid Carcinomas That Occur in Familial Adenomatous Polyposis Patients Recurrently Harbor Somatic Variants in APC, BRAF, and KTM2D. Thyroid. 2020, 30, 380–388. [Google Scholar] [CrossRef] [PubMed]
- Akaishi, J.; Kondo, T.; Sugino, K.; Ogimi, Y.; Masaki, C.; Hames, K.Y.; Yabuta, T.; Tomoda, C.; Suzuki, A.; Matsuzu, K.; et al. Cribriform-Morular Variant of Papillary Thyroid Carcinoma: Clinical and Pathological Features of 30 Cases. World J. Surg. 2018, 42, 3616–3623. [Google Scholar] [CrossRef]
- Cetta, F.; Montalto, G.; Gori, M.; Curia, M.C.; Cama, A.; Olschwang, S. Germline mutations of the APC gene in patients with familial adenomatous polyposis-associated thyroid carcinoma: Results from a European cooperative study. J. Clin. Endocrinol. Metab. 2000, 85, 286–292. [Google Scholar] [CrossRef]
- Li, C.; Peng, S.; Liu, X.; Han, C.; Wang, X.; Jin, T.; Liu, S.; Wang, W.; Xie, X.; He, X.; et al. Glycyrrhizin, a Direct HMGB1 Antagonist, Ameliorates Inflammatory Infiltration in a Model of Autoimmune Thyroiditis via Inhibition of TLR2-HMGB1 Signaling. Thyroid. 2017, 27, 722–731. [Google Scholar] [CrossRef]
- Peng, S.; Li, C.; Wang, X.; Liu, X.; Han, C.; Jin, T.; Liu, S.; Zhang, X.; Zhang, H.; He, X.; et al. Increased Toll-Like Receptors Activity and TLR Ligands in Patients with Autoimmune Thyroid Diseases. Front. Immunol. 2016, 7, 578. [Google Scholar] [CrossRef] [PubMed]
- Jacques, C.; Guillotin, D.; Fontaine, J.F.; Franc, B.; Mirebeau-Prunier, D.; Fleury, A.; Malthiery, Y.; Savagner, F. DNA microarray and miRNA analyses reinforce the classification of follicular thyroid tumors. J. Clin. Endocrinol. Metab. 2013, 98, E981–E989. [Google Scholar] [CrossRef]
- Rocchi, R.; Kimura, H.; Tzou, S.C.; Suzuki, K.; Rose, N.R.; Pinchera, A.; Ladenson, P.W.; Caturegli, P. Toll-like receptor-MyD88 and Fc receptor pathways of mast cells mediate the thyroid dysfunctions observed during nonthyroidal illness. Proc. Natl. Acad. Sci. USA 2007, 104, 6019–6024. [Google Scholar] [CrossRef] [PubMed]
- Fan, X.; Zhao, Y. miR-451a inhibits cancer growth, epithelial-mesenchymal transition and induces apoptosis in papillary thyroid cancer by targeting PSMB8. J. Cell Mol. Med. 2019, 23, 8067–8075. [Google Scholar] [CrossRef] [PubMed]
- Lawnicka, H.; Motylewska, E.; Borkowska, M.; Kuzdak, K.; Siejka, A.; Swietoslawski, J.; Stepien, H.; Stepien, T. Elevated serum concentrations of IGF-1 and IGF-1R in patients with thyroid cancers. Biomed. Pap. Med. Fac. Univ. Palacky. Olomouc Czech Repub. 2020, 164, 77–83. [Google Scholar] [CrossRef] [PubMed]
- He, L.; Zhang, S.; Zhang, X.; Liu, R.; Guan, H.; Zhang, H. Effects of insulin analogs and glucagon-like peptide-1 receptor agonists on proliferation and cellular energy metabolism in papillary thyroid cancer. Onco Targets Ther. 2017, 10, 5621–5631. [Google Scholar] [CrossRef] [PubMed]
- Huang, Y.; Chang, A.; Zhou, W.; Zhao, H.; Zhuo, X. IGFBP3 as an indicator of lymph node metastasis and unfavorable prognosis for papillary thyroid carcinoma. Clin. Exp. Med. 2020, 20, 515–525. [Google Scholar] [CrossRef]
- Iglesias, P.; Bayon, C.; Mendez, J.; Gancedo, P.G.; Grande, C.; Diez, J.J. Serum insulin-like growth factor type 1, insulin-like growth factor-binding protein-1, and insulin-like growth factor-binding protein-3 concentrations in patients with thyroid dysfunction. Thyroid. 2001, 11, 1043–1048. [Google Scholar] [CrossRef]
- Lakatos, P.; Foldes, J.; Nagy, Z.; Takacs, I.; Speer, G.; Horvath, C.; Mohan, S.; Baylink, D.J.; Stern, P.H. Serum insulin-like growth factor-I, insulin-like growth factor binding proteins, and bone mineral content in hyperthyroidism. Thyroid. 2000, 10, 417–423. [Google Scholar] [CrossRef]
- Wescombe, L.; Lahooti, H.; Gopinath, B.; Wall, J.R. The cardiac calsequestrin gene (CASQ2) is up-regulated in the thyroid in patients with Graves’ ophthalmopathy—support for a role of autoimmunity against calsequestrin as the triggering event. Clin. Endocrinol. 2010, 73, 522–528. [Google Scholar] [CrossRef]
- Liang, W.; Sun, F. Identification of key genes of papillary thyroid cancer using integrated bioinformatics analysis. J. Endocrinol. InvestIG. 2018, 41, 1237–1245. [Google Scholar] [CrossRef] [PubMed]
- Huang, C.; Yang, X.; Han, L.; Fan, Z.; Liu, B.; Zhang, C.; Lu, T. The prognostic potential of alpha-1 type I collagen expression in papillary thyroid cancer. Biochem. Biophys. Res. Commun. 2019, 515, 125–132. [Google Scholar] [CrossRef] [PubMed]
- Yamashita, S.; Suzuki, S.; Suzuki, S.; Shimura, H.; Saenko, V. Lessons from Fukushima: Latest Findings of Thyroid Cancer After the Fukushima Nuclear Power Plant Accident. Thyroid 2018, 28, 11–22. [Google Scholar] [CrossRef]
- Hayashida, N.; Imaizumi, M.; Shimura, H.; Okubo, N.; Asari, Y.; Nigawara, T.; Midorikawa, S.; Kotani, K.; Nakaji, S.; Otsuru, A.; et al. Thyroid ultrasound findings in children from three Japanese prefectures: Aomori, Yamanashi and Nagasaki. PLoS ONE 2013, 8, e83220. [Google Scholar] [CrossRef] [PubMed]
Disclaimer/Publisher’s Note: The statements, opinions and data contained in all publications are solely those of the individual author(s) and contributor(s) and not of MDPI and/or the editor(s). MDPI and/or the editor(s) disclaim responsibility for any injury to people or property resulting from any ideas, methods, instructions or products referred to in the content. |
© 2024 by the authors. Licensee MDPI, Basel, Switzerland. This article is an open access article distributed under the terms and conditions of the Creative Commons Attribution (CC BY) license (https://creativecommons.org/licenses/by/4.0/).