
Improvement of Quantitative Single-Photon Emission Computed Tomography Image Quality by the New Step-and-Shoot Scan Mode

 ,
,
Abstract
:Simple Summary
Abstract
1. Introduction
2. Materials and Methods
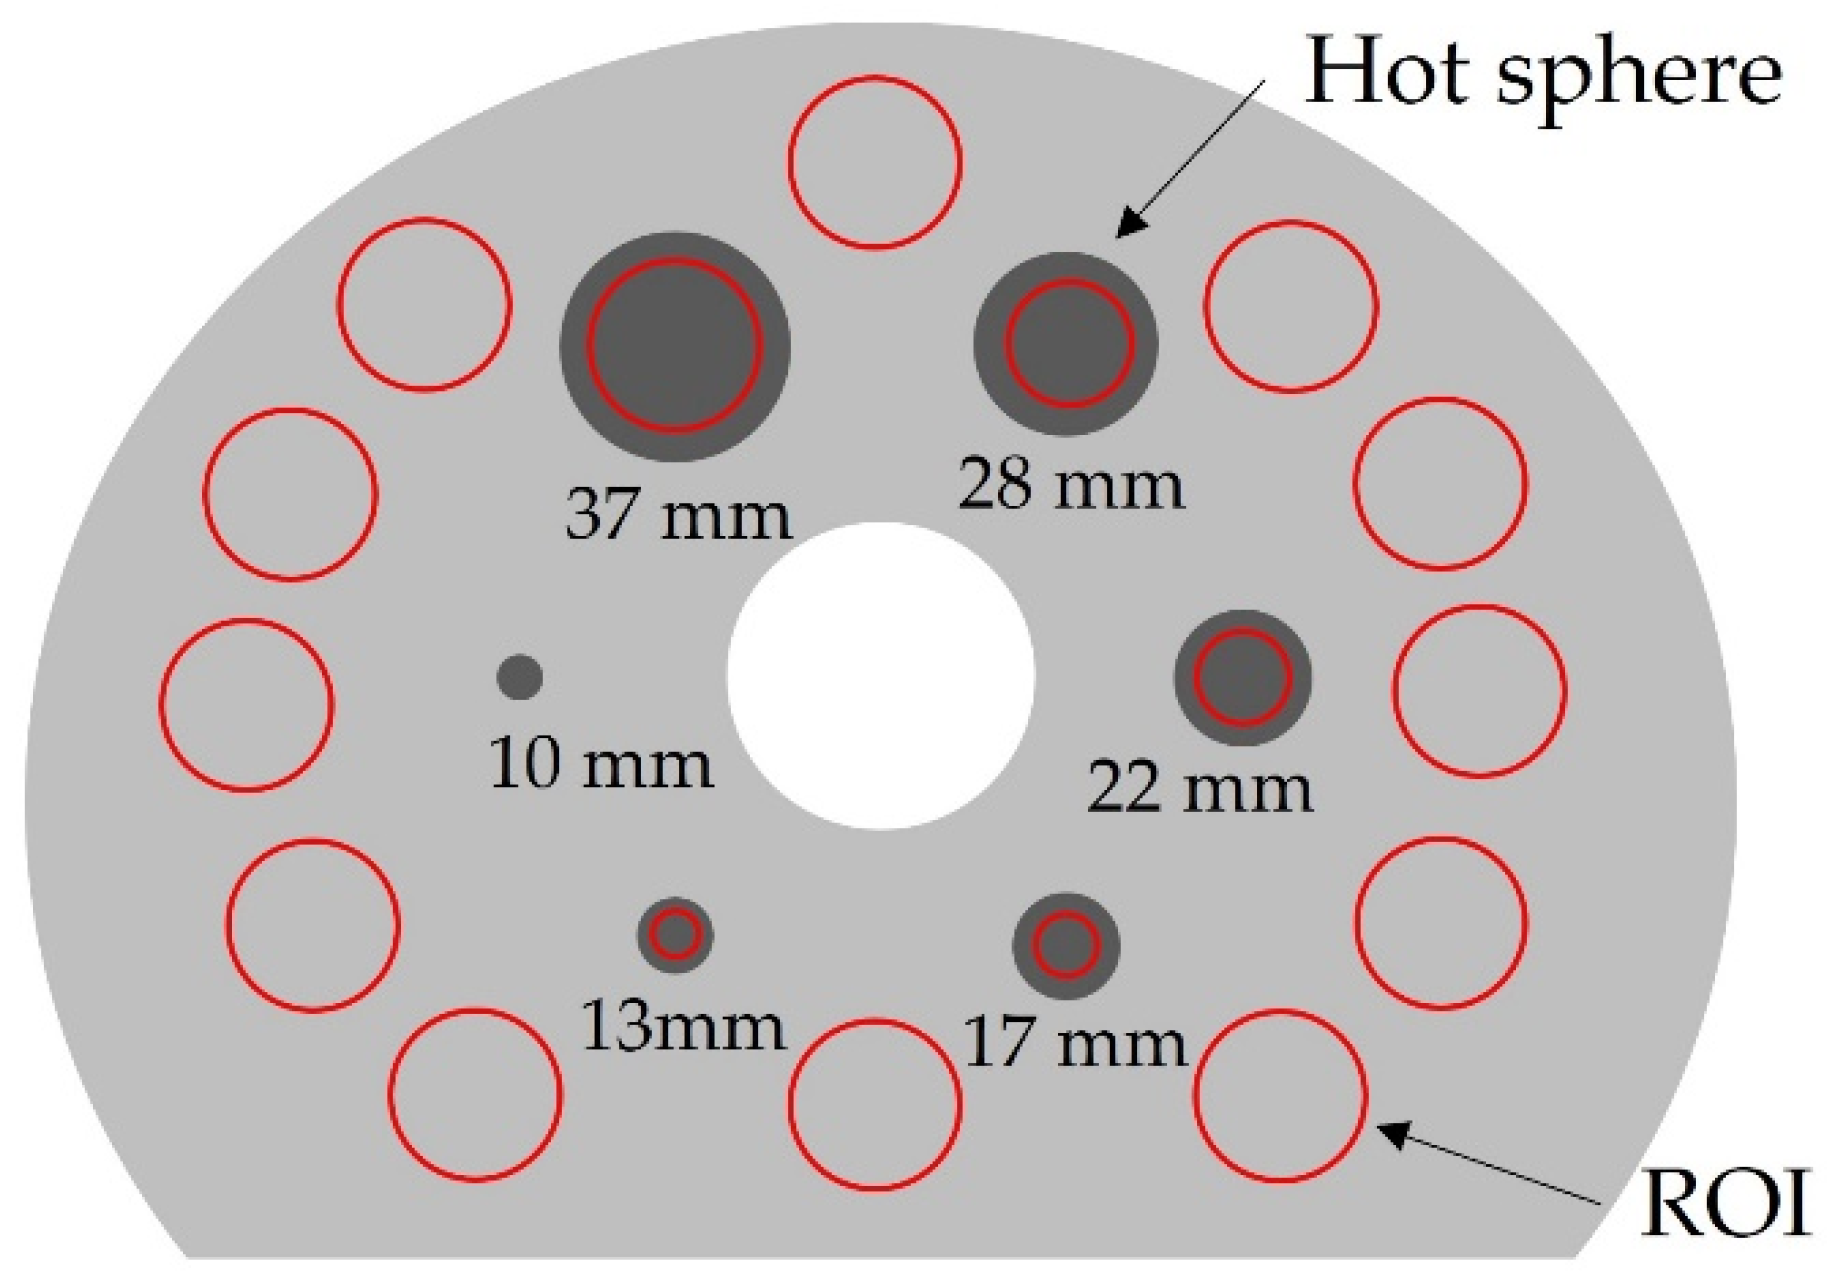
2.1. Phantom Study
2.2. SPECT/CT Image Acquisition and Reconstruction
2.3. Phantom Study Data Analyses
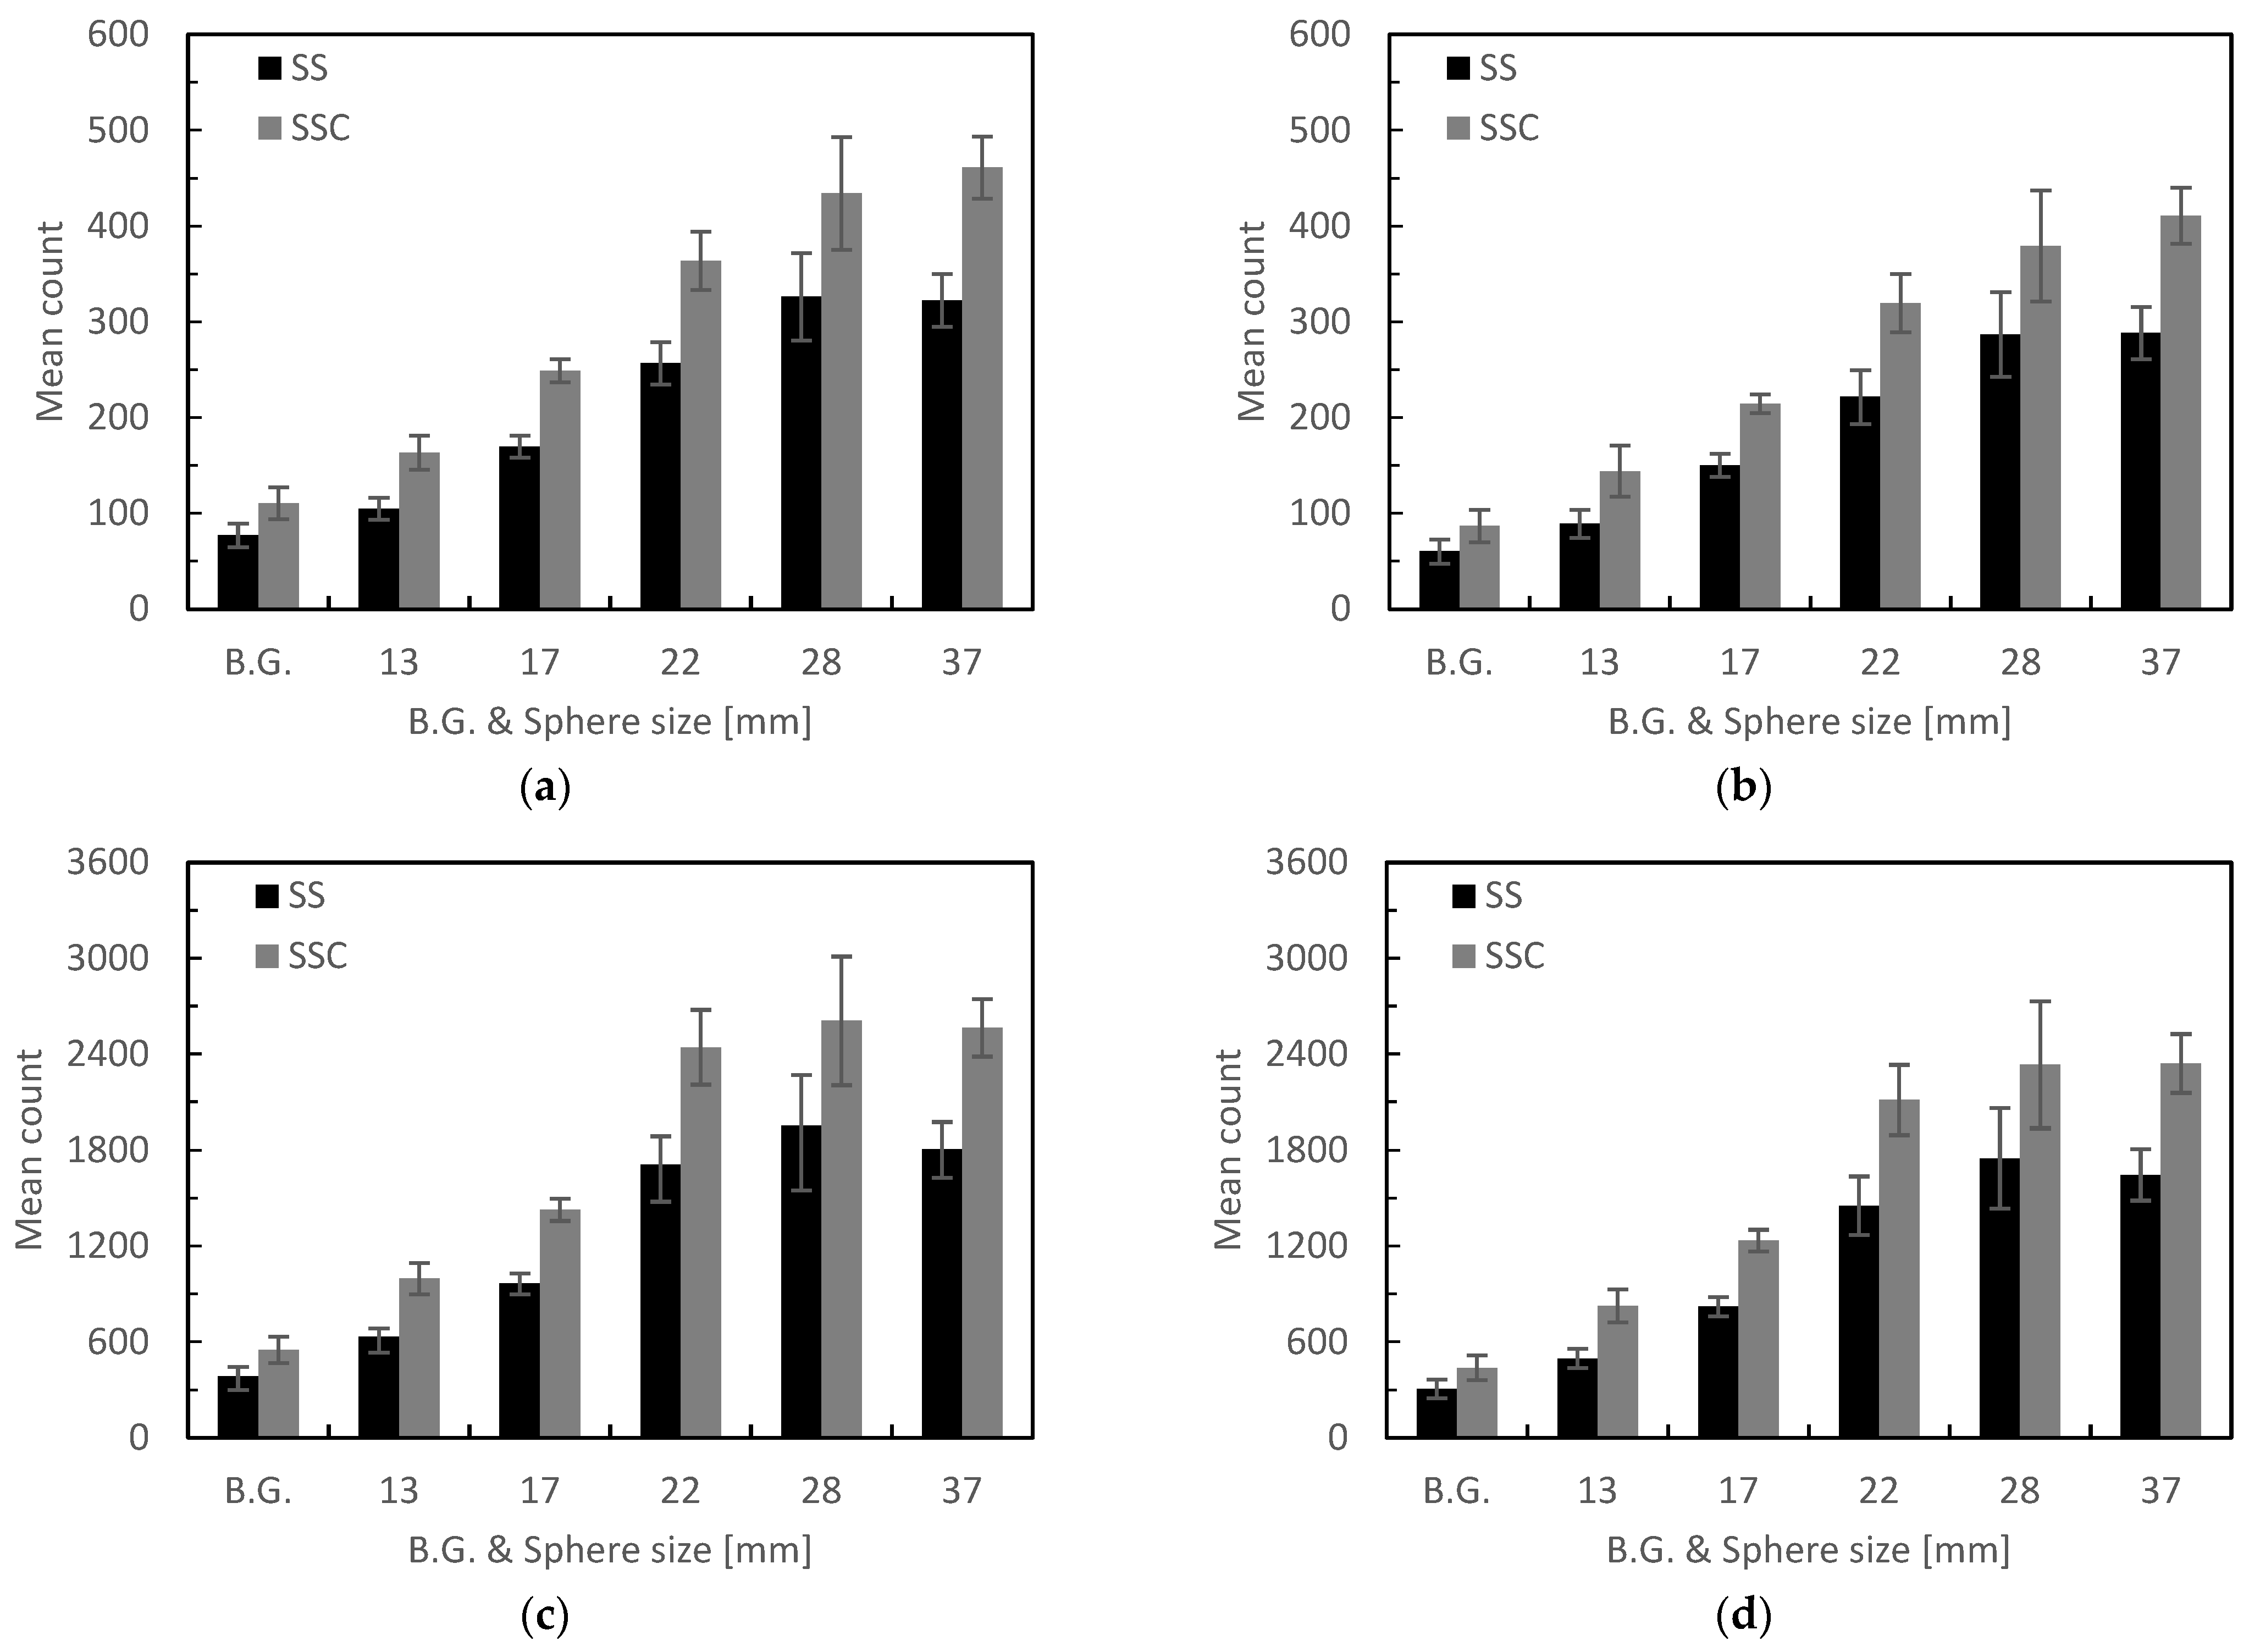
2.3.1. Count Rate
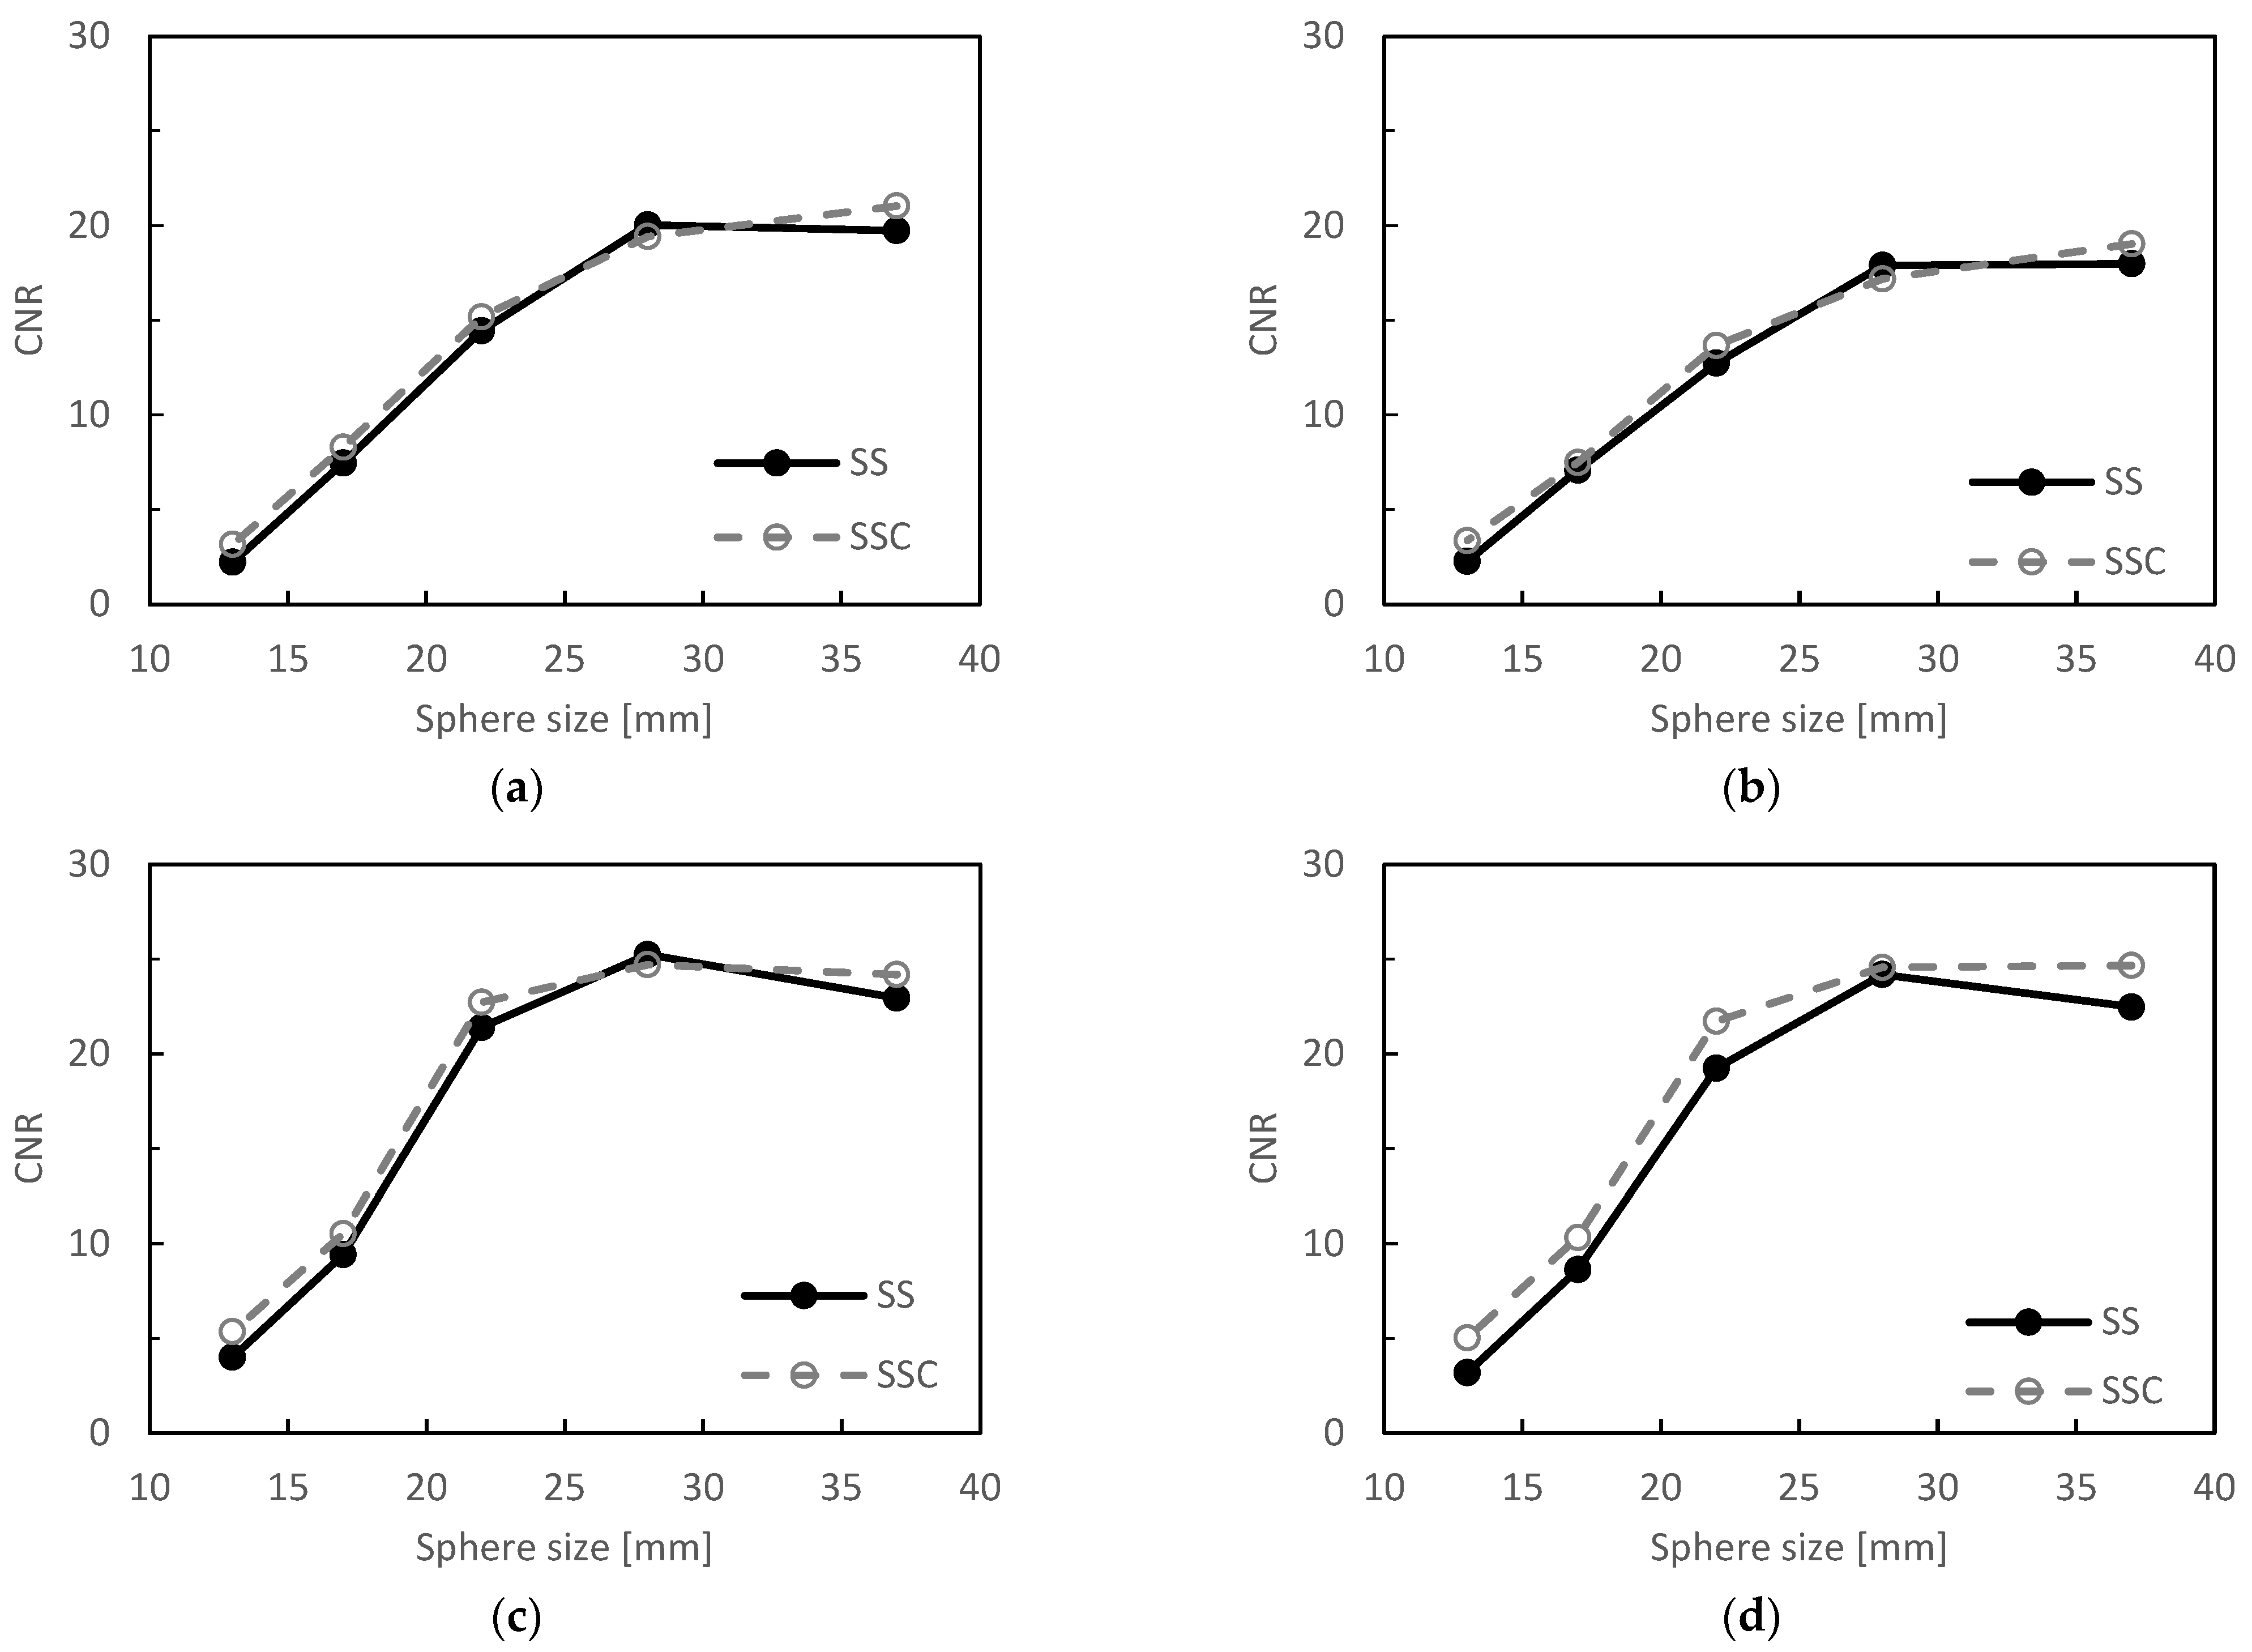
2.3.2. CNR
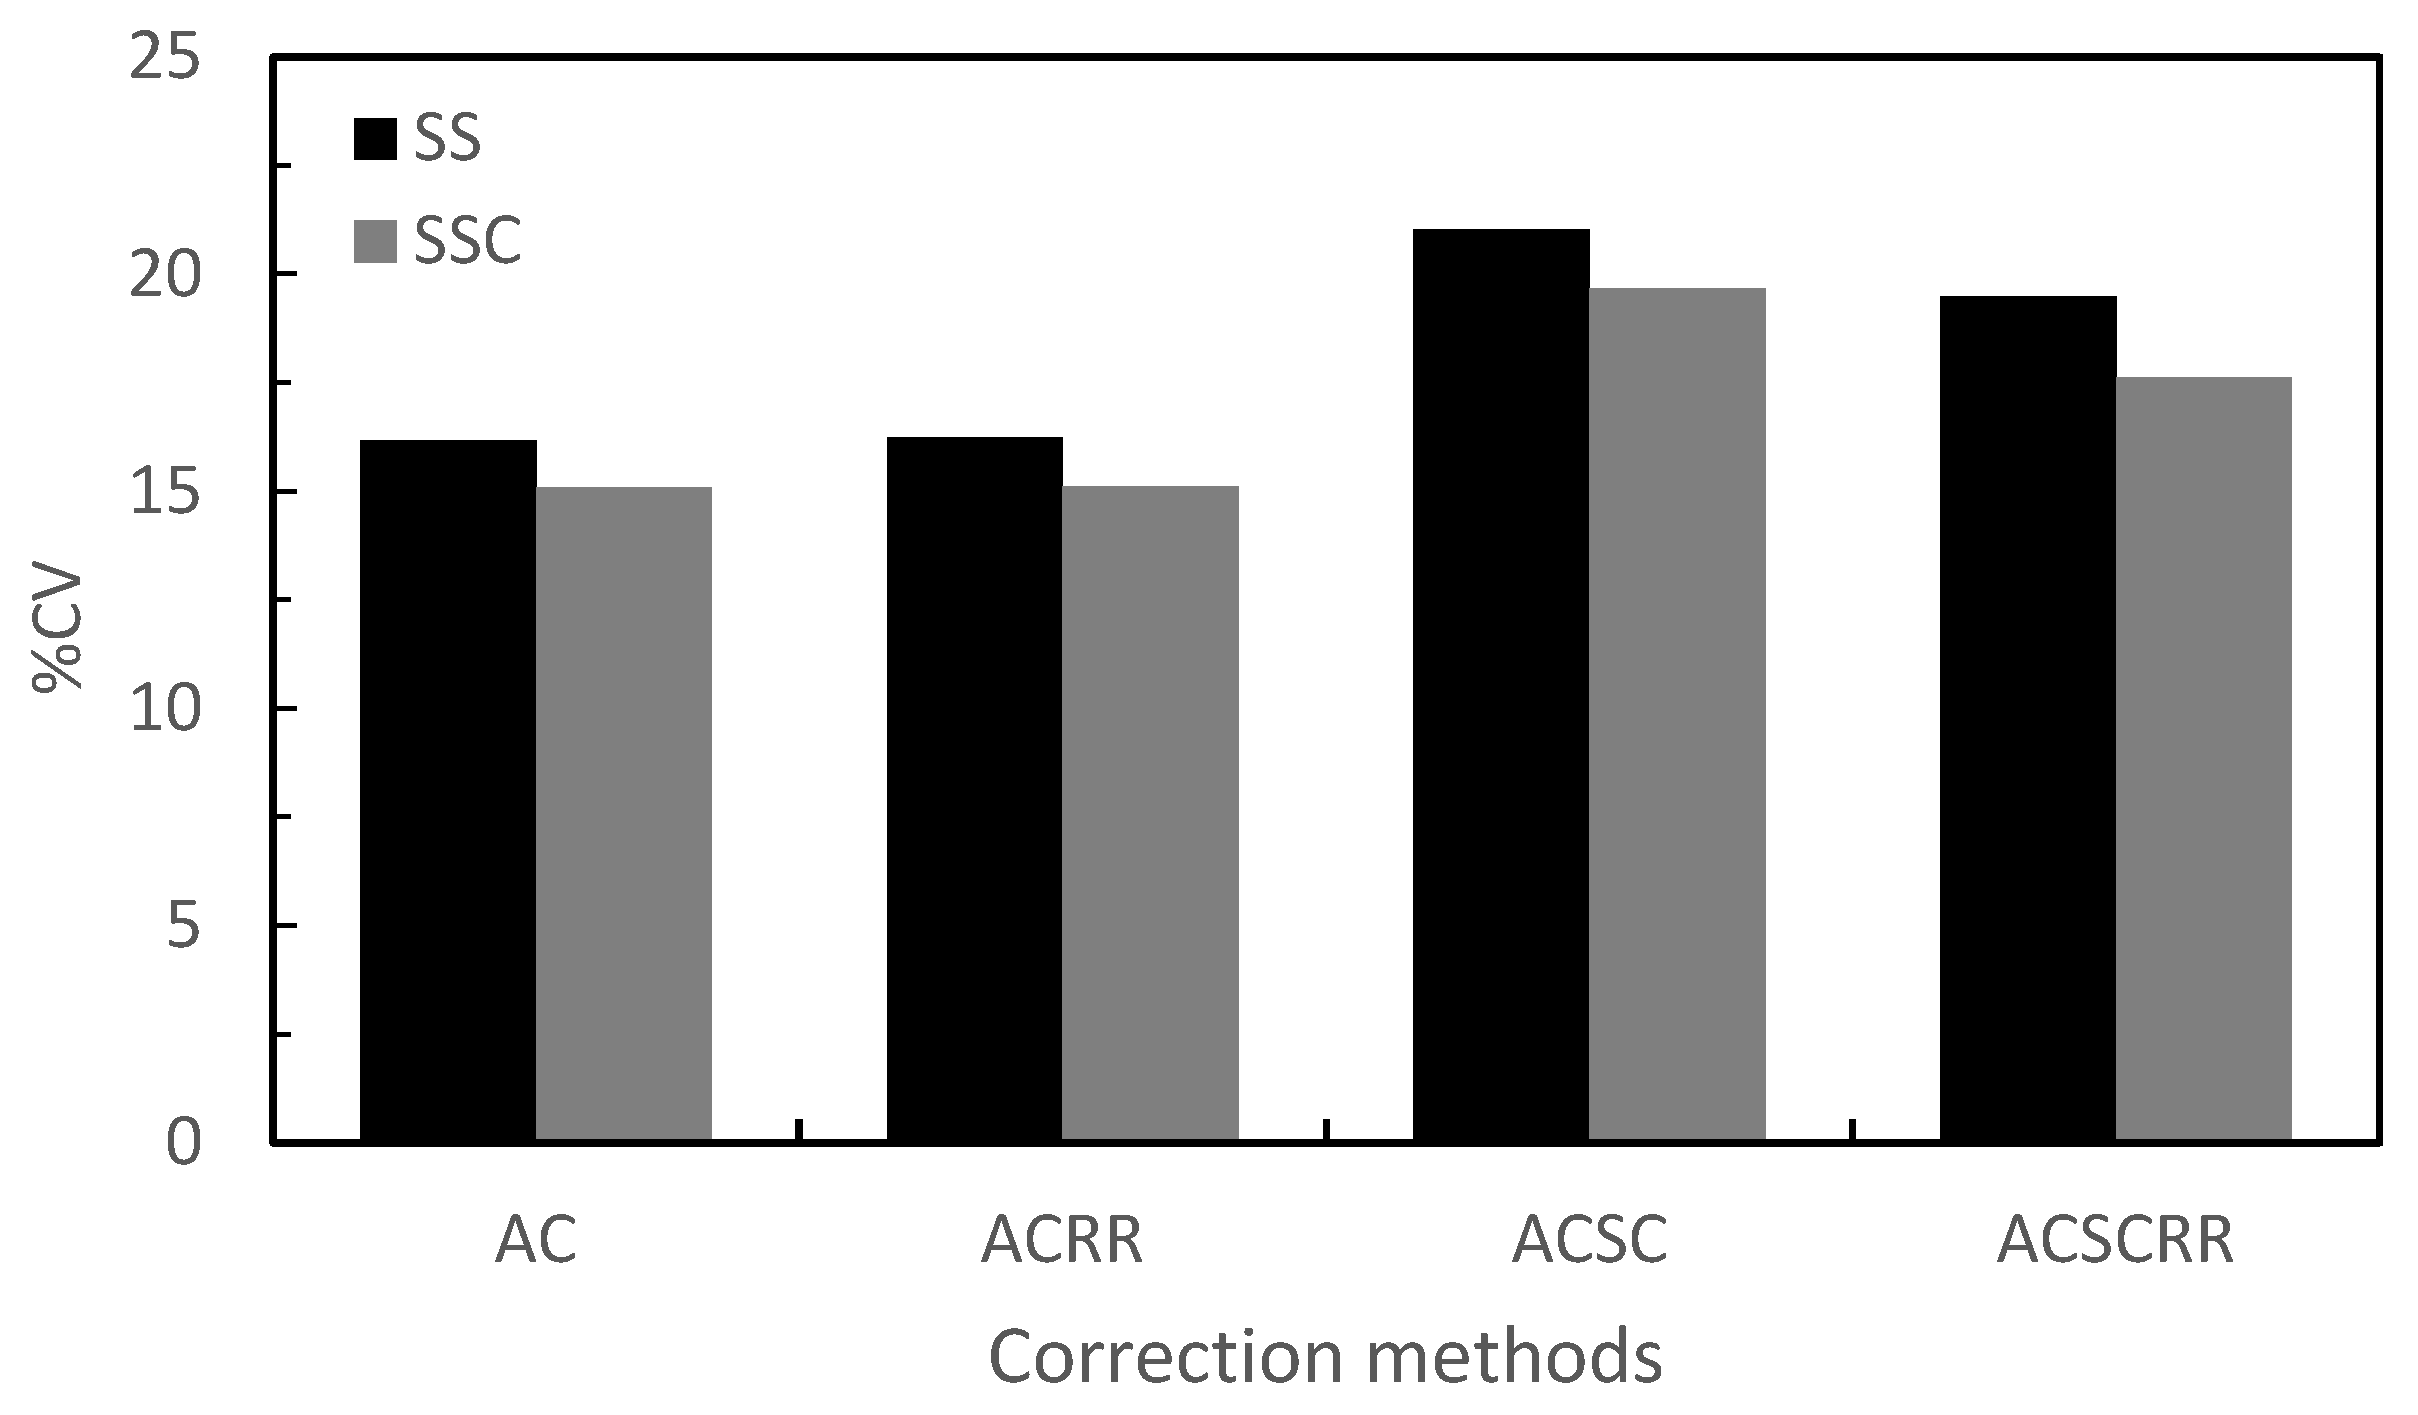
2.3.3. %CV
2.4. Clinical Case
3. Results
3.1. Phantom Study
3.1.1. Count Rate
3.1.2. CNR
3.1.3. %CV
3.2. Clinical Case
4. Discussion
5. Conclusions
Author Contributions
Funding
Institutional Review Board Statement
Informed Consent Statement
Data Availability Statement
Conflicts of Interest
References
- Yang, H.L.; Liu, T.; Wang, X.M.; Xu, Y.; Deng, S.M. Diagnosis of bone metastases: A meta-analysis comparing 18FDG PET, CT, MRI and bone scintigraphy. Eur. Radiol. 2011, 21, 2604–2617. [Google Scholar] [CrossRef] [PubMed]
- Masuda, Y.; Nagaki, A.; Kawabuchi, Y.; Nobuyoshi, O.; Katafuchi, T.; Teraoka, S.; Yanagisawa, M.; Niida, H.; Hayashi, M. Point of acquisition, processing, display and output for standardized images with clinical usefulness. Jpn. J. Nucl. Med. Technol. 2008, 28, 13–74. [Google Scholar]
- Thibault, F.; Bailly, M.; Le Rouzic, G.; Metrard, G. Clinical evaluation of General Electric new Swiftscan solution in bone scintigraphy on NaI-camera: A head to head comparison with Siemens Symbia. PLoS ONE 2019, 14, e0222490. [Google Scholar] [CrossRef] [PubMed]
- Shibutani, T.; Onoguchi, M.; Naoi, Y.; Yoneyama, H.; Konishi, T.; Tatami, R.; Nakajima, K. The usefulness of SwiftScan technology for bone scintigraphy using a novel anthropomorphic phantom. Sci. Rep. 2021, 11, 2644. [Google Scholar] [CrossRef] [PubMed]
- Japanese Society of Nuclear Medicine Technology (JSNMT); SPECT Standardization Committee. Guidelines of standardization of bone SPECT imaging. Jpn. J. Nucl. Med. Technol. 2017, 37, 517–530. [Google Scholar]
- Takahashi, Y.; Murase, K.; Mochizuki, T.; Higashino, H.; Yoshifumi, S.; Akiyoshi, K. Evaluation of the number of SPECT projections in the ordered subsets-expectation maximization image reconstruction method. Ann. Nucl. Med. 2003, 17, 525–530. [Google Scholar] [CrossRef] [PubMed]
- Nakamura, Y.; Kangai, Y.; Abe, T.; Nakahara, Y. Improvement of Standardized Uptake Value Accuracy in the 99mTc Body SPECT and SPECT/CT: Optimization of the Phantom for Calculating Becquerel Calibration Factor and Correction Method. Jpn. J. Radiol. Technol. 2021, 77, 921–931. [Google Scholar] [CrossRef] [PubMed]
- Hayashi, N.; Tokorodani, R.; Kenda, S.; Ogasawara, D.; Yabe, F.; Ito, K. Determination of Bone SPECT Image Reconstruction Conditions in the Head and Neck Region. Jpn. J. Radiol. Technol. 2021, 77, 700–709. [Google Scholar] [CrossRef] [PubMed]
- Maeda, Y.; Nagaki, A.; Komi, Y.; Abe, N.; Kashimura, S. Evaluation of resolution correction in single photon emission computed tomography reconstruction method using a body phantom: Study of three different models. Jpn. J. Radiol. Technol. 2015, 71, 1070–1079. [Google Scholar] [CrossRef] [PubMed] [Green Version]
- Takahashi, Y.; Murase, K.; Mochizuki, T.; Sugawara, Y.; Maeda, H.; Kinda, A. Simultaneous 3-dimensional resolution correction in SPECT reconstruction with an ordered-subsets expectation maximization algorithm. J. Nucl. Med. Technol. 2007, 35, 34–38. [Google Scholar] [PubMed]
- Onishi, H.; Motomura, N.; Fujino, K.; Natsume, T.; Haramoto, Y. Quantitative performance of advanced resolution recovery strategies on SPECT images: Evaluation with use of digital phantom models. Radiol. Phys. Technol. 2013, 6, 42–53. [Google Scholar] [CrossRef] [PubMed]
- Ogawa, K. Image reconstruction by ordered subsets expectation maximization method. Jpn. J. Med. Phys. 1999, 19, 184–192. [Google Scholar]
- Shigenori, M.; Masamichi, Y. Basic evaluation of OSEM algorithm by assessing iteration times and number of subsets in a hot spot phantom study. Jpn. J. Radiol. Technol. 2001, 57, 1233–1239. [Google Scholar] [CrossRef] [Green Version]


| Correction Methods | BG | Sphere Size [mm] | ||||
|---|---|---|---|---|---|---|
| 13 | 17 | 22 | 28 | 37 | ||
| AC | 43.7 | 56.1 | 46.5 | 41.6 | 33.2 | 43.0 |
| ACSC | 43.8 | 61.8 | 42.8 | 44.2 | 32.2 | 42.6 |
| ACRR | 44.0 | 57.8 | 47.5 | 42.6 | 33.7 | 41.8 |
| ACSCRR | 43.0 | 66.4 | 50.4 | 45.5 | 33.4 | 42.2 |
| (unit: %) | ||||||
| Correction Methods | Sphere Size [mm] | ||||
|---|---|---|---|---|---|
| 13 | 17 | 22 | 28 | 37 | |
| AC | 42.1 | 11.1 | 5.1 | −3.0 | 6.6 |
| ACSC | 48.3 | 5.7 | 7.3 | −4.0 | 5.8 |
| ACRR | 33.7 | 11.8 | 6.2 | −2.1 | 5.4 |
| ACSCRR | 57.8 | 19.6 | 12.9 | 1.5 | 9.8 |
| (unit: %) | |||||
| Correction Methods | Sphere Size [mm] | ||||
|---|---|---|---|---|---|
| 13 | 17 | 22 | 28 | 37 | |
| AC | 0.9 | 0.8 | 0.7 | 0.6 | 1.3 |
| ACSC | 1.1 | 0.4 | 0.9 | 0.7 | 1.0 |
| ACRR | 1.4 | 1.1 | 1.3 | 0.5 | 1.2 |
| ACSCRR | 1.8 | 1.7 | 2.5 | 0.4 | 2.2 |
| Scan Mode | Correction Methods | Tumor | Normal Bone | CNR | ||
|---|---|---|---|---|---|---|
| Mean Count | SD | Mean Count | SD | |||
| SS | AC | 122.3 | 16.7 | 48.4 | 7.0 | 10.6 |
| ACSC | 102.1 | 17.4 | 33.7 | 6.7 | 10.3 | |
| ACRR | 774.9 | 89.5 | 275.0 | 45.7 | 10.9 | |
| ACSCRR | 701.4 | 88.5 | 227.6 | 43.2 | 11.0 | |
| SSC | AC | 178.6 | 19.4 | 73.3 | 10.0 | 10.5 |
| ACSC | 153.9 | 18.4 | 54.2 | 9.7 | 10.2 | |
| ACRR | 1146.4 | 120.6 | 409.6 | 65.8 | 11.2 | |
| ACSCRR | 1038.4 | 129.6 | 337.9 | 58.1 | 12.1 | |
Publisher’s Note: MDPI stays neutral with regard to jurisdictional claims in published maps and institutional affiliations. |
© 2022 by the authors. Licensee MDPI, Basel, Switzerland. This article is an open access article distributed under the terms and conditions of the Creative Commons Attribution (CC BY) license (https://creativecommons.org/licenses/by/4.0/).
Share and Cite
Yamamoto, H.; Sasaki, A.; Osaka, M.; Shirakawa, K.; Seino, M.; Matsuhashi, T.; Takahashi, Y.; Zeniya, T.; Hosokawa, S.; Narita, M.; et al. Improvement of Quantitative Single-Photon Emission Computed Tomography Image Quality by the New Step-and-Shoot Scan Mode. Radiation 2022, 2, 168-176. https://doi.org/10.3390/radiation2020012
Yamamoto H, Sasaki A, Osaka M, Shirakawa K, Seino M, Matsuhashi T, Takahashi Y, Zeniya T, Hosokawa S, Narita M, et al. Improvement of Quantitative Single-Photon Emission Computed Tomography Image Quality by the New Step-and-Shoot Scan Mode. Radiation. 2022; 2(2):168-176. https://doi.org/10.3390/radiation2020012
Chicago/Turabian StyleYamamoto, Hiroki, Ami Sasaki, Mizuki Osaka, Koji Shirakawa, Morio Seino, Takaaki Matsuhashi, Yasuyuki Takahashi, Tsutomu Zeniya, Shota Hosokawa, Masataka Narita, and et al. 2022. "Improvement of Quantitative Single-Photon Emission Computed Tomography Image Quality by the New Step-and-Shoot Scan Mode" Radiation 2, no. 2: 168-176. https://doi.org/10.3390/radiation2020012
APA StyleYamamoto, H., Sasaki, A., Osaka, M., Shirakawa, K., Seino, M., Matsuhashi, T., Takahashi, Y., Zeniya, T., Hosokawa, S., Narita, M., & Aoki, M. (2022). Improvement of Quantitative Single-Photon Emission Computed Tomography Image Quality by the New Step-and-Shoot Scan Mode. Radiation, 2(2), 168-176. https://doi.org/10.3390/radiation2020012