1. Introduction
The global outbreak of COVID-19 severely affected the tourism industry (
Škare et al., 2021). In the early phase of the pandemic in 2020 and 2021, strict infection control measures caused sudden social and economic changes. During this period, countries and regions struggled to respond with measures such as lockdowns, travel restrictions, border closures, and economic support (
Deb et al., 2021;
Hammer, 2021;
Li et al., 2023). In Japan, repeated declarations of a state of emergency and travel restrictions since April 2020 resulted in a significant decline in revenue for many tourism facilities and accommodations (
Japan Tourism Agency, 2022). To revitalize local economies and stimulate domestic tourism demand, the Japanese government implemented the domestic travel subsidy program, the Go To Travel campaign (
Japan Tourism Agency, 2021). Analyzing the impact of such policies and demand fluctuations is crucial for organizing past events, preparing for future crises, understanding the changes in the tourism industry, and expanding the possibilities of tourism.
In recent years, Japan has actively promoted regional development centered on tourism in line with the “tourism-oriented nation” and “regional economic revitalization through tourism promotion” initiatives. Efforts to develop tourism resources and conduct promotional activities have increased to create tourism demand in surrounding regions, particularly in areas that are not traditionally major tourist destinations (
Japan Tourism Agency, 2018). While studies have reported the severe impact of COVID-19 on tourism industries in major tourist destinations and urban areas (
Bui et al., 2021;
Dantsuji et al., 2023;
Sun et al., 2022;
Ren et al., 2022), insufficient academic attention has been paid to how tourism-related businesses in regions promoting tourism development or in areas with limited tourism demand were affected and what factors affected their sales.
This study aims to provide insights into the vulnerability and recovery potential of tourism-related businesses during the COVID-19 pandemic by empirically analyzing the factors that influenced the sales of tourism establishments in regions with limited tourism demand yet maintained ongoing promotional efforts. Focusing on the Nishimikawa region in Aichi Prefecture, Japan, this study surveyed tourism-related businesses and perform statistical analyses to examine how factors such as mobility restrictions due to the state of emergency and government policies, such as the Go To Travel campaign, affected their sales. The findings are expected to offer practical implications for tourism-related businesses in regions promoting tourism development and contribute to formulating regional economic policies. Although the findings are not intended to be universally generalized, they provide valuable insights for tourism promotion strategies and regional economic policy both within Japan and in comparable global contexts.
2. Literature Review
According to the United Nations World Tourism Organization (UNWTO), the number of international tourists decreased by 74% in 2020 due to COVID-19, resulting in a loss of USD 1.3 trillion in tourism revenue. By 2022, tourism had recovered to 63% of pre-pandemic levels, with Europe and the Middle East reaching approximately 80%, while Asia lagged (
UN Tourism, 2023).
Many studies have investigated the impact of COVID-19 on tourism in various countries and regions. International tourism research has focused on tourist arrivals and international trade in tourism services. For instance,
Deyshappriya et al. (
2021) highlighted the impact of COVID-19 on international tourism in Asian and Pacific countries, reporting a global decline of 68.6% in international tourist arrivals in 2020 compared to 2019. Similarly,
Korinth (
2022) analyzed international tourism income in major tourist-receiving countries, identifying critical regions affected by the pandemic, including Northeast and Southeast Asia, North America, the Middle East, and Africa. Moreover,
Gorina et al. (
2022) examined the impact of COVID-19 on international trade in European tourism services. They revealed differences in responses to the challenges of 2020 between regions with passive and active trade balances. These studies have shown that the global tourism industry has been significantly affected by COVID-19, with the impact varying across different regions and countries.
The impact of COVID-19 on the tourism industry varied across countries and within regions of individual countries.
Curtale et al. (
2023) analyzed the impact of COVID-19 on tourism demand in Europe and found that urban areas heavily reliant on foreign tourists experienced more significant losses in tourism demand. In contrast, low-density areas with natural attractions, such as coasts and mountains, saw more minor guest-night declines.
Duro et al. (
2021) developed a vulnerability index to assess the impact of COVID-19 across Spain’s 50 provinces. Their findings indicated that regions highly dependent on international tourism and those with high seasonality were more vulnerable. In contrast, areas closer to major cities, regions with a strong rural tourism supply, and those relying on domestic tourism were less vulnerable.
Santos and Moreira (
2021) examined Portugal’s tourism sector and found that low-density areas with periurban and rural characteristics, especially those focused on nature tourism, were less severely impacted. Domestic tourism helped mitigate some of the adverse effects. Similarly,
Vaishar and Šťastná (
2020) investigated the pandemic’s impact on rural tourism in Czechia, finding that destinations focused on foreign tourists were most affected, while the Czech countryside, with its natural, gastronomic, and local attractions, experienced a rise in domestic tourists, creating opportunities for developing rural tourism. These studies reveal that the impact of COVID-19 on tourism varied based on regional and local characteristics. Areas highly dependent on international tourism or with high seasonality were more affected; in contrast, destinations relying on domestic travel or emphasizing nature and rural tourism were less impacted.
The COVID-19 pandemic has profoundly impacted tourism-related industries, with varying effects across different sectors. Several studies highlight the differences in various tourism businesses’ resilience and recovery capacities.
Jafari et al. (
2023) interviewed direct and indirect tourism stakeholders. They found that sectors such as hotels, restaurants, travel agencies, and transportation suffered significantly due to the global lockdown. Conversely, some sectors, such as internet and technology businesses, realized positive gains, demonstrating the uneven impact of the pandemic across industries. Similarly,
Huynh et al. (
2021) studied the tourism sector in a typical emerging city in Vietnam. They found that businesses, particularly travel agencies and accommodation providers, were on the brink of bankruptcy or permanent closure. The study revealed significant declines in the number of customers, revenue, and employment across the tourism sector, although the severity of the impact varied across businesses.
Sobaih et al. (
2021) examined small tourism businesses and found they were particularly devastated by the COVID-19 pandemic. Their structural equation modeling analysis showed that restaurant operators were more resilient than hotel operators, who had more difficulty adapting. Similarly,
Brilhante and Rocha (
2023) examined the effects of COVID-19 on the Azores’ tourism industry. They found that the accommodation sector was hit harder than the restaurant sector, indicating a difference in sector-specific vulnerabilities.
Hajilo et al. (
2024) found that, rather than implementing innovative solutions, many tourism business managers resorted to simple cost-cutting measures, such as downsizing employees, closing businesses, and reducing wages. Their research concluded that government policies and financial support were inadequate, especially in the tourism sector, which suffered from sociocultural, financial, and technological deficiencies. In summary, this body of literature illustrates the COVID-19 pandemic’s varied impact on the tourism industry across sectors, with small businesses, particularly restaurants, exhibiting more resilience than larger accommodation providers. However, the tourism industry suffered significant losses overall, and many businesses struggled to recover without adequate government support and innovation in operations.
In addition to sectoral and regional disparities, recent studies have demonstrated that the resilience of tourist destinations depends not only on geographically or resource-based factors but also on place image and reputation.
Avraham (
2015) argued that destinations dealing with negative images must adopt strategic communication to rebuild their reputations and attract tourists to return postcrisis. According to
Baalbaki and Zizka (
2023), consistent branding that emphasizes cultural heritage can strengthen a destination’s image, aiding recovery.
Matlovičová (
2024) has highlighted how destinations with a strong, well-aligned image recover more rapidly from crises, especially when their place image authentically reflects local identity rather than being artificially constructed. These studies underscore the critical role of destination image and strategic branding for tourism resilience.
Other studies have emphasized the importance of viewing the COVID-19 pandemic as part of a broader polycrisis involving overlapping global challenges like climate change, conflict, and socioeconomic inequality.
Nagaj and Žuromskaitė (
2021) demonstrated that reduced tourism activity during the pandemic led to decreased greenhouse gas emissions, demonstrating the complex interrelation of public health, economic, and environmental crises.
Phiri (
2024) examined how the COVID-19 pandemic, climate change, and global conflicts jointly impacted economic outcomes in Sub-Saharan Africa, highlighting the mitigating role of effective governance. In addition,
Szabó et al. (
2023) highlighted the importance of the geographically equitable development and post-pandemic recovery of spa towns that utilize medicinal waters for health tourism. Their study found low regional disparities in Hungary’s medicinal water distribution, suggesting that balanced regional planning can foster sustainable tourism resilience. These studies illustrated the argument by
Matlovič and Matlovičová (
2024) that addressing such polycrisis requires a postdisciplinary approach that transcends traditional academic boundaries, which should prompt tourism studies to look beyond the field’s traditional boundaries.
Government adopted various efforts to mitigate the pandemic’s adverse impact on the tourism industry, with policies and outcomes differing by country. In Turkey,
Koçak et al. (
2022) found that tourism negatively responded to increases in COVID-19 cases and deaths, as well as global fear. However, government containment, health measures, and economic support positively influenced the sector. Similarly, in Malaysia,
Abhari et al. (
2022) highlighted the effectiveness of recovery strategies and government-backed policies, such as the National Recovery Plan, in helping small tourism businesses, especially in the food and beverage industry, avoid significant losses. The Japanese government implemented the Go To Travel campaign in 2020 to bolster domestic tourism.
Matsuura and Saito (
2022) observed that the pandemic reduced tourism demand in heavily affected and less impacted regions. Their study showed that domestic travel subsidies through the Go To Travel campaign helped mitigate the economic damage to the accommodation sector.
Delgado (
2023) also revealed that the campaign significantly increased mobility behavior.
Funashima and Hiraga (
2022) raised concerns about whether such subsidies contributed to the spread of the virus, finding that while domestic travel increased, there was no conclusive evidence that the subsidies contributed to disseminating the infection. However,
Anzai et al. (
2022) indicated that the enhanced movement resulting from the Go To Travel campaign facilitated spatial spread of COVID-19 from urban to nonurban locations. And
Tamura et al.’s (
2022) examination of the campaign identified that it led to a significant increase in COVID-19 cases in areas outside Tokyo of up to 34.4%. Together, these studies underscore the complex trade-off between supporting economic recovery in the tourism industry and controlling the spread of the virus, with diverse outcomes according to the stringency and scope of the implemented policies.
This literature review shows that the impact of COVID-19 varied across regions, sectors and destination image, with significant differences observed internationally and within individual countries. While studies in Japan have focused on tourism support policies, there is limited research on the regional characteristics of COVID-19’s impact and the effectiveness of such policies in different areas. Therefore, this study aims to clarify the effects on tourism, particularly in tourist promotion regions or areas with limited tourism demand, highlighting the regional differences that have not been sufficiently explored in prior research.
3. Materials and Methods
3.1. Research Period and Overview of COVID-19 Related Policies in Japan
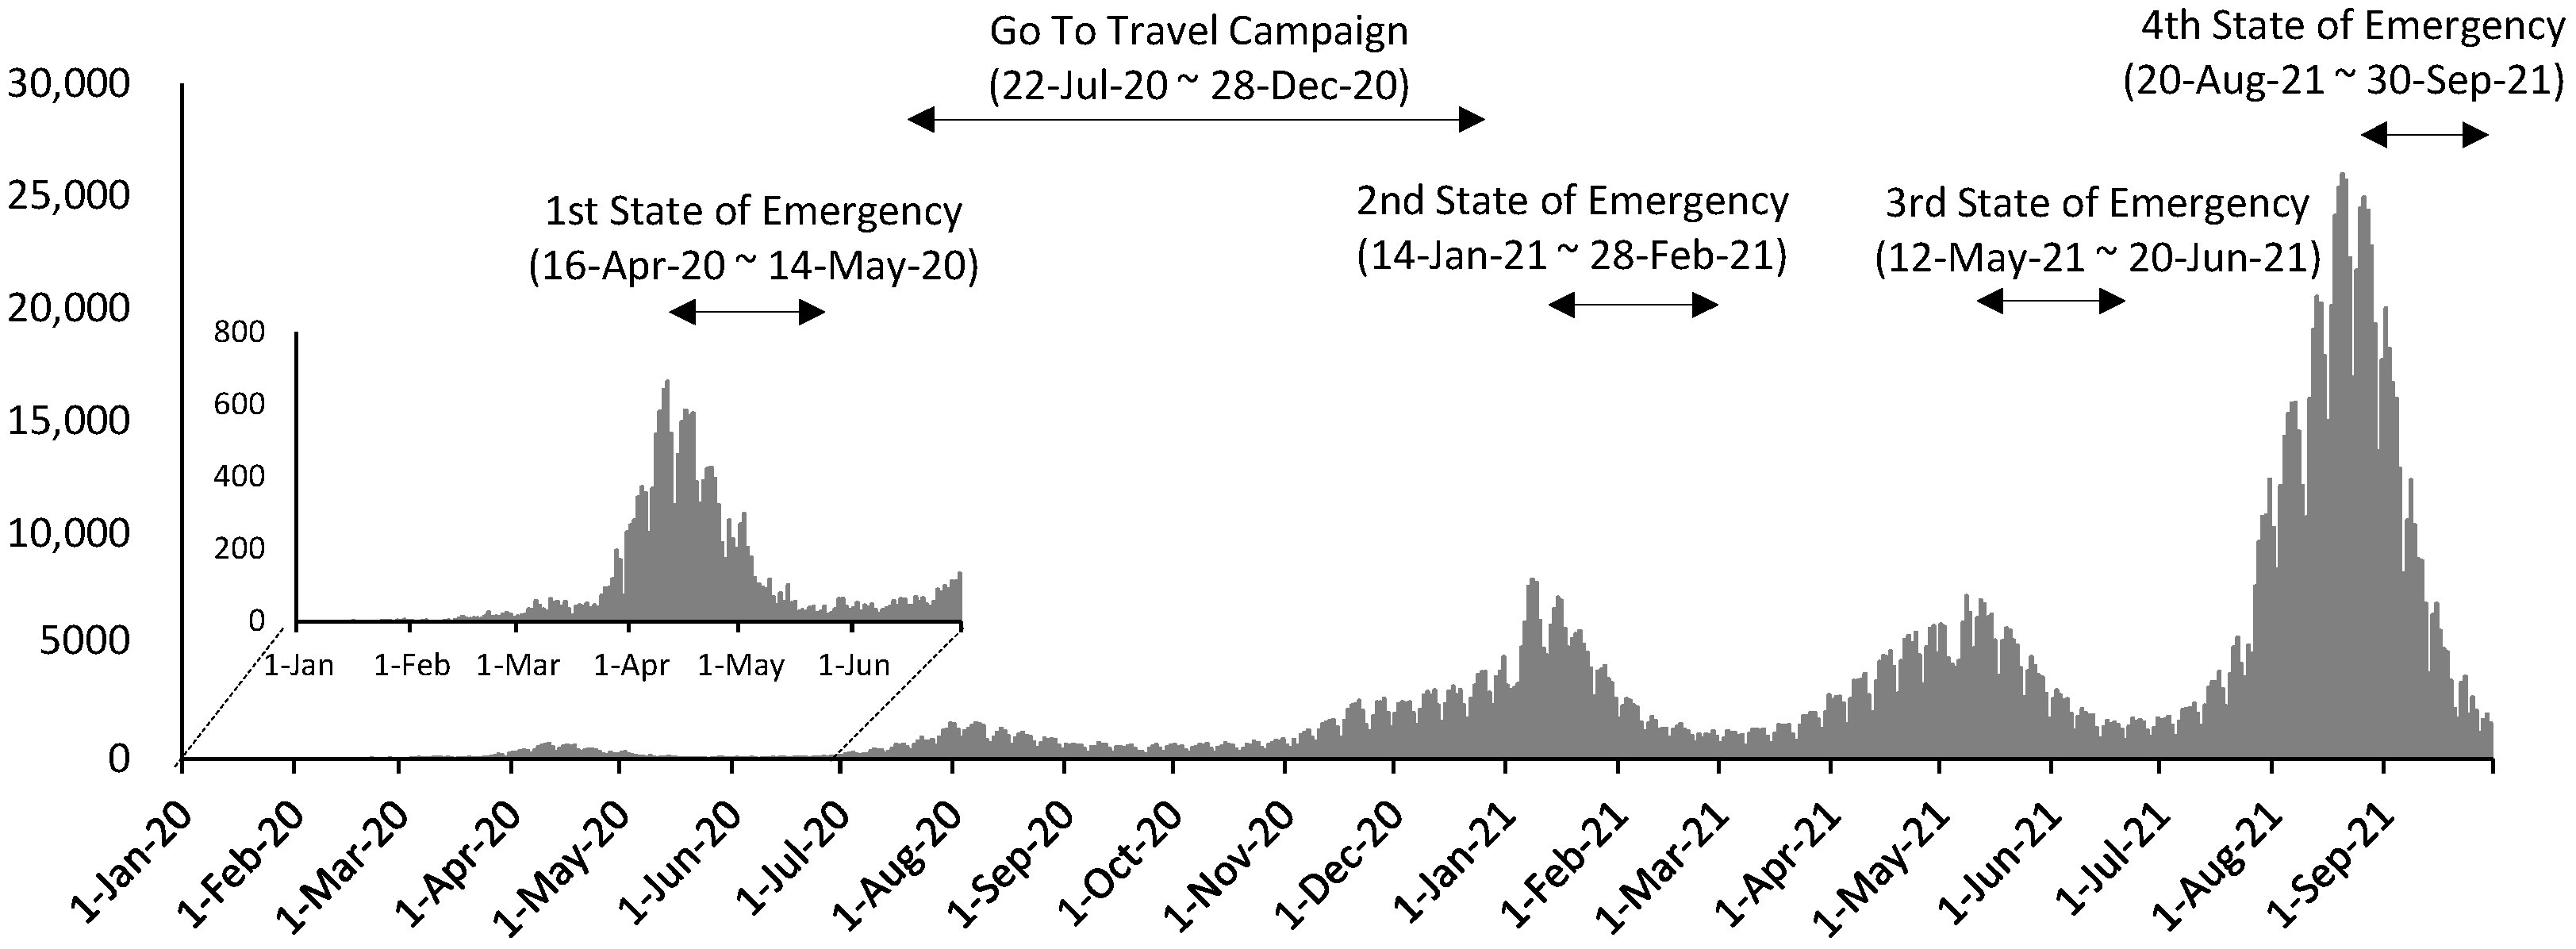
Japanese companies base their financial reporting on the fiscal year beginning in April. The first COVID-19 case in Japan was confirmed on 15 January 2020, and infections began to spread nationwide in April 2020 (
Ministry of Health, Labour and Welfare, 2023). Furthermore, the omicron variant began spreading in December 2021 (
Ministry of Health, Labour and Welfare, 2021). This study’s survey was conducted from November to December 2021, focusing on the early phase of the COVID-19 pandemic before the omicron wave. Specifically, the period from April 2019 to March 2020 is defined as the pre-pandemic period, while the period from April 2020 to September 2021 is considered the post-pandemic outbreak period.
During the first state of emergency, which was in effect from mid-April to the end of May 2020, the government urged citizens to refrain from going out except for essential activities. Additionally, many infection control measures were implemented, including school closures, restrictions on using facilities where large numbers of people gather, such as department stores and cinemas, and recommendations for telework in businesses. While these measures temporarily helped contain the spread of infections, they also severely impacted economic activities.
In response to this situation, the government launched the Go To Travel campaign on 22 July 2020. This policy aimed to support the recovery of regional economies affected by the COVID-19 pandemic and the state of emergency declarations. The initiative provided a 30% subsidy for domestic travel expenses, primarily for accommodation costs, and regional coupons worth 15% of travel expenses to encourage local consumption. Many tourism-related businesses benefited from this campaign. However, in response to the resurgence of infections nationwide in November 2020, the government suspended the campaign starting on 28 December 2020 and reintroduced stricter infection control measures.
In 2021, three states of emergency were declared to halt the spreading infections. The timing and frequency of these measures varied by prefecture. In Aichi Prefecture, the second state of emergency was in effect from 14 January to 28 February 2021. Although the public health situation temporarily stabilized in response to these efforts, a fourth wave emerged in April, leading to the third state of emergency from 12 May to 20 June 2021. Subsequently, a fourth state of emergency was in effect from 20 August to 30 September 2021, prolonging mobility restrictions for an extended period. These policies profoundly affected the tourism industry, restaurants were forced to shorten their business hours, and establishments serving alcoholic beverages faced operational restrictions.
Additionally, tourism-related facility and event industries were requested to suspend operations or limit the number of visitors, resulting in significant revenue declines. Moreover, restrictions on interprefectural travel substantially impacted regional tourism. While these COVID-19 policies effectively controlled infections, they also had severe economic consequences, particularly for the tourism industry and related sectors.
3.2. Survey Area
Aichi Prefecture, located in the central region of Japan, is home to Nagoya, one of Japan’s three major metropolitan areas. While Aichi is traditionally known as a manufacturing prefecture for its robust automotive industry, it has recently positioned tourism as a new strategic sector. The prefecture has actively promoted tourism by expanding tourism-related departments, formulating tourism plans, and establishing new regional tourism associations.
Situated in the central to western part of Aichi Prefecture, the Nishimikawa region comprises nine cities and one town: Toyota, Okazaki, Hekinan, Kariya, Anjo, Nishio, Chiryu, Takahama, Miyoshi, and Kota. With a population of approximately 1.61 million (
Statistics Bureau, 2021), this region is geographically diverse, bordered by the mountainous areas of eastern Mikawa to the east, the Nagoya metropolitan area to the west, and Mikawa Bay to the south. It encompasses urban centers, industrial zones, rural areas, and coastal regions (
Aichi Prefecture, 2022). The region’s tourism resources include historical and cultural sites, such as Okazaki Castle—the former residence of Tokugawa Ieyasu—and its surrounding landmarks, as well as abundant natural features, including Aichi Kogen Quasi-National Park, Mikawa Bay Quasi-National Park, and Hongūyama Prefectural Natural Park. Although the region is not traditionally recognized as a tourist destination, it has proactively promoted historical and cultural tourism centered on samurai heritage and industrial tourism related to its manufacturing industries.
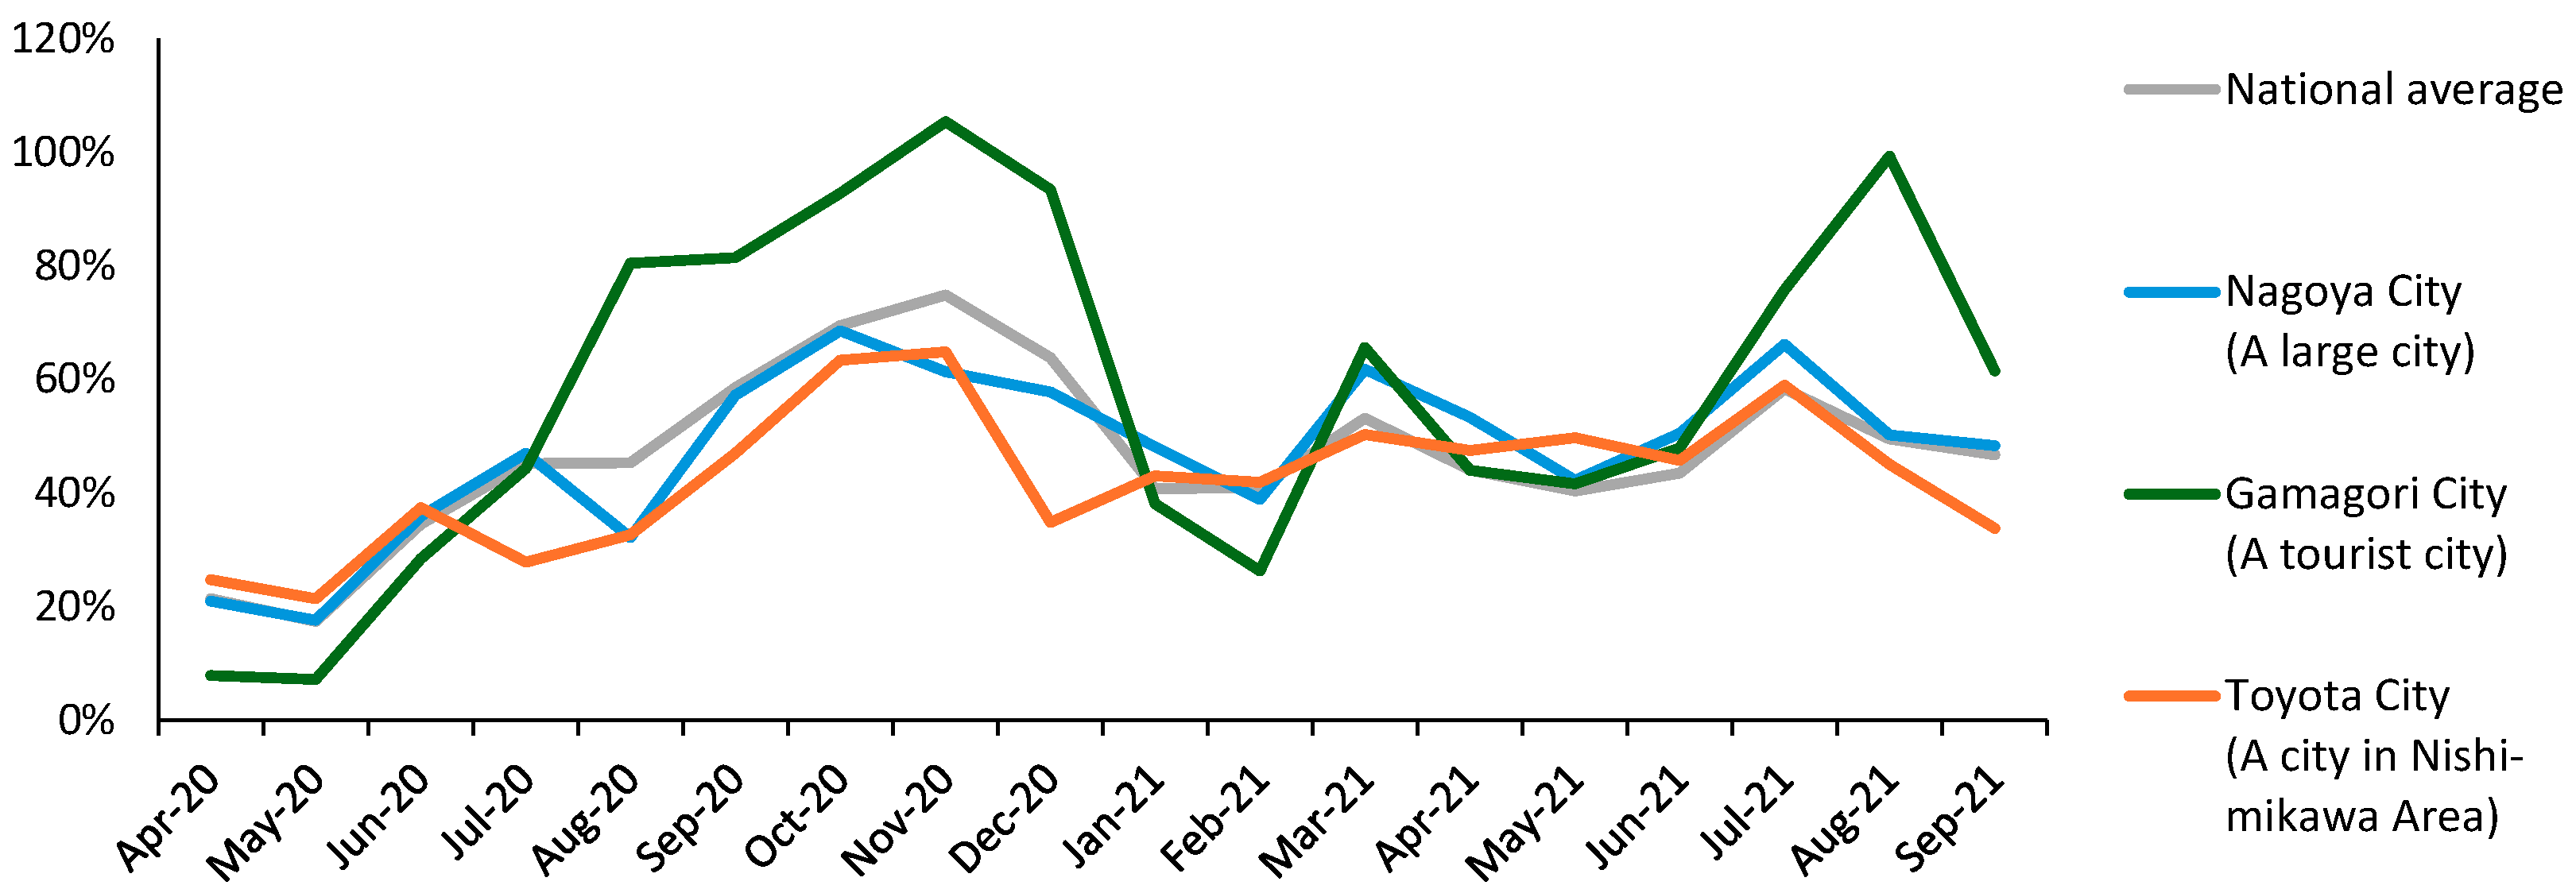
Using national accommodation travel statistics (
Japan Tourism Agency, 2019–2021), an analysis of the fluctuations in the number of overnight visitors (compared to the same period in 2019) revealed that in Toyota City, a major city in the Nishimikawa region, the number of overnight stays remained at or below the national average during the pandemic’s early phase (
Figure 2). In contrast, the overnight stay trends in Nagoya City, a major metropolitan area, were similar to the national average. At the same time, Gamagori City, a well-known tourist destination in Aichi Prefecture, experienced a significant recovery in visitor numbers during the Go To Travel campaign. These findings suggest that although the Nishimikawa region is not a high-demand tourist area, it was still significantly affected by the COVID-19 pandemic.
Thus, this study focuses on the Nishimikawa region of Aichi Prefecture, which, while not a nationally recognized tourist destination, has been actively working to attract visitors from surrounding areas. This study surveyed tourism-related businesses with the aim of assessing the impact of COVID-19 on the sales of tourism-related establishments and the effectiveness of tourism-related policies.
3.3. Questionnaire Survey
The survey targeted tourism-related businesses in the Nishimikawa region of Aichi Prefecture, including accommodation, tourist facilities (such as historical and cultural attractions and experiential leisure facilities), restaurants, and souvenir shops—businesses where tourists typically engage in consumption activities. The sample was drawn from listed companies on the Nishimikawa tourism portal site, Nishimikawa Gurutto Navi, providing information on tourism, experiences, accommodations, dining, and shopping in the region.
The survey was conducted from 29 November to 19 December 2021, with the questionnaires distributed and collected via postal mail. It covered the following aspects: (1) the primary type of business, (2) sales for the 2019 fiscal year, (3) seasonal fluctuations (quarterly sales distribution based on the 2019 fiscal year), (4) changes in quarterly sales for the 2020 and 2021 fiscal years compared to 2019, and (5) the effectiveness of the Go To Travel campaign.
As shown in
Table 1, 751 businesses listed on Nishimikawa Gurutto Navi were surveyed, and 212 responses were collected, yielding a simple response rate of 28.2%. For the final analysis, using only data without missing values related to sales fluctuations resulted in 144 valid responses, with an effective response rate of 19.2%. Of these, 24 responses were from accommodation facilities, 20 from tourist facilities, 68 from restaurants, 27 from retail businesses, and 5 from other sectors.
3.4. Analysis Method
3.4.1. Cross-Tabulation of the Survey Results and Estimation of Sales Fluctuations
A cross-tabulation analysis by sector was first conducted on the survey results for business attributes (such as the number of employees, seasonal fluctuations, and annual sales in 2019) and the Go To Travel campaign. This allowed understanding of each category’s sector-specific characteristics.
Then, using three sets of data obtained from the survey—“Annual sales for the 2019 fiscal year”, “Quarterly seasonal fluctuations in the 2019 fiscal year”, and “The year-on-year percentage change in quarterly sales from 2020 onward compared to the same period in 2019”—sales and fluctuation rates before and after COVID-19 were estimated for each sector.
For “Annual sales for the 2019 fiscal year”, the respondents selected from 11 categories ranging from “less than JPY 5 million” to “JPY 1 billion yen or more”, with the average of the minimum and maximum values in each category used for estimation. For “Quarterly seasonal fluctuations in the 2019 fiscal year”, businesses provided the percentage of their annual sales accounted for by each quarter. In “The year-on-year percentage change in quarterly sales from 2020 onward”, respondents reported the percentage change in sales for each quarter starting in 2020, using the corresponding quarter in 2019 as the baseline (100%).
The estimation method is shown in the following equation: first, the quarterly sales for 2019 were estimated using the annual and quarterly sales ratios from 2019. The estimated quarterly sales for 2019 were then multiplied by the year-on-year sales change ratio for each corresponding quarter from 2020 onward to estimate post-2020 sales. Finally, the average sales for each sector at different periods were calculated, with an estimate of the ratio of post-2020 sales to 2019 used to analyze the changes in sales before and after COVID-19.
where:
: FY2019 quarterly, sales amount of establishment
: annual sales amount of establishment in FY2019
: percentage of sales amount in quarter of FY2019
sales amount of establishment for quarters of FY2020 and FY2021
: quarterly change rate in sales for FY2020 and FY2021 compared to 2019
average quarterly fluctuation ratio for FY2020 and FY2021
: number of establishments
3.4.2. Analysis of the Factors Affecting Sales
The factors influencing the sales of tourism-related businesses during the COVID-19 pandemic were assumed to consist of normal-period factors (business attributes) and pandemic-related factors (such as the number of positive cases, state of emergency declarations, and the Go To Travel campaign). A multiple regression model was then used to analyze the factors affecting sales. First, a normal-period model (m1) was estimated to determine the model’s fit when considering only normal-period factors, followed by estimating a full-period model (m2) of the entire survey period to determine how pandemic-related factors influenced sales.
Table 2 presents a list of variables used in the models.
The dependent variable is the log-transformed value of each business’s quarterly sales, as calculated in
Section 3.4.1. In the normal-period model (m1), focusing only on the pre-pandemic FY 2019, the sample size is 576 (144 businesses × 4 quarters). In the full-period model (m2), covering the entire analysis period, the sample size is 1440 (144 businesses × 10 quarters).
The independent variables were categorized into normal-period and pandemic-related factors. The analysis considered the number of employees and labor productivity among the normal-period factors. The number of employees was surveyed using seven categories, using the average of each category’s lower and upper bounds. Labor productivity was defined as the annual sales per employee in 2019, calculated by dividing total annual sales by the number of employees.
For pandemic-related factors, the analysis considered the number of positive cases of COVID-19, the state of emergency declarations as a preventive measure, and the Go To Travel campaign as an economic stimulus measure. Because the COVID-19 case data specific to the Nishimikawa region are not publicly available, the analysis useed quarterly aggregated data for Aichi Prefecture (
Ministry of Health, Labour and Welfare, 2023). The state of emergency declaration was treated as a dummy variable; the quarters that include a declaration period were coded as 1, and the other quarters as 0. Similarly, the Go To Travel campaign was analyzed by establishing a dummy variable, with the quarters when the policy was implemented coded as 1 and the other quarters coded as 0.
To examine whether respondents’ subjective evaluations of the effectiveness of the Go To Travel campaign were associated with actual changes in sales, responses on a five-point scale (“No effect at all”, “Little effect”, “Neutral”, “Somewhat effective”, and “Very effective”) were converted into dummy variables and incorporated into a multiple regression analysis to statistically assess their relationship with reported sales changes.
Regarding variable assignment, the number of positive cases and policy-related dummy variables received the same values for all businesses in the same period, whereas survey-based variables received the same values for all periods of the same business.
The statistical analysis was conducted using Stata/BE 18.0.
4. Results
4.1. Cross-Tabulation of the Survey Results and Sales Fluctuations
Table 3 presents the response distribution for each survey item. In terms of the distribution of the number of employees, the most common category was businesses with 1–4 employees, accounting for 51% of the total. This trend was particularly notable in retail (70%), restaurants (60%), and other businesses (40%). Conversely, only 2% of businesses had more than 100 employees, and there were few large-scale businesses with more than 500 employees.
For annual sales distribution, businesses with sales in the JPY 10–30 million range accounted for the largest proportion (35%), followed by those with sales of JPY 30–50 million (14%) and JPY 5–10 million (12%). Businesses in the accommodation and tourism facility sectors exhibited relatively larger sales volumes, with 25% of accommodation businesses and 13% of tourism facilities reporting annual sales between JPY 200 and 500 million. In contrast, restaurants and retail businesses had a higher proportion of small-scale establishments, with many in the JPY 10–30 million sales range. These findings demonstrate that most survey respondents were small-scale businesses and that restaurants and retail businesses have fewer employees and lower sales volumes.
In evaluating the Go To Travel campaign, the most common response was “No effect at all”, reported by 34% of businesses. This response was particularly prevalent among tourism facilities (40%), retail stores (44%), and restaurants (32%). In contrast, only 13% of businesses rated the campaign as “very effective”, with accommodation businesses (29%) giving a relatively higher positive evaluation than other sectors. Meanwhile, 24% of establishments rated the campaign as “somewhat effective”, with similar proportions across tourism facilities (25%), restaurants (25%), and retail stores (26%).
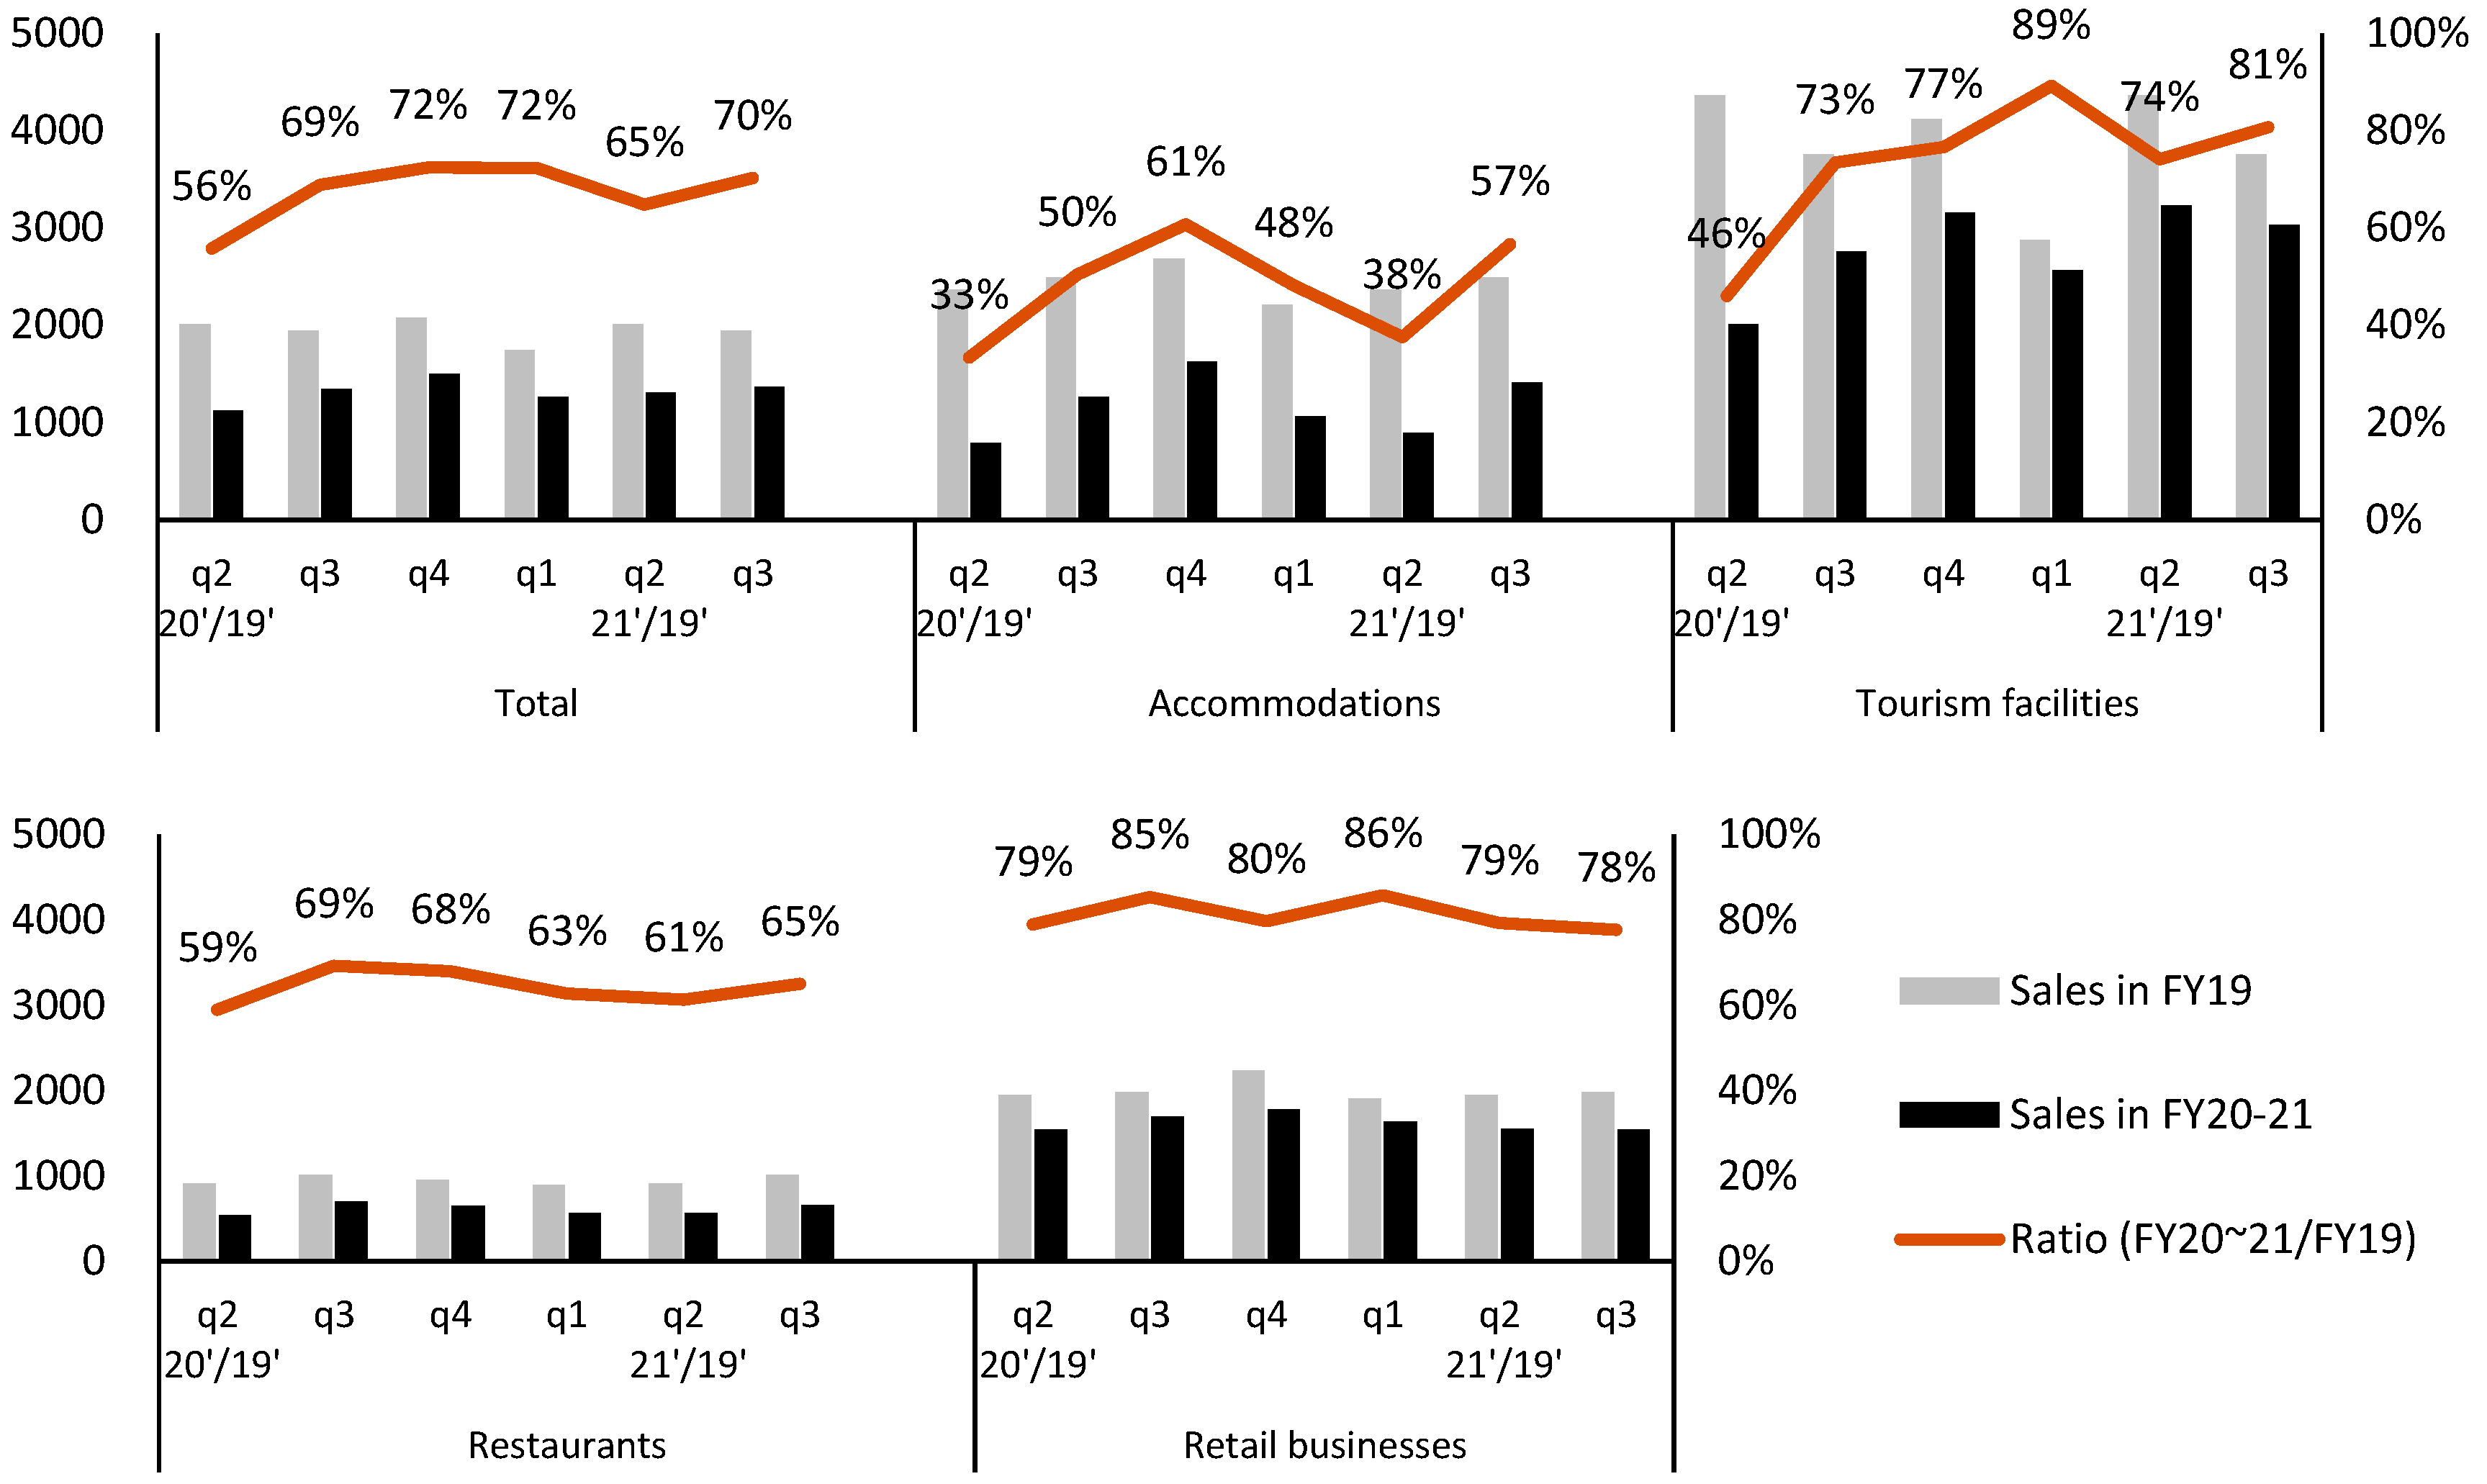
Figure 3 compares quarterly sales by sector between FY 2019 (pre-COVID) and FY 2020–2021 (post-COVID). The gray bars represent sales for FY 2019 (pre-COVID), the black bars represent sales for FY 2020–2021 (COVID-19 period), and the line graph shows the sales ratio relative to FY 2019 (set to 100%).
The overall trend indicates sales fell significantly in the second quarter (Q2) of 2020, when the first state of emergency was declared, and that subsequent recovery rates varied by sector.
The accommodation industry was the most severely affected by COVID-19, with sales in Q2 of 2020 falling to just 33% of the 2019 level, although they partially recovered to 61% by Q4. However, the recovery was short-lived; 2021 saw sales falling again, reaching only 57% in Q3, which were far from pre-COVID levels. The trend was close to the pattern observed in Toyota City’s overnight travel statistics shown in
Figure 2, supporting the reliability of the survey results. In contrast, tourist facilities experienced a 46% decline in sales in Q2 of 2020, although they recovered relatively quickly, reaching 73% in Q3 and 89% in Q1 of 2021. The restaurant industry experienced a more moderate decline, with sales dropping to 59% in Q2 of 2020 during the first state of emergency, remaining around the 60% range without significant recovery. Retail sales were less impacted than other sectors, maintaining relatively stable sales between 78% and 86%.
4.2. Results of Analysis of Factors Affecting Sales Amount
Table 4 shows the results of the pre-COVID model (m1), and
Table 5 shows the estimated results for the full-period model (m2).
The results of m1 indicate that the number of employees and labor productivity were statistically significant in all sectors, positively impacting sales. The adjusted R-squared values range from 0.929 to 0.960, indicating the model’s high degree of fit and showing that the number of employees and labor productivity effectively explained the change in sales during normal periods.
The factors influencing sales across sectors during all survey periods were analyzed by m2. In addition to normal factors (number of employees and labor productivity), the impact of pandemic-related factors (new infection rates, state of emergency declarations, the impact of the Go To Travel campaign, etc.) on sales was evaluated. Overall, the coefficient of determination for the model was high: 0.819 for the accommodation sector, 0.890 for tourist facilities, 0.859 for the restaurant sector, and 0.879 for retail, confirming the model’s high explanatory power.
The number of employees (ln_number of employees) and labor productivity (ln_labor productivity) were statistically significant for all sectors and positively affected sales. Like model m1, this indicates that establishments with more employees and higher labor productivity tended to have higher sales.
Pandemic-related factors significantly adversely affected sales in most sectors. The number of new infections showed negative coefficients across all sectors, and increased infections tended to reduce sales overall. This effect was especially significant in the accommodation sector, indicating it was heavily affected by the stay-at-home orders related to the health crisis. Examining the dummy variables for the three states of emergency, all sectors except retail exhibited significant negative coefficients, confirming the negative impact on sales. The first state of emergency (1st Emergency Statement) had a particularly negative effect on all sectors, especially in the accommodation sector (−0.921, p < 0.001) and tourist facilities (−0.996, p < 0.001). Although the impact of the second and third states of emergency was more negligible, significant effects were still observed in sectors other than retail.
The dummy variable for the timing of the Go To Travel campaign did not yield consistent results. In Q3 2020 (GoTo campaign_2020q3), the campaign exhibited a slight negative impact overall, and no significant coefficients were found when analyzed by sector, suggesting the campaign did not result in increased sales for the establishments. However, in Q4 2020 (GoTo campaign_2020q4), a significantly positive impact was observed in the retail sector (0.256, p < 0.05).
Evaluating the Go To Travel campaign by establishments in the accommodation sector revealed a significant positive coefficient, suggesting that establishments that reported the campaign as effective saw an increase in sales than those that reported no effect. However, negative coefficients or no significant effects were observed in other sectors.
A significantly positive impact was observed in the retail sector in Q4 2020 (GoTo campaign period: 2020 Q4). Still, the GoTo evaluation variable showed no increase in sales for establishments that reported the campaign as effective. Given that the percentage of respondents reporting a positive effect was relatively low, and considering the timing of the policy, the sales recovery may have been due more to a natural rebound in sales during a period when infections temporarily subsided rather than to the policy impact.
5. Discussion
The Nishimikawa region is close to the major metropolitan area of Nagoya and is known for its thriving manufacturing industry. The region attracts many business travelers, and its tourism demand relies heavily on day-trip visitors from nearby cities. Consequently, the state of emergency and travel restrictions related to the COVID-19 pandemic significantly affected the region’s tourism-related businesses, although the impact varied by sector. The findings of this study were consistent with previous research emphasizing the vulnerability of tourism systems that are heavily dependent on urban proximity and business travel, particularly during crises that limit mobility (
Józefowicz, 2021;
Gössling et al., 2020).
The accommodation sector was the most severely affected. The state of emergency imposed restrictions on nonessential travel and cross-prefecture movements, leading to a sharp decline in visitors from distant areas and a drop in demand for accommodation. Reduced business travel due to the contraction of corporate activities and the shift to remote work also significantly affected the accommodation sector. This pattern mirrors the observations by
Sigala (
2020), which indicates that urban-peripheral accommodation businesses that depend on business travel suffered disproportionately under pandemic-induced behavioral shifts.
Tourist facilities were directly impacted by the first state of emergency’s restriction on and nonessential outings. Additionally, as infection prevention measures resulted in the temporary closure of high-traffic attractions, such as theme parks and museums, and entry restrictions, sales plummeted. The proximity to a major metropolitan area and the promotion of domestic travel subsequently contributed to growing tourism demand within the prefecture and nearby urban areas (
Duro et al., 2021;
Santos & Moreira, 2021). This rise in day-trip visitors is believed to have supported the recovery of tourist facilities. Proximity to metropolitan areas reduces the need for overnight stays, as visitors from those areas can generally return home the same day. During the COVID-19 pandemic, heightened health concerns and mobility restrictions further discouraged long-distance and overnight travel, increasing the appeal of short, day-trip excursions (
Zenker & Kock, 2020;
Uğur & Akbıyık, 2020). This dual impact illustrates the importance of tailoring tourism strategies to regional travel behaviors. In addition, perceived as environments where the risk of crowding could be mitigated, outdoor tourist attractions in particular, such as nature tourism sites and agricultural tourism facilities, experienced a relatively early rebound in visitors. This trend, reflecting a shift in consumer preferences toward open-air and rural tourism amid health concerns during the pandemic, has been observed not only in Japan but also internationally (
Vaishar & Šťastná, 2020;
Uğur & Akbıyık, 2020).
The restaurant sector was impacted by shortened business hours and alcohol sales restrictions due to the state of emergency. Dining out declined, and establishments catering mainly to tourists faced particularly difficult financial conditions. The reduction in banquets and group meals led to a slow recovery for restaurants focused on large groups and evening operations, such as izakayas. Restaurants oriented toward social gatherings and tourism were among the most vulnerable segments of the food service industry during COVID-19 (
Kim et al., 2020).
The retail sector was comparatively less affected, with a recovery rate of around 70–80%. Facilities like roadside stations and large shopping centers served tourists and local residents, and daily needs maintained their sales. Although long-distance travel was avoided, tourism demand within the prefecture and nearby regions increased, boosting sales at souvenir shops in and around tourist facilities. Outdoor tourist spots in particular saw a quick return of visitors, contributing to a recovery in related retail businesses.
The effect of the Go To Travel campaign was found to be limited in the Nishimikawa region. Since the region is not a well-known tourist destination and most tourists are day-trippers from nearby areas, the policy, which aimed to stimulate overnight stays, did not have a significant influence. Moreover, concerns about the spread of infections persisted during the policy’s implementation, and the public’s strong awareness of travel restrictions likely contributed to the limited effect. In addition, as
Matlovičová (
2024) notes, regions with a strong, unique image as tourist destinations tend to exhibit greater resilience during crises. The limited recognition of Nishimikawa as a tourism area may have undermined its ability to fully leverage national travel support schemes. Therefore, future tourism promotion policies should consider the specific characteristics of each region. In particular, promoting microtourism targeting local residents and combining measures to stimulate tourism not involving accommodation could result in more effective regional revitalization.
6. Conclusions
This study analyzed the sales of tourism-related businesses during the COVID-19 pandemic and identified the influencing factors, focusing on the relationship between business attributes, regional tourism resources, and pandemic-related indicators. The results revealed that pandemic-related factors significantly impacted sales, particularly in the accommodation and restaurant sectors. The state of emergency had the greatest impact, especially during the first declaration. The impact on sales varied across sectors, with the accommodation and restaurant sectors the hardest hit and both requiring ongoing recovery support. In contrast, tourist facilities and retail businesses were less affected, yet support measures aimed at stabilizing long-term tourism demand were considered necessary. Additionally, the Go To campaign had a limited effect in the Nishimikawa region, where many visitors are day-trippers from nearby areas, indicating that tourism support measures tailored to regional characteristics are essential.
The model analysis showed that the effects of normal and pandemic-related factors on sales were generally as expected, indicating the potential for analyzing the aspects of sales fluctuations based on the business survey and the model analysis. However, this study had limitations due to the low effective response rate (19.2%), which may have introduced biases such as self-selection (in which businesses experiencing greater impacts or holding stronger opinions are more likely to respond) and nonresponse biases (caused by a lack of responses from businesses with lower interest or overwhelmed by operations). Although sector-specific analyses were conducted to minimize sectoral bias, caution is needed in interpreting the results. The response rate to the question about changes in sales was especially low, suggesting the need to revise the questionnaire. Future studies with broader, more representative samples would be valuable for validating and expanding these insights.
Moreover, due to the unavailability of COVID-19 infection data specific to the Nishimikawa region, this study relied on broader prefectural-level data, which may have limited the precision of the analysis. Future research with access to more localized health data could enable more accurate assessments of tourism impacts at the subregional level.
While this study focuses on the period from April 2020 to September 2021, it is necessary to conduct further surveys on tourism-related businesses throughout the entire period of the pandemic. In particular, evaluating the effects of subsequent policies, such as COVID-19 vaccinations and the relaxation of entry restrictions for foreigners, is important. As the environment surrounding the tourism industry undergoes significant changes, examining future challenges and new demands is also essential. This will be addressed in future research.
Finally, the impact of the COVID-19 pandemic on the tourism industry might not have been the only crisis faced by businesses in the Nishimikawa region. Disruptions to the supply chain, particularly those caused by the automotive industry centered around Toyota, led to a wider decline in corporate travel and business-related demand. Additionally, the soaring costs of energy and raw materials intensified the operating costs for small-scale businesses. Moreover, the loss of regional events and opportunities for local interaction further weakened the social foundations of tourism. These interconnected crises reflected a polycrisis situation, as defined by
Matlovič and Matlovičová (
2024). In this context, the tourism sector’s struggles were not solely the result of the pandemic but compounded by a combination of factors. This complexity suggests that traditional tourism policies and economic stimulus measures alone are insufficient in addressing the challenges faced by these businesses. Moving forward, the focus should not only be on the recovery of tourism on its own but also on reconstructing the tourism industry within the broader context of a region’s society, industrial structures, and environmental relations.


