1. Introduction
Tourism has established itself as one of the most dynamic sectors of the global economy, with significant impacts not only on the economy but also on the environment and socio-culture (
Costa & Costa, 2024;
Elgin & Elveren, 2024). Its ability to generate employment, attract investment, and promote local development has been widely recognised, especially in countries whose economies are highly dependent on the sector, such as Portugal (
Costa et al., 2019;
UNWTO, 2019). In this context, the relationship between tourism and regional inequality has been the subject of growing academic interest, albeit characterised by different theoretical and empirical approaches.
On the one hand, several studies point to the redistributive potential of tourism, suggesting that it can contribute to reducing territorial inequalities by boosting the economy of less industrialised regions and diversifying the local production base (
Mira et al., 2020;
Tucki & Pylak, 2021;
Y. Wang & Tziamalis, 2023). On the other hand, recent evidence suggests that the benefits of tourism tend to be concentrated in already developed areas where there is consolidated infrastructure, technical capacity, and consolidated tourist attractiveness, thereby reinforcing pre-existing territorial disparities (
Kervankıran & Sert Eteman, 2023;
Majdak & de Almeida, 2022).
The regional inequalities resulting from this asymmetric distribution of tourism investment can have significant socio-economic consequences, such as weakening social cohesion, political instability, or the perpetuation of poverty in marginalised areas (
Causevic & Lynch, 2013). The accurate identification of territorial asymmetries in the distribution and impact of tourism, therefore, plays a central role in the formulation of more effective and equitable public policies. In this field, the use of innovative data, such as night-time satellite imagery, combined with advanced quantitative methodologies, such as mixed linear regression models and time series, has enabled significant advances in the territorial analysis of tourism development (
Lessmann & Seidel, 2017;
Russo et al., 2022).
Against this background and considering the gap in the literature, the main objective of this study is to analyse regional disparities in the tourism sector in Portugal between 2012 and 2022, with a particular focus on the relationship between the geographical distribution of tourism enterprises, their size and type, and the evolution of average wages of workers by region (NUT II). In particular, the aim is to understand how the structure of enterprises influences wage dynamics and which regions benefit most (or least) from the sector’s growth, thus contributing to the debate on the role of tourism in reducing or exacerbating regional inequalities.
To achieve the proposed objectives, a quantitative approach was adopted based on secondary data collected by the Strategy and Planning Office (GEP) of the Ministry of Labour, Solidarity and Social Security and the Bank of Portugal relating to the tourism sector in Portugal between 2012 and 2022.
The data includes information on the type of tourism activity sector (CAE) (accommodation and catering, recreational and cultural activities, and transport and logistics), size (1–9 people 10–49, people 50–249, people 250–499, people 500–999, and 1000 or more people), turnover (less than EUR 2000 thousand, EUR 2000–9999 thousand, EUR 10,000–49,999 thousand, EUR 50,000–499,999 thousand, EUR 500,000 and more thousand), and geographical location of tourism enterprises (by NUT II—North, Algarve, Centre, Lisbon, Setúbal Peninsula, Alentejo, West and Tagus Valley, and Azores and Madeira), as well as the average wage of employees (average wage includes basic pay, regular bonuses and allowances, and overtime pay) by region (NUT II). The analysis included independent (year) and dependent (number of companies and average wage) variables, using descriptive statistics and advanced models such as mixed linear regression and time series to capture regional and temporal variations. In addition, ANOVA tests and simple linear regression models were used to identify significant differences and measure salary variability over time and between regions.
The combination of these methodological approaches has made it possible to map regional asymmetries in the tourism sector in detail, as well as to identify critical factors for building more effective and territorially balanced public policies. The results show that although the sectoral distribution of enterprises is relatively homogeneous between regions, there are still significant differences in the size of enterprises, with the largest concentrated in Lisbon, the North, and the Algarve. This concentration could indicate imbalances in regional economic potential and require greater attention from policymakers. In addition, it was found that the “region” variable (NUT II) and the tourism activity sector (CAE) were the factors that contributed most to the adjustment of the predictive models used, reinforcing the idea that territory is important when analysing economic disparities in tourism. The analysis of salaries also reveals worrying asymmetries: despite the upward trend, average salary increases are insufficient to keep up with the rising cost of living, especially in regions with strong real estate and tourism pressure, such as Lisbon, the Algarve, and the Azores.
This study, therefore, contributes to the debate on the role of tourism in reducing (or exacerbating) regional inequalities. It highlights the importance of public policies that promote a more balanced development of tourism, focusing on job quality, territorial equity, and social inclusion. The use of innovative analytical approaches allows for a more accurate diagnosis of the existing disparities and the design of more effective strategies to mitigate them.
This article is structured into six main sections. The
Section 1 presents the context, relevance, and objectives of the study. The
Section 2 explores the existing literature on tourism, regional inequalities, and socio-economic impacts. The
Section 3 details the data collection and analysis procedures, including a breakdown into procedures, variables, sample characteristics, and data analysis strategies. The
Section 4 is divided into descriptive and inferential analyses, including central tendency measures, deviations from mean values, Linear Mixed Models, time series modelling (ARIMA), ANOVA for regional trends (NUT II), and linear regression with emphasis on model fit (
R2). The
Section 5 interprets the findings considering the theoretical framework, highlighting implications and limitations. Finally, the
Section 6 summarises the key contributions of the study and suggests directions for future research and policy development.
2. Theoretical Framework
Tourism is a rapidly growing sector with significant economic, environmental, and cultural impacts (
Costa & Costa, 2024;
Elgin & Elveren, 2024). Studies suggest that tourism can reduce income inequality and contribute to the distribution of wealth (
Mira et al., 2020;
Tucki & Pylak, 2021;
Zhang & Yang, 2023). However, there is evidence that it can also exacerbate regional disparities if tourism investment is concentrated only in already developed regions (
Kervankıran & Sert Eteman, 2023). Thus, the literature on tourism and regional inequalities presents two prominent perspectives: (i) tourism as a reducer of regional inequality by redistributing investment and boosting development in less industrialised regions (
Y. Wang & Tziamalis, 2023); (ii) tourism as a widener of inequalities, favouring already developed regions (
Majdak & de Almeida, 2022).
Regional disparities can lead to socio-economic problems such as internal conflicts and political instability (
Causevic & Lynch, 2013). Several studies suggest that while some less developed regions can benefit from tourism due to their natural and cultural beauty, others are unable to attract investment due to a lack of adequate infrastructure, planning, and technical capacity (
Nguyen, 2021). The use of night-time satellite imagery (
Lessmann & Seidel, 2017;
Russo et al., 2022) has emerged as an innovative tool to measure regional inequalities, allowing for a better understanding of the relationship between tourism and regional development.
Lv’s (
2019) study, which analyses the impact of tourism on regional inequality in 113 countries between 1995 and 2012, shows that tourism can reduce inequality in the long term. His data shows that factors such as GDP per capita and population growth help to reduce regional inequality, while urbanisation and economic globalisation can increase it.
Tourism can be an economic development engine, especially in less industrialised regions, by creating jobs and boosting other sectors such as transport, trade, and services (
Mahadevan et al., 2017). However, for this growth to be inclusive, it is necessary to implement policies that ensure equitable economic benefits and result in development strategies that reduce disparities between coastal and inland regions.
Deng et al. (
2019) highlight that these policies, when applied, significantly improve the construction of tourism infrastructure, transforming tourism into a key sector for regional development.
Public policies play an essential role in building this ecosystem, which sees tourism as a tool for economic and social development. Studies highlight that government interventions can affect tourism in three main ways: (i) direct impact on the tourism sector—regulation, tax incentives, and investments in tourism marketing (
Garsous et al., 2017;
Milheiro et al., 2021); (ii) improving the economic environment and infrastructure—investments in transport and technology create favourable conditions for tourism growth (
Adhuze et al., 2023;
Polukhina et al., 2025); (iii) influence on tourism policies—regional policies shape the sector by influencing economic and social factors (
OECD, 2024;
D. Wang & Ap, 2013).
The literature also suggests that tourism can affect poverty and individual income inequalities. Several authors have analysed the impact of tourism on poverty and concluded that in some contexts, tourism growth per se does not directly benefit the poorest populations (
Çolak et al., 2023;
Croes, 2014). On the other hand, studies such as
Çolak et al. (
2023),
Elgin and Elveren (
2024), and
Wen et al. (
2021) show that tourism can be an effective tool for poverty reduction, provided that policies are in place to promote the economic inclusion of local populations.
This panorama of tourism’s impact on poverty and inequality is reflected in countries like Portugal, where tourism is one of the main levers of economic and social development (
Costa et al., 2019;
UNWTO, 2019). Although the sector’s growth can contribute to poverty reduction, it also reveals structural challenges related to the quality of the jobs created. In the Portuguese context, while tourism generates employment, it faces difficulties in attracting and retaining talent, mainly due to precarious working conditions, seasonal employment, and low wages. Therefore, although tourism is a potential driver for the economic inclusion of local populations, it is essential to implement effective policies that promote the sector’s growth and improve the quality of work and opportunities for workers in the sector.
Regional inequalities can be exacerbated if the opportunities created by the sector do not translate into significant improvements in the living and working conditions of local people, particularly due to the seasonal nature and low wages of the industry. In this context, if tourism is to make an effective contribution to reducing regional inequalities, it is essential to adopt innovative policies that guarantee better working conditions and social inclusion. Approaches that promote stable contracts and the well-being of workers can reduce inequalities within the sector itself (
Costa et al., 2020), making it a more effective tool for balanced and inclusive regional growth. However, the impact of tourism on regional inequality is still a controversial topic in the literature, as it can both promote economic inclusion and deepen development disparities. Well-structured public policies ensure that tourism benefits different regions and populations, promoting more equitable and sustainable growth. Adopting innovative methodologies, such as satellite imagery and advanced econometric techniques, can contribute to a better understanding of this relationship and help formulate more effective policies.
3. Materials and Methods
3.1. Procedures
This study analyses statistical information on staffing levels from the Portuguese government’s Ministry of Labour, Solidarity and Social Security (MTSSS). The legal framework for staff registers was established by Decree-Law 479/76 of 16 July 1976, which made this procedure compulsory for companies with more than 10 employees, and this data has been available since 1985. This information is essential for defining labour regulation policies and the rights and obligations of companies and workers. Implementing this process is part of Portugal’s integration into the European Union, which was formalised in 1986.
In 2010, the Single Report was prepared to provide information on the social activities of companies. The data was collected by the Strategy and Planning Office (GEP) of the Ministry of Labour, Solidarity and Social Security of the Government of Portugal for companies whose main economic activity is tourism (Portuguese Classification of Economic Activities, CAE-REV 3) and covers the period between 2012 and 2022. The breakdown of data by tourism enterprises into “accommodation and food services”, “recreational and cultural activities”, and “transport and logistics” was provided by the Bank of Portugal. The staff tables provided by these entities are identified in terms of the different variables they deal with, their temporal evolution, and their geographical location in the country:
- (a)
Q1 Enterprises by economic activity (tourism), enterprise size-class, and NUTS (2024);
- (b)
Q2 Enterprises by economic activity (tourism), enterprise turnover, and NUTS (2024);
- (c)
Q3 Enterprises by economic activity (tourism), enterprise size-class, and NUTS (2024);
- (d)
Q4 Persons employed in enterprises by economic activity (tourism), occupational status, and NUTS (2024);
- (e)
Q5 persons employed in enterprises by economic activity (tourism), sex, and NUTS (2024);
- (f)
Q6 persons employed in enterprises by economic activity (tourism), age group, and NUTS (2024);
- (g)
Q7 persons employed in enterprises by economic activity (tourism), level of qualification, and NUTS (2024);
- (h)
Q8 persons employed in enterprises by economic activity (tourism), level of qualification, and NUTS (2024);
- (i)
Q9 Persons employed in enterprises by economic activity (tourism), nationality, and NUTS (2024);
- (j)
Q10 Persons employed in enterprises by economic activity (tourism), seniority, and NUTS (2024);
- (k)
Q11 Persons employed in enterprises by economic activity (tourism), occupation, and NUTS (2024);
- (l)
Q12 Employees (OW) employed in enterprises by economic activity (tourism), type of contract, and NUTS (2024);
- (m)
Q13 Persons employed in enterprises by economic activity (tourism), working time regime, and NUTS (2024).
It also specifies the procedures associated with guaranteeing the confidentiality and anonymity of data for companies, namely the adoption of strict information security measures, such as the use of encrypted systems for data storage and transmission, the implementation of access protocols restricted to authorised personnel, and the anonymisation of sensitive information before any disclosure or analysis. These procedures aim to ensure that the data collected by the Strategy and Planning Office (GEP) of the Ministry of Labour, Solidarity and Social Security of the Government of Portugal is processed under the legal provisions on data protection, thus protecting the privacy of the companies involved.
3.2. Variables
This study focuses on characterising the tourism sector, considering tourism enterprises in Portugal in terms of type, size, turnover and geographical location. These data have been compared with the gross salaries and salaries with the corresponding bonuses of the tourism workers by NUT II. To do this, the independent variable year (Vi) and the dependent variables (Vds) were considered as follows: (a) “tourism companies” by type, size, turnover, and NUT II; (b) “average wages and earnings of people working in tourism” by year, type of company, and NUT II.
3.3. Sample
Several tables are presented to characterise the sample.
Table 1 gives an overview of the tourism sector over the years based on the number of enterprises (
Table 1) classified by size.
The data show a general upward trend in the number of enterprises from 39,061 in 2012 to 50,607 in 2022 (+29.5 per cent) in terms of overall growth between 2012 and 2022 (
Table 1).
The growth in the number of enterprises was more pronounced among smaller enterprises (1–9 people employed). There was also a significant proportional growth in the medium-sized categories (10–49 people and 50–249 people), especially after 2016.
The data in
Table 1 shows a decrease in 2020, possibly due to the impact of the COVID-19 pandemic on the tourism sector. The number of enterprises decreased regardless of size, with a slow recovery from 2021 onwards.
Enterprises in the “250–499 people employed” size class show a more considerable proportional decline in 2022. However, there has been some resilience in the tourism sector over the past decade, supported by small enterprises and establishments as the main growth drivers.
Table 2 shows that most enterprises continue to operate with a turnover of less than EUR 2 million throughout the period analysed, consistently representing more than 90% of the total. Despite this, there was an increase in the turnover of larger companies (over EUR 2 million) between 2012 and 2022, particularly in the categories between EUR 2000 and 9999 thousand and EUR 10,000–49,999 thousand. In 2020–2021, there was a significant decrease in the turnover of enterprises, especially in the larger categories (EUR 10,000 thousand or more). However, the segment of smaller enterprises (EUR 2000 thousand) also saw a slight decrease. These results may be due to the impact of the pandemic.
In 2022, the sector shows some recovery, especially for companies with higher turnover.
Table 3 and
Table 4 refer to average salaries in tourism enterprises. Both gross salaries and salaries with supplements show steady growth from 2012 to 2022, indicating an increase in the value of workers in the sector.
There are regional disparities, with Greater Lisbon being the leading region in the country in terms of salaries (EUR 1029.8 in 2022 in
Table 3 and EUR 1240.2 in
Table 4), reflecting the economic weight of the capital and the presence of large companies. The Algarve and the Azores also have average salaries above the national average due to the importance of tourism in these regions. On the other hand, the Centre, North, West and Tagus Valley regions have the lowest salaries, indicating challenges in terms of wage competitiveness. In 2020, wage growth slowed down in almost all areas. However, in 2021 and 2022, wages started to grow again, reinforcing the signs of recovery.
The data in
Table 2,
Table 3 and
Table 4 relate business turnover to wage levels. The recovery in turnover in 2022 (
Table 2) is accompanied by an increase in average wages (
Table 3 and
Table 4), suggesting that the economic recovery has positively impacted workers’ incomes.
Regions with a higher share of higher turnover categories, such as Lisbon and the Algarve, also have higher salaries for tourism workers.
In short, the analysis of the sample’s characteristics shows that the overall growth in turnover and wages in the tourism sector over the decade under study reveals significant disparities and inequalities between regions and categories of enterprises. The pandemic crisis in 2020 had a noticeable effect on turnover, especially in larger enterprises, and also slowed down wage growth. However, the recovery in 2022 is evident in the increase in the number of enterprises in higher categories and the improvement in wages.
Table 5 cross-references data on the distribution of enterprises in different sectors and regions of Portugal, organised by the number of employees. Enterprises are grouped according to the number of employees, from small (1–9 people) to large (1000 or more people).
The group of small enterprises (1–9 people) is the largest (300 enterprises). Large enterprises (with 100 or more employees) are the least numerous, with 49 in the country as a whole, with a greater concentration in the Lisbon and northern regions of Portugal. The “hotels and restaurants” sector is the most represented, with the most significant number of enterprises (408 in total). There is a high concentration of enterprises in the Lisbon region (178), followed by the North region (155) and the Algarve (127).
In summary, small- and medium-sized enterprises (SMEs) predominate in tourism, regardless of the type of enterprise (CAE). The largest companies are located in the Lisbon region or the north of the country, as are companies in the transport and logistics sector. The accommodation and catering sector has a strong presence in the Algarve and Madeira.
3.4. Data Analysis
Descriptive analyses were performed based on the averages and the calculation of increasing and decreasing deviations from the averages, identifying patterns and trends in the variability and consistency of the data (
Coutinho, 2015).
The inferential statistics include linear mixed regression models, as the concentration of firms in different regions (NUTSII) has been found to show distinct patterns over time (
Hair et al., 2013;
Tabachnick & Fidell, 2019). The time series models assess trends and dynamics in the sector from 2012 to 2022, allowing projections to be made and trends to be identified. This analysis is justified because the relationships they establish between variables shed more light on previous results, highlighting seasonal oscillations or sudden changes in the data and the influence of some results on others (
Bertoncelo, 2022). This information is essential for monitoring the trend of growth or decline in the number of enterprises over time and their distribution across the country.
ANOVA tests were carried out to study statistically significant differences in the analysis of variance between groups in terms of turnover and company size by region (NUT II), identifying tourism development trends (
Assis et al., 2023).
Linear regression analyses and corresponding adjustment models (
R2) were carried out based on economic data (average wage—includes basic pay, regular bonuses and allowances, and overtime pay) and the adjustment indicators of the model were identified, seeking to extract the coefficients of determination of the variability in salaries by region (NUT II) and over the years (
Borjas, 2019;
Field, 2017;
Hair et al., 2018;
Montgomery et al., 2021;
Wooldridge, 2016).
4. Results
4.1. Descriptive Analyses
4.1.1. Central Tendency Measures
The analysis of average values provides insight into the structure of the tourism business sector, its distribution across different regions of the country (NUT II), by economic activity categories (Tourism CAE), and by business size. The data spans from 2012 to 2022, with an average of 2017.08 and a standard deviation of 3.172, indicating a balanced distribution across the analysed years, although with some concentration in 2017. The sample consists of 1069 observations, ensuring a robust analytical base.
Representation across the different administrative regions (NUT II, on a scale from 1 to 9) shows an average of 4.71, suggesting moderate distribution and variation in location, with a standard deviation of 2.630. The variable Tourism CAE (categorised from 1 to 3) shows an average of 1.94 and a standard deviation of 0.837, indicating that most tourism businesses are concentrated in the “accommodation and catering” sector. Regarding business size (Enterprises Dimension, ranging from 1 to 6), the data suggests a predominance of small- and medium-sized enterprises (SMEs) (mean = 2.49; standard deviation (σ) = 1.347).
The number of businesses ranges from 1 to 9939, with an average of 434.21 and a standard deviation (σ) of 1255.777, representing a significant spread. This result suggests a highly uneven distribution of businesses or activity sectors across the country’s regions, with a notable concentration of businesses in specific geographical areas (
Table 6).
4.1.2. Deviations from Mean Values
This analysis examines the behaviour of variables over time, focusing on their stability, and allows for identifying peak magnitudes and the range of variation across the years. The constructed indicators measure positive and negative deviations from the national average of the previously defined dependent variables (Vds).
There are no significant regional disparities regarding the type of business, as each region shows a relatively balanced distribution of different tourism sectors. However, some regions may be more specialised in specific tourism sectors. In the northern part of the country, there is a higher concentration of businesses in the transportation and logistics sector. At the same time, Lisbon and the Algarve have more companies in the accommodation and catering sectors.
Regional disparities are primarily associated with business size, with a higher concentration of larger companies in the Lisbon, Northern, and Algarve regions. This may indicate inequality in the economic potential of tourism businesses across the country, reinforcing the need for policies to promote balanced economic development across regions (
Table 7).
4.2. Inferential Analysis
4.2.1. Linear Mixed Models
The mixed linear regression model is an inferential statistical technique allowing inferences about relationships between variables in populations with hierarchical structures or dependencies in the data, as is the case with the sample under study. Given that the number of businesses, their size, and their type vary across different regions of the country, this model was estimated, considering NUT II as the dependent variable (Vd) while keeping all other variables fixed to model variations between groups or individuals. Since this is a longitudinal study with repeated measures, the application of this model is particularly appropriate, as mixed regression allows for more robust predictive modelling and statistical inferences than simple correlations.
Table 8 presents the main model fit statistics based on information criteria. The Log-likelihood indicates the quality of the fit, with a value of 3090.670 suggesting a reasonable model fit, though it should be interpreted cautiously. The AIC and BIC are used to compare models, with lower values indicating a better fit. In this case, the AIC (3092.670) and BIC (3092.676) are very close, indicating a good balance between model fit and parsimony. The coefficients of determination (marginal and conditional
R2) indicate the proportion of variability explained by the fixed effects and the combination of fixed and random effects, respectively. Fixed effects represent the average coefficients for each independent variable, interpreted as the average impact of that variable on the dependent variable. Random effects capture the variation specific to groups, individuals, or units of analysis, allowing for the modelling of dependencies and heterogeneity in the data. Since the marginal R2 (3098.141) is higher than the conditional R2 (3097.141), though the difference is minimal, further analyses are recommended to clarify the variability in random effects.
The model’s fit also demonstrates how each independent variable influences the dependent variable while keeping the other variables constant. Statistical significance is essential to determine whether the variables have a robust effect on predicting the observed trends. The magnitude of the coefficients suggests that some dimensions have a more significant impact than others. This may indicate dominant variables that exert more influence on the results. The main challenges are related to collinearity between variables, which may require coefficient adjustments, such as removing correlated variables or standardising the data.
The analysis of the fixed effects in the mixed linear regression model reveals the statistical relationships between the predictor variables and the dependent variable (NUT II), specifically the following: (a) the size and number of businesses have a strong and positive impact on the region of the country; (b) the NUT II variable is influenced by tourism, but not all sectors of activity are equally relevant; (c) there is a slight decrease over the years, suggesting a negative trend in the impact of tourism on regions over time, with a concentration of more significant tourist activity in more developed regions (
Table 9).
Table 9 reveals an intercept coefficient of −10.808 (
p < 0.001), suggesting a negative baseline value in the absence of the other predictor variables. The variable “size” has six categories, all with positive and significant coefficients (
p < 0.001), ranging from 1.648 to 9.868, suggesting that this variable positively impacts the dependent variable (NUT II). This result confirms the previous statistical analyses.
The tourism sector (Tourism CAE) shows a positive and significant effect (p < 0.001) on Portuguese regions, particularly for businesses in the accommodation and catering sector (coefficient 2.079). However, companies in the recreational and cultural activities and transport and logistics sectors do not reveal any influence on the dependent variable.
The relationship between the region of the country and the number of businesses is positive and statistically significant (p < 0.001) across all the categories of analysis, with the intercept coefficient ranging from 6.493 to 12.712. This is not the case for the “year” variable, whose coefficient values are predominantly negative. However, not all are statistically significant, suggesting a potential decline in the dependent variable over time.
In summary, the analysis of fixed effects suggests that the size of businesses, the tourism sector, and the country’s region significantly influence the dependent variable. The variability observed in the coefficients indicates that these factors play a relevant role in the territories’ economic and tourism dynamics, although direct interactions between these variables were not explicitly tested in the model (
Table 9).
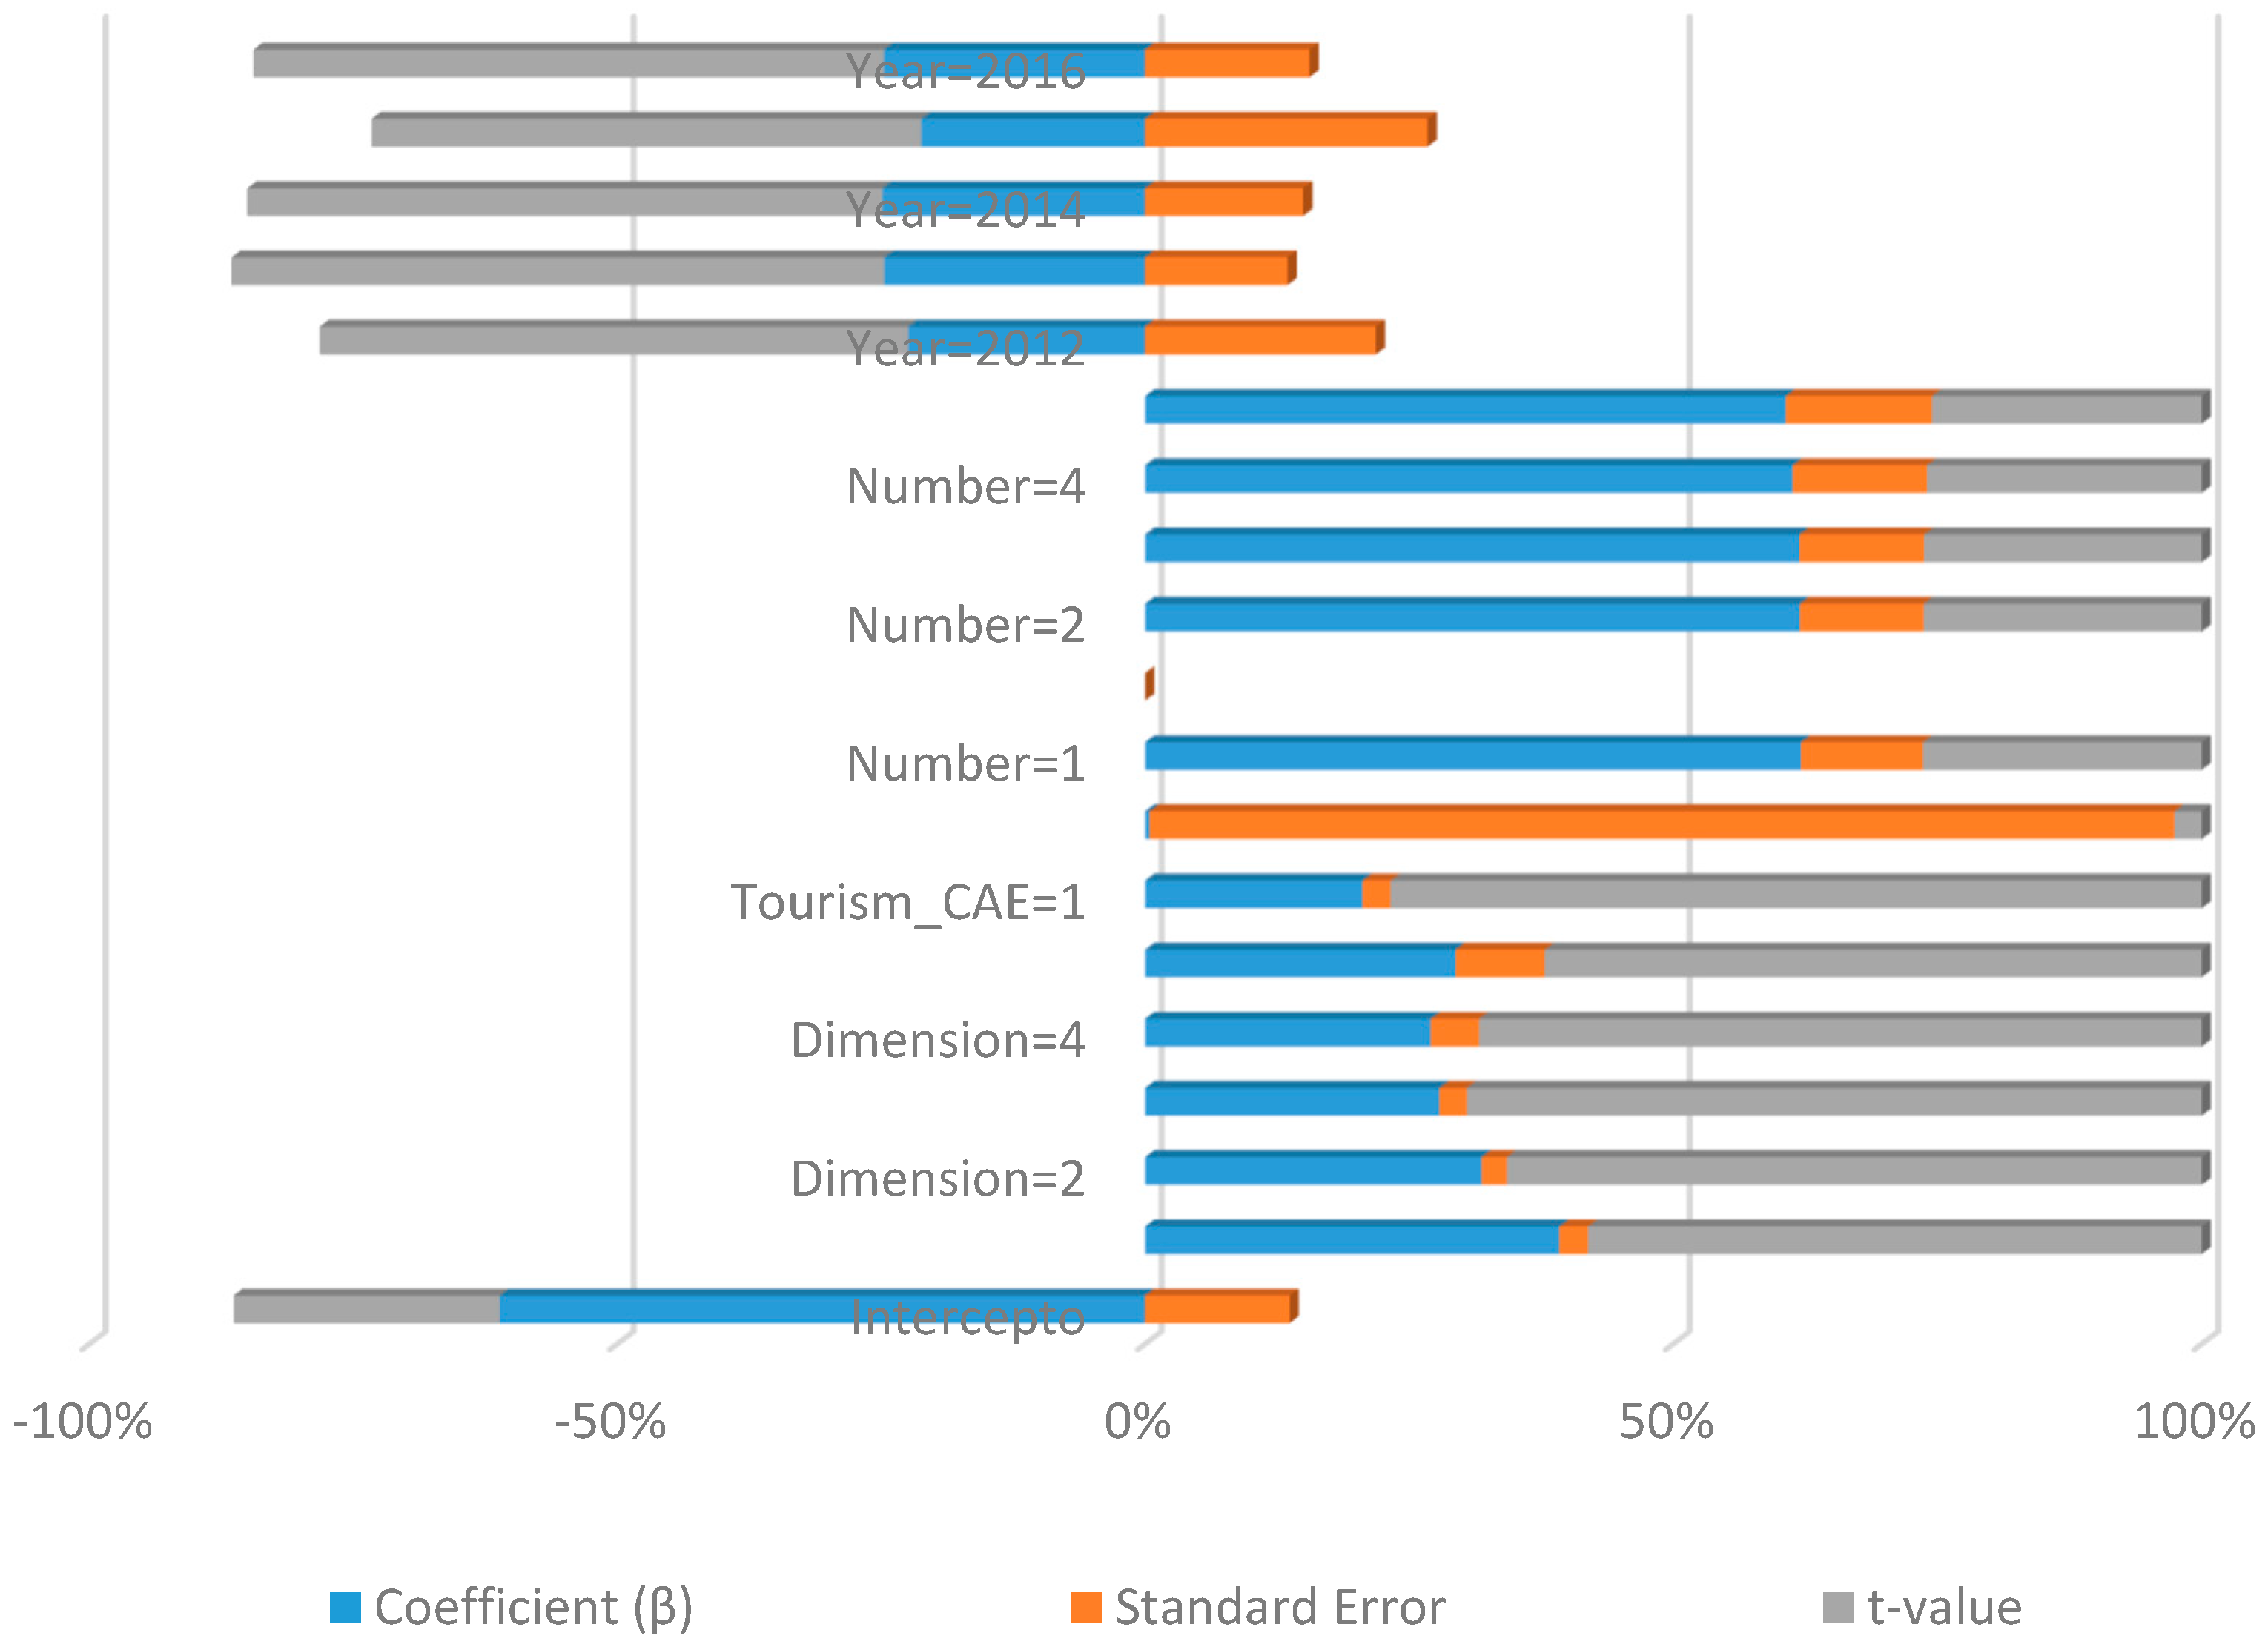
Figure 1 illustrates some of the key factors to consider in a harmonious tourism development model for Portugal, supported by the distribution of the number of businesses, typology, and size by region, countering the current asymmetries. The data shows that the relationship between tourism and NUT II is not uniform, as only certain tourism sectors or larger businesses have a significant positive impact on the economy. The number of businesses has a positive and increasing effect, growing in direct proportion to the size of the region. The “year” variable suggests a negative trend, indicating that from an economic perspective, the country has experienced or is going through periods of economic crises and structural changes, or relies on a weak economic structure that, in a longitudinal analysis, highlights less robust indicators. Notably, the years 2016, 2014, and 2012 stand out, along with tourism businesses in accommodation and catering (Tourism CAE = 1), the number of businesses in the territory, and company size measured by the number of workers [(Dimension = 2, 10–49 people); Dimension = 4, 250–499 people)].
Figure 1 shows a regression model summarising the indicators that influence tourism performance, particularly the type of tourism company, the number of companies in each territory, and company size. A high number of small- or medium-sized hotel and catering businesses in each area contribute to the region’s economic and tourism competitiveness. Conversely, the year variable did not affect the results in the same way, as there were no significant improvements in this indicator over time. This suggests some stagnation, or even a slight decrease, in performance over the period studied. There have been no clear improvements in tourism results over time, suggesting the need to review policies or interventions that produce positive and sustained impacts in the regions. It should be noted that the “Year” variable (2012, 2014, and 2016) is a dummy variable, meaning it shows the effect of each year compared to the base year (2010) when the government began studying these indicators. As these dummies’ coefficients are negative, it means that tourism performance in 2012, 2014, and 2016 was worse than in the base year.
4.2.2. Time Series Model (ARIMA)
The ARIMA model allows for the study of the evolution of a dependent variable within the same group of subjects over successive periods, providing important information for monitoring the behaviour of variables in terms of their growth or decline trends. This analysis is particularly important in this study, as the “Year” variable, in the previous analysis, did not produce very discriminative results.
The model was applied to four variables: (i) Tourism CAE (Model_1) → ARIMA(0,0,9); (ii) NUT II (Model_2) → ARIMA(0,1,12); (iii) Enterprises Dimension (Model_3) → ARIMA(0,0,10); (iv) number of enterprises (Model_4) → ARIMA(2,0,9), with the results presented in the following tables.
The results regarding the quality of the model fit show that Model 2 (NUT II) and Model 1 (Tourism CAE) have the highest stationary
R2 values (0.624 and 0.585, respectively), indicating that these variables contribute the most to the stability of the model. The “number of enterprises” model shows a poor fit (
R2 = 0.291), indicating that it does not explain the variability in the data (
Table 10).
Table 10 also shows the negative Standardized BIC for “NUT II” and “Tourism CAE,” signalling that these models are relatively good, as lower values indicate better parameter fit. In contrast, the “number of enterprises” model has a very high BIC (19.645), suggesting possible overfitting or an error in the model. In conclusion, the variables NUT II and Tourism CAE contribute the most positively to the adjustment of the time series model.
The model accuracy metrics presented in
Table 11 confirm the previous results, showing that the NUT II model is the most reliable for forecasting future trends [(low error index: RMSE = 4434.325) and a strong precision index (MAE = 447.334)], followed by the Tourism CAE model [(low error index: RMSE = 8867.003) and high precision index (MAE = 893.550)]. The Enterprises Dimension model shows the highest error values, indicating low predictive accuracy (
Table 11).
The significance of the model parameters indicates that all the coefficients are positive and statistically significant (
p < 0.01). However, the variable “year” presents a negative and statistically significant coefficient in the NUT II model, suggesting an overall downward trend over time. This declining trajectory implies that the existing asymmetries in the geographic distribution of tourism enterprises across Portugal may deepen, particularly in relation to the number, size, and typology of businesses (
Table 12).
Figure 2 enables us to visually compare the results of the various models employed in the study of tourism data in Portugal. This includes information on the number and type of tourism businesses, as well as their distribution over time and across different regions (NUT II), which are large geographical areas of the country. The
y-axis shows the numerical values of various diagnostic metrics and structural characteristics of the statistical models. ARIMA and mixed linear regression models were applied to regional (NUT II) data to assess temporal and spatial patterns in the distribution of tourism businesses.
ARIMA models were used to analyse and predict time series, such as the evolution of the number of businesses over the years, while mixed linear regression models studied the effect of different factors, such as year, region, and type of business, on the distribution of businesses, considering both fixed and random variations. The results are analysed using the number of predictors (i.e., how many variables the model used), fit statistics (i.e., whether the model fits the data), Ljung–Box tests (i.e., to indicate autocorrelations), and outliers (i.e., anomalous values found).
These results provide valuable insights into the key factors likely to influence tourism activity in Portugal over time. The mixed linear regression model highlights the importance of spatial planning in the tourism sector, particularly from a long-term regional perspective (NUT II). It suggests that a balanced distribution of tourism enterprises—both in number and in size—across the national territory is essential to ensure equitable development. The time series model further emphasises the strong interconnection between the temporal dimension, regional location (NUT II), and the specific sector of tourism activity (
Figure 2). It also warns that existing asymmetries in the geographic distribution of tourism enterprises—and the resulting economic and social impacts—are likely to deepen unless addressed through targeted policy interventions.
4.3. Trends by NUT II—ANOVA
The variability in data across NUT II regions reveals divergent trends, as confirmed by Levene’s Test for homogeneity of variances: (a) For the different tourism activity sectors (CAE), the Sig. (p-value) results are 0.532 (mean), 0.394 (median), and 0.547 (trimmed mean), indicating that variances across groups are homogeneous and not statistically significant (p ≥ 0.05). (b) In contrast, for the variable “enterprise size”, all the Sig. (p-value) results are below 0.05 across all the approaches (mean, median, and trimmed mean), suggesting heterogeneous variances and statistically significant differences between regions (p ≤ 0.001). (c) Regarding turnover, no significant regional differences were found, with Sig. values of 0.627, 0.847, and 0.661 (p ≥ 0.05).
ANOVA assumptions were considered in evaluating the effect size between groups using the following: (a) Eta squared (η2), which measures the proportion of variance explained by the factors. Values under 0.01 indicate weak effects, between 0.01 and 0.06 moderate effects, and above 0.14 strong effects. (b) Epsilon squared (ε2) and Omega squared (ω2), which correct potential bias in eta squared.
For the tourism sector (CAE) and turnover, the eta squared values were 0.005, indicating minimal effects. Epsilon and omega squared values were occasionally negative, suggesting negligible explained variance. In contrast, enterprise size showed meaningful regional differences, with η2 = 0.124.
Post Hoc Tukey HSD tests confirmed statistically significant regional differences in enterprise size (p ≤ 0.001), particularly between the following: North vs. Centre, North vs. Alentejo, Centre vs. Lisbon, and Algarve vs. Alentejo. The North and Lisbon regions significantly differ from the Centre and smaller regions in terms of enterprise size.
Tourism sector type (CAE) and turnover do not show meaningful geographic variation, suggesting that location does not significantly influence either the type of tourism activity or average revenue levels. However, larger enterprises are predominantly located in the North and Lisbon, aligning with earlier analytical findings.
4.4. Linear Regression
Since the most discriminating variable was identified as the region (NUT II), the analysis aimed to understand the trend in remunerations over time within each region. Linear regressions were conducted to estimate future trends in remuneration values for the coming years. Each region follows the following equation: Y = aX + b, where “Y” represents remuneration including supplements, “X” is the year, “a” is the annual growth rate, and “b” is the intercept.
Table 13 shows the estimated average salary increases’ annual growth rate. The Alentejo region shows the highest annual growth rate (+EUR 29.01/year), while the Madeira region exhibits the lowest growth (+EUR 12.28/year).
The forecast of average salaries for 2025, with a 95% confidence interval, is presented in
Table 14. The Lisbon region is expected to experience the highest salary growth (EUR 1245.53), followed by the Azores (EUR 1211.79). In contrast, the Central and West regions are likely to have lower salaries (EUR 955.16). The Azores and Madeira are the regions showing the highest degree of uncertainty in the results, reflecting greater salary volatility.
Coefficient of Determination—Model Fit (R2)
R2 explains the fit of the regression model by measuring the proportion of variance in the data, ranging from 0 to 1, where (a) R2 = 1 means the model explains 100% of the variance in the data (perfect fit); (b) R2 = 0 means the model explains no variance (no predictive value).
Values between 0 and 1 indicate different levels of fit, with higher values indicating better predictive capability of the model (
Table 15).
The results presented in
Table 15 indicate that the Centre, North, and Setúbal Peninsula regions have the most reliable models, suggesting that salary increases follow a predictable trend. The Autonomous Regions of the Azores and Madeira exhibit higher variability in the data, implying that external factors such as tourism seasonality, economic instability, or local policies may influence salaries more unpredictably. The Algarve also shows only a reasonable fit, likely due to the impact of seasonality and fluctuations in tourist demand.
In summary, the various analyses indicate that while salary growth over the past 10 years has been positive and increasing, it appears relatively modest, especially considering inflation and the rising cost of living. If we look at the annual growth rates, most regions saw average increases of around EUR 20 to 30 per year, meaning the total salary increase over 10 years was between EUR 200 and 300. This is quite concerning, as inflation has been notably high in recent years, particularly after 2020, and the cost of living, especially in regions like Lisbon, the Algarve, and the Azores, has significantly risen due to housing and essential goods. Despite the positive trend in salary growth, it remains insufficient to keep up with the cost of living.
5. Discussion
The results of this study confirm that tourism, while recognised as a sector with high economic development potential, does not automatically generate uniform and beneficial effects across all territories. The analysis of Portuguese tourism businesses between 2012 and 2022 reveals patterns that reflect the tensions identified in the literature between tourism as a factor reducing regional inequalities (
Y. Wang & Tziamalis, 2023;
Mira et al., 2020) and tourism as an element amplifying territorial asymmetries (
Kervankıran & Sert Eteman, 2023;
Majdak & de Almeida, 2022).
The finding that there is a relatively balanced distribution of tourism activity sectors within regions, with evident specialisations—such as the North in transport and logistics and Lisbon and the Algarve in accommodation and catering—shows that the territory of Portugal has distinct vocations linked to historical, geographical, and infrastructural factors. However, this internal sectoral balance does not prevent the concentration of larger companies in specific regions (Lisbon, North, and Algarve), raising concerns about equity in access to economic opportunities offered by the sector (
Nguyen, 2021). This concentration could perpetuate inequalities in investment, employment, and income, favouring more developed territories and penalising inland and island regions.
On the other hand, in line with the literature, the results show that micro and small businesses employ thousands of people and are the largest in number in the tourism sector (
Costa et al., 2024). Thus, most companies continue to operate with a turnover of less than EUR 2 million throughout the period analysed, consistently representing more than 90% of all the companies in the tourism sector in Portugal. However, between 2012 and 2022, there was an increase in the turnover of larger companies (over EUR 2 million), particularly in the categories between EUR 2000 and 9999 thousand and EUR 10,000–49,999 thousand. As a result of the pandemic, in 2020–2021 there was a significant drop in turnover for companies, especially in the larger categories (EUR 10,000 thousand or more) and in 2022, the sector showed some recovery, with the companies with the highest turnover standing out.
Company size, the tourism activity sector, and the region were significantly associated with the average salary of workers, as shown by the statistical models applied. This association indicates that the territorial dynamics of tourism are not only a matter of the volume of companies but also of their quality—namely, their capacity to generate stable, well-paid, and qualified employment (
Çolak et al., 2023;
Croes, 2014). The absence of interactions between variables in the model is a limitation, but it does not prevent understanding the structuring role of geography and business scale in the distribution of tourism benefits.
On the other hand, the data suggest that the relationship between the number of companies and the size of regions is positive: the larger the region (in terms of population or economy), the larger the number of tourism businesses. This dynamic is consistent with the idea that more urbanised regions integrated into global economic flows attract more tourism investment (
Elgin & Elveren, 2024;
Russo et al., 2022), but it also confirms the perspective that tourism, without political intervention, can reinforce existing wealth concentration patterns (
Causevic & Lynch, 2013).
The applied Time Series Models point out that the NUT II variable and the activity sector (Tourism CAE) are the main predictors of the future behaviour of the sector. These models reveal downward trends in territorial equity, suggesting that without corrective policies, asymmetries may intensify. The forecast for 2025 reinforces these concerns: the Lisbon and Azores regions stand out with the highest expected salary growth, while the Centro and Oeste regions show the lowest. This pattern indicates a polarised tourism system, where productivity and income gains are not distributed evenly.
Additionally, data on salary volatility in Autonomous Regions suggest that factors such as seasonality, dependence on external markets, and specific regional policies contribute to income instability, hindering sustainable workforce management. The sector’s seasonality—widely documented in the literature (
Deng et al., 2019;
Mahadevan et al., 2017)—represents one of the main obstacles to building stable careers and retaining talent, compromising tourism’s contribution to local social development.
Another critical element of the analysis is the modest growth of salaries over the decade studied. The average salary evolution, around EUR 20 to 30 per year, is insufficient to keep up with the rise in prices and inflation, especially after 2020. This reality confirms warnings from several studies (
Costa & Costa, 2024;
Wen et al., 2021) about the mismatch between the economic benefits generated by tourism and the living conditions of sector workers. As
Costa et al. (
2020) argue, public policies must not only promote the quantitative growth of tourism but also ensure the quality of the jobs created.
The inferential analysis and econometric models used reinforce the idea that tourism growth is not automatically synonymous with inclusive development. On the contrary, the data show that without planned intervention, the sector tends to amplify regional and social disparities. These findings align with international studies that argue that tourism’s ability to reduce inequalities heavily depends on the existence of redistributive policies, regional strategic planning, and investment in local infrastructure (
Garsous et al., 2017;
Adhuze et al., 2023).
Finally, it is important to highlight that the results of this study have clear political implications. The evidence presented here should serve as a basis for the formulation of territorial cohesion policies in the tourism sector, focusing on the balanced redistribution of economic activities, the enhancement of labour, and continued investment in the qualification and retention of professionals. Through differentiated strategies for peripheral and island regions, it is possible to counteract the centrifugal effects of the sector and transform tourism into a true instrument of social cohesion and sustainable territorial development (
OECD, 2024;
UNWTO, 2019).
6. Conclusions
The present investigation aimed to deepen the understanding of the relationship between tourism and regional inequalities in Portugal. It focused on analysing the geographic distribution of tourism businesses, their size and typology, and the evolution of the average wages of workers between 2012 and 2022. Based on a theoretical framework that recognises both the inclusive potential and the risks of concentration in tourism, a rigorous quantitative methodology was adopted, combining descriptive analysis, mixed linear regression models, time series, and inferential statistical tests.
The empirical evidence gathered allows for several relevant conclusions. First, despite an apparent sectoral homogeneity in the distribution of tourism businesses, there is a clear concentration of larger businesses in already more developed regions such as Lisbon, the North, and the Algarve. This reality suggests that the tourism sector, as currently structured, reinforces pre-existing regional disparities, favouring territories with greater infrastructural and economic capabilities.
Second, the results indicate persistent inequalities in workers’ average wages, strongly influenced by the region and the sector of activity. While there has been a wage growth trend over the decade, this increase is insufficient to compensate for the rise in the cost of living in regions with high tourist pressure, such as Lisbon, the Algarve, and the Azores. These disparities undermine the redistributive function of tourism and hinder the construction of stable and qualified careers in the sector.
Additionally, the econometric models used confirm that the region (NUT II) and the Tourism CAE sector are the main predictors of salary behaviour, reinforcing the centrality of territory as an economic determinant. The time series models, in turn, project future scenarios of increased disparities if corrective public policies are not implemented.
6.1. Theoretical Implications
From a theoretical perspective, this study contributes to the deepening of the discussion on the role of tourism in the (re)configuration of regional inequalities. Empirical results support a critical view of the literature, challenging the notion of tourism as a panacea for territorial development. Instead, a more complex and territorialized interpretation of the tourism phenomenon is suggested, where the benefits and negative impacts are asymmetric, selective, and mediated by pre-existing regional structures. This contribution aligns with approaches that integrate tourism development’s economic, social, and political dimensions, going beyond mere analysis of flows or volumes.
6.2. Practical Implications
The practical implications of this study are equally relevant. The data suggest that public policy in the tourism sector must abandon a uniform logic and adopt a differentiated approach, sensitive to the territory and its specificities. It is imperative to develop territorial cohesion strategies in the tourism sector that promote the following:
- (i)
Support for the growth of micro and small businesses in peripheral regions;
- (ii)
The creation of fiscal and financial incentives to attract tourism investment to less developed areas;
- (iii)
The enhancement of working conditions and the professional qualifications of workers;
- (iv)
The development of infrastructures that reduce the structural gap between coastal and inland areas.
These policies must be integrated into broader strategies for sustainable regional development, with coordination between tourism, housing, transport, education, and environmental sectors.
6.3. Study Limitations
This study is not without limitations, which should be recognised and which open doors for future research. First, the analysis was exclusively based on secondary quantitative data, which may obscure important qualitative dimensions, such as the perceptions of workers, business owners, or local decision-makers. Second, the use of the NUT II scale, although relevant for regional analysis, may conceal significant intra-regional disparities (e.g., between coastal and inland areas within the same NUT). Additionally, the absence of variables related to workers’ profiles (age, gender, and education level) limits a deeper understanding of the factors influencing wages and job quality in the sector. It was also not possible, with the available data, to directly incorporate environmental or socio-cultural impact indicators, which would enrich a more holistic analysis of tourism development.
6.4. Suggestions for Future Research
Based on these limitations, three major areas for future research are suggested:
Multiscalar studies, combining analysis at the NUT III level or even municipal level, to capture more accurately the internal territorial asymmetries and specific local dynamics.
Mixed approaches (quantitative and qualitative) that integrate the perspectives of different actors in the sector (workers, business owners, residents, and decision-makers), allowing for the capture of perceptions, conflicts, adaptation strategies, and dynamics invisible to statistical data.
Exploration of new data sources, such as satellite images of night-time lights, mobility indicators, georeferenced data from digital platforms (e.g., Booking and Airbnb), or longitudinal panels that allow for the tracking of business and labour trajectories over time.
Finally, it would be pertinent to conduct comparative analyses between Portugal and other countries with similar tourism economies to understand to what extent the observed patterns are contextual or structural. This would contribute to a broader debate on tourism and territorial justice in the European and global context.


