Article

Quality Assessment of Administrative Units in Tourism Higher Education Using Continuous Scales

by
Vasileios P. Georgopoulos
1,
Ioannis A. Nikas
2,* and
Alkiviadis Panagopoulos
2
1
Department of Physics, University of Patras, GR 26504 Patras, Greece
2
Department of Tourism Management, University of Patras, GR 26334 Patras, Greece
*
Author to whom correspondence should be addressed.
Tour. Hosp. 2025, 6(1), 15; https://doi.org/10.3390/tourhosp6010015
Submission received: 25 December 2024 / Revised: 17 January 2025 / Accepted: 20 January 2025 / Published: 23 January 2025

Abstract

:
Higher education serves a pivotal role in enhancing citizens’ quality of life and, therefore, must uphold high standards of quality. This study evaluated the quality of services provided by departmental administrative offices using the SERVQUAL instrument, which measures quality through the difference between perceived and expected service performance. Our primary aim was to investigate the marginal behavior of this assessment by capturing the underestimated and overestimated perceptions and expectations. To achieve this, we introduced a modified version of SERVQUAL, replacing traditional Likert scales with continuous scales. This enabled a detailed mapping of the area between underestimation and overestimation, enhancing the instrument’s ability to yield more comprehensive insights. The study focused on the secretariat of the Department of Tourism Management, at the University of Patras, Greece, with second- and third-year students as assessors. Data analysis utilized the endpoints of these continuums. The results revealed that perceived service performance consistently and significantly fell below expectations, with reliability identified as the most important dimension. Furthermore, perception was found to be relatively objective, whereas expectation exhibited greater subjectivity. The findings demonstrate that this approach not only enhances service quality assessment but also provides a new perspective for evaluating tourism services, as a novel research tool.

1. Introduction

Academia stands at the crossroads of teaching and research, traditionally regarded as its two main missions (Bortagaray, 2009). Furthermore, universities bear a moral obligation to advance science and society by facilitating effective communication and fostering social engagement among their students (Etzkowitz, 2003; Rothaermel et al., 2007; Di Berardino & Corsi, 2018). Consequently, universities are expected to undertake a vast range of activities, including promoting innovation and knowledge transfer, lifelong learning and continuing education, and contributing to social and cultural development (Mora et al., 2015). At the same time, they must address these challenges while demonstrating accountability and an efficient use of public resources, a goal achievable only through meticulous strategic management (Callagher et al., 2015; Benneworth et al., 2016; Aragonés-Beltrán et al., 2017; De La Torre et al., 2017; Mariani et al., 2018). Thus, universities serve a central role in cultivating desirable attributes (Hirst & Peters, 1972), underscoring the necessity for them to be institutions of high quality.
Quality, however, is a complex and contentious concept to define, comparable to other abstract notions such as “equality” or “justice” (Harvey & Green, 1993). Gibson emphasizes this by stating that delivering quality is just as difficult as it is to describe it (Gibson, 1986). There is a wide range of different conceptualizations of quality being used (Schuller, 1991) as its interpretation depends on the user and the specific context in which it is applied (Harvey & Green, 1993). In the context of higher education, there are several stakeholders involved, including students, teachers, administrative stuff, government entities, and funding organizations (Burrows & Harvey, 1992), where each of them has its own perspective and approach regarding quality, shaped by its distinct objectives (Fuller, 1986; Hughes, 1988). Even though there is no consensus among the various definitions, there is notable agreement on certain aspects (Ball, 2008). These aspects of education quality include the inputs (e.g., students) and outputs (e.g., educational outcomes) of the education system, as well as its capability to satisfy needs and demands by meeting expectations (Cheng, 1995). Crosby (1979) succinctly defines quality as “conformance to requirements”. It is worth noting that Coxe’s research (Coxe, 1990) led to a positive correlation between citizens’ standards of living and education and their demand on the quality of products and services provided. In order to meet stakeholders’ expectations—considered the primary purpose of any product or service (Feigenbaum, 1991; Ismail et al., 2009)—there is a need for constant feedback (Nur-E-Alam Siddique et al., 2013), making assessment essential. In the context of education, Bramley defines assessment as a process that aims to determine the value of a certain aspect of education, or education as a whole, to facilitate decision-making (Bramley, 2003). This is achieved through a set of indicators designed to measure these values (Diamond & Adam, 2000), which are then compared with predetermined objectives (Noyé & Piveteau, 2018). Assessment can also be described as a process that captures the overall impression of an educational institution for the purpose of fostering improvement (Vlasceanu et al., 2004). Therefore, assessment is widely regarded as the most effective mechanism to enact change within an educational institution, enabling its development and contributing to its success (Darling-Hammond, 1994).

2. Literature Review

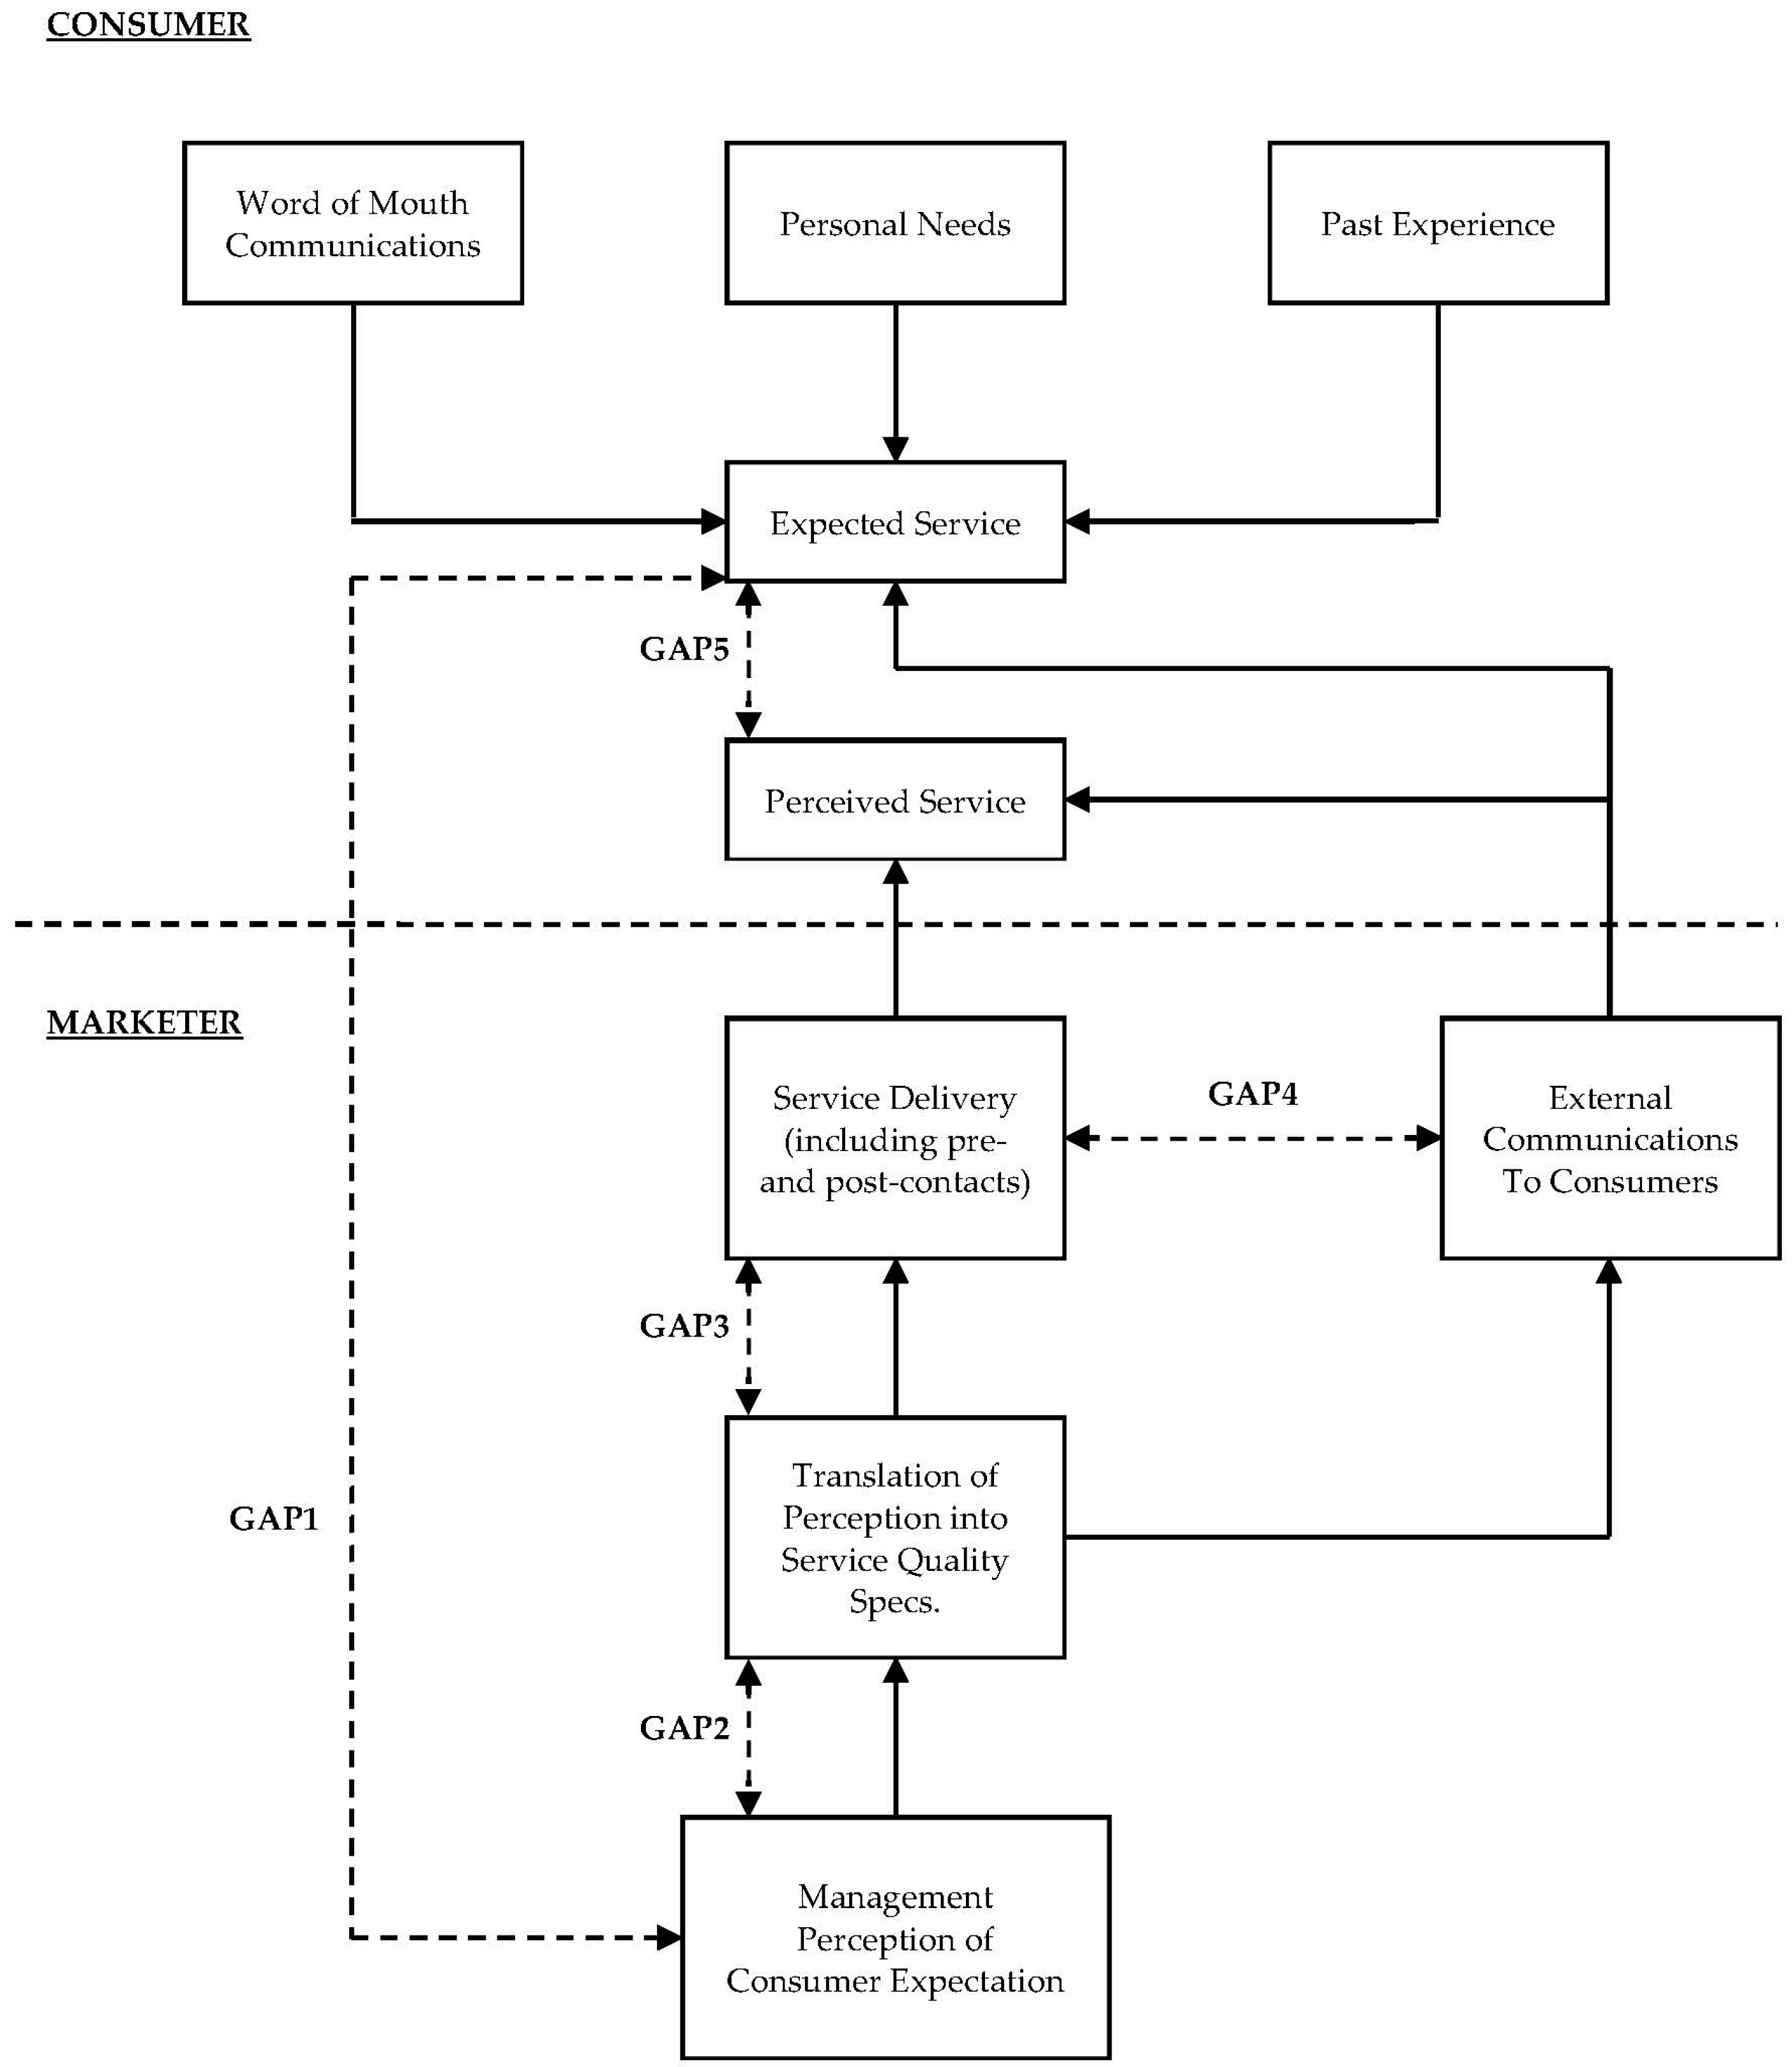
The absence of proper instruments to measure quality hinders the effort to improve it (Farrell et al., 1991). Moreover, accurate quality measurements are required in order to assess a service change, via a before and after comparison (Brysland & Curry, 2001). In the pursuit of assessing service quality, Gronroos (1982) developed a model based on the notion that consumers evaluate quality by comparing the service they expected with their perception of the service received. This line of thinking was followed by many researchers. For instance, Smith and Houston (1983) argued that consumer satisfaction depends on whether their expectations are met, while Lewis and Booms (1983) defined service quality as the extent to which the delivered service aligns with customer expectations. Recognizing that quality encompasses more than outcomes, researchers have explored appropriate dimensions of quality (Parasuraman et al., 1985). For example, Sasser et al. (1978) proposed three dimensions of service performance: personnel, facilities, and levels of material. To enable their search for these dimensions, Parasuraman et al. (1988) investigated and proposed a framework that deconstructs the gap between expectation and perception into five distinct gaps (Figure 1). The first gap arises from the difference between customer expectations and management’s perceptions of those expectations. The second occurs between management’s perceptions of customer expectations and the service quality specifications set by the firm. The third reflects discrepancies between the specified quality standards and the service actually delivered. The fourth emerges between the actual service delivery and how said service is communicated to consumers. Finally, the fifth gap is created between the actual service delivery, combined with how it is communicated, and the customers’ perception of said service, closing the loop between expectation and perception (Parasuraman et al., 1985).
This investigation identified 10 key criteria categories—referred to as the sought-after dimensions—which, after further research and refinement, were consolidated into 5: tangibles, reliability, responsiveness, assurance, and empathy. Tangibles refer to facilities, equipment, and personnel appearance. Reliability concerns the ability to deliver the promised service accurately. Responsiveness reflects the willingness to assist customers and provide prompt service. Assurance pertains to personnel expertise and their ability to inspire trust. Finally, empathy involves the provision of individualized care to customers. This body of work culminated in the development of a service quality model known as SERVQUAL, which follows the above five-dimensional structure. The model is designed to capture the perception of service performance, along with its expectation (Parasuraman et al., 1988). If perception falls below expectation, the service is deemed to provide low satisfaction. If perception matches expectation, the service is considered to provide adequate satisfaction. Finally, if perception exceeds expectation, the service is deemed to provide remarkable satisfaction (Parasuraman et al., 1988).
In our study we introduced and utilized a modified version of the SERVQUAL quality measurement instrument to capture the Department of Tourism Management (University of Patras, Greece) students’ perceptions and expectations regarding the services provided by the departmental administrative offices and to potentially detect areas of service that may require improvement or redesign. The proposed modification lies in replacing traditional Likert scales with continuous scales, capturing the variance between the assessment’s underestimation and overestimation, enhancing the instrument by yielding more comprehensive insights. While SERVQUAL has been widely applied to assess service quality, most studies rely on fixed-point scales such as Likert scales, which are not capable of capturing the variance in respondents’ evaluations. This novel approach addresses this gap in the existing literature, while also contributing to the broader body of research on administrative quality assessment in higher education.

3. Materials and Methods

3.1. Study Participants

The target population of our study consisted of undergraduate second- and third-year students from the Department of Tourism Management at the University of Patras (Patras, Greece). The study was conducted on 19 May 2024, with 129 participants attending lectures in two core second- and third-year courses within the department. The required sample size, calculated for a z -score based on a 90% confidence level and a 5% margin of error, was 116, making our sample size representative of the target population.
All procedures were carried out in accordance with the Helsinki Declaration (World Medical Association, 2024). Participation was entirely voluntary, and the data collection process was designed to ensure complete anonymity. Participants were informed about the purpose of the survey both verbally and in the preface section of the questionnaire, while written consent was obtained to permit the use of the collected data. Completing the questionnaire required approximately 15 min. Since the study did not pose any physical or psychological risks, supervision from an ethical review board was not deemed necessary (Whicher & Wu, 2015).

3.2. Survey

The deployment of the questionnaire was based on the SERVQUAL quality measurement instrument (Parasuraman et al., 1988). The instrument was tested in a pilot study, involving staff and students, to determine whether any modifications were necessary.
Several other measurement instruments have been developed (Moore, 1987; Heywood-Farmer, 1988; Beddowes et al., 1988; Nash, 1988; Philip & Hazlett, 1997; Robledo, 2001). However, SERVQUAL remains one of the most popular and widely used, cited, and researched quality assessment methods (Asubonteng et al., 1996; Robinson, 1999; Waugh, 2002) and is therefore highly trusted. Additionally, its design of empirical psychometric testing and trials enables its application across a broad range of service organizations (Wisniewski, 2001), provided proper adjustments are made. Examples include its successful adaptation for use in higher education (Broady-Preston & Preston, 1999; Hill, 1995; Galloway, 1998) and in tourism (Puri & Singh, 2018; Qolipour et al., 2018), which guided our decision to use it.
The survey consisted of 4 sections. Section A recorded demographic data, namely, gender, age, year of study, and whether the participant was raised in Athens (the capital of Greece). Section B aimed to capture the perception of service performance through 25 questions addressing each of the instrument’s 5 dimensions. Section C focused on capturing the expectation of service performance, using the same 25 questions, adjusted to reflect the case of an ideal secretariat. Finally, section D sought to determine the order of importance among the dimensions. Students were asked to allocate 100 available points across the dimensions based on their perceived importance. Additionally, section D included 3 direct questions asking participants to rank the dimensions in order of importance. These questions were intended to cross-check whether the point-based allocation aligned with the participants’ stated ranking. In total, the questionnaire consisted of 62 questions: 4 demographics, 25 for perception, 25 for expectation, 5 for point-based ranking, and 3 for cross-checking the rankings.
To ensure relevance in the modern era, the instrument’s questions were adapted to address contemporary advancements, including the role of digital and technological services in administrative support. Moreover, it was tailored to the Greek higher education system. Sections B and C were modified to accept ranges as input (with their endpoints ranging from 0 to 100), rather than relying on a traditional 5-point or 7-point Likert scale, aiming to capture the marginal behavior of underestimation and overestimation. Despite the above changes, the instrument retains its original philosophy intact (Appendix B.1). To explain the unfamiliar concept, participants were instructed to provide an answer ranging from their worst to their best experience related to the subject of each question. The introductions of sections B and C included multiple examples of demonstrative ranges to help familiarize participants with this concept. Additionally, it was emphasized that there were no “incorrect” ranges, thereby encouraging participants to respond freely and as they deemed appropriate. An electronic/computerized version of the survey could make use of sliders with dual handles, enabling participants to define the positions of both endpoints. This design could facilitate their understanding of the concept of continuous scales without the need for additional clarification.

3.3. Processing

The database containing the survey responses was managed using Microsoft Excel (Microsoft Corporation, 2018) and analyzed using the Statistical Package for Social Sciences (IBM Corp., 2023). The results were presented using both software programs. A p -value of less than 0.05 was considered necessary for a finding to be deemed statistically significant. Moreover, the internal reliability of the survey was assessed using Cronbach’s alpha.
Questionnaires with unsuitable answers in the demographic section (section A) were excluded from the demographic statistical analysis. Additionally, questionnaires with 5 or more unsuitable answers in section B (i.e., 20% or more of the total questions in the section) were excluded from this section’s analysis. Questionnaires excluded from section B were not eligible for inclusion in section C’s analysis. From those included in section B, questionnaires with 5 or more unsuitable answers in section C (i.e., 20% or more of the total questions in the section) were excluded from this section’s analysis. Finally, regarding section D, questionnaires that did not pass the significance level check were excluded from this section’s analysis. Unsuitable answers included the following: no answer, failure to give a range, upside-down ranges, or ranges wider than 39 (considered too wide to provide meaningful information). The limit of 39 was set to prevent answers using more than 2 points on a 5-point Likert scale after conversion.
This protocol resulted in the following exclusions: 2 exclusions from section A (127 valid), 11 from section B (118 valid), 5 additional exclusions from section C (113 valid), and 76 from section D (leaving 53 valid questionnaires after the significance level test).

3.4. Analysis

The study of marginal behavior involves two separate analyses: one for the underestimated and one for the overestimated students’ evaluation. Based on the assumption that the actual evaluation of the provided services lies within the area between underestimation and overestimation, we propose the following cases:
C1: If the overestimated perception is lower than the underestimated expectation, then the provided services are deemed unsatisfactory.
C2: If the overestimated expectation is lower than the underestimated perception, then the provided services are deemed highly satisfactory.
C3: If the overestimated perception is higher than the underestimated expectation or if the overestimated expectation is higher than the underestimated perception, then the provided services are deemed satisfactory.
Furthermore, we are allowed to state that the magnitude and consistency of this difference indicate how well established the corresponding conclusion is.
Based on the above assumption and proposed cases, the following results will address the research question of which of these cases applies to this study’s evaluation.

4. Results

4.1. Demographics

A total of 49 males (38%) and 78 females (60.4%) participated in the study. In terms of age, the largest group was students aged 20 years (46.5%), while second-year students (65%) constituted the majority. Most of the participants were not raised in Athens (68.2%) (Figure 2).

4.2. Dimension Significance

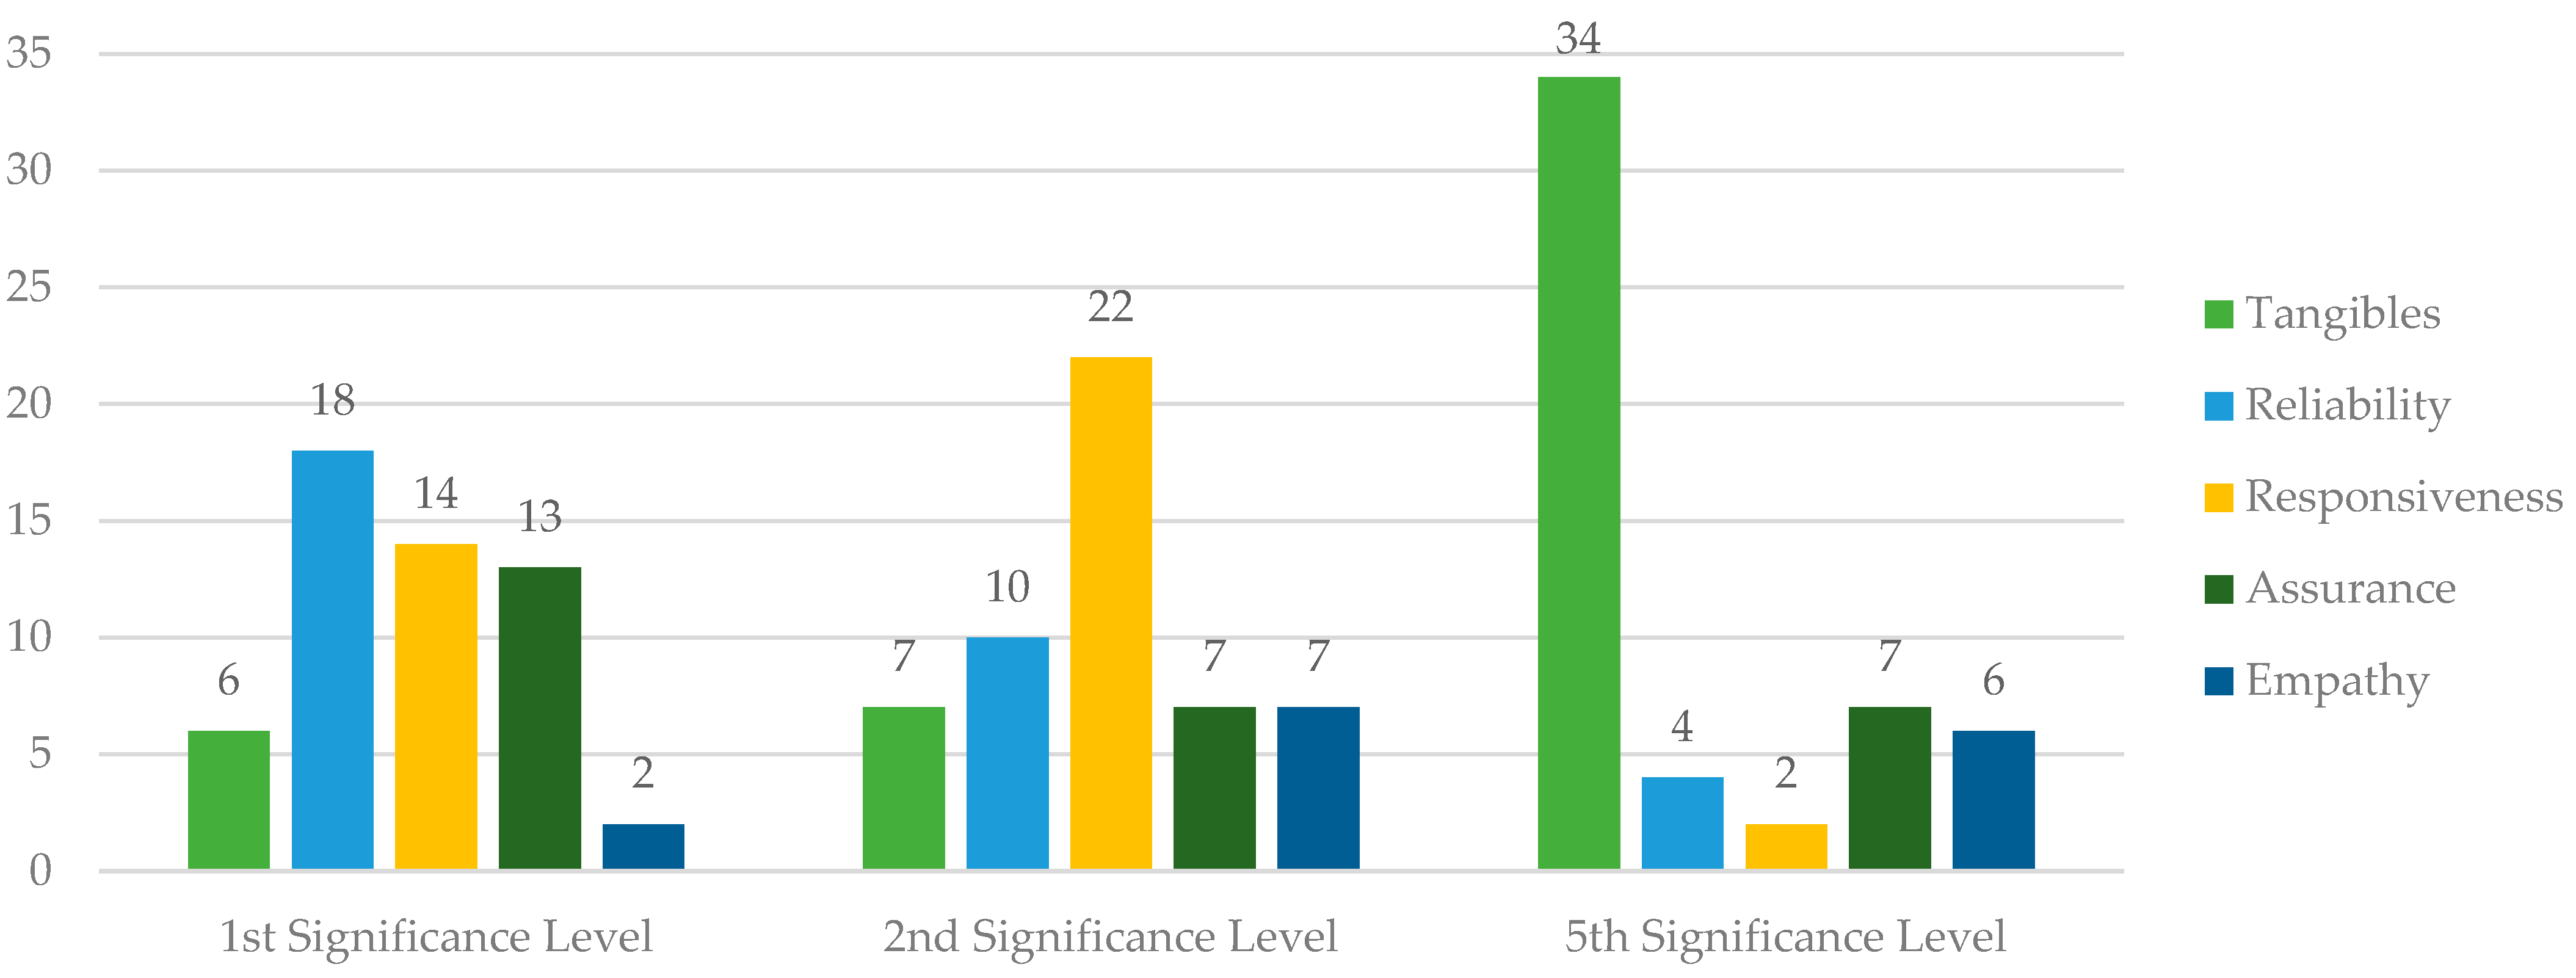
The most significant dimension was found to be “reliability” (34%), and the second most important was “responsiveness” (41.5%), while the least significant was found to be “tangibles” (64.2%) (Figure 3).

4.3. Descriptive Statistics

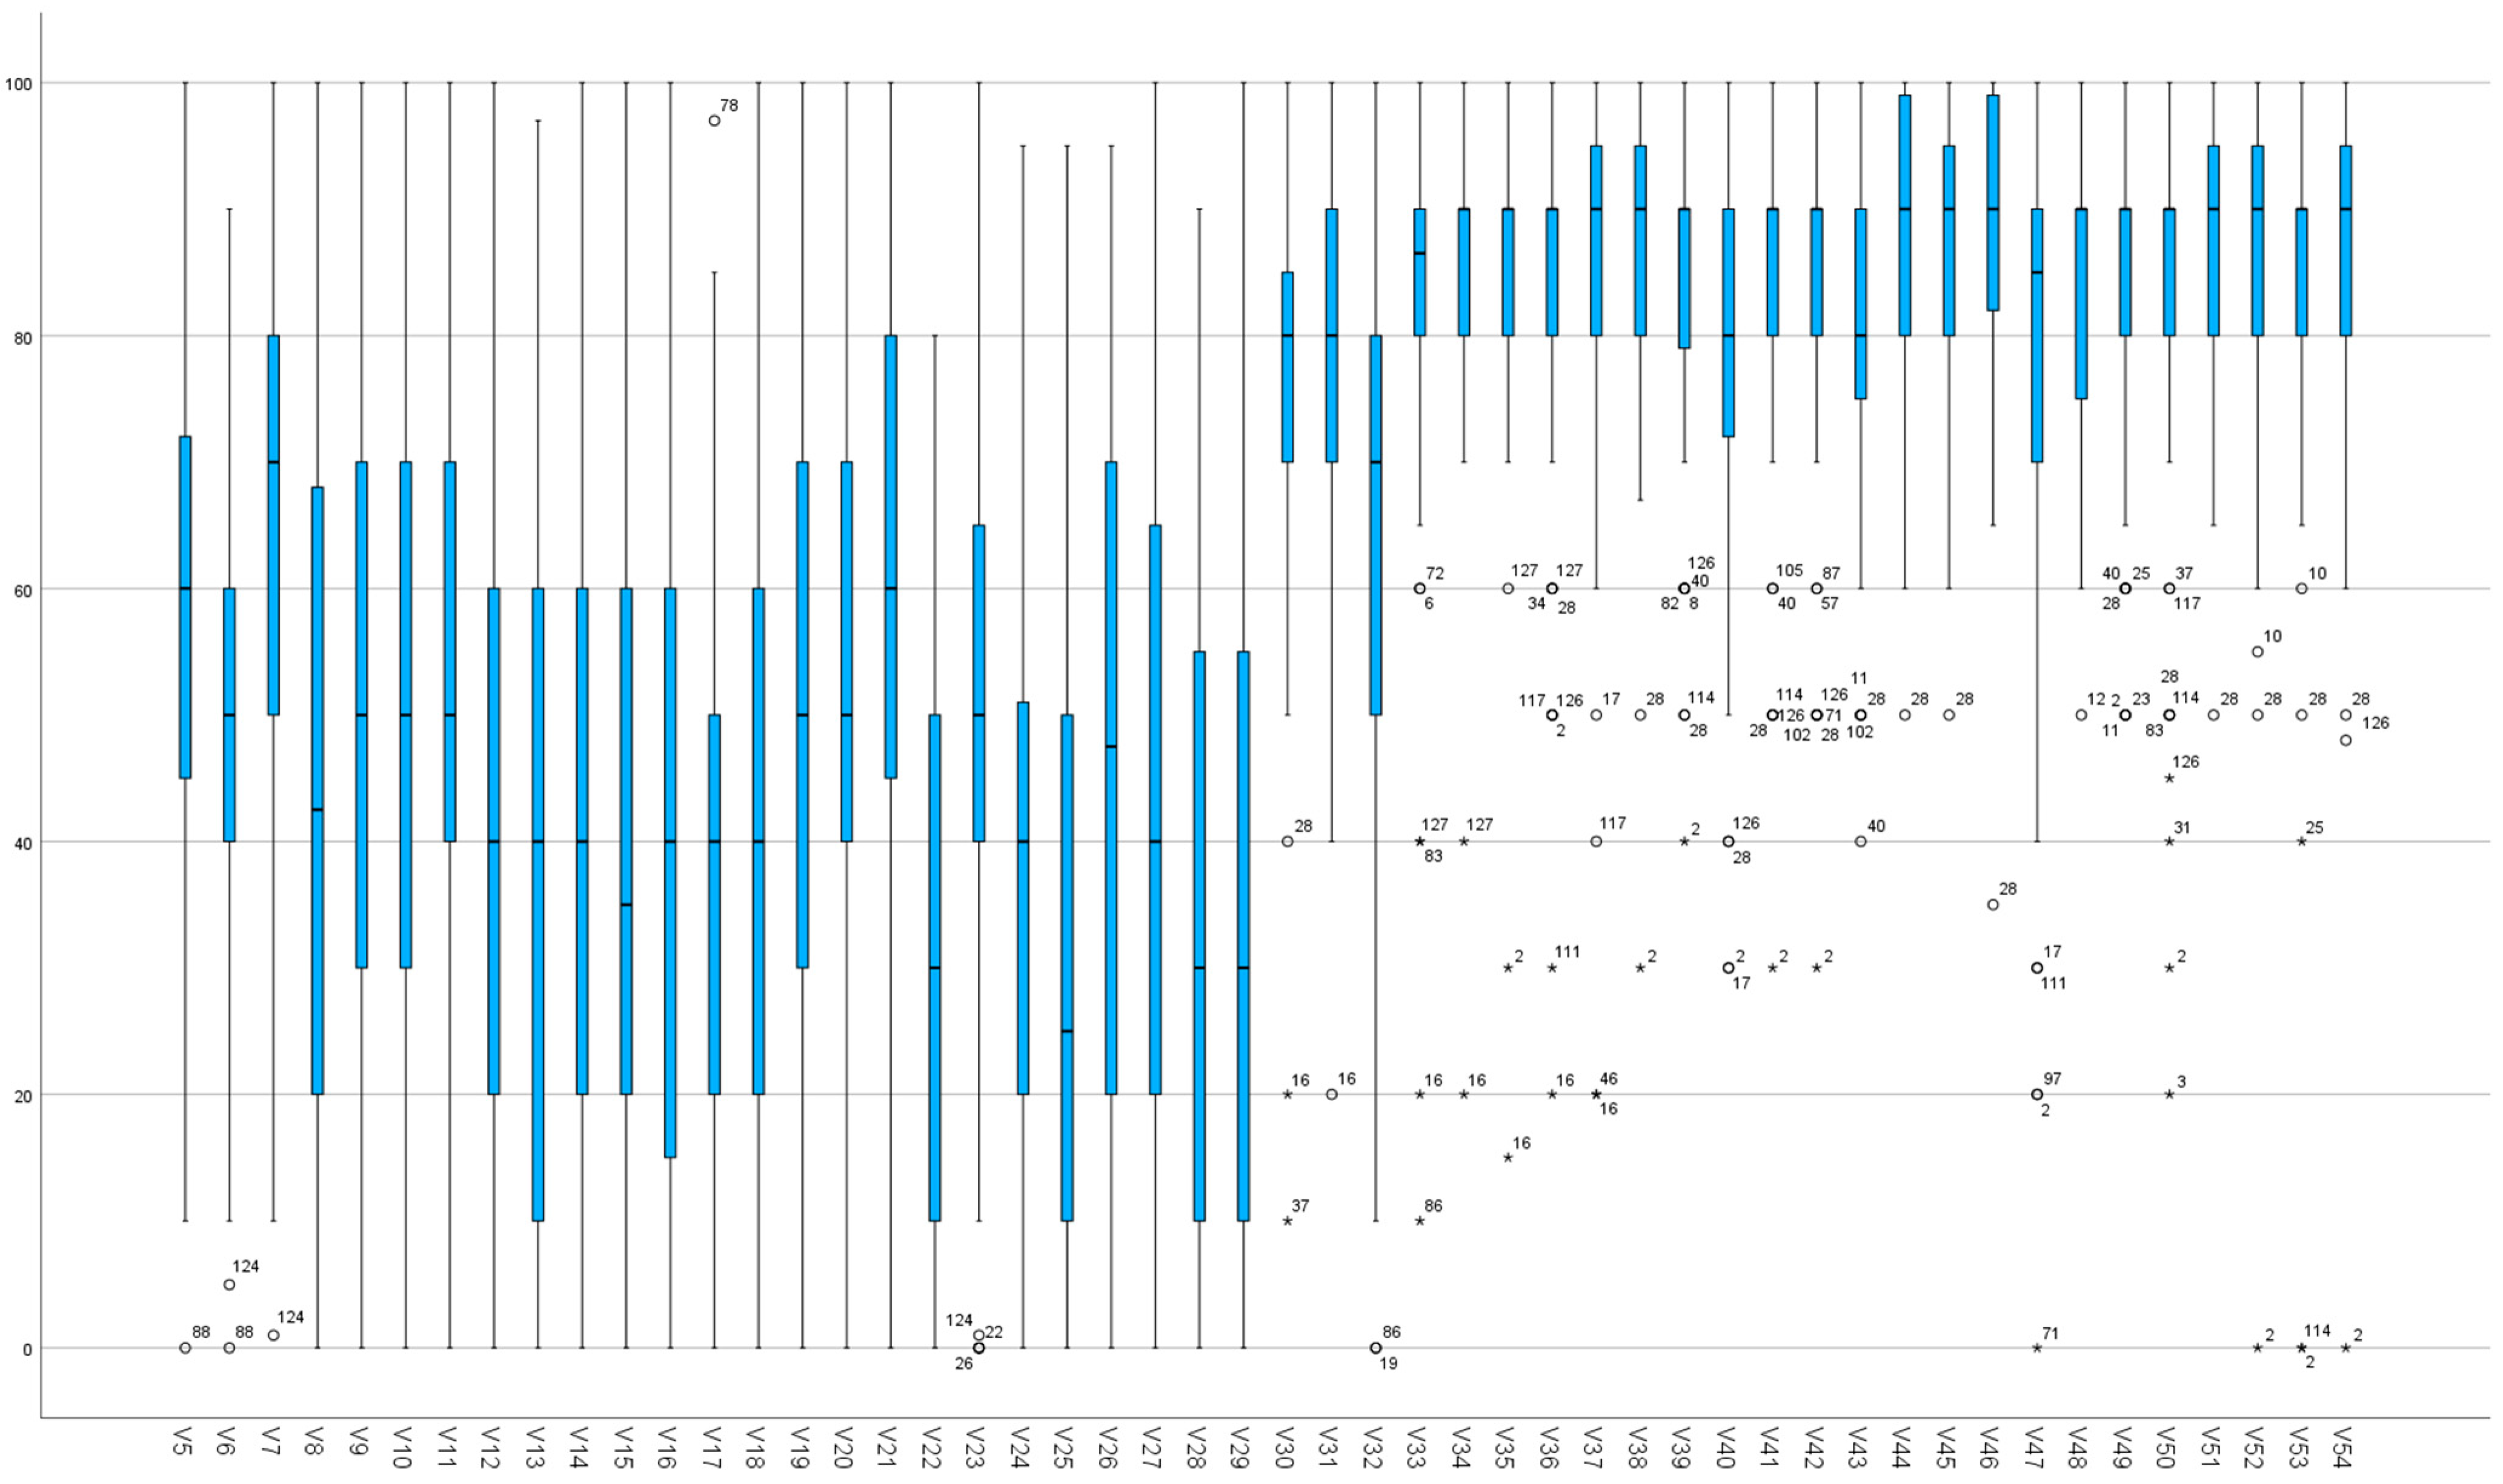
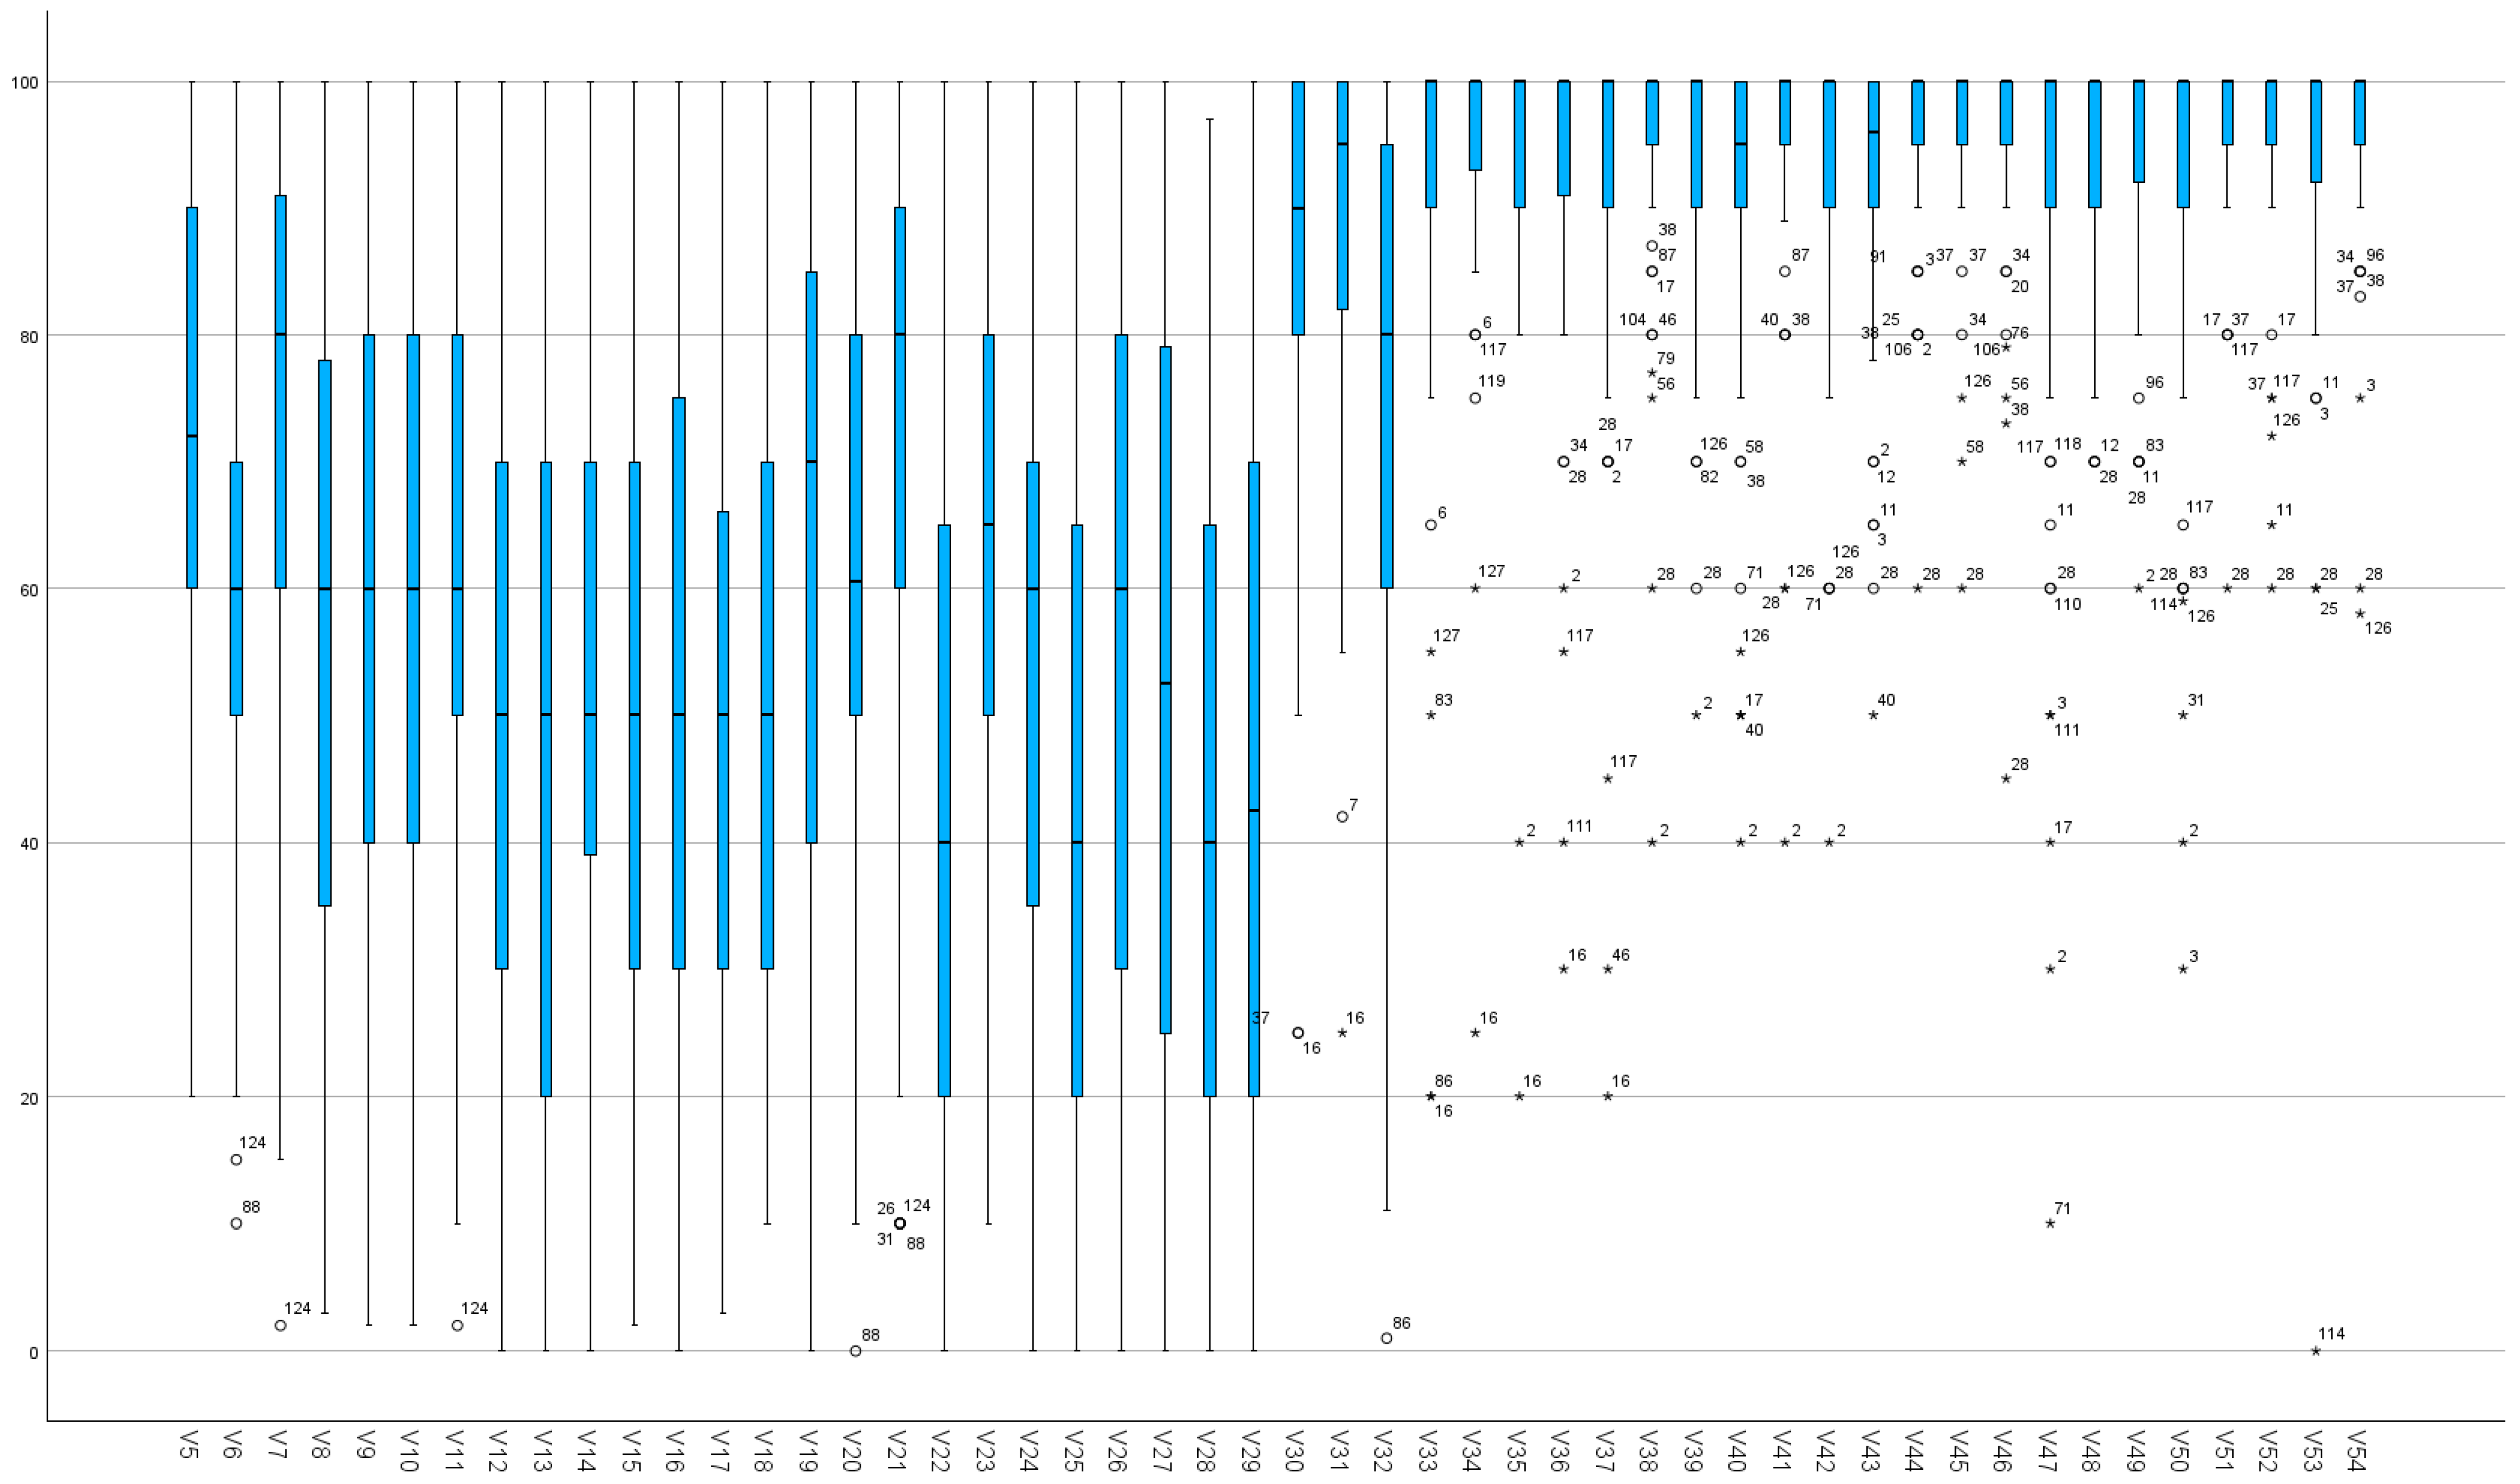
Figure 4 and Figure 5 present the boxplots of variables 5–29 (perception) and 30–54 (expectation), for underestimation and overestimation, respectively. Notably, perception demonstrated fewer outliers compared with expectation, which exhibited significantly more, in both cases.
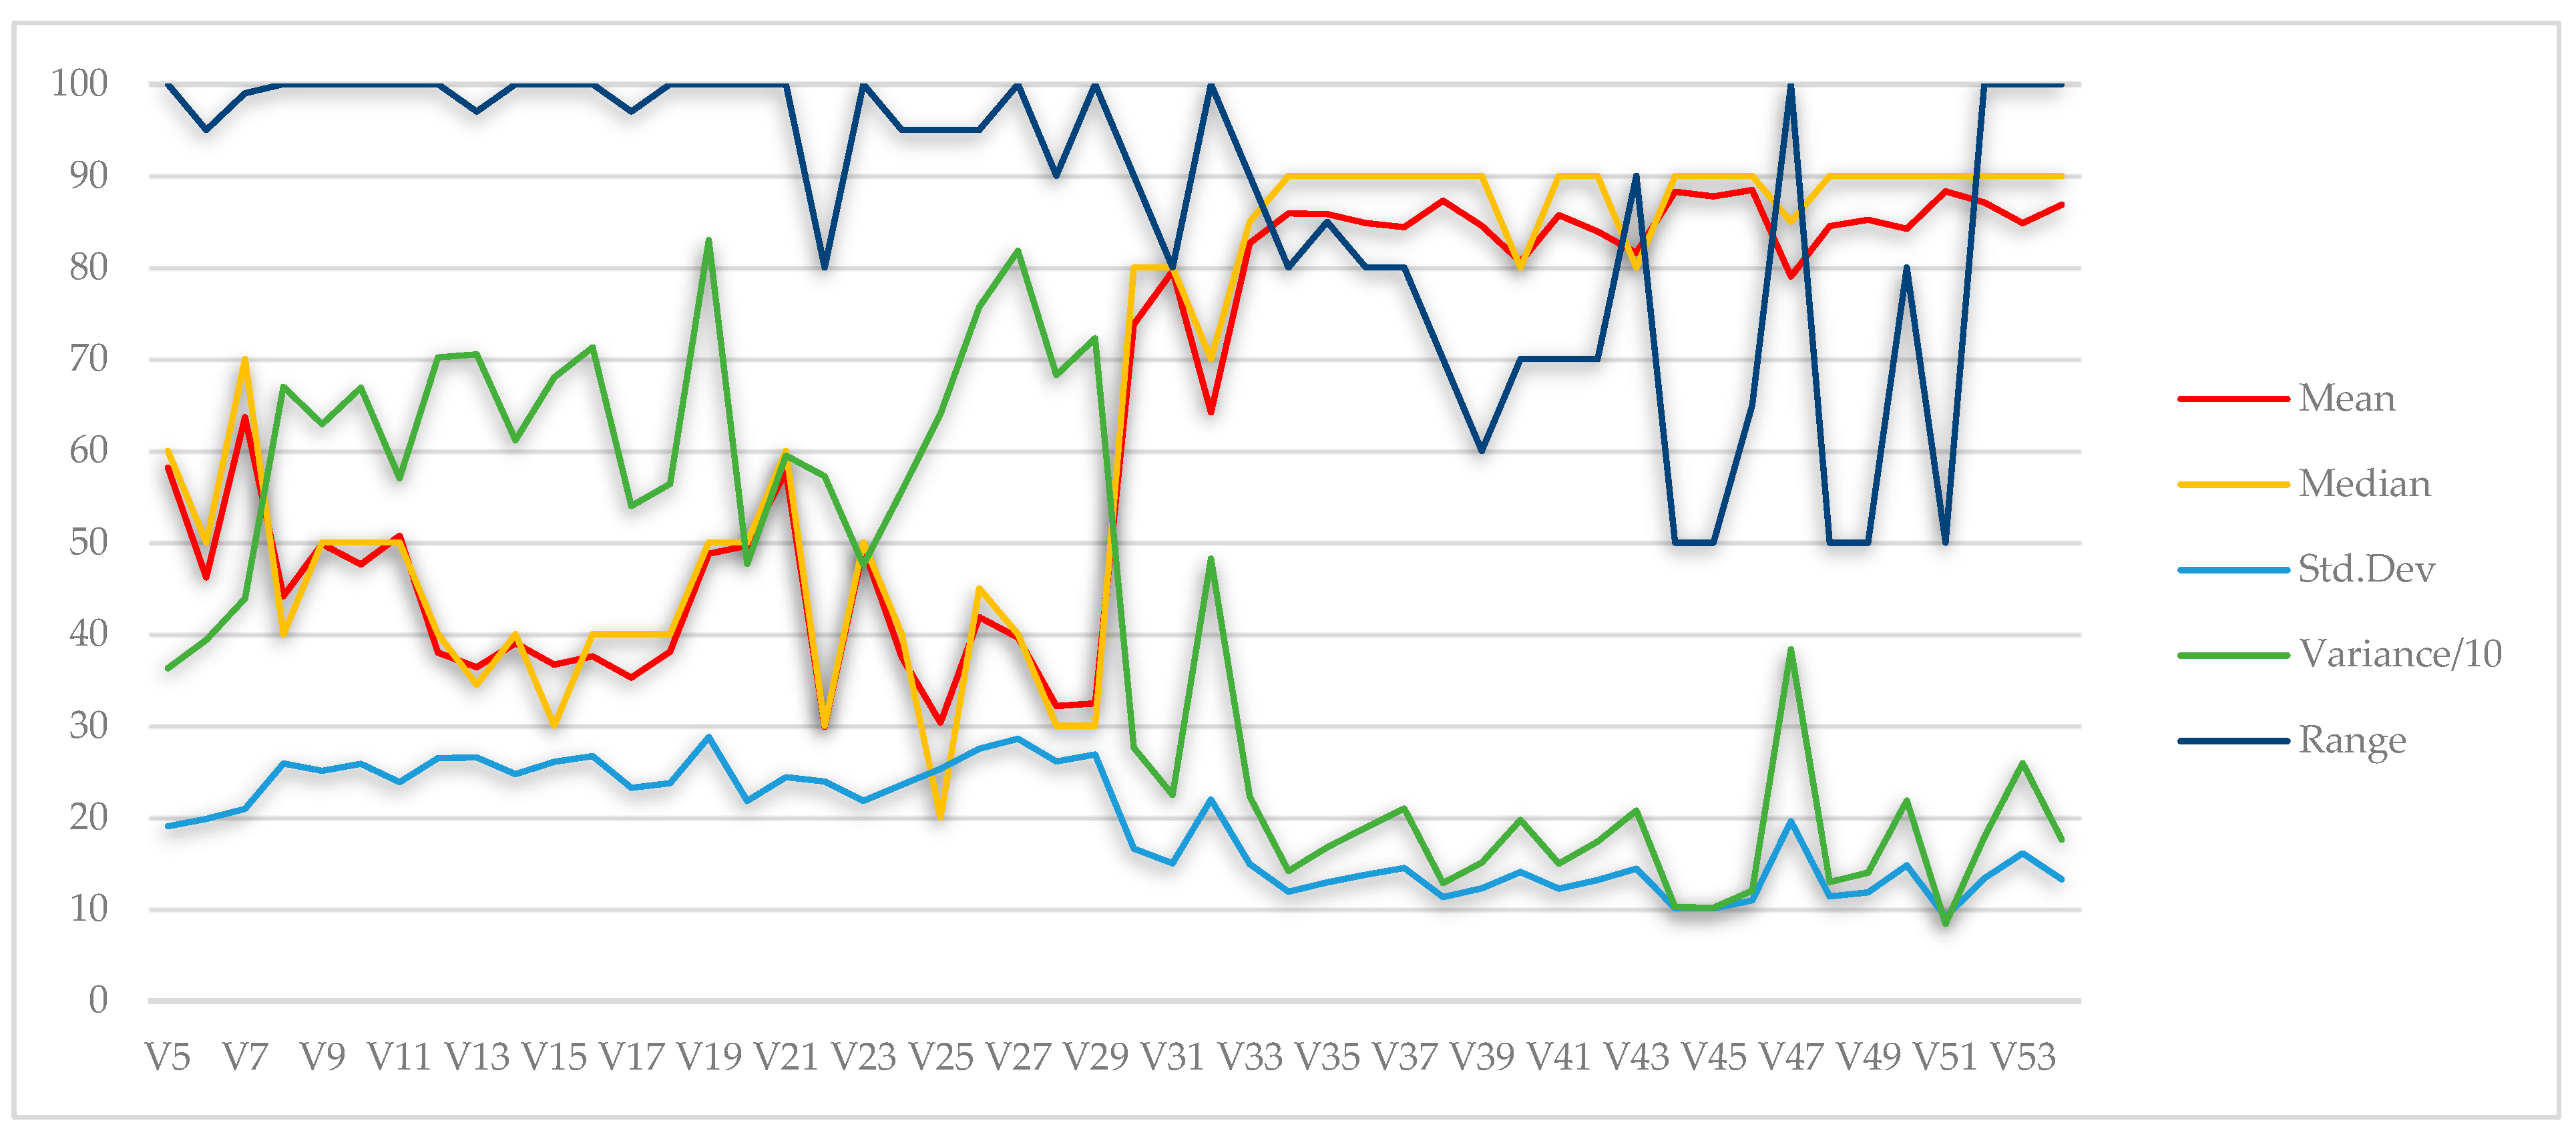
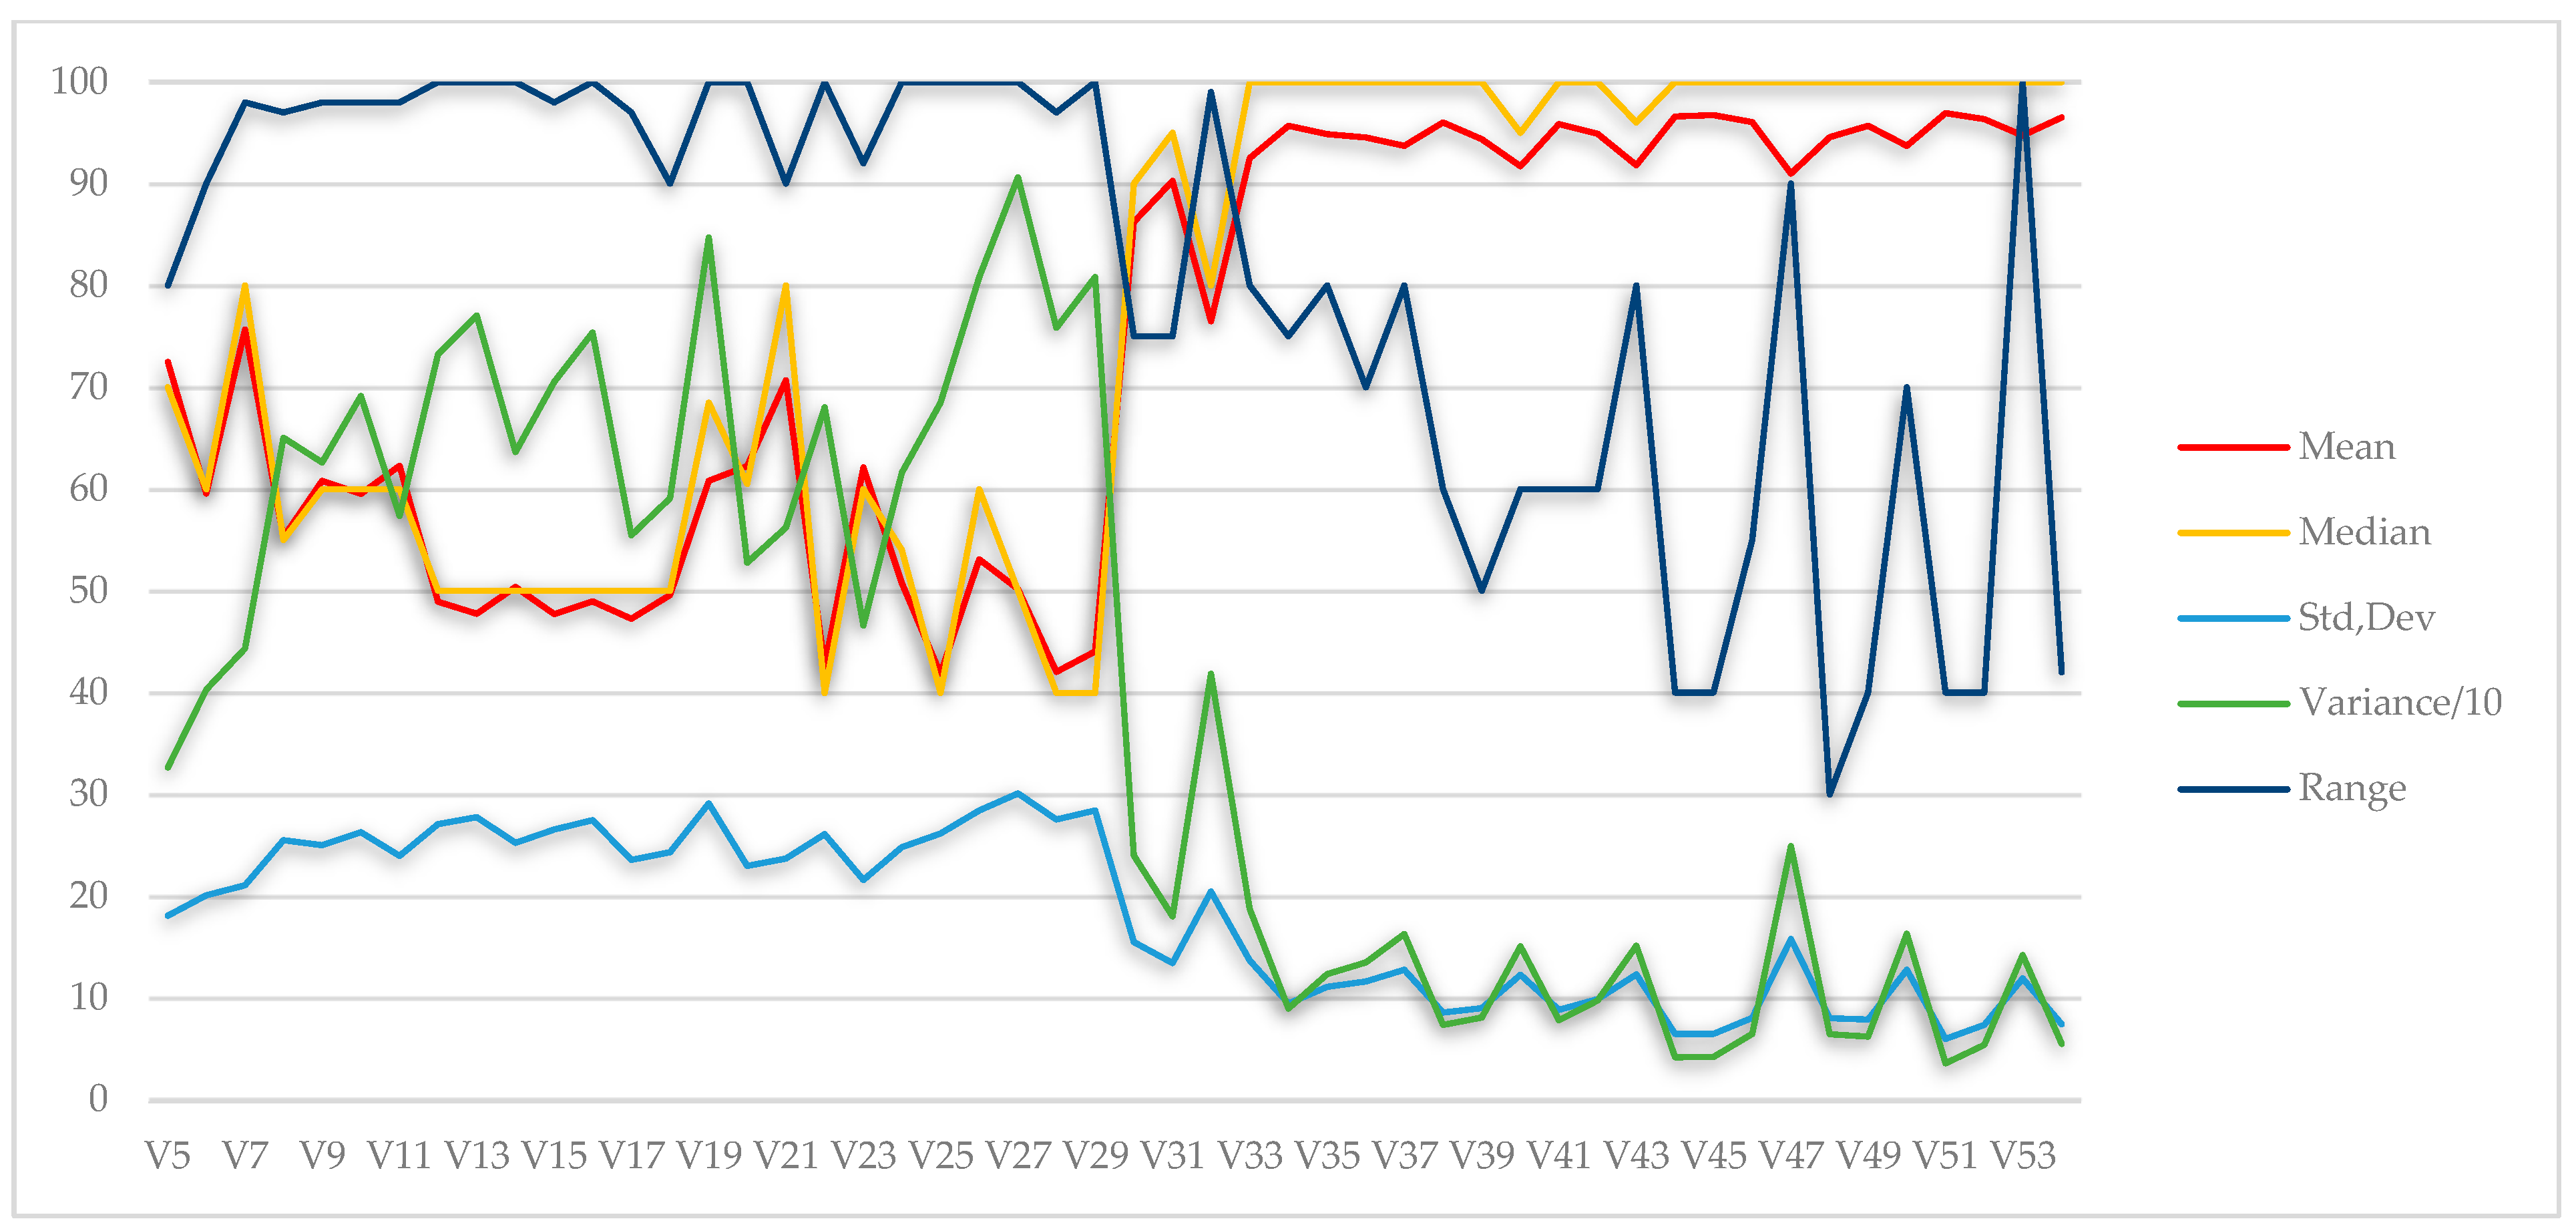
Figure 6 and Figure 7 present the basic central tendency measures for the underestimated and overestimated responses depicted in variables 5–29 (perception) and 30–54 (expectation).
Finally, the internal consistency of the questionnaire was confirmed through the Cronbach’s alpha estimation, as shown in Table 1.
The detailed data statistical description is presented in Appendix A, in Table A1, Table A2, Table A3, Table A4, Table A5, Table A6, Table A7, Table A8, Table A9, Table A10, Table A11, Table A12, Table A13 and Table A14.

4.4. Comparison of Under- and Overestimation

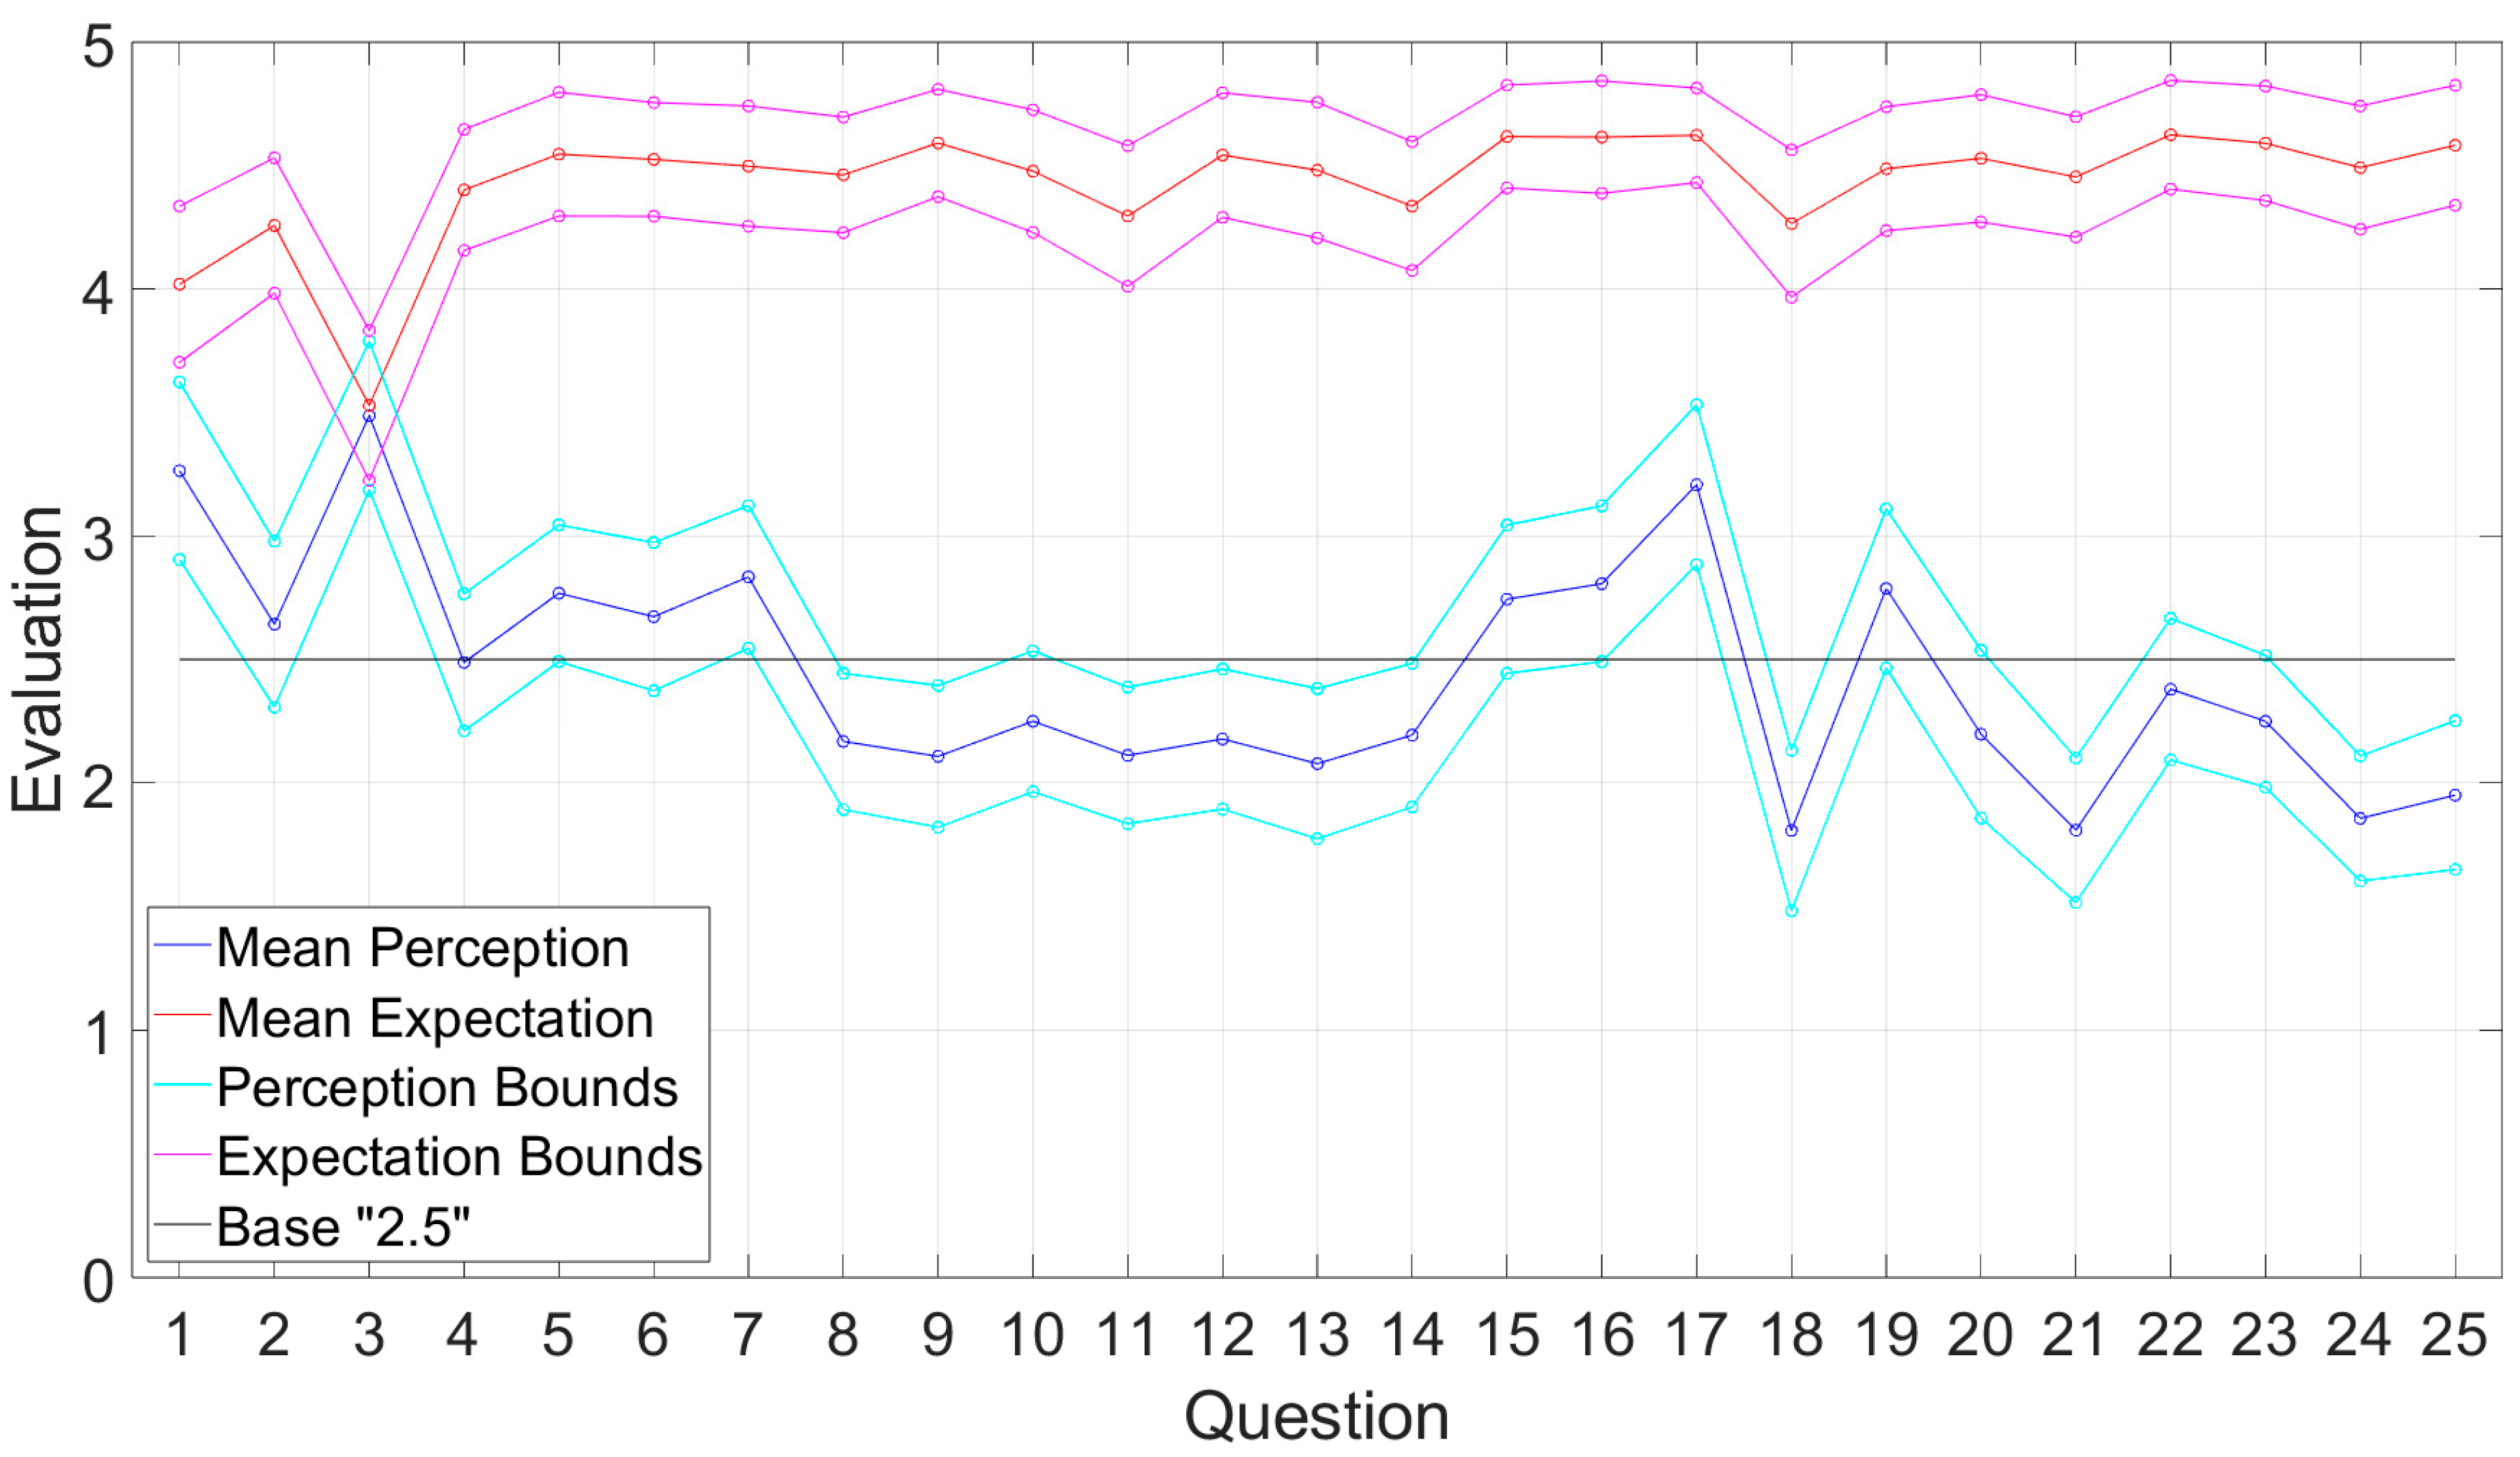
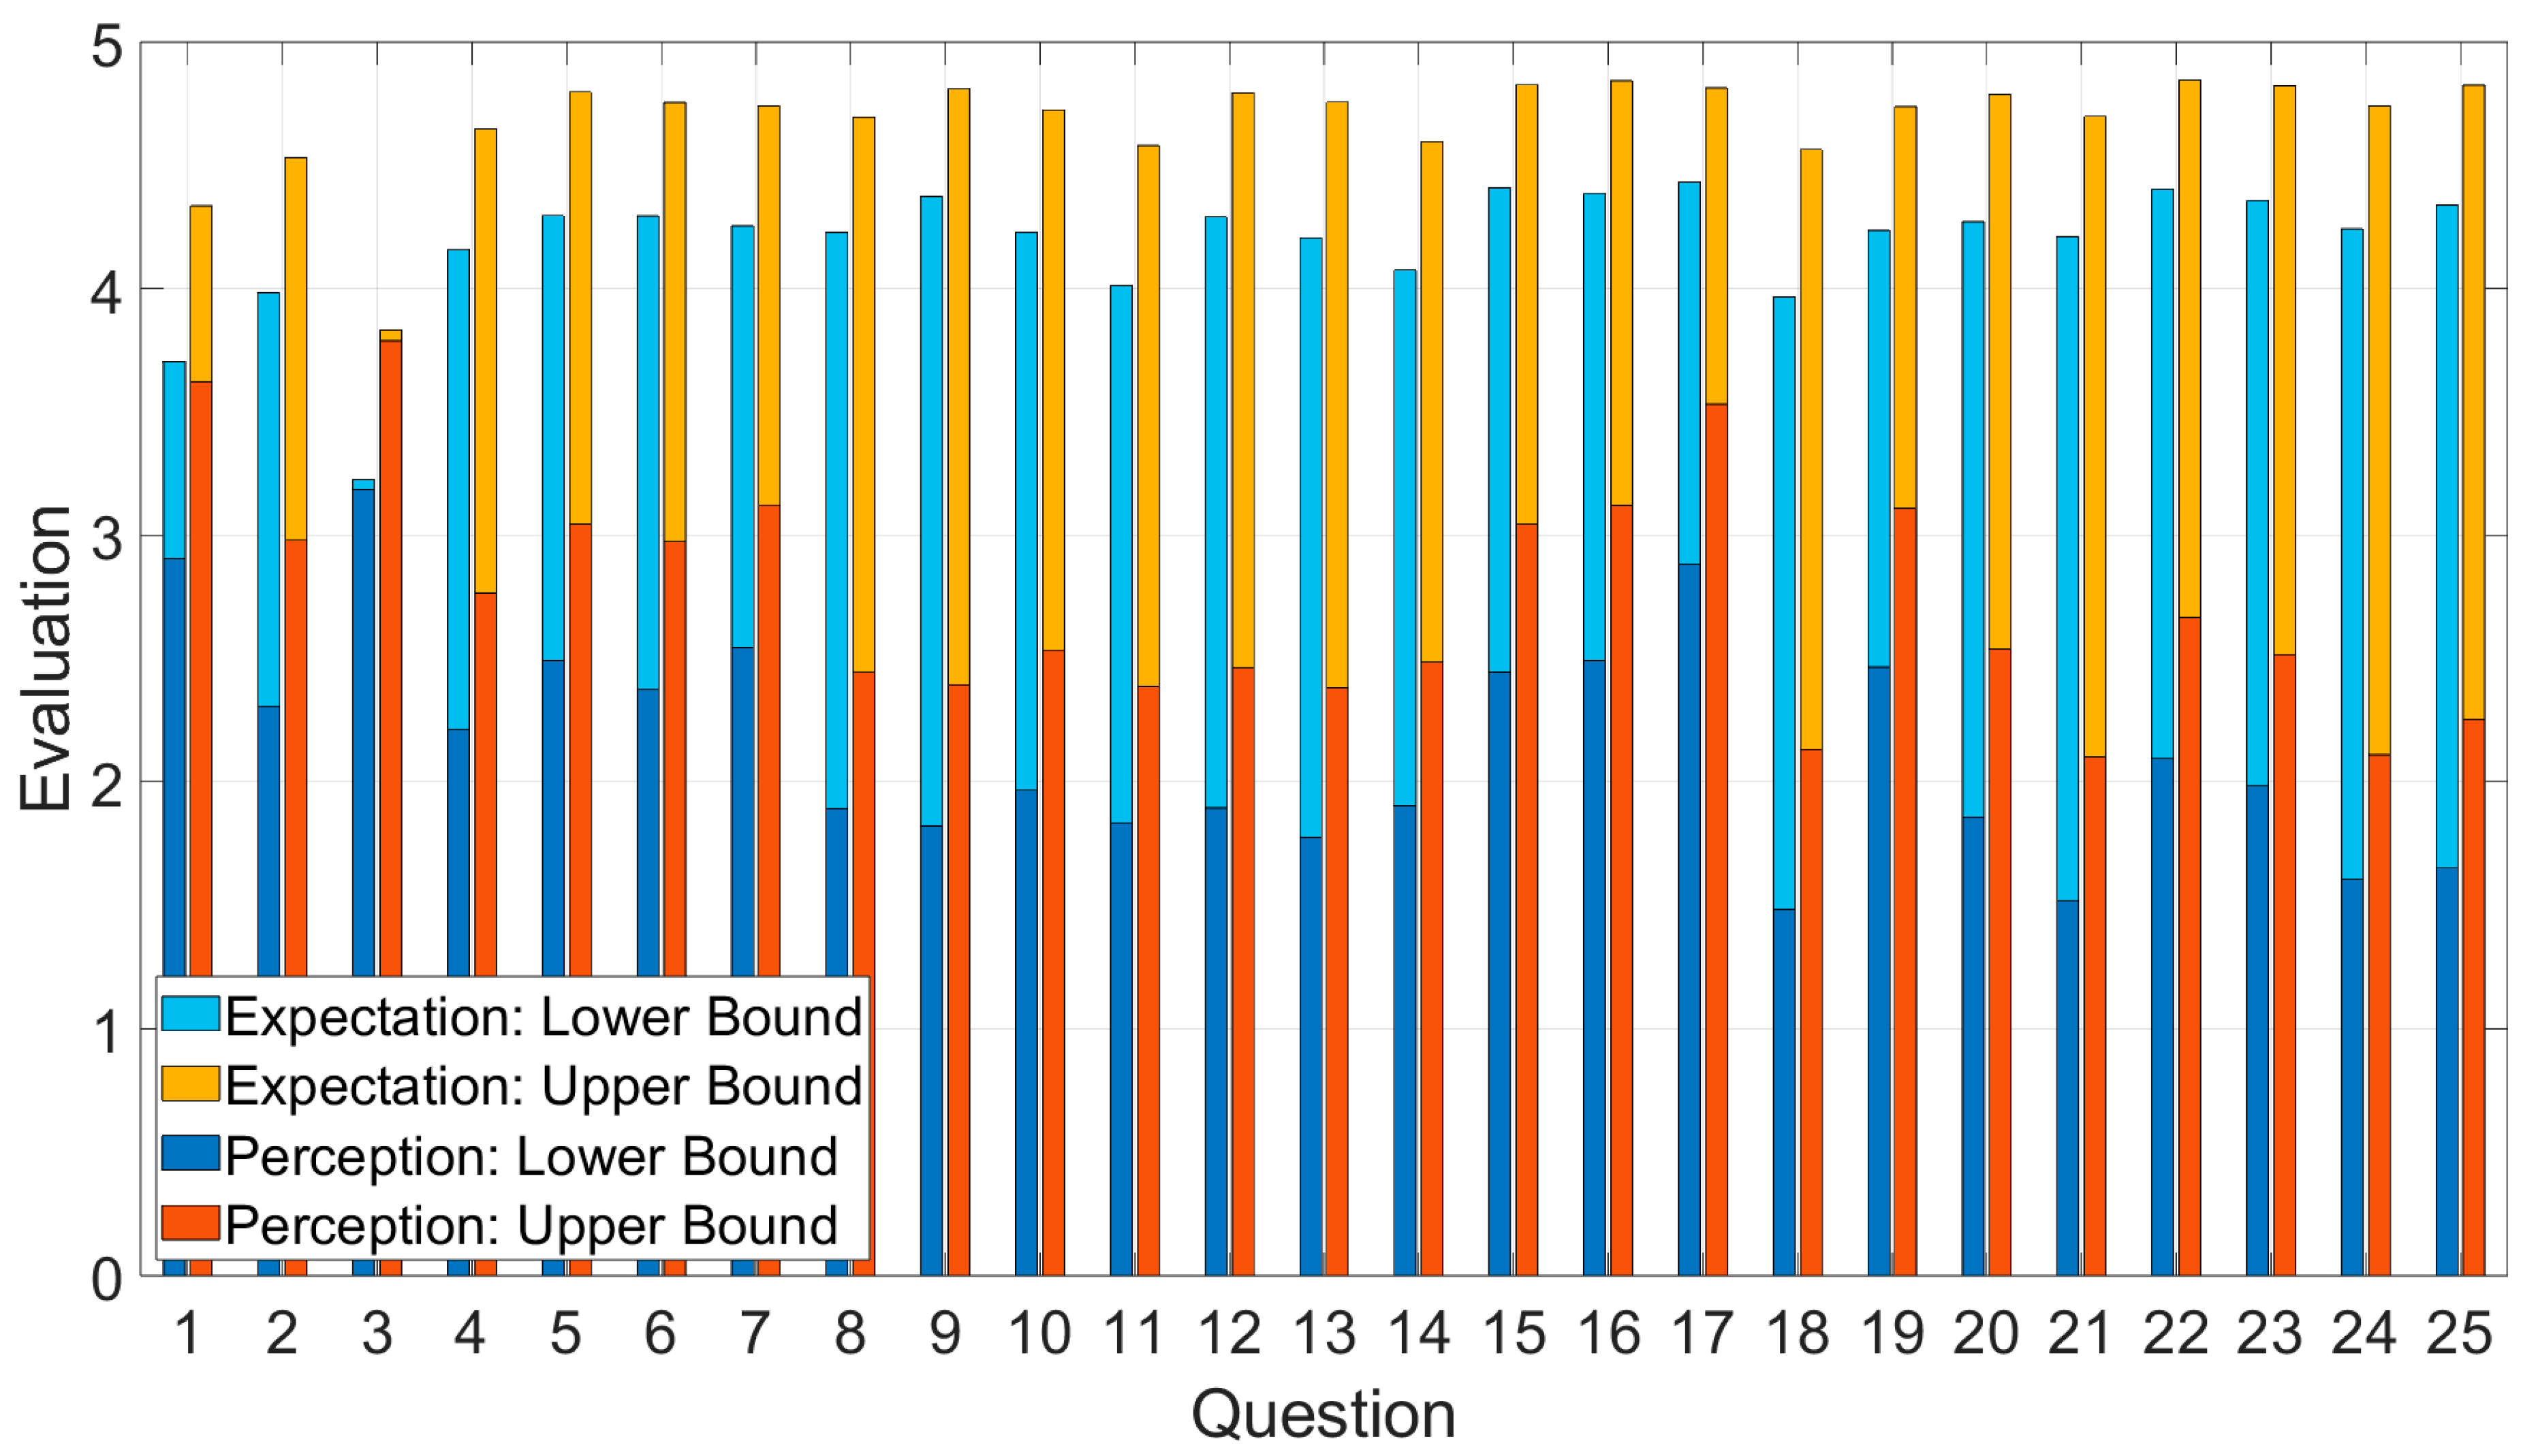
Table 2 presents the difference between the mean expectation and the mean perception for each question, scaled from 0 to 5. Table 3 presents the difference between the underestimation of expectation and overestimation of perception. For all questions—except Q3—the overestimated perception was consistently below the underestimated expectation (the minus signifies that perception was lower than expectation). These values confirmed the first case (C1) of our proposed framework, indicating that the provided services were unsatisfactory. Furthermore, the magnitude and consistency of the difference indicated that this was a well-established conclusion. Figure 8 shows the boundaries of both perception and expectation, along with mean perception and mean expectation, while Figure 9 shows them in superimposed bars, providing a visual representation of the difference between them.

5. Discussion

The captured perception of service performance consistently and significantly fell below expectations, thus deeming it unsatisfactory (C1). The magnitude and consistency of this difference indicated that this was a well-established conclusion. The only exception was Q3, which concerned the secretariat’s appropriate appearance, which was deemed adequate. Moreover, 13 of the 25 perceptions were found to be below half of their respective expectations (i.e., below their relative “base”).
With the exception of Q3, the difference between perception boundaries spanned from 1.48 to 3.62. This range was nearly double for the expectation, which spanned from 3.70 to 4.84. Additionally, expectation exhibited significantly more outliers than perception. This phenomenon suggested that students shared a relatively uniform perception of service performance, making perception appear more objective. By contrast, what is considered ideal performance (expectation) varies widely among students, making expectation appear more subjective.
Reliability was identified as the most important dimension, defined as the ability to deliver the promised service accurately. Responsiveness, referring to the willingness to assist customers and provide prompt service, was ranked as the second most important dimension. Finally, the least important was deemed to be tangibles, encompassing facilities, equipment, and personnel appearance. These findings aligned with those reported in similar studies (Brysland & Curry, 2001; Donnelly & Shiu, 1999; Donnelly et al., 1995; Smith et al., 2007). Zeithaml et al. (1990) observed a consistent ranking of service quality attributes, with reliability typically emerging as the most important dimension and tangibles as the least important.
Excluding a few isolated cases, neither age nor whether a student was raised in Athens significantly affected perception or expectation. However, females appeared to evaluate the provided service (perception) more critically than males, with males consistently assigning higher ratings across all affected variables, particularly in the upper endpoints of perception. Notably, no significant difference was detected between male and female expectations.
Furthermore, second-year students were observed to have higher expectations than third-year students, while no significant differences were recorded in their perceptions. Since age did not appear to influence the reduction in expectations, it may be inferred that this decline was not directly related to growing older but rather to department-wise or academic-wise experiences.
Regarding the questionnaire’s completion process, it is worth noting that explaining the concept of continuous scales proved more challenging for participants to understand compared with the traditional Likert scale. Additionally, it was observed that participants tended to follow uniform patterns when completing the survey, with the majority providing endpoints consistently ending in 0 s or 5 s throughout.
The use of continuous scales appeared to provide a more comprehensive assessment compared with traditional Likert scales. By evaluating services using the endpoints of these scales, instead of point values, the proposed modification of SERVQUAL enabled a detailed mapping of the evaluation area between underestimated and overestimated perceptions and expectations of service performance. This allowed a more accurate assessment compared with traditional Likert scales, which only captured an instantaneous mean value, which was, however, described by an inherent variability (Westland, 2022; Zeng et al., 2024). The proposed modification enabled the delineation of this variability. Furthermore, when the overestimated perception fell below the underestimated expectation (and vice versa), we had strong indications that they were strictly ordered. Conversely, when the overestimated perception overlapped with the underestimated expectation (and vice versa), we had strong indications they were relatively closed, even if their means appeared ordered—a limitation that would occur with a traditional Likert scale.
As a result, the proposed modification offers greater clarity in identifying the differences between perception and expectation. This enhanced precision offers more enriched insights into service performance and can potentially support the development of better-targeted corrective measures to address specific gaps. Additionally, this approach introduces a new perspective in evaluating tourism services, positioning itself as a valuable novel research tool. However, the approach does have its drawbacks. These include the challenge of explaining the concept of range-based answers to participants, as well as the increased workload it entails: since this method effectively combines two independent analyses—one for underestimation and one for overestimation—it requires additional time and effort to implement.
Using this modified version of the SERVQUAL quality measurement instrument, our study quantified deviations from the expected performance in the services provided by the secretariat of the Department of Tourism Management. This analysis serves as a foundational step toward identifying and implementing appropriate corrective measures. The findings highlight the potential for further research and broader application of this approach in any context where the SERVQUAL tool is utilized.

Research Limitations

The study relied exclusively on a quantitative approach, inherently limiting its scope to quantitative data. Future studies should incorporate a mixed-methods approach, which could enrich the analysis by including qualitative data (e.g., interviews) alongside the quantitative data (e.g., questionnaires), thereby providing deeper insights. For example, qualitative data might help identify specific issues within individual elements of each dimension that received a low rating. It has been suggested that service quality evaluation should not rely solely on fixed-choice questions. Instead, respondents should be given the opportunity to provide open-ended feedback on all aspects of the service they received (Philip & Hazlett, 2001). The study focused mainly on second-year students, given its pilot nature. To increase generalizability of the findings within the department, future studies should include students from all academic years. Furthermore, the study was limited to a single university department. To achieve broader generalizability, future research should encompass multiple departments and, ideally, other universities as well. These studies should also account for institutional, cultural, or other contextual factors that could potentially affect students’ expectations and perceptions, expanding the list of demographic variables in order to take them into account. Additionally, thorough attention should be paid to ensuring that the phrasing of questions is neutral and independent of such factors, among students, to minimize bias.
Author Contributions

Conceptualization, I.A.N. and V.P.G.; methodology, V.P.G. and I.A.N.; software, V.P.G.; validation, I.A.N.; formal analysis, V.P.G.; investigation, V.P.G. and I.A.N.; resources, I.A.N.; data curation, V.P.G.; writing—original draft preparation, V.P.G.; writing—review and editing, V.P.G., I.A.N. and A.P.; visualization, V.P.G. and I.A.N. All authors have read and agreed to the published version of the manuscript.

Funding

This research received no external funding.

Institutional Review Board Statement

Ethical review and approval were waived for this study due to the University of Patras Code of Ethics and Conduct for Scientific Research (https://ehde.upatras.gr/wp-content/uploads/2021/06/Kodikas-Hthikis-kai-Deontologias-PP.pdf) (accessed on 20 January 2025).

Informed Consent Statement

Informed consent was obtained from all subjects involved in the study.

Data Availability Statement

The original contributions presented in this study are included in the article. Further inquiries can be directed to the corresponding author.

Conflicts of Interest

The authors declare no conflicts of interest.

Appendix A

Table A1. Shapiro–Wilk normality test (for lower endpoints).
VariableS–W Statisticp-ValueVariableS–W Statisticp-ValueVariableS–W Statisticp-Value
V50.9700.022V220.922<0.001V390.909<0.001
V60.9780.092V230.9750.046V400.856<0.001
V70.943<0.001V240.9610.005V410.834<0.001
V80.9700.019V250.921<0.001V420.872<0.001
V90.9780.095V260.947<0.001V430.927<0.001
V100.9700.020V270.942<0.001V440.882<0.001
V110.9760.063V280.918<0.001V450.881<0.001
V120.9520.001V290.922<0.001V460.826<0.001
V130.946<0.001V300.912<0.001V470.834<0.001
V140.9640.007V310.909<0.001V480.918<0.001
V150.949<0.001V320.9550.002V490.891<0.001
V160.948<0.001V330.792<0.001V500.812<0.001
V170.9600.003V340.785<0.001V510.885<0.001
V180.9640.007V350.773<0.001V520.732<0.001
V190.945<0.001V360.802<0.001V530.706<0.001
V200.9700.019V370.793<0.001V540.721<0.001
V210.9560.002V380.842<0.001
Table A2. Mann–Whitney U test for V1: gender (for lower endpoints).
VariableM–W Statisticp-ValueVariableM–W Statisticp-ValueVariableM–W Statisticp-Value
V51501.0000.694V221366.5000.142V391557.5000.497
V61532.0000.737V231496.5000.535V401352.5000.069
V71194.5000.031V241265.0000.042V411548.5000.464
V81508.0000.638V251296.5000.063V421532.0000.412
V91342.0000.110V261247.5000.033V431638.0000.820
V101584.5000.808V271380.0000.166V441480.5000.322
V111297.5000.065V281366.5000.143V451495.5000.305
V121289.0000.107V291585.5000.945V461438.0000.178
V131306.0000.072V301556.5000.496V471510.0000.351
V141477.0000.398V311594.5000.639V481379.5000.095
V151199.0000.016V321439.5000.257V491537.5000.430
V161166.0000.013V331595.0000.639V501486.5000.284
V171256.5000.038V341497.5000.308V511655.5000.895
V181262.5000.062V351625.5000.764V521623.0000.754
V191081.5000.002V361619.5000.737V531490.5000.290
V201073.0000.002V371472.0000.250V541528.5000.468
V211033.0000.001V381601.0000.666
Table A3. Kruskal–Wallis H test for V2: age (for lower endpoints).
VariableK–W Statisticp-ValueVariableK–W Statisticp-ValueVariableK–W Statisticp-Value
V50.0510.975V220.2660.875V390.3830.826
V61.8280.401V230.6290.730V400.1010.951
V70.7140.700V240.1830.913V410.0260.987
V81.6920.429V251.3650.505V420.6420.725
V94.5610.102V260.5610.756V431.6010.449
V103.5930.166V271.6820.431V440.3190.853
V111.8320.400V286.3570.042V450.3900.823
V123.3460.188V292.0610.357V460.5370.764
V131.5480.461V300.0770.962V472.7120.258
V140.6600.719V310.9060.636V481.4510.484
V151.4540.483V320.2590.879V491.1990.549
V160.6750.714V330.4450.800V501.4210.491
V170.3250.850V340.1800.914V510.2090.901
V181.1940.551V350.0960.953V520.5250.769
V191.2490.536V360.3330.847V531.1330.568
V202.2640.322V370.9830.612V540.0930.954
V210.8420.656V380.2090.901
Table A4. Mann–Whitney U test for V3: year of study (for lower endpoints).
VariableM–W Statisticp-ValueVariableM–W Statisticp-ValueVariableM–W Statisticp-Value
V5945.5000.484V22813.0000.064V39882.0000.104
V6899.5000.257V23919.0000.323V40898.5000.134
V7937.5000.702V24923.0000.295V41806.5000.029
V8902.0000.267V25894.5000.209V42869.0000.086
V9834.5000.092V261054.5000.930V43982.0000.373
V10866.0000.145V27755.5000.024V44793.0000.028
V11864.0000.140V28660.5000.003V45833.0000.048
V12945.0000.602V29799.5000.073V46657.0000.001
V13942.0000.365V30861.0000.077V47979.0000.363
V14913.5000.265V31969.0000.324V48873.5000.093
V15786.0000.041V32769.5000.020V49625.500<0.001
V16839.0000.161V33833.5000.049V50865.5000.083
V17910.5000.255V34819.5000.038V51777.5000.017
V18871.0000.180V35988.5000.394V52853.0000.067
V191031.0000.796V361070.5000.796V53900.5000.134
V20844.5000.105V37851.0000.067V54696.0000.006
V21993.0000.658V38895.5000.131
Table A5. Mann–Whitney U test for V4: raised in Athens (for lower endpoints).
VariableM–W Statisticp-ValueVariableM–W Statisticp-ValueVariableM–W Statisticp-Value
V51323.0000.483V221448.0000.768V391481.0000.751
V61297.0000.338V231338.0000.402V401517.0000.915
V71365.5000.567V241460.0000.822V411410.0000.464
V81282.0000.297V251356.0000.405V421465.5000.684
V91293.0000.232V261427.5000.679V431523.0000.943
V101370.5000.456V271365.0000.437V441513.5000.984
V111365.5000.438V281330.5000.327V451380.5000.367
V121391.5000.875V291313.0000.325V461437.5000.568
V131310.5000.273V301441.0000.585V471417.5000.498
V141286.0000.215V311512.5000.894V481438.5000.574
V151223.5000.109V321500.0000.922V491332.5000.239
V161232.0000.144V331535.5001.000V501425.0000.522
V171382.0000.497V341535.0000.998V511357.5000.298
V181397.0000.717V351534.5000.995V521520.0000.928
V191435.0000.712V361390.0000.393V531384.0000.376
V201414.5000.624V371526.5000.958V541385.5000.437
V211318.5000.341V381355.0000.298
Table A6. Statistically significant differences by V1: gender (for lower endpoints).
VariableGenderNMean RankSum of RanksVariableGenderNMean RankSum of Ranks
V7Male4367.222890.5V20Male4472.113173.0
Female7353.363895.5 Female7452.03848.0
Total116 Total118
V15Male4469.253047.0V21Male4472.023169.0
Female7453.73974.0 Female7351.153734.0
Total118 Total117
V16Male4469.03036.0V24Male4467.752981.0
Female7352.973867.0 Female7454.594040.0
Total117 Total118
V17Male4467.942989.5V26Male4468.152998.5
Female7454.484031.5 Female7454.364022.5
Total118 Total118
V19Male4471.923164.5
Female7452.113856.5
Total118
Table A7. Statistically significant differences by V3: year of study (for lower endpoints).
VariableYearNMean RankSum of RanksVariableYearNMean RankSum of Ranks
V322nd Year7857.634495.5V452nd Year7957.464539.0
3rd Year2841.981175.5 3rd Year2844.251239.0
Total106 Total107
V332nd Year7957.454538.5V462nd Year7959.684715.0
3rd Year2844.271239.5 3rd Year2837.961063.0
Total107 Total107
V342nd Year7957.634552.5V492nd Year7960.084746.5
3rd Year2843.771225.5 3rd Year2836.841031.5
Total107 Total107
V412nd Year7957.794565.5V512nd Year7958.164594.5
3rd Year2843.31212.5 3rd Year2842.271183.5
Total107 Total107
V442nd Year7857.334472.0V542nd Year7958.194597.0
3rd Year2842.821199.0 3rd Year2739.781074.0
Total106 Total106
Table A8. Shapiro–Wilk normality test (for upper endpoints).
VariableS–W Statisticp-ValueVariableS–W Statisticp-ValueVariableS–W Statisticp-Value
V50.9570.002V220.9560.002V390.683<0.001
V60.9680.015V230.9700.020V400.696<0.001
V70.903<0.001V240.9700.022V410.488<0.001
V80.9690.017V250.9550.002V420.580<0.001
V90.9670.011V260.9550.002V430.748<0.001
V100.9580.003V270.948<0.001V440.600<0.001
V110.9580.003V280.945<0.001V450.557<0.001
V120.9680.013V290.943<0.001V460.512<0.001
V130.9560.002V300.808<0.001V470.614<0.001
V140.9700.019V310.737<0.001V480.712<0.001
V150.9600.004V320.895<0.001V490.615<0.001
V160.9540.001V330.572<0.001V500.545<0.001
V170.9690.017V340.467<0.001V510.551<0.001
V180.9620.005V350.494<0.001V520.548<0.001
V190.929<0.001V360.521<0.001V530.465<0.001
V200.9650.008V370.524<0.001V540.516<0.001
V210.916<0.001V380.505<0.001
Table A9. Mann–Whitney U test for V1: gender (for upper endpoints).
VariableM–W Statisticp-ValueVariableM–W Statisticp-ValueVariableM–W Statisticp-Value
V51464.0000.544V221168.0000.010V391575.0000.526
V61519.0000.682V231482.0000.483V401441.0000.169
V71152.5000.017V241221.5000.023V411664.0000.922
V81506.5000.632V251294.5000.063V421656.5000.884
V91276.5000.050V261263.0000.042V431657.0000.897
V101513.5000.523V271347.0000.117V441510.0000.327
V111251.5000.036V281358.5000.133V451545.0000.357
V121249.0000.066V291437.5000.363V461467.0000.146
V131248.5000.034V301508.5000.336V471532.5000.379
V141397.5000.198V311508.5000.319V481411.0000.099
V151151.0000.008V321467.0000.327V491579.5000.521
V161151.0000.010V331636.5000.795V501432.5000.114
V171215.0000.021V341608.0000.639V511553.5000.407
V181225.0000.038V351655.5000.877V521659.5000.897
V191078.5000.002V361660.0000.899V531595.5000.596
V201062.0000.002V371562.0000.465V541624.0000.825
V21935.000<0.001V381590.5000.540
Table A10. Kruskal–Wallis H test for V2: age (for upper endpoints).
VariableK–W Statisticp-ValueVariableK–W Statisticp-ValueVariableK–W Statisticp-Value
V50.2920.864V220.0660.968V390.1680.920
V62.0150.365V231.4650.481V402.1170.347
V71.0110.603V240.0610.970V410.2430.885
V82.8180.244V251.6580.436V420.1390.933
V94.7950.091V260.5490.760V430.6880.709
V102.2160.330V271.6500.438V440.5230.770
V113.1590.206V285.5270.063V451.9740.373
V123.0020.223V290.9810.612V462.5900.274
V131.1600.560V300.2030.904V472.6810.262
V140.7300.694V310.6390.727V480.2440.885
V151.7320.421V320.1910.909V492.4570.293
V160.4010.818V331.1010.577V502.0960.351
V170.5370.765V341.0670.586V512.5140.285
V181.5380.464V350.7980.671V522.0430.360
V191.1820.554V361.0610.588V531.9250.382
V201.5680.457V370.3160.854V544.1910.123
V210.8840.643V380.2480.883
Table A11. Mann–Whitney U test for V3: year of study (for upper endpoints).
VariableM–W Statisticp-ValueVariableM–W Statisticp-ValueVariableM–W Statisticp-Value
V5957.0000.539V22821.0000.074V39927.0000.156
V6892.5000.236V23933.0000.377V40899.0000.123
V7912.0000.564V24983.0000.544V41898.0000.087
V8929.5000.364V25966.0000.465V42868.5000.049
V9826.5000.081V261062.0000.974V43984.0000.356
V10911.5000.260V27736.0000.016V44934.5000.177
V11875.0000.163V28672.5000.004V45934.5000.132
V12960.0000.685V29834.5000.128V46862.0000.036
V13960.0000.438V30904.0000.140V471005.5000.436
V14946.5000.383V311070.5000.788V48882.5000.079
V15781.5000.038V32854.5000.086V49737.0000.002
V16892.5000.317V331027.5000.541V50893.5000.086
V17935.0000.339V341033.5000.547V51771.5000.005
V18905.0000.276V351097.5000.943V52881.5000.060
V191063.5000.983V361031.5000.533V53974.5000.289
V20871.5000.156V37979.5000.313V54684.000<0.001
V211006.0000.729V38925.0000.116
Table A12. Mann–Whitney U test for V4: raised in Athens (for upper endpoints).
VariableM–W Statisticp-ValueVariableM–W Statisticp-ValueVariableM–W Statisticp-Value
V51306.5000.423V221423.0000.660V391503.0000.837
V61341.0000.486V231391.5000.602V401361.5000.296
V71280.0000.280V241400.5000.568V411467.0000.645
V81253.0000.225V251405.5000.588V421330.5000.168
V91286.5000.218V261403.5000.580V431416.0000.466
V101384.0000.505V271395.5000.549V441509.0000.956
V111396.0000.551V281305.5000.262V451425.5000.435
V121413.5000.981V291371.5000.524V461467.0000.627
V131273.0000.189V301506.5000.865V471448.0000.585
V141302.5000.254V311513.0000.891V481406.5000.409
V151259.5000.164V321474.5000.806V491361.5000.245
V161258.0000.192V331513.0000.886V501496.0000.793
V171437.5000.723V341496.5000.789V511212.0000.027
V181422.5000.833V351499.0000.803V521392.0000.326
V191412.0000.615V361482.0000.712V531492.5000.777
V201461.5000.829V371440.0000.536V541484.5000.817
V211252.5000.180V381488.5000.736
Table A13. Statistically significant differences by V1: gender (for upper endpoints).
VariableGenderNMean RankSum of RanksVariableGenderNMean RankSum of Ranks
V7Male4368.202932.50V18Male4367.512903.00
Female7352.793853.50 Female7454.054000.00
Total116 Total117
V9Male4467.492969.50V19Male4471.993167.50
Female7454.754051.50 Female7452.073853.50
Total118 Total118
V11Male4468.062994.50V20Male4472.363184.00
Female7454.414026.50 Female7451.853837.00
Total118 Total118
V13Male4468.132997.50V21Male4474.253267.00
Female7454.374023.50 Female7349.813636.00
Total118 Total117
V15Male4470.343095.00V22Male4469.953078.00
Female7453.053926.00 Female7453.283943.00
Total118 Total118
V16Male4469.343051.00V24Male4468.743024.50
Female7352.773852.00 Female7454.013996.50
Total117 Total118
V17Male4468.893031.00V26Male4467.802983.00
Female7453.923990.00 Female7454.574038.00
Total118 Total118
Table A14. Statistically significant differences by V3: year of study (for upper endpoints).
VariableYearNMean RankSum of RanksVariableYearNMean RankSum of Ranks
V422nd Year7957.014503.50V512nd Year7958.234600.50
3rd Year2845.521274.50 3rd Year2842.051177.50
Total107 Total107
V462nd Year7957.094510.00V542nd Year7958.344609.00
3rd Year2845.291268.00 3rd Year2739.331062.00
Total107 Total106
V492nd Year7958.674635.00
3rd Year2840.821143.00

Appendix B

Appendix B.1. Questionnaire

Section A: Demographic Information
QuestionAnswer
1. Gender:
2. Age:
3. Year of Study:
4. Were you raised in Athens?☐ Yes ☐ No
Section B: Perception (of Performance) Measurement
QuestionFromTo
5. The secretariat’s facilities are adequate.
6. The secretariat is equipped with modern technology.
7. The secretariat staff maintain an appropriate appearance.
8. The printed information provided by the secretariat is comprehensive.
9. The printed information provided by the secretariat is clear and easy to understand.
10. The electronic information provided by the secretariat is comprehensive.
11. The electronic information provided by the secretariat is clear and easy to understand.
12. The secretariat delivers its services to students on time.
13. When I face a problem, the secretariat staff show interest in resolving it.
14. The secretariat provides its services correctly the first time.
15. The secretariat staff provide immediate service.
16. The secretariat staff are always willing to assist me.
17. The secretariat staff respond promptly to students’ requests.
18. The secretariat staff inform me of the exact time of service delivery.
19. The secretariat staff are polite.
20. The secretariat staff have the necessary knowledge to provide reliable and accurate information to students.
21. The secretariat staff are honest with me.
22. Students in the Tourism Management department provide positive feedback about the secretariat.
23. The secretariat has the necessary technological equipment to provide its services.
24. The secretariat understands the needs of each student.
25. The secretariat’s working hours are convenient for the needs and schedules of students.
26. Face-to-face (in-person) interaction with the secretariat is easy.
27. Electronic communication (remote) with the secretariat is easy.
28. Telephone communication (remote) with the secretariat is easy.
29. In case of an issue on the secretariat’s side timely notification is provided.
Section C: Expectation (of Performance) Measurement
QuestionFromTo
30. An ideal secretariat should have adequate facilities.
31. An ideal secretariat should be equipped with modern technology.
32. The staff of an ideal secretariat should maintain an appropriate appearance.
33. The printed information provided by an ideal secretariat should be comprehensive.
34. The printed information provided by an ideal secretariat should be clear and easy to understand.
35. The electronic information provided by an ideal secretariat should be comprehensive.
36. The electronic information provided by an ideal secretariat should be clear and easy to understand.
37. An ideal secretariat should deliver its services to students on time.
38. When I face a problem, the staff of an ideal secretariat should show interest in resolving it.
39. The services of an ideal secretariat should be provided correctly the first time.
40. The staff of an ideal secretariat should provide immediate service.
41. The staff of an ideal secretariat should always be willing to assist me.
42. The staff of an ideal secretariat should respond promptly to students’ requests.
43. The staff of an ideal secretariat should inform me of the exact time of service delivery.
44. The staff of an ideal secretariat should be polite.
45. The staff of an ideal secretariat should have the necessary knowledge to provide reliable and accurate information to students.
46. The staff of an ideal secretariat should be honest with me.
47. The feedback from students about an ideal secretariat should be positive.
48. An ideal secretariat should have the necessary technological equipment required to provide its services.
49. An ideal secretariat should understand the needs of each student.
50. The working hours of an ideal secretariat should be convenient for the needs and schedules of students.
51. Face-to-face (in-person) interaction with an ideal secretariat should be easy.
52. Electronic communication (remote) with an ideal secretariat should be easy.
53. Telephone communication (remote) with an ideal secretariat should be easy.
54. In case of an issue on the ideal secretariat’s side, timely notification should be provided.
Section D1: Dimension Significance Measurement
#QuestionPoints
55.The completeness and adequacy of the secretariat’s facilities, equipment, staff, and informational materials.
56.The secretariat’s ability to provide services accurately and reliably.
57.The willingness of the secretariat staff to assist students and provide prompt service.
58.The knowledge and politeness of the secretariat staff, as well as their ability to inspire trust and honesty.
59.The interest and personalized attention that the secretariat provides to students.
Total Points:100
Section D2: Dimension Significance Check
Question#
60. Which of the above five dimensions is the most important to you?
61. Which of the above five dimensions is the second most important to you?
62. Which of the above five dimensions is the least important to you?

References

  1. Aragonés-Beltrán, P., Poveda-Bautista, R., & Jiménez-Sáez, F. (2017). An in-depth analysis of a TTO’s objectives alignment within the university strategy: An ANP-based approach. Journal of Engineering and Technology Management, 44, 19–43. [Google Scholar] [CrossRef]
  2. Asubonteng, P., McCleary, K. J., & Swan, J. E. (1996). SERVQUAL revisited: A critical review of service quality. Journal of Services Marketing, 10, 62–81. [Google Scholar] [CrossRef]
  3. Ball, S. (2008). Performativity, privatization, professionals and the state. In B. Cunningham (Ed.), Exploring professionalism. Institute of Education, University of London. [Google Scholar]
  4. Beddowes, P., Gulliford, S., Knight, M., & Saunders, I. (1988). Service success! Who is getting there? Operations Management Association, University of Nottingham. [Google Scholar]
  5. Benneworth, P., Pinheiro, R., & Sánchez-Barrioluengo, M. (2016). One size does not fit all! New perspectives on the university in the social knowledge economy. Science and Public Policy, 43(6), 731–735. [Google Scholar] [CrossRef]
  6. Bortagaray, I. (2009). Bridging university and society in Uruguay: Perceptions and expectations. Science and Public Policy, 36(2), 115–119. [Google Scholar] [CrossRef]
  7. Bramley, P. (2003). Evaluating training (2nd ed.). Chartered Institute of Personnel and Development. [Google Scholar]
  8. Broady-Preston, J., & Preston, H. (1999). Demonstrating quality in academic libraries. New Library World, 100(3), 124–129. [Google Scholar] [CrossRef]
  9. Brysland, A., & Curry, A. (2001). Service improvements in public services using SERVQUAL. Managing Service Quality, 11(6), 389–401. [Google Scholar] [CrossRef]
  10. Burrows, A., & Harvey, L. (1992, April 6–8). Defining quality in higher education: The stakeholder approach [Conference session]. AETT Conference on ‘Quality in Education’ (pp. 4.6–4.8), University of York, York, UK. [Google Scholar]
  11. Callagher, L., Horst, M., & Husted, K. (2015). Exploring societal responses towards managerial prerogative in entrepreneurial universities. International Journal of Learning and Change, 8(1), 64–82. [Google Scholar] [CrossRef]
  12. Cheng, Y. C. (1995). School education quality: Conceptualization, monitoring, and enhancement. In P. K. Siu, & P. Tam (Eds.), Quality in education: Insights from different perspectives (pp. 123–147). The Hong Kong Educational Research Association. [Google Scholar]
  13. Coxe, W. (1990). Marketing architectural and engineering services (2nd ed.). Krieger Publishing Company. [Google Scholar]
  14. Crosby, P. B. (1979). Quality is free: The art of making quality certain. New American Library. [Google Scholar]
  15. Darling-Hammond, L. (1994). Performance-based assessment and educational equity. Harvard Educational Review, 64(1), 5–30. [Google Scholar] [CrossRef]
  16. De La Torre, E. M., Agasisti, T., & Perez-Esparrells, C. (2017). The relevance of knowledge transfer for universities’ efficiency scores: An empirical approximation on the Spanish public higher education system. Research Evaluation, 26(3), 211–229. [Google Scholar] [CrossRef]
  17. Diamond, R. M., & Adam, B. E. (2000). The disciplines speak II: More statements on rewarding the scholarly, professional, and creative work of faculty. American Association for Higher Education. [Google Scholar]
  18. Di Berardino, D., & Corsi, C. (2018). A quality evaluation approach to disclosing third mission activities and intellectual capital in Italian universities. Journal of Intellectual Capital, 19(1), 178–201. [Google Scholar] [CrossRef]
  19. Donnelly, M., & Shiu, E. (1999). Assessing service quality and its link with value for money in a local authority’s housing repair service using the SERVQUAL approach. Total Quality Management, 10(4–5), 498–506. [Google Scholar] [CrossRef]
  20. Donnelly, M., Wisniewski, M., Dalrymple, J. F., & Curry, A. C. (1995). Measuring service quality in local government: The SERVQUAL approach. International Journal of Public Sector Management, 8(7), 15–20. [Google Scholar] [CrossRef]
  21. Etzkowitz, H. (2003). Research groups as ‘quasi-firms’: The invention of the entrepreneurial university. Research Policy, 32(1), 109–121. [Google Scholar] [CrossRef]
  22. Farrell, C., Barrus, A., Operman, G., & DeGeorge, G. (1991). Quality imperative. Business Week, 10, 132–137. [Google Scholar]
  23. Feigenbaum, A. (1991). Quality control (3rd ed.). McGraw-Hill. [Google Scholar]
  24. Fuller, B. (1986). Defining school quality. In The contribution of social science to educational policy and practice: 1965–1985, 1986a (pp. 33–70). McCutchan. [Google Scholar]
  25. Galloway, L. (1998). Quality perceptions of internal and external customers: A case study in educational administration. The TQM Magazine, 10(1), 20–26. [Google Scholar] [CrossRef]
  26. Gibson, A. (1986). Inspecting education. In G. Moodie (Ed.), Standards and criteria in higher education (pp. 128–135). SRHE. [Google Scholar]
  27. Gronroos, C. (1982). Strategic management and marketing in the service sector. Swedish School of Economics and Business Administration. [Google Scholar]
  28. Harvey, L., & Green, D. (1993). Defining quality. Assessment & Evaluation in Higher Education, 18(1), 9–34. [Google Scholar]
  29. Heywood-Farmer, J. (1988). A conceptual model of service quality. International Journal of Operations & Production Management, 8(6), 19–29. [Google Scholar]
  30. Hill, F. M. (1995). Managing service quality in higher education: The role of the student as primary consumer. Quality Assurance in Education, 3(3), 10–21. [Google Scholar] [CrossRef]
  31. Hirst, P. H., & Peters, R. S. (1972). The logic of education. Philosophical Books, 13(1), 9–11. [Google Scholar] [CrossRef]
  32. Hughes, P. (Ed.). (1988). The challenge of identifying and marketing quality in education. The Australian Association of Senior Educational Administrators. [Google Scholar]
  33. IBM Corp. (2023). IBM SPSS statistics for windows (Version 29.0, IBM Corporation). Available online: www.ibm.com (accessed on 20 January 2025).
  34. Ismail, A., Ali, N., & Abdullah, M. (2009). Perceive value as a moderator on the relationship between service quality features and customer satisfaction. International Journal of Business and Management, 4(2), 122–133. [Google Scholar] [CrossRef]
  35. Lewis, R. C., & Booms, B. H. (1983). The marketing aspects of service quality. In L. L. Berry, G. Shostack, & G. Upah (Eds.), Emerging perspectives in service marketing (pp. 99–107). American Marketing Association. [Google Scholar]
  36. Mariani, G., Carlesi, A., & Scarfò, A. (2018). Academic spinoffs as a value driver for intellectual capital. The case of the University of Pisa. Journal of Intellectual Capital, 19(1), 202–226. [Google Scholar] [CrossRef]
  37. Microsoft Corporation. (2018). Microsoft Excel. Available online: https://office.microsoft.com/excel (accessed on 20 January 2025).
  38. Moore, C. D. (1987). Outclass the competition with service distinction. Mortgage Banking, 47(11). [Google Scholar]
  39. Mora, J. G., Ferreira, C., Vidal, J., & Vieira, M. J. (2015). Higher education in Albania: Developing third mission activities. Tertiary Education and Management, 21(1), 29–40. [Google Scholar] [CrossRef]
  40. Nash, C. A. (1988). A question of service: Action pack, business management programme, hotel and catering industry training board. National Consumer Council. [Google Scholar]
  41. Noyé, D., & Piveteau, J. (2018). Le guide pratique du formateur (2nd ed.). Eyrolles. [Google Scholar]
  42. Nur-E-Alam Siddique, M., Momena, A. M., & Al Masum, A. (2013). Service quality of five star hotels in Bangladesh: An empirical assessment. Asian Business Review, 2(3), 40–45. [Google Scholar]
  43. Parasuraman, A., Zeithaml, V., & Berry, L. (1985). A Conceptual model of service quality and its implications for future research. Journal of Marketing, 49, 41–50. [Google Scholar] [CrossRef]
  44. Parasuraman, A., Zeithaml, V., & Berry, L. (1988). SERVQUAL: A multiple-item scale for measuring consumer perceptions of service quality. Journal of Retailing, 64(1), 12–40. [Google Scholar]
  45. Philip, G., & Hazlett, S. (1997). The measurement of service quality: A new ‘P-C-P’ attributes model. International Journal of Quality & Reliability Management, 14(3), 260–286. [Google Scholar]
  46. Philip, G., & Hazlett, S. (2001). Evaluating the service quality of information services using a new ‘P-C-P’ attributes model. International Journal of Quality & Reliability Management, 18(9), 900–916. [Google Scholar]
  47. Puri, G., & Singh, K. (2018). The role of service quality and customer satisfaction in tourism industry: A review of SERVQUAL model. International Journal of Research and Analytical Reviews, 5(4), 745–751. [Google Scholar]
  48. Qolipour, M., Torabipour, A., Faraji Khiavi, F., & Saki Malehi, A. (2018). Assessing medical tourism services quality using SERVQUAL model: A patient’s perspective. Iran Journal of Public Health, 47(1), 103–110. [Google Scholar]
  49. Robinson, S. (1999). Measuring service quality: Current thinking and future requirements. Marketing Intelligence & Planning, 17(1), 21–32. [Google Scholar]
  50. Robledo, M. A. (2001). Measuring and managing service quality: Integrating customer expectations. Managing Service Quality: An International Journal, 11(1), 22–31. [Google Scholar] [CrossRef]
  51. Rothaermel, F. T., Agung, S. D., & Jiang, L. (2007). University entrepreneurship: A taxonomy of the literature. Industrial and Corporate Change, 16(4), 691–791. [Google Scholar] [CrossRef]
  52. Sasser, W., Olsen, R., & Wyckoff, D. (1978). Management of service operations: Text and cases. Allyn & Bacon. [Google Scholar]
  53. Schuller, T. (Ed.). (1991). The future of higher education. Open University Press/SRHE. [Google Scholar]
  54. Smith, G., Smith, A., & Clarke, A. (2007). Evaluating service quality in universities: A service department perspective. Quality Assurance in Education, 15(3), 334–351. [Google Scholar] [CrossRef]
  55. Smith, R. A., & Houston, M. J. (1983). Script-based evaluations of satisfaction with Services. In L. Berry, G. L. Shostack, & G. D. Upah (Eds.), Emerging perspectives on services marketing (pp. 59–62). American Marketing. [Google Scholar]
  56. Vlasceanu, L., Grunberg, L., & Parlea, D. (2004). Quality assurance and accreditation: A glossary of basic terms and definitions. UNESCO-CEPES. [Google Scholar]
  57. Waugh, R. F. (2002). Academic staff perceptions of administrative quality at universities. Journal of Educational Administration 40(2), 172–188. [Google Scholar] [CrossRef]
  58. Westland, J. C. (2022). Information loss and bias in likert survey responses. PLoS ONE, 17(7), e0271949. [Google Scholar] [CrossRef]
  59. Whicher, D., & Wu, A. W. (2015). Ethics review of survey research: A mandatory requirement for publication? The Patient—Patient-Centered Outcomes Research, 8, 477–482. [Google Scholar] [CrossRef]
  60. Wisniewski, M. (2001). Using SERVQUAL to assess customer satisfaction with public sector services. Managing Service Quality: An International Journal, 11(6), 380–388. [Google Scholar] [CrossRef]
  61. World Medical Association. (2024). WMA Declaration of Helsinki—Ethical principles for medical research involving human participants. Available online: www.wma.net/policies-post/wma-declaration-of-helsinki/ (accessed on 20 January 2025).
  62. Zeithaml, V. A., Parasuraman, A., & Berry, L. L. (1990). Delivering quality service: Balancing customer perceptions. Free Press. [Google Scholar]
  63. Zeng, B., Jeon, M., & Wen, H. (2024). How does item wording affect participants’ responses in Likert scale? Evidence from IRT analysis. Frontiers in Psychology, 15, 1304870. [Google Scholar] [CrossRef]
Figure 1. Parasuraman et al.’s proposed service quality discrepancies (gaps) (Parasuraman et al., 1988).
Tourismhosp 06 00015 g001
Figure 2. Demographic variables: gender, age, year of study, and upbringing in Athens.
Tourismhosp 06 00015 g002
Figure 3. Significance level: first most important, second most important, and least important dimension.
Tourismhosp 06 00015 g003
Figure 4. Boxplots of variables 5–29 (perception) and variables 30–54 (expectation): underestimation.
Tourismhosp 06 00015 g004
Figure 5. Boxplots of variables 5–29 (perception) and 30–54 (expectation): overestimation.
Tourismhosp 06 00015 g005
Figure 6. Valid, missing, mean, median, std. dev, variance (divided by 10), and range for variables 5–29 (perception) and 30–54 (expectation): underestimation.
Tourismhosp 06 00015 g006
Figure 7. Valid, missing, mean, median, std. dev, variance (divided by 10), and range for variables 5–29 (perception) and 30–54 (expectation): overestimation.
Tourismhosp 06 00015 g007
Figure 8. Graph of the scaled boundaries of perception and expectation, along with their respective means and a “base 2.5” line.
Tourismhosp 06 00015 g008
Figure 9. Bar graph of the scaled boundaries of expectation, superimposed by perception.
Tourismhosp 06 00015 g009
Table 1. Cronbach’s alpha for variable groups: 5–29 and 30–54.
N of ItemsCronbach’s Alpha
UnderestimationOverestimation
25 (variables 5–29)0.9550.957
25 (variables 30–54)0.9240.899
50 (variables 5–54)0.9340.937
Table 2. Differences between the (scaled from 0 to 5) mean expectation and mean perception.
QuestionDifferenceValueQuestionDifferenceValue
1V5–V30−0.7614V18–V43−2.14
2V6–V31−1.6115V19–V44−1.87
3V7–V32−0.0416V20–V45−1.81
4V8–V33−1.9117V21–V46−1.41
5V9–V34−1.7818V22–V47−2.46
6V10–V35−1.8519V23–V48−1.70
7V11–V36−1.6620V24–V49−2.33
8V12–V37−2.2921V25–V50−2.65
9V13–V38−2.4822V26–V51−2.25
10V14–V39−2.2323V27–V52−2.34
11V15–V40−2.1824V28–V53−2.64
12V16–V41−2.3625V29–V54−2.63
13V17–V42−2.40
Table 3. Differences between the (scaled from 0 to 5) underestimation of expectation and overestimation of perception.
QuestionDifferenceValueQuestionDifferenceValue
Exp. (Under)–Perc. (Over)Exp. (Under)–Perc. (Over)
1V5–V30−0.0714V18–V43−1.60
2V6–V31−1.0015V19–V44−1.37
3V7–V320.5716V20–V45−1.28
4V8–V33−1.3717V21–V46−0.89
5V9–V34−1.2518V22–V47−1.82
6V10–V35−1.3119V23–V48−1.12
7V11–V36−1.1320V24–V49−1.72
8V12–V37−1.7721V25–V50−2.12
9V13–V38−1.9822V26–V51−1.76
10V14–V39−1.7123V27–V52−1.85
11V15–V40−1.6424V28–V53−2.14
12V16–V41−1.8425V29–V54−2.14
13V17–V42−1.83
Disclaimer/Publisher’s Note: The statements, opinions and data contained in all publications are solely those of the individual author(s) and contributor(s) and not of MDPI and/or the editor(s). MDPI and/or the editor(s) disclaim responsibility for any injury to people or property resulting from any ideas, methods, instructions or products referred to in the content.