Article

The Spatial Structure and Influencing Factors of the Tourism Economic Network in the Yangtze River Delta Urban Agglomeration

Department of Hotel and Tourism, College of Business, Daegu University, Gyeongsan 38453, Republic of Korea
*
Author to whom correspondence should be addressed.
Tour. Hosp. 2024, 5(1), 60-79; https://doi.org/10.3390/tourhosp5010005
Submission received: 29 November 2023 / Revised: 29 January 2024 / Accepted: 30 January 2024 / Published: 1 February 2024
(This article belongs to the Special Issue Nature-Based Solutions in Tourism and Hospitality)

Abstract

:
The optimization of a tourism economic network is critical in the promotion of the high-quality development of a regional tourism economy. In order to explore the spatial network structure of the tourism economy of the Yangtze River Delta urban agglomeration and its influencing factors, this study used a modified gravity model and social network analysis methods for evaluation and analysis. The results show the following: (1) the spatial network of the tourism economy in the Yangtze River Delta urban agglomeration in 2016–2021 was characterized by significant non-equilibrium; however, that trend has weakened, and the tourism connections are now stronger in economically developed regions. (2) The density of the network structure was slightly strengthened. The structure of the tourism economy network shows an obvious core–periphery distribution pattern. The external radiation of the center city was enhanced, and the core area of the network expanded. (3) The concept of the “small world” is characterized by a significant evolution from five major associations to four major associations during the study period. (4) The quadratic assignment method (QAP) of regression analysis showed that tourism service reception capacity, tourism information flow, tourism resource endowments and transportation convenience make a significant contribution to the formation of the spatial network of inter-city tourism economic connections. The results of this study can provide a theoretical basis for the optimization of the tourism economic network of urban agglomerations and the scientific decision-making underpinning tourism economic cooperation.

1. Introduction

Tourism plays an important role in promoting economic development and stimulating consumption [1,2]. Tourism destinations are an important component of tourism as a whole and are the main locations for tourist activities, which include countries, regions, cities and specific attractions [3]. With the rapid development of tourism, tourist destinations have frequently cooperated in terms of source markets, resource development and other aspects, and tourism development links have become increasingly close, forming a complex and robust spatial structure in the tourism economy [4]. This complex structure includes within it the flow of economic elements of tourism, the dissemination of information and communication and the geographical elements of cities of different sizes [5]. The spatial network structure of the tourism economy can facilitate the rapid flow of tourism economic factors such as capital, technology and talent among tourism destinations [6] and achieve spatial coordination among tourism destinations and simultaneous development of tourism industries by consolidating tourism economic linkages [7]. Therefore, the spatial network structure of the tourism economy in tourist locations has become a topic of concern for many scholars.
The network of tourism destinations is a geographical system connecting nodes (destinations) with links (routes between destinations) to boost their joint development. The network structure is the set of these nodes and links [8]. Aleksanyan [3] states that the tourism destination is a geospatial concept. He argues that the tourism destination as a spatial unit has to be managed, and considering the administrative unit as a tourism destination proves to be an effective way of managing it. Gan et al. [9] argues that tourism connection and cooperation between tourism destinations are driven by government intervention rather than market mechanisms and that governments play a dominant role in tourism activities. Therefore, it is important that administrative units correspond with tourism destinations, from a geographic perspective, to help explore the network structure of tourism destinations. In previous studies on the network structure of tourist destinations, many scholars have analyzed them from the supply and demand perspectives [10]. The research on the supply side has focused on the tourism organization of destinations and their interconnectedness [11,12]; meanwhile, the scholarly attention on the demand side has mostly focused on tourism mobility in destinations [13,14,15] and tourism flow [16,17]. However, there are relatively few studies on the spatial network structure of the tourism economy in tourist destinations; in particular, there is a scarcity of studies that apply geographic theories to explore the spatial network structure of the tourism economy in urban agglomerations [9]. The need for integration of social and economic development has made urban agglomerations a fundamental geographic level of regional development [18]. The spatial network structure of the tourism economy in urban agglomerations can reflect the connections and correlations between different urban tourist destinations in the spatial domain, which plays an indispensable role in the tourism–industrial coordinated development of urban agglomerations [19]. Relevant studies have shown that exploring the spatial network structure of the tourism economy in urban agglomerations can effectively identify the roles and positions of different cities in the tourism development pattern; in turn, this can provide effective theoretical support in promoting the integrated development of tourism in urban agglomerations and optimizing the regional tourism spatial pattern [9,20,21]. Therefore, a rigorous and comprehensive analysis of the spatial network structure of the tourism economy in urban agglomerations is of great practical significance.
As the most economically developed region in China, the urban agglomeration of the Yangtze River Delta (YRD) plays an extremely important role in China’s economy, ecology and tourism and serves as an important vanguard for China’s participation in international competition [22]. However, at present, unbalanced and uncoordinated development of the tourism economy in the YRD urban agglomeration still exists, including blind competition between tourism cities, duplication of tourism projects occurring from time to time and the synergistic effect of the tourism industry failing to be given full play, which hinders the process of tourism integration. In terms of the spatial network structure of the tourism economy, the 41 cities in the YRD urban agglomeration are interwoven into a complex network system due to their tourism economic ties, and each node city has both a different role and position in the network. The lack of an accurate positioning of the cities’ functions and roles in the network has led to the failure of the high-quality synergistic development of the YRD tourism industry.
The research objective of this study is to explore the spatial structure of the tourism economic network of the YRD urban agglomeration in order to grasp the status and role of different YRD cities within the network. At the same time, we aim to gain insights into the determinants of the tourism economic network’s spatial structure with a view to providing theoretical support to optimize the pattern of tourism economic development in the YRD urban agglomeration. The empirical analysis of this study includes three specific elements. The first is the quantitative evaluation of the intensity of the urban tourism economy based on the modified tourism economy gravity model; the second is the construction of a spatial correlation matrix for the tourism economy and the exploration of the spatial network structure and the evolutionary law of the tourism economy in the YRD urban agglomeration using social network analysis. The third element is the use of the quadratic assignment method (QAP) to test the main factors affecting the spatial network of the long-term tourism economy.

2. Literature Review

2.1. Spatial Network Structure in Tourist Destination

Spatial structure, as a geographic term, reflects the organizational structure formed through the action of human economic and cultural activities within a certain geographical range [23]. The tourism spatial structure refers to the degree and state of spatial agglomeration formed by the interaction of tourism economic objects in an identified space, which is the projection of tourism activity onto the geographical space, reflecting the spatial attributes and interrelationships of tourism activities [24].
In recent years, with the rapid development of information technology, tourist destinations have become increasingly interconnected beyond geographical restrictions. In addition, exploring the spatial network structure of tourist destinations has become a new focus for scholars. In this context, the network perspective has gradually been introduced into regional tourism research [10], and social network analysis has appeared in tourism research more and more frequently. The current research on the spatial network structure of tourist destinations mainly focuses on inter-organizational relationships and the networks of attractions and destinations [25]. From the perspective of inter-organizational relations, the research on network analysis mainly focuses on the characteristics of cooperative networks among relevant organizations. Tran et al. [26] analyzed the network relationship between different travel agencies and found that the network between travel agencies represents a loosely connected feature, and the degree of cooperation and collaboration between travel agencies in the network is still very limited. Kim and Scott [27], through collating relevant news reports involving the tourism industry and its development from 1945 to 1999, found that in the tourism development network, tourism interest was initially strictly controlled by the central government but then gradually dispersed to local governments, the private sector, non-private sectors and overseas’ departments and that the structural characteristics of the tourism development network also changed from a hardware-based infrastructure to a “soft power” infrastructure dominated by products, activities and festivals. Due to the fact that tourist destinations consist of different types and levels of tourism suppliers and tourist organizations [28], scholars have started from the supply perspective to explore the characteristics of tourist destination networks [29] and the core factors affecting the network structure [30]. Wang et al. [31] utilized the modified structural gravity model to evaluate the spatial network structure of the tourism economy in 15 cities in Xinjiang. They found that the density of tourism economic association networks among these cities is relatively low, indicating a lack of close economic ties. Wang and Xia [32] visualized the spatial evolutionary characteristics of tourism economic connections at the provincial level in China. They discovered that different provinces have varying positions and roles in the tourism economic spatial association network. Provinces with developed economies in the eastern region play a more significant role in the overall network structure, serving as the central and dominant force within the network. Wang et al. [33] focused on national parks in central China as their research subject. They employed social network analysis methods to explore the network structure of tourism economic connections between these national parks. Their study confirmed the imbalanced spatial distribution characteristics of tourism relationship strength among national parks in the central region.
Some scholars have started from the perspective of tourist demand, analyzing the spatial network structure of tourist destinations [9,33,34]. Stienmetz and Fesenmaier [35] started from the spatial mobility of tourist activities and analyzed the network structure characteristics of attractions within the American city of Baltimore. They ultimately found that urban attraction clusters can be formed through both geographic proximity and activity types. Liu, Huang and Fu [10] used social network analysis to explore the demand network relationship between tourist destinations and, ultimately, found that tourists’ travel choices will be affected by the spatial characteristics between tourist destinations. The more scenic spots of different levels and types there are, the more connections there are in the tourist destination network.
Overall, the frequency of network analysis in studies of the spatial structure of tourist destinations is increasing, and exploring the formation and development of these network structures has become an important direction in tourism research. Therefore, this study attempts to investigate the spatial network structure characteristics and influencing factors of the YRD urban agglomerations at the level of the tourism economy from a networked perspective.

2.2. Spatial Network Structure of Tourism Economy in Tourist Destination

The tourism economic network comprises a tourism spatial structure formed by the frequent flow of regional tourism activities, tourist traffic, tourist commodities and tourist infrastructure elements among tourist destinations [36], which are the core content of destination network research in tourism. Tourism economic connections are an integrated reflection of the flow of tourism factors and reflect the spatial structure of regional tourism economy.
Most of the current research on the spatial network of the tourism economy employs mathematical models to reflect the structure of the region’s tourism economic network by quantitatively evaluating the tourism economic connections between tourist destinations. The specific research methods include gravity models and social network analysis [37]. As a result of the rapid development of urbanization and tourism in China, some Chinese scholars have regard cities as important tourist destinations providing the spatial basis and important support for the development of regional tourism and constituting indispensable components in the process of tourism economic connection [38,39]; therefore, many Chinese scholars have utilized gravitational models and social network analysis to explore the structure of tourism economic networks in urban tourism destinations. Zhang and Xia [40] utilized the gravitational model to evaluate the intensity of tourism economic ties among 17 cities in Anhui Province, China. They found that the tourism economic ties of southern cities were significantly stronger than those of northern regions. Moreover, due to factors such as geography and transportation, there is no necessary connection between a city’s tourist centrality and the volume of its tourism economic ties. Yang et al. [41] utilized the gravitational model and social network analysis to discover that there exists a core–periphery characteristic in the tourism network space of the Beijing–Tianjin–Hebei–Xiongan region of China. Beijing and Tianjin are the core of the entire regional tourism economic connection. Wang et al. [42] employed social network analysis to examine the structural attributes of the tourism economic network in the Wuhan metropolitan region in China. Their findings suggested that the overall connectivity density of this network is comparatively low, indicating a nascent stage in its network structure. Meanwhile, Wuhan has strong monopoly in the tourism economic network structure. An interesting phenomenon can be found through the above scholars’ case studies on China. It is that the cities with stronger connections in the regional tourism economic network, such as the southern part of Anhui Province in China, Beijing and Tianjin, and Wuhan, are all the economic cores within the study area. Therefore, it is not difficult to determine that cities with the advantage of developing tourism economic connections are more likely to have economic connections with other cities in the region [43].
In addition, other scholars have explored the economic networks of tourism destinations based on the perspectives of countries, specific attractions, etc., using gravity models or social network analysis. Xie et al. [44] analyzed the spatial structure characteristics and effects of the tourism economy in the European Union. The results of the gravity model showed that France, the United Kingdom, Austria, Germany and Italy have a high strength of tourism connections and play an important role in the network. Baggio et al. [45] introduced the methodology of network science and its application scenarios in the field of tourism research and found the local stakeholders exhibit a very low degree of tourism economic collaboration or cooperation through a case study (Elba, Italy) based on social network analysis. Sørensen [46] concluded that the local tourism economic network consists of a combination of local, weak, dense and non-local, strong, sparse networks through an empirical study of destination firms in the province of Málaga, Spain. This configuration is a result of the economic and cultural distances between tourism firms within the destinations and, conversely, of the economic and cultural proximities of spatially distant tourism firms. Ibragimov et al. [47] explored the economic determinants of tourism in Central Asia based on a gravity model. It was found that tourism in Central Asia is considered to be both more distance- and price-elastic. Bai et al. [48] constructed the Belt and Road International Tourism Cooperation Network (ITCN) based on the perspective of tourism economic cooperation and further found, using social network analysis, that Eastern Europe, North Asia Pacific and South Asia are at the core of the network, while the Middle East, the Americas and Africa are at the periphery of the network.
In summary, although there is an increasing body of research on the analysis of tourism economic networks in tourist destination by scholars, some shortcomings still exist. Firstly, in terms of research methods, the gravity model has been widely used in the field of regional socioeconomic connections at the beginning of the 21st century, but many previous studies overlooked the directionality and difference in economic connections between regions when applying this model. Calculation using the traditional gravity model would make the tourism economic connection strength between different regions the same, leading to a lack of precision in the research results. However, by improving the traditional gravity model through the construction of a correction coefficient method, this problem can be effectively solved, and it can then more accurately reflect the differences in tourism economic connections between regions.
Secondly, in the selection of the period of time for research, few scholars have included the COVID-19 period in their studies. The occurrence of the COVID-19 pandemic caused huge damage to the global tourism industry [49]. Including the COVID-19 period in the research scope can fully identify the resilience and recovery degree of tourism economic connections between regions when facing external, sudden risks. Therefore, the innovation of this study lies in including the COVID-19 period in the research scope, constructing and applying the modified gravity model, reflecting the temporal and spatial characteristics of the tourism economic spatial network between regions to a greater extent and further improving the research methods and content in the field of the tourism economic network.

3. Materials and Methods
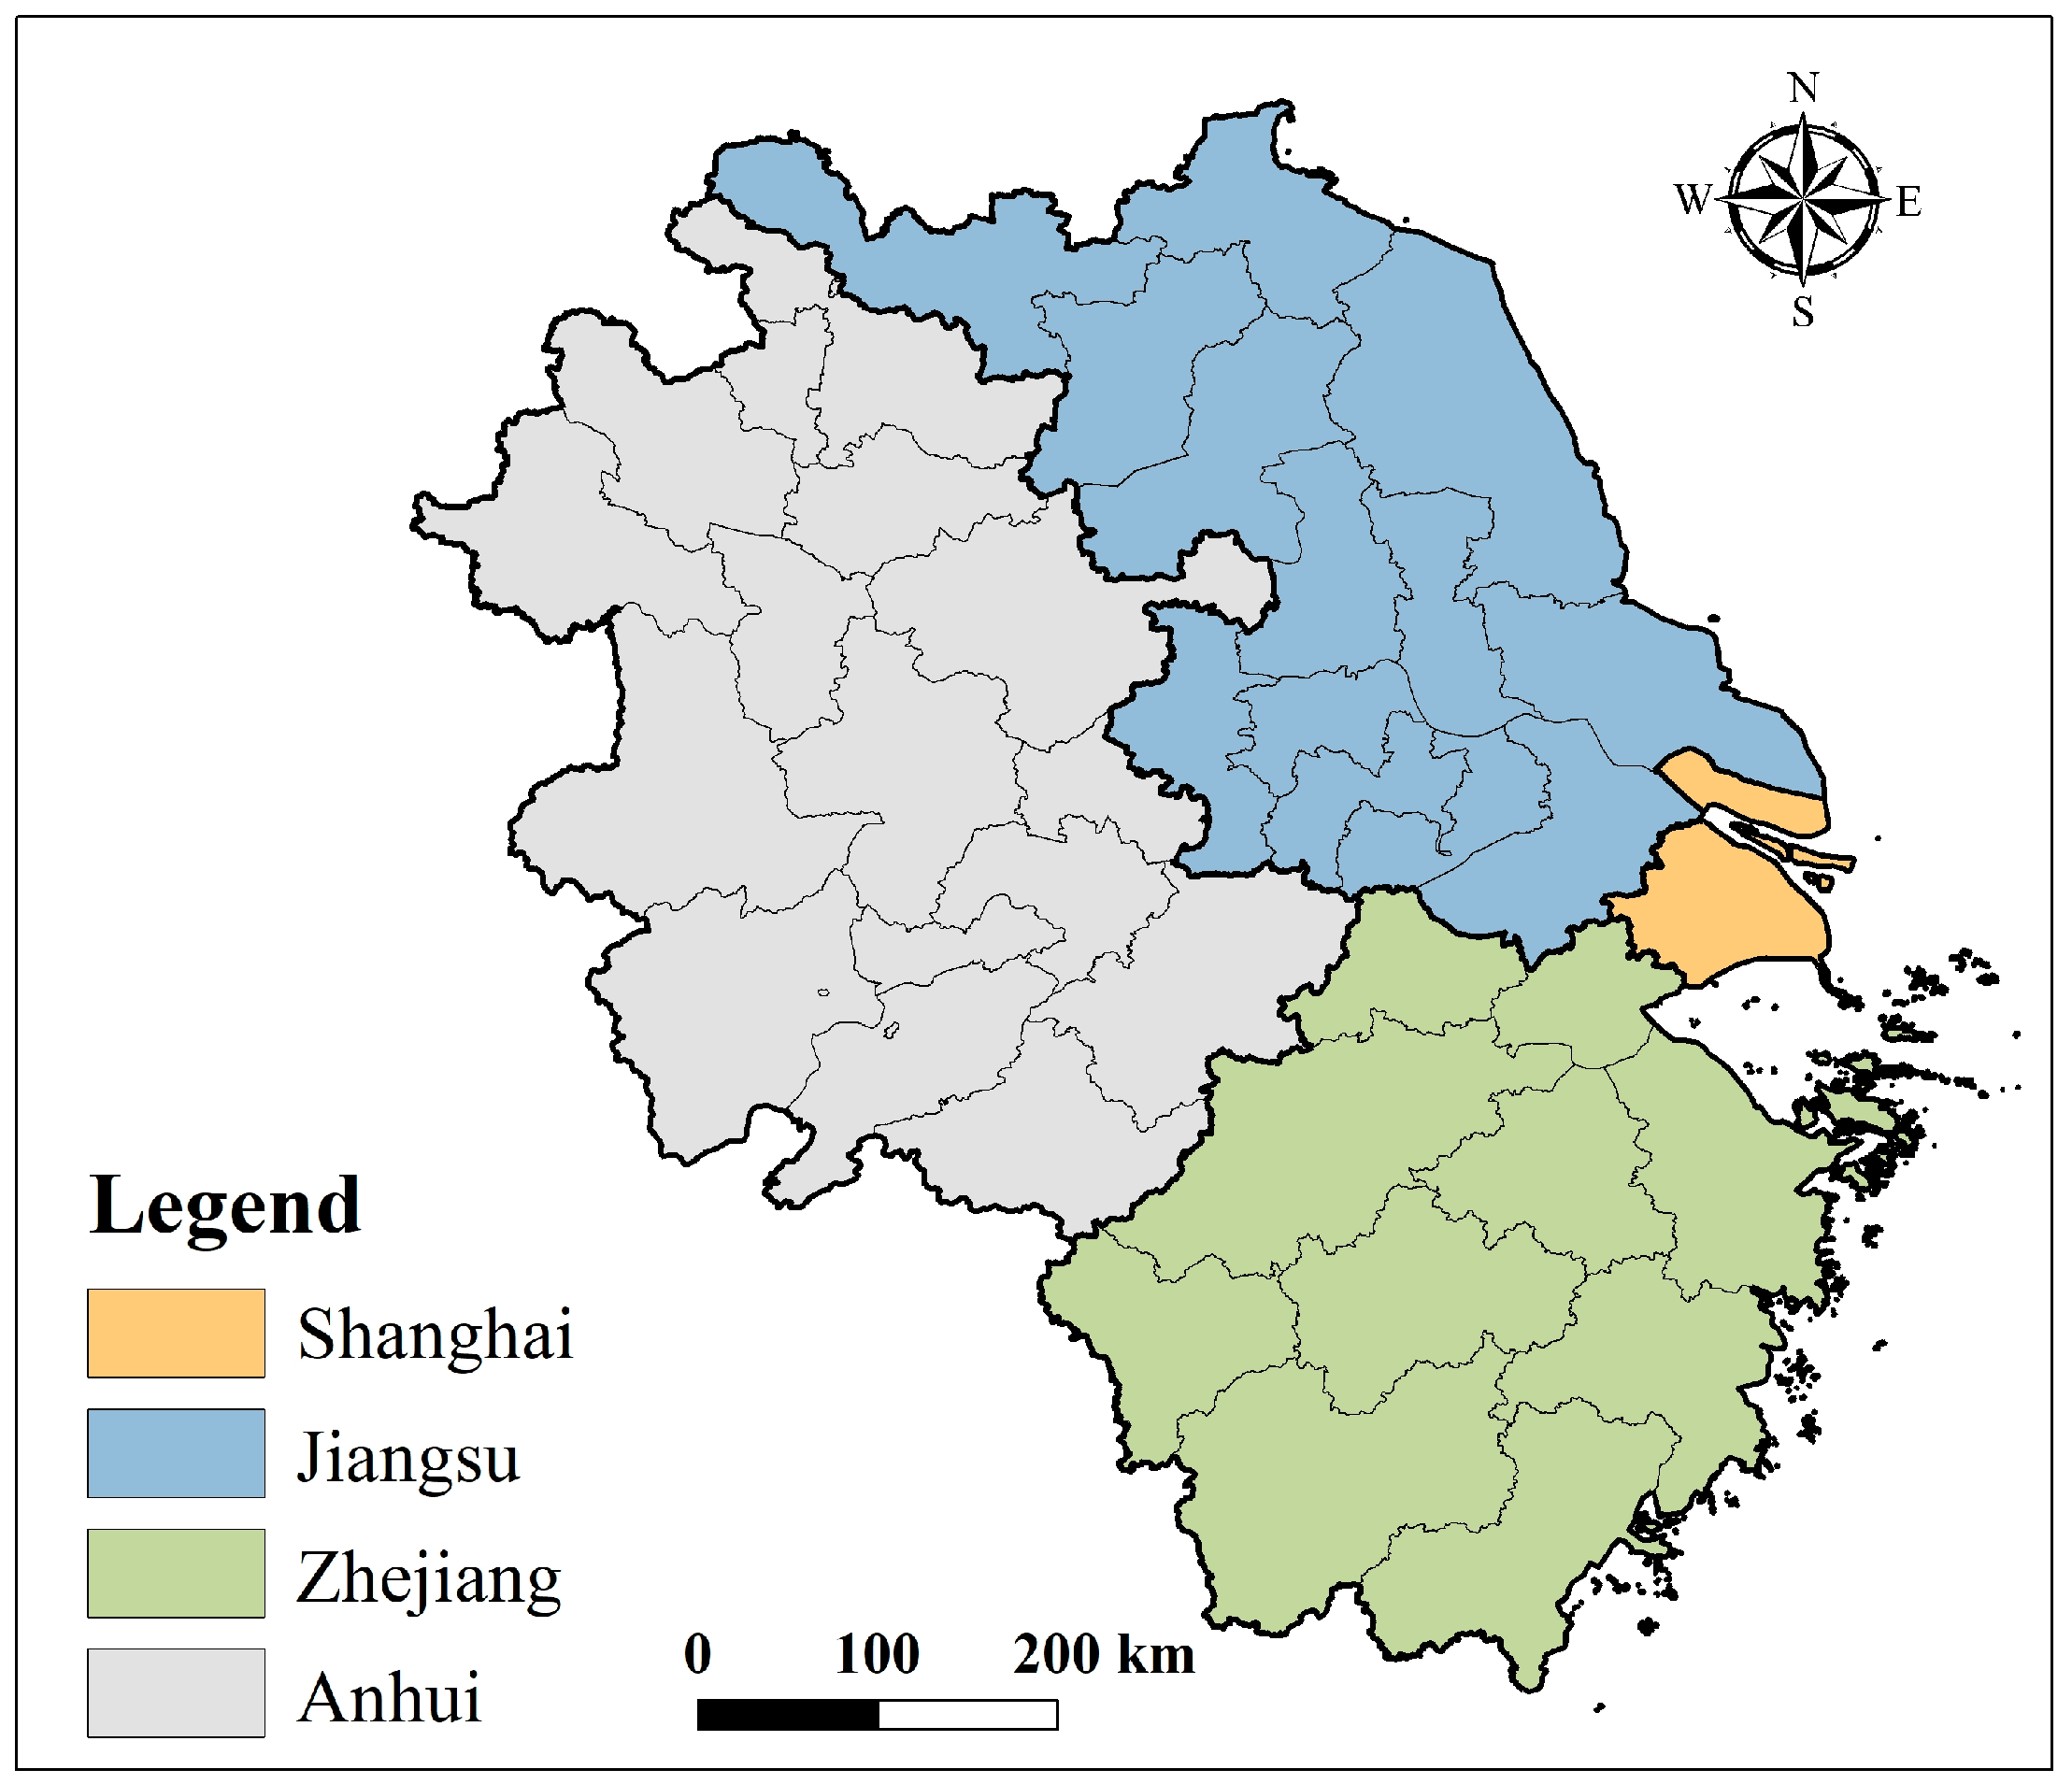
3.1. Study Area

The Yangtze River Delta (YRD) urban agglomeration (Figure 1) is located in the alluvial plain of the lower reaches of the Yangtze River, covering 41 cities, including Shanghai, Nanjing, Hangzhou and Hefei, with Shanghai as the core, and spanning the provinces of Jiangsu, Zhejiang and Anhui. This study selected the YRD region as the subject of its case study for the following reasons.
First of all, the YRD region occupies a pivotal strategic position in China’s modernization and opening-up pattern, is the largest urban agglomeration in China and also the earliest region to explore the spatial layout of cities and carry out the development and construction of tourism projects. In 2019, the gross domestic product (GDP) of the YRD reached CNY 23.72 trillion, accounting for nearly a quarter of China’s total economic output with less than 4% of the country’s land area. This emphasizes the practical significance of using the region as a case study [50].
Secondly, the YRD region has an excellent ecological environment and rich tourism resources, and it is the region with the most 5A scenic spots in China, with the number of 5A scenic spots accounting for more than one-fifth of those in the country as a whole. It receives hundreds of millions of domestic and foreign tourists every year. The development and growth of the tourism economy in the YRD urban agglomeration has created a great number of employment opportunities for the region and effectively driven regional economic growth; therefore, it is significant to choose the YRD as a research case.

3.2. Data Sources

This study used 41 cities in the YRD as the research object. The data required for this study were obtained from China Statistical Yearbook, China Tourism Statistical Yearbook, China Science and Technology Statistical Yearbook, China Transportation Statistical Yearbook and China Environmental Statistical Yearbook. The study period was limited to 2016–2021 for the following specific reasons.
First, China’s short- and medium-term planning has traditionally been based on five-year periods. The beginning and end of the “Thirteenth Five-Year Plan” was 2016 and 2020, respectively. Second, the YRD’s tourism resources are extremely rich and highly complementary. The Cultural and Tourism Alliance was established by the Shanghai, Jiangsu, Zhejiang and Anhui cultural and tourism departments in 2019 [50]. In addition, according to Ruan et al. [51], policy effectiveness can exhibit some data lag. The data from 2021 were chosen to ensure that the policy planning matched the data validity. Meanwhile, the COVID-19 outbreak in 2020 wreaked havoc on regional tourism development and had a significant impact on inter-city tourism economic connections [49]. Therefore, the data for the period 2016–2021 can reveal the cyclical trend of the tourism economy in the macro context of national and regional policy planning and the occurrence of public health emergencies. The choice of research time is reasonable and sufficient.

3.3. Research Methods

3.3.1. Modified Gravity Model

The gravity model originated from Newton’s law of gravity, which was first applied to tourism research by Crampon (1966), who believed that tourism between cities would also form an attraction to each other in the same way as gravitational forces operate and, thus, proposed the gravity model in tourism [44]. The gravity model can describe the strength of the relationship between two regions by integrating geographic distance, economic level and population size [52,53] and is suitable for measuring the strength of tourism economic ties between cities [44]. The gravity model is now widely used in tourism economic relations. However, the traditional model ignores the directionality and difference of tourism economic ties between different cities, resulting in the gravitational pull of large cities on small and medium-sized cities and the gravitational pull of small and medium-sized cities on large cities to be equal, causing inevitable bias in the results of studies in this area. GDP per capita is an important indicator of the level of comprehensive regional economic performance which can generally reflect the development of the tourism economy and effectively compensate for the shortcomings of the traditional gravity model [54]. Thus, this study reflects the degree of tourism economic interaction between different cities based on the total tourism revenue and the total number of tourists in the cities, as well as the geographic distance between the cities, and incorporates GDP per capita into the formula to construct the correction coefficient K i j , thereby characterizing the directionality and variability of the tourism economic connections between the cities. In addition, according to previous findings in the literature on the case of China, it can be found that regions with stronger economies are more likely to have tourism connections with other regions [9,40,41,42]. And the subject of this study, the YRD urban agglomeration, is the most representative region in China. Therefore, this study utilizes the gravity model to establish the hypothesis that the tourism connections of one city to another city increase as the city’s economic level becomes higher. The specific formula is as follows:
R i j = K i j P i V i P j V j D i j 2
K i j = G i G i + G j
C i = j = 1 n R i j
where R i j is the degree of tourism economic connection between city i and city j ; P i and V i denote the total number of tourists and total tourism revenue of city i , respectively; P j and V j are the total number of tourists and total tourism revenue of city j ; D i j is the road distance between city i and city j ; K i j denotes the gravitational constant; and G i and G j are the per capita GDP of city i and city j . This study will visualize the results of modified gravity model with the help of GIS. ArcGIS will help to prepare several geographical charts [55]. They will present the status of tourism economic connections between cities during the study period.

3.3.2. Social Network Analysis (SNA)

Social network analysis is a method used to study social network members and their relationships. By analyzing the relationships among network members, it can both reflect the evolutionary characteristics of the overall network structure and reveal the connection structure among network members and their attribute characteristics [56]. Social network analysis is now widely used in economics, sociology, management, geography, tourism and other disciplines [57,58,59,60]. Ucinet 6 and Gephi are two of the most commonly used software programs to implement social network analysis. Ucinet 6 supports users in constructing network models, measuring and analyzing various attributes in the network and exploring patterns and relationships in the network [61]. Gephi provides a 3D rendering engine that displays large networks in real time and accelerates exploration with a flexible multi-tasking architecture that allows users to work with complex datasets and generate valuable visualizations [62]. Therefore, this study used Ucinet 6 and Gephi 0.10.1 software to select indicators, such as network density, network centrality, core–periphery structure and modularity analysis, to intensively analyze the evolutionary characteristics of the tourism economic network structure of the YRD urban agglomeration. Meanwhile, the quadratic assignment procedure (QAP) was used to test the main factors affecting the spatial network of the tourism economy. The specific formulas refer to the relevant literature [63,64].
Network density reflects the overall structural characteristics of the network and measures the overall tightness of the network.
Network centrality includes degree centrality, closeness centrality and betweenness centrality. Degree centrality is the degree to which a node is centrally located in the network, closeness centrality is how easy it is for nodes to make interconnection and betweenness centrality is the degree to which a node has control over other nodes in the network [65].
The core–periphery structure is a methodology used to delineate the core and peripheral areas of an overall spatial network of tourism economic connections and to measure the density of the economic connections between them [20,66,67].
Modularity analysis is the most applied method to delineate the quality of research associations [68]. The structure of associations is an interesting phenomenon in complex networks, and the optimal division of associations can be achieved through the modularity degree. This determines the quality of associations divided by the degree of connection between the members within those associations and between the members of different associations.
The quadratic assignment method (QAP) is an effective analytical method for studying relational data [69]. QAP specifically includes both QAP correlation analysis and regression analysis. QAP correlation analysis is used to investigate whether two relational matrices are related or whether a relationship exists between one attribute and another. QAP regression analysis is an analytical method that investigates the relationship between multiple matrices and a single matrix and evaluates the significance of the regression coefficients.

4. Results

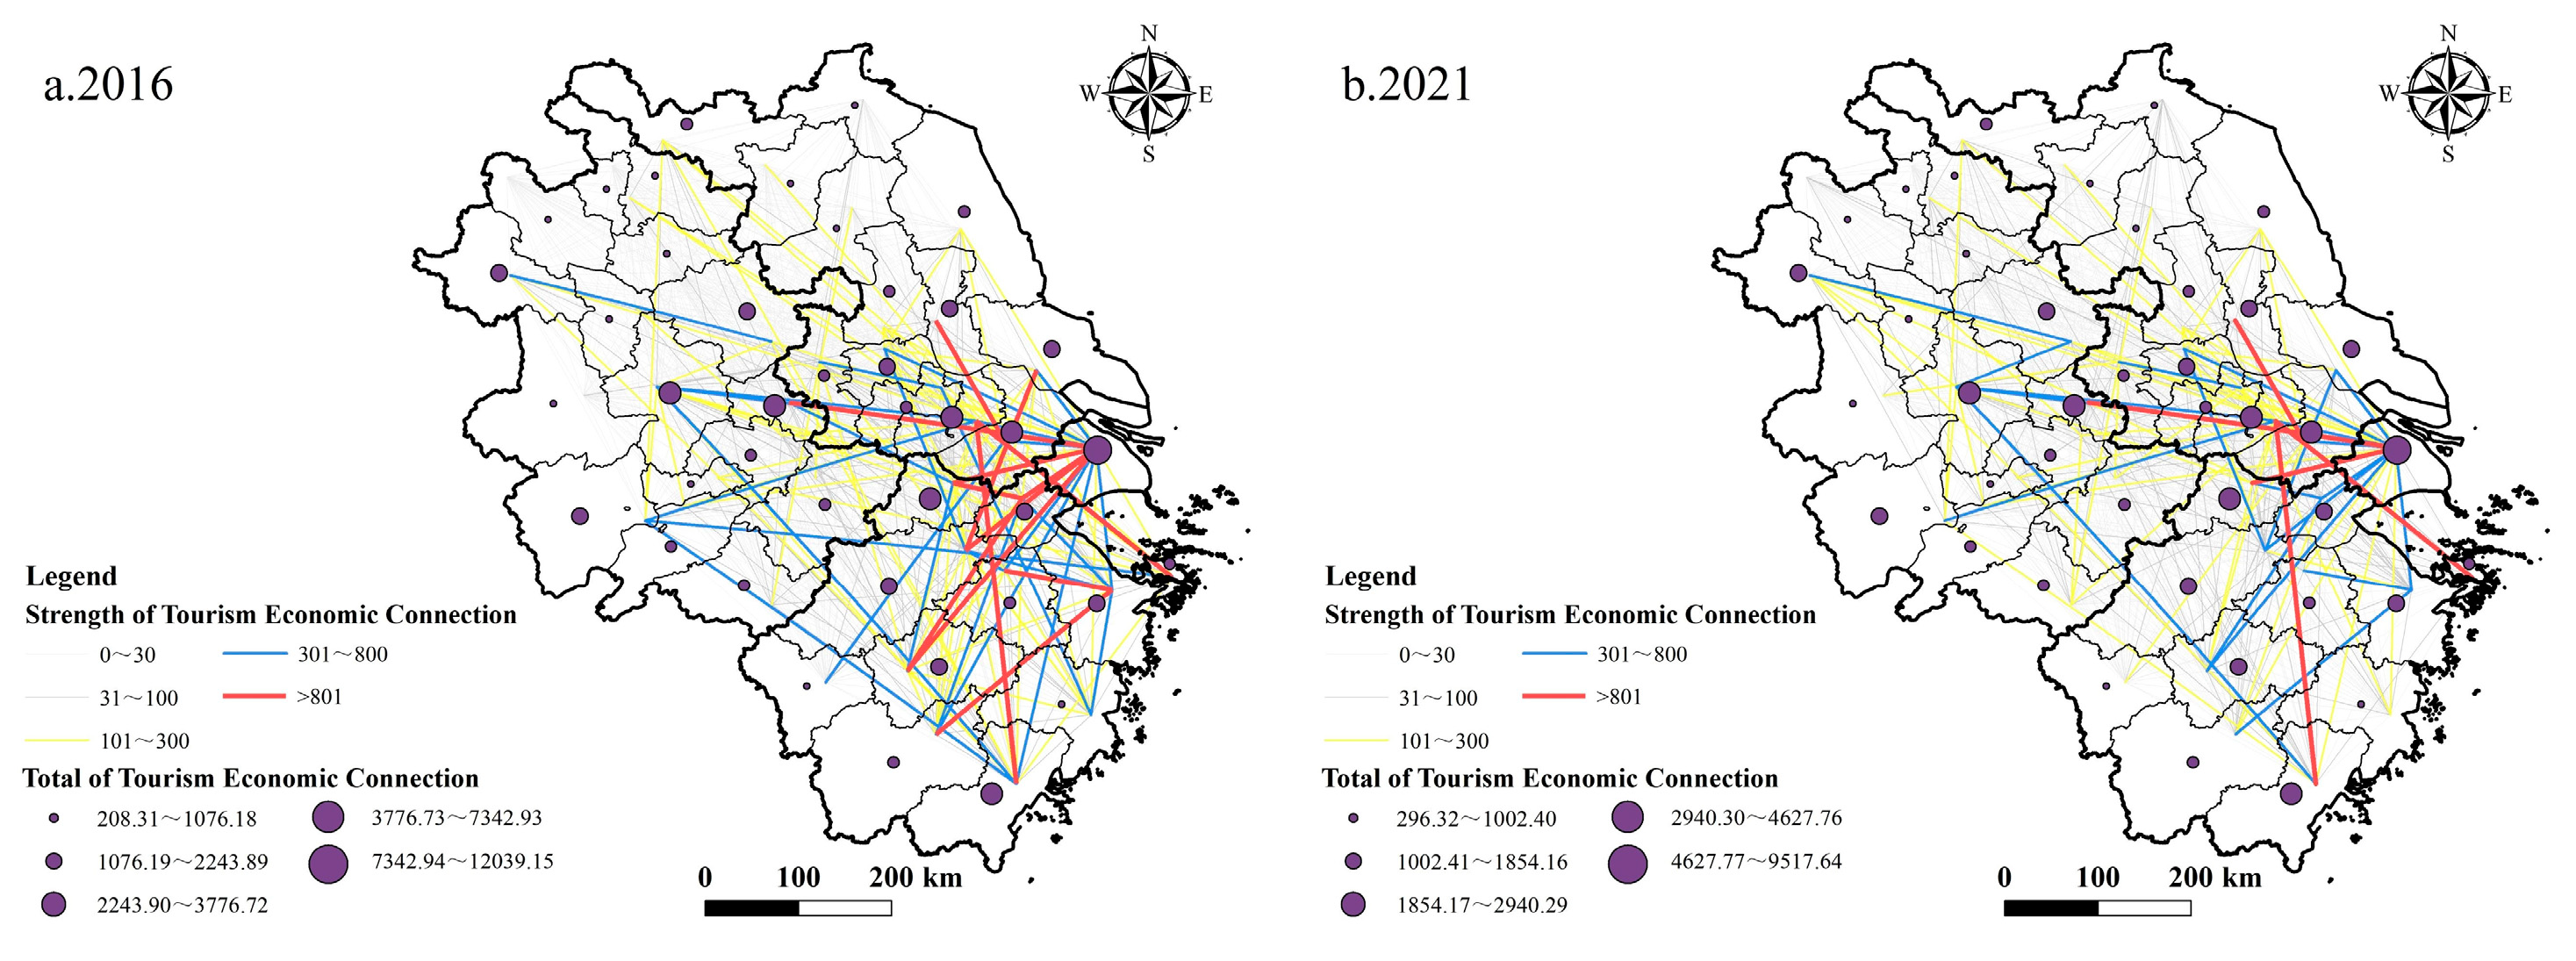
4.1. Strength of the Tourism Economic Connection

The tourism economic connection strength of the YRD urban agglomeration was measured using the modified gravity model and visualized with the help of ArcGIS 10.2 software. In 2016, as can be seen in Figure 2, the top three cities in terms of tourism economic connection were Huzhou → Shanghai, Shaoxing → Ningbo and Wenzhou → Wuxi, and the bottom three were Huaibei → Liuan, Huaian → Huaibei and Xuancheng → Huaibei. The top three cities are all located in the southeastern part of the YRD, and these cities, as the core growth poles of the regional tourism economy, play a significant role in the external radiation of growth in tourism. In terms of spatial patterns, the tourism economy of the YRD urban agglomeration shows strong spatial non-equilibrium characteristics, with a significant polarization of tourism economic connections, and with some marginal cities such as Huaibei, Lianyungang and Fuyang not having strong tourism economic connections. In 2021, tourism connections increased in some cities located in the western and northern regions but decreased between cities in the southeast. Huzhou → Shanghai remained the two cities with the strongest tourism connection, but the connection decreased by 52.19% from 2016. Overall, the spatial connection network of tourism economy in YRD cities has tended to develop in the direction of equalization.
In terms of total tourism economic connection, Figure 2 shows that in 2016, the average value of total tourism economic connection was 3145.08. Compared to other cities in the YRD, the total number of tourism economic connections is higher in the cities of Shanghai, Wuxi, Suzhou and Nanjing. These cities are all characterized by developed economies, indicating that the higher the economic level of a city, the easier it is to generate tourism economic connections with other cities. Cities such as Huaibei, Bengbu and Bozhou are in a remote position in the tourism economic network, and the total number of tourism economic connections is low. In 2021, the average value of total tourism economic connection in these cities decreased to 2067.06. Zhoushan, Taizhou, Shaoxing, Quzhou and other southern regions decreased more significantly, while Bozhou, Fuyang, Huaian, Lianyungang and other cities located in the northern region saw a significant increase in the total tourism economic connection, with, for example, the growth rate of total tourism economic connection in Huaibei reaching 42.25%. In general, the trend in the total amount of tourism economic connections in the YRD cities shows a significant differentiation, with the northern area showing a growth trend and the southern area showing a decline.

4.2. Tourism Economic Network Structural Characteristics

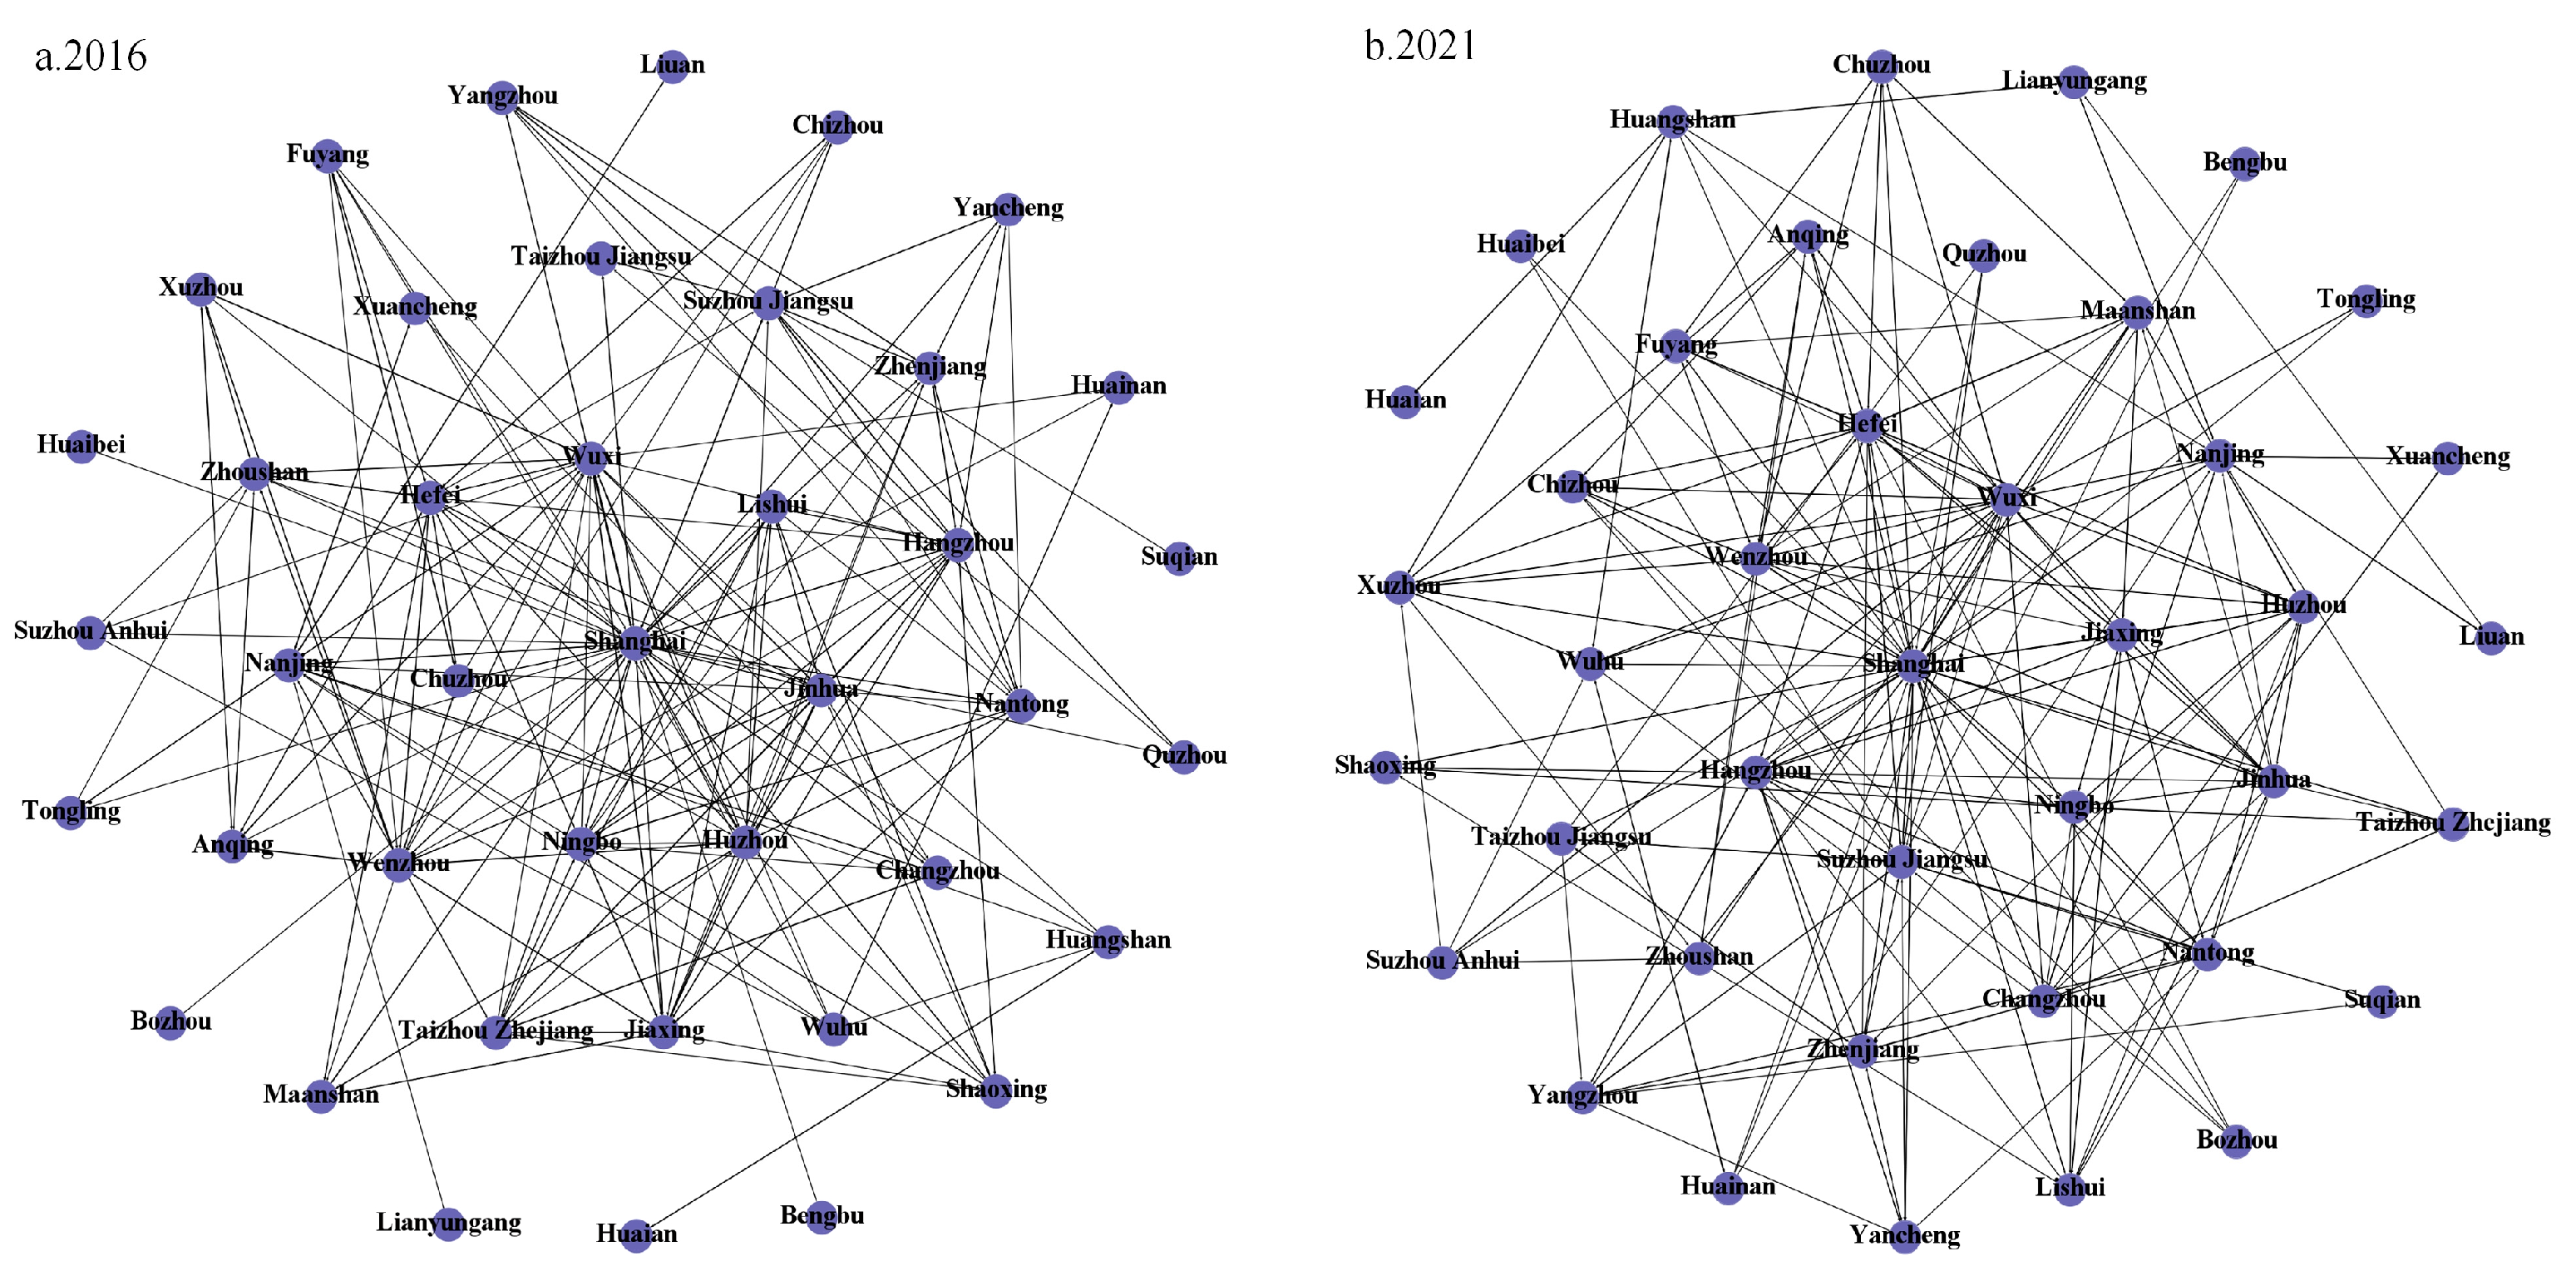
4.2.1. Overall Network Density Characteristics

In order to better reflect the overall economic connection characteristics, Gephi software was used to map the structure of the tourism economic network of the YRD urban agglomeration in 2016 and 2021. The mean value of the grid value of the tourism economy network matrix for each year was used as the threshold for binarization, and, as shown in Figure 3, the structural density of the tourism economy network in 2021 was slightly tighter than in 2016, with a network density of 0.159 in 2016 and a network density of 0.172 in 2021. In recent years, although the cities in the YRD have been affected by COVID-19, with the gradual recovery in the cities’ tourism industry, the frequency of inter-city tourism contacts has begun to strengthen again, and the imbalance has weakened, revealing the synergistic development of the regional tourism economic network.

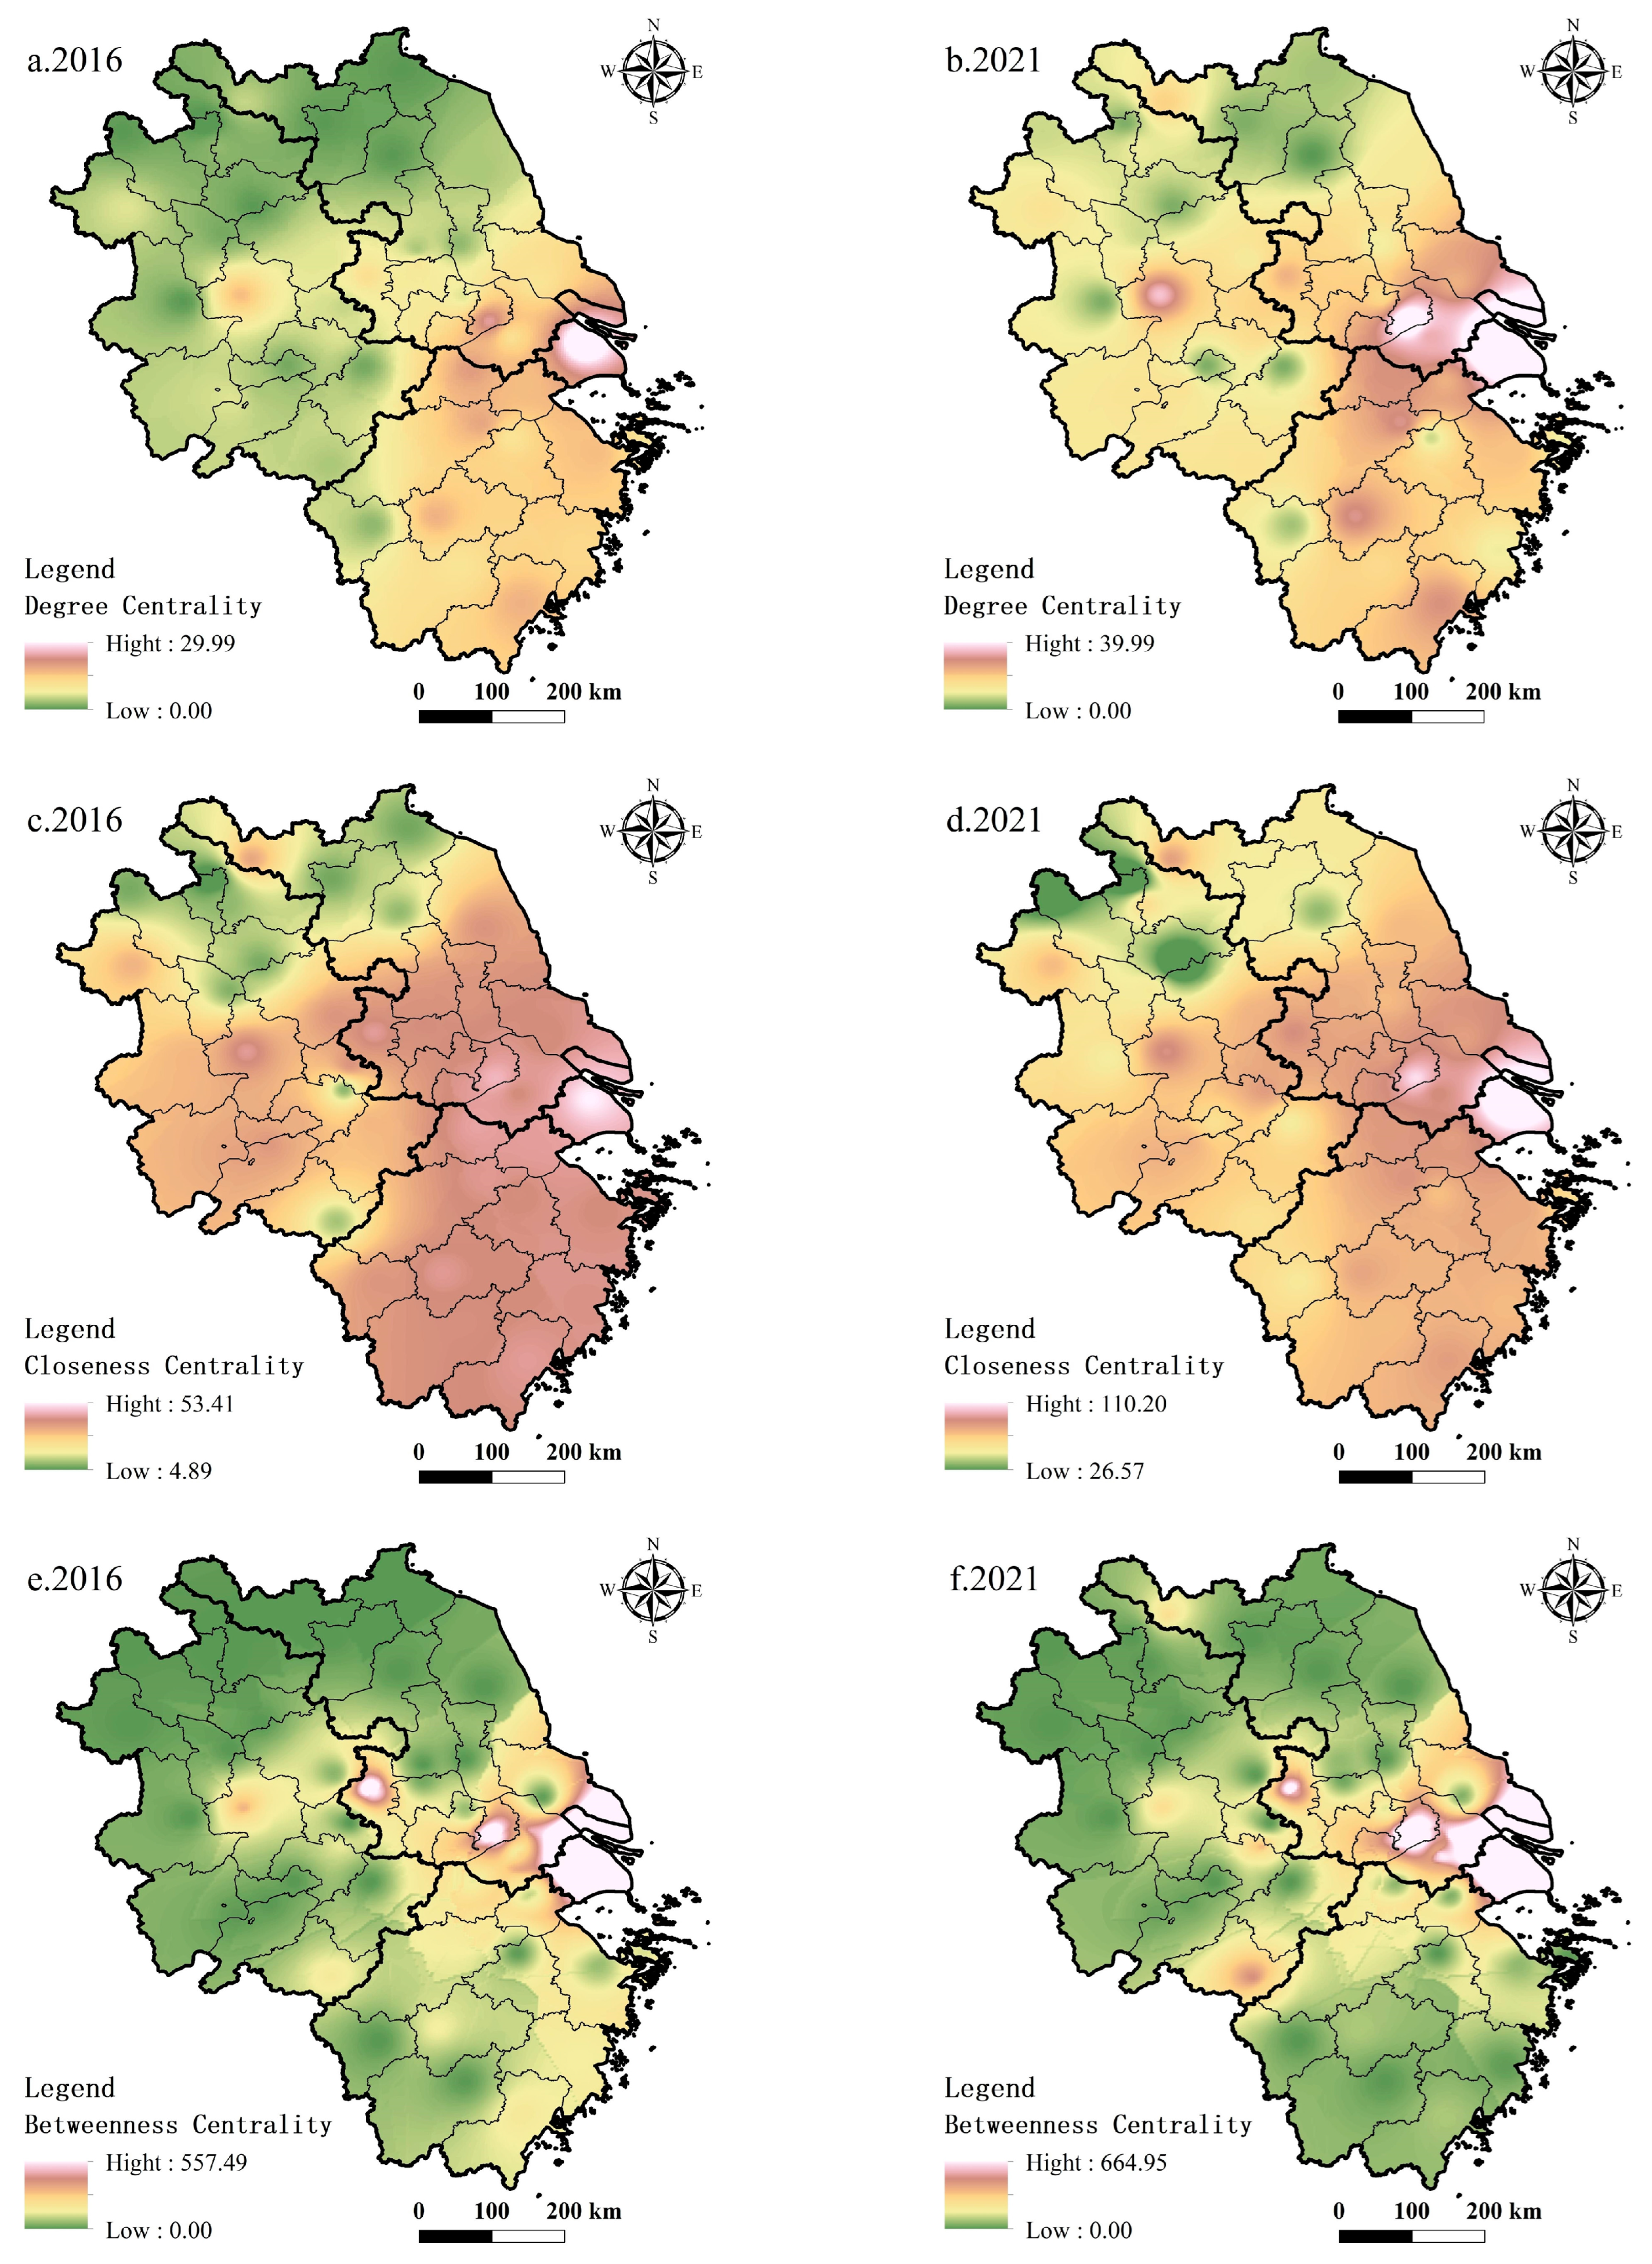
4.2.2. Evolutionary Trend of the Centrality

The centrality of each city in the YRD in 2016 and 2021 was calculated using Ucinet 6 software, and the results are shown in Figure 4. Observing the degree centrality, the degree centrality of cities in the YRD increased from 2016 to 2021, and the tourism and economic ties between cities became closer, with the northern part of the region showing the greatest improvement. The cities of Shanghai, Wuxi, Hangzhou and Hefei have a higher degree centrality than other cities. The factors that these cities share are that they are economically developed, located in transportation hubs and have a higher radiation effect and driving ability on the tourism economy. The degree point centrality is low in cities such as Huaibei, Huaian and Liuan, which are on the outer edges of the YRD and have inconvenient tourism and economic exchanges with other cities in the region, resulting in weak spatial associations with other cities. In terms of closeness centrality, the closeness centrality of each city in the YRD has increased significantly, indicating that the rate of tourism resource flow between cities in the YRD region has accelerated and the volume of tourism flow elements has increased significantly. The high closeness centrality of Shanghai, Wuxi and Hefei indicates that these cities are able to quickly generate links with other cities within the tourism and economic connection network of the YRD urban agglomeration. In terms of betweenness centrality, the differences in betweenness centrality in the entire tourism economy connection network in both 2016 and 2021 are significant, with obvious polarization characteristics. Shanghai, Wuxi and Nanjing have higher values of betweenness centrality, indicating that the tourism economy of these cities is at the center of the whole network and, therefore, has a stronger control over other cities. Bengbu, Bozhou, Huaibei and other cities have smaller values of betweenness centrality, indicating that the tourism economy of these cities is less independent in the overall network, a situation which is closely related to the local transportation conditions, socioeconomic development ability and other factors.

4.2.3. Core–Periphery Model

Using Ucinet 6 software, the tourism economic connection of the YRD urban agglomeration was divided into core and fringe areas (Figure 5), and the spatial network density of the tourism economic connection between the core and fringe areas was also calculated (Table 1).
In terms of network density, the spatial network density of tourism economic connection shows a decreasing trend except for an increase between cities within the peripheral areas, indicating that the tourism economic connection of the cities located in these areas are demonstrating improved recovery, and the circulation rate of the tourism economic connection between these cities is accelerated; meanwhile, the tourism economy of the other cities in the YRD has not yet recovered completely from the impact of COVID-19.
From the perspective of spatial distribution, the core area of the spatial network of tourism economic connection in the YRD region in 2016–2021 continues to expand, spreading from the southeast to the west and northwest, with cities in the peripheral areas gradually joining the core structure, and the core area spreading from the initial 13 cities to 19, with cities such as Xuzhou, Fuyang, Anqing and others becoming the new core area. Most of the cities in the eastern part of the YRD were in the core area, belonging to the absolute core area and playing a central driving role in the whole network of tourism economic connection. Lianyungang, Bozhou, Huaibei and other cities have always been in the peripheral areas; in fact, they belong to the absolute peripheral areas; this is because these cities have fewer tourism resources of their own and are unable to produce enough attractions for tourists. In addition, the distances from densely populated cities such as Shanghai and Nanjing to these cities are relatively long, resulting in difficulties in forming large-scale tourism demand; this restricts the ability of these cities to interact in the spatial network of the regional tourism economy.

4.2.4. Modularity Analysis

Using Gephi software, a random network was generated with the number of nodes as 41 and the probability of connectivity as 0.05; the average clustering coefficient of the random network obtained was 0.019, and the average path length was 2.344. The average clustering coefficient of the tourism economic network of the YRD urban agglomeration in 2016 was 0.578, and the average path length was 2.067. The average clustering coefficient of the tourism economic network of the YRD urban agglomeration in 2021 was 0.683, and the average path length was 2.108. Compared with a random network of the same size, the tourism economic network of the YRD urban agglomeration shows larger clustering coefficients and smaller average path lengths and is significantly represented by the “small world” characteristic. The average clustering coefficient increased from 0.578 to 0.683, indicating that the spatial aggregation level of the tourism economic network has been increasing, and the network cohesion is strong. The average path length increased slightly, from 2.067 to 2.108, indicating that the level of accessibility of the tourism economic network has decreased, and the network accessibility between cities in the YRD region needs to be enhanced.
The association identification of tourism economic networks through the modularity analysis and segmentation of associations is based on the weighting degree. As shown in Figure 6, the tourism economic network of the YRD urban agglomeration was mainly divided into five associations in 2016. The number of cities in the five associations is 6, 14, 5, 9 and 7, respectively. In 2021, the regional tourism economy experienced rapid recovery, the frequency of interactions between cities’ tourism economies increased and the number of tourism economy network associations consolidated from five to four. The number of cities covered by Type I, Type III and Type IV associations expanded to 10, 8 and 11, respectively; the number of cities covered by Type II associations decreased to 12; those cities covered by Type V associations were fully integrated into the other associations. It is worth noting that because the tourism economies of the cities were still affected by COVID-19 at this stage, the degree of restoration of tourism connection between different cities varied, which led to a great change in the members of each network association, and this drastic change also showed that the tourism economic network between cities within the association was not yet solid and had significant flexibility.

4.3. Factors Influencing the Tourism Economic Network

In order to further explore the influencing factors of the spatial network structure of the tourism economy, this study refers to the previous literature and selects six core variables to be analyzed through the construction of a matrix using Ucinet 6 software. Specific variable and measurement indexes are shown in Table 2, in which tourism information flow is measured with the big data of the Baidu index [70].

4.3.1. The QAP Correlation Analysis

QAP correlation analysis is based on matrix data arrangements to compare the similarity of two matrix values. Using Ucinet 6 software, the matrix data were randomly arranged 5000 times to obtain the correlation coefficients between the spatial correlation matrix of the tourism economic network of the YRD urban agglomeration and its influencing factors. The results are shown in Table 3.
Table 3 shows that the correlation coefficients of tourism information flow, tourism resource endowment, transportation convenience, urbanization level and tourism service reception capacity are significantly and positively correlated with spatial correlation at the 1% level. The industrial structure did not pass the significance test, which indicates that the industrial structure of this city has no significant correlation with spatial correlation.

4.3.2. QAP Regression Analysis

QAP regression analysis is used to explore the regression relationship between a matrix of multiple independent variables and a matrix of dependent variables. In this study, the non-significant variable (industrial structure) was deleted and the remaining five indicators with significant correlation coefficients were selected as the independent variables for QAP regression analysis. The data were randomly arranged 20,000 times using the Ucinet 6 software, and the results are shown in Table 4. According to the regression coefficients of the software and its significance test results, the following variables have a significant effect on the formation of the spatial correlation network: tourism information flow, tourism resource endowment, transportation convenience and tourism reception capacity.
The coefficients of the tourism reception capacity and tourism information flow matrix are significantly positive at the 5% level, indicating that tourism service reception capacity and tourism information flow will contribute to the formation of spatial associations. Tourism reception capacity is an important criterion for measuring the service quality of a city, which, in turn, has a significant role in driving the tourism economy [71]. In general, ordinary travel agencies will prioritize the safety and comfort of accommodations when arranging tourists’ itineraries, leading to closer tourism ties between cities with a higher tourism reception capacity [20]. Tourism information flow is a measure of the attention of city tourism networks, and the transmission of tourism information affects the aggregation and flow of tourism economic factors between cities, thus influencing the spatial pattern of the regional tourism economy [72]. In order to increase their attractiveness to tourists, tourism destinations will transmit information about tourism resources to tourists through various Internet platforms, facilitating the diffusion of tourism information flows. This diffusion of tourism information significantly enhances the attention paid by tourists to the destination which, in turn, generates more passenger flows and is crucial to the impact of inter-city tourism economic connections [52].
The spatial correlation coefficients of tourism resource endowments and transportation convenience are significantly positive at the 1% level, indicating that these factors both make a positive contribution to the formation of spatial correlations. The reason for this is that tourism resources are the core component of tourism products and the key to the tourism industry. The southern area of YRD is richer in tourism resources compared to other cities in the region and is, therefore, more attractive to residents of other cities, in terms of tourism resources; this makes it easier to generate tourism economic links with other cities. Convenient transportation is a prerequisite for promoting regional tourism cooperation, which affects the flow of people, goods, information and other elements between cities. The time–space compression effect brought about by the continuous improvement of transportation facilities meets the efficiency and convenience travel needs of tourists, reduces the resistance of tourism economic radiation and has a profound impact on regional tourism economic ties [73].
In addition, the level of urbanization fails the test of significance, indicating that there is no significant effect with the formation of a spatial correlation.

5. Discussion

The research objective of this study is to explore the spatial complexity and influencing factors of the tourism economic network in the YRD urban agglomeration. This study not only measures the strength of tourism economic ties between cities in the region, but also provides a targeted analysis of the dynamic evolution of the spatial network structure and the influencing factors.
First, from 2016 to 2021, the trend in the strength and total amount of tourism economic connections in the YRD urban agglomeration showed a significant differentiation, with the northern part showing a growth trend and the southern part showing a declining trend. This is an important finding of this study, and the findings are in line with the present reality of tourism development. The COVID-19 pandemic has led to significant impacts on inter-city tourism connections [49]. Cities with well-developed tourism economies were more affected by COVID-19 and have a harder time recovering from it. The different degrees of tourism recovery in different cities have led to significant differences in the trends of tourism economic connections and aggregates between cities in the YRD. Meanwhile, from the characteristics of total tourism economic connections, Shanghai, Wuxi, Suzhou, Nanjing and other economically developed cities have higher tourism connections, indicating that the higher the economic level of a city, the easier it is to create tourism economic connections with other cities. This verifies the hypothesis and confirms the study of Gan, Voda, Wang, Chen and Ye [9]. In terms of the structural characteristics of the overall network, the density value of the network increased slightly during the present study period, indicating an increase in intra-regional tourism economic connections. This is closely related to the significant increase in tourism economic connections between the cities of Bozhou, Fuyang, Huai’an and Lianyungang in the northern region.
Second, the results of the degree, closeness, betweenness centrality and analyses showed that the central cities of Shanghai, Wuxi, Hefei and Hangzhou show strong centrality characteristics and have a strong driving effect on the surrounding areas. During the present study period, although the intensity of the non-equilibrium of the spatial network of tourism economy in the YRD urban agglomeration was weakened, it still shows high centrality values concentrated in individual cities with developed economy and excellent transportation conditions, which is consistent with the findings of Chen, Wang, Zheng, Han and Yang [20].
Third, the tourism economic network shows an obvious core–periphery structure, and in 2016, the overall network structure developed unevenly, showing a spatial pattern of “high in the southeast and low in the northwest”. By 2021, the spatial layout pattern of the core area had not changed significantly, but some northwestern cities, such as Xuzhou, Fuyang and Anqing had become the new core area. Overall, the core area is gradually expanding, and the core cities play a radiation-driven role for the neighboring cities, which confirms the findings of Gan, Voda, Wang, Chen and Ye [9].
Finally, based on the results of the QAP regression analysis, it was found that tourism reception capacity, tourism information flow, tourism resource endowments and transportation convenience have a significant impact on tourism economic networks. These findings provide a theoretical basis for policy makers in promoting the coordinated development of regional tourism and enhancing inter-city tourism connections. Through the dynamic spatial Durbin model, Ruan and Zhang [52] found that transportation convenience and tourism reception capacity have a significant impact on tourism economic connections in the YRD urban agglomerations, which is consistent with the results of our analysis. Therefore, the results obtained through QAP regression analysis are consistent with the actual status of tourism development in the YRD region. However, it is worth noting that the YRD is a typical region in China where human–land conflicts are prominent, and strong economic power is accompanied by continuous ecological pollution [50]. Therefore, the existing ecological carrying capacity of the region should be fully considered in any development of tourism resources, construction of tourism facilities and development of scenic spots. The construction of tourism facilities needs to strictly control the scale of tourism so as not to cause damage to the regional ecological environment.

5.1. Theoretical Implications

This study has several important theoretical implications. First, in terms of research methodology, this study used the modified gravity model to calculate the intensity of tourism economic connections between regions. Tourism revenue, the number of tourists and the geographical distance between regions were selected to reflect the degree of tourism economic interactions between different cities, and the modified constant was constructed with GDP per capita as the core to build a spatial tourism economic connection matrix, which makes up for the shortcomings of the traditional gravity model in terms of direction and precision. Secondly, this study adopts the social network analysis method, using the Ucinet 6 and Gephi software to dynamically analyze the characteristics of the tourism economic network structure and its influencing factors from the perspective of network structure, which enriches the study of tourism spatial network. Finally, this study incorporates COVID-19 into the research time range, fully revealing the state of the tourism economic network in the face of the impact of COVID-19, which makes up for the shortcomings of the research in this field in terms of time selection.

5.2. Policy Recommendations

This study provides an important reference for the government to identify the roles and functions of cities in the regional tourism economic development network at the macro level, which is conducive to the targeted follow-up tourism economic cooperation and connections among cities in different regions. The following countermeasures are proposed in conjunction with the research results:
First of all, combined with the spatial distribution characteristics of the tourism economic network, the spillover effect of the tourism economy of the dominant cities should be brought into play. It is necessary to continue to maintain the central position of Shanghai, Wuxi, Hefei, Hangzhou and other cities, to give full play to their agglomeration and diffusion effects in the regional tourism economic network and to reduce the divergence of tourism interests between regions. It is necessary to actively break down regional administrative barriers and explore cross-regional tourism cooperation mechanisms. Through the establishment of a mechanism for sharing the benefits of tourism development, it will promote the rapid flow of tourism economic factors such as talents, technology, capital and information among different cities so as to enhance the tourism economic ties between cities, alleviate the imbalance in tourism economic development and create a new pattern of tourism economic development that is mutually beneficial and win–win.
Second, it is necessary to emphasize the role of tourism information flow in promoting the spatial network of regional tourism economic ties. It is necessary to actively promote the in-depth integration of tourism and big data and to implement the strategy of tourism informatization. The government, industry organizations and enterprises should make joint efforts to build a tourism information-sharing platform and a tourism information database and make use of the monitoring and feedback of big data to strengthen the dynamic assessment and trend prediction of regional tourism attractiveness. At the same time, tourism destinations should pay attention to changes in tourism consumer demand in a timely manner with the help of the Internet information platform, develop more targeted and effective tourism marketing strategies and stimulate potential travelers in different cities to generate tourism concerns and tourism demand through a proliferation of tourism information so as to enhance tourism economic ties with other cities.
Third, the correlation between transportation convenience and tourism economic network should be fully considered to provide targeted development countermeasures for cities with different power roles. Marginal cities such as Lianyungang, Bozhou and Huaibei should enhance the degree of embeddedness in the transportation network, continuously improve the tourism transportation conditions and strive to establish long-term tourism cooperation mechanisms with core cities such as Shanghai, Wuxi and Hangzhou. Cities with well-developed transportation locations should combine their established advantages, integrate tourism resources, extend tourism routes, expand tourism development markets, realize the expansion of the scope of tourism industry clusters and enhance the efficiency of regional tourism economic ties.
Finally, although the endowment of tourism resources and the reception capacity of tourism services will have a significant impact on the regional tourism economic network, it is important to fully recognize the pressure on the regional tourism ecological environment caused by their development and construction. Under the premise of protecting the environment, it is necessary to develop tourism resources moderately, improve tourism service facilities and enhance the tourism attraction and service quality of tourism destinations for tourists, thus promoting the strengthening of tourism economic connections.

6. Conclusions

This study measured the intensity of tourism economic connections among 41 cities in the YRD from 2016 to 2021 using a constructed modified gravity model and explored the spatial structure of the tourism economic network of the YRD urban agglomeration and its influencing factors through the application of social network analysis. Finally, the following conclusions were drawn:
  • The spatial network of the tourism economy during the study period is characterized by obvious non-equilibrium; however, the intensity of non-equilibrium was weakened, and the degree of tourism economic connections was stronger in economically developed cities. The changes in the spatial patterns of the intensity and total amount of tourism economic connections between cities varied greatly, with the northern region showing growth, and, in contrast, the southern region showing a decline.
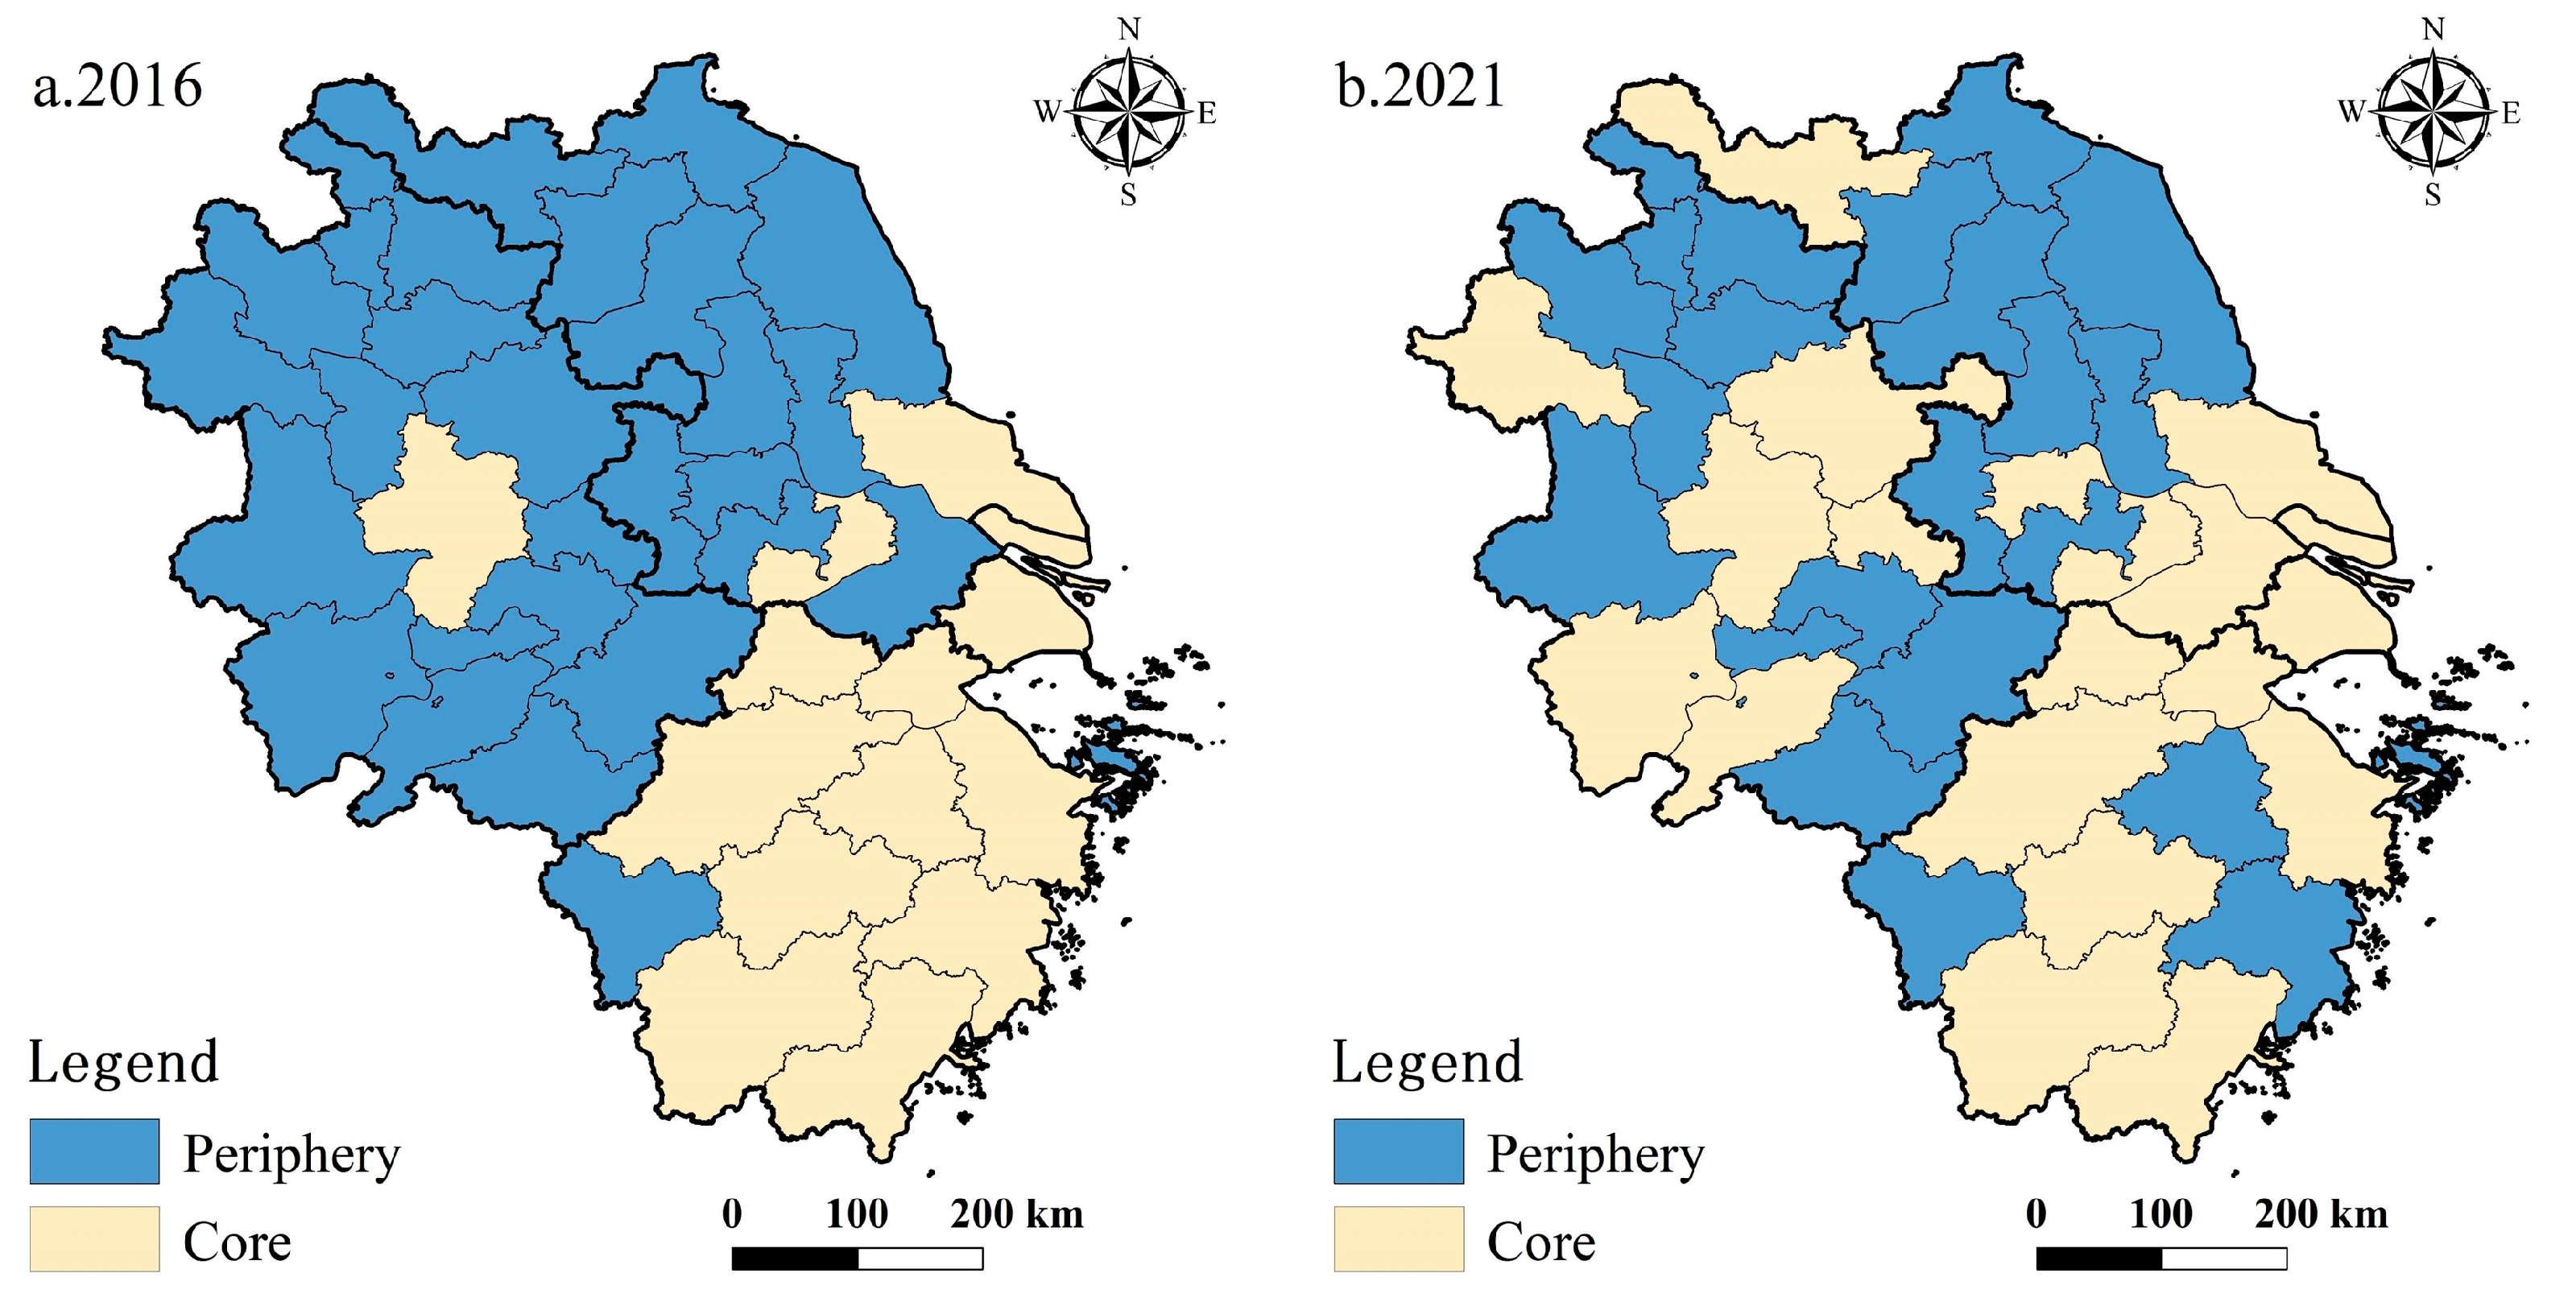
  • The tightness of the tourism economic network structure was slightly strengthened, and the tourism economic interaction between cities became tighter. The degree of centrality increased, with Shanghai, Wuxi, Hefei and Hangzhou, as economically developed central cities, showing a strong radiation effect and a strong driving effect on the surrounding areas. The spatial network of the tourism economy presents a clear core–periphery distribution pattern, with the core area expanding from 13 in 2016 to 19 in 2021. Most of the cities in the eastern part of the YRD belong to the absolute core area, while the northern cities, such as Lianyungang, Bozhou and Huaibei, have always been on the periphery, which belongs to the absolute peripheral area.
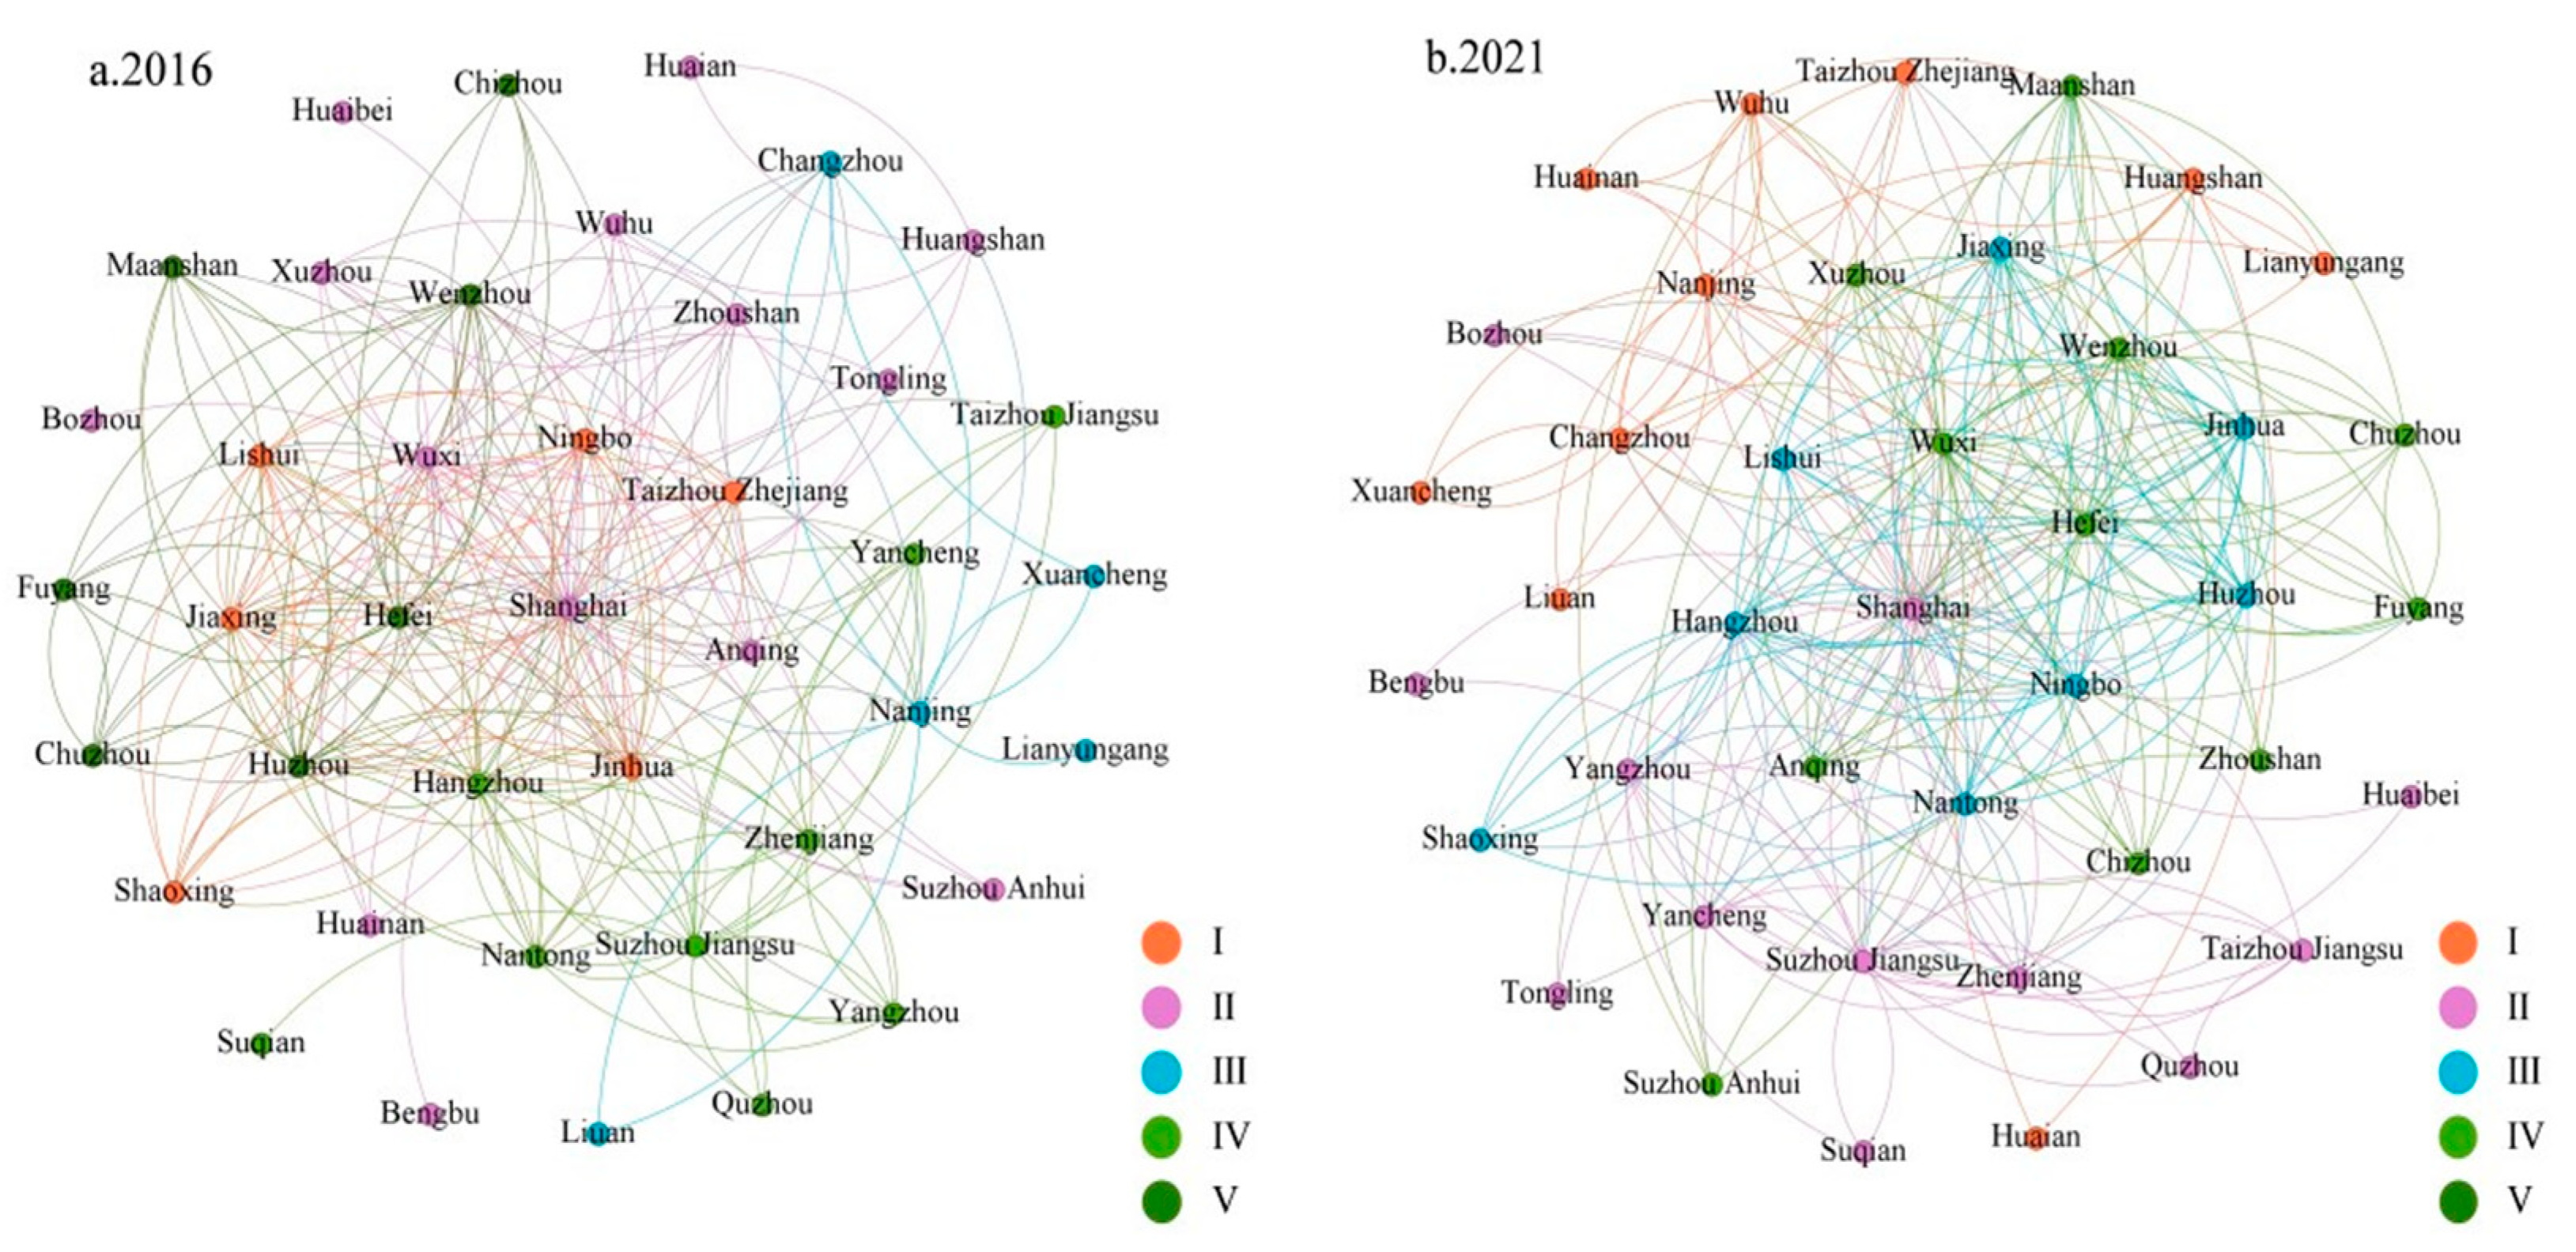
  • The “small world” characteristic is significant; the cohesion level of the tourism economic network of the YRD urban agglomerations is enhanced. In the period 2016–2021, the five associations evolved into four associations, and the tourism economic network between cities within the associations has significant flexibility.
  • The results of QAP regression analysis show that tourism reception capacity, tourism information flow, tourism resource endowment and transportation accessibility make a significant contribution to the formation of the spatial network of tourism economy among cities.
This study explores the structural characteristics and influencing factors of the tourism economic network of the YRD urban agglomeration, and the results can provide a theoretical basis for the optimization of the tourism economic network and the scientific decision-making underlying tourism economic cooperation. However, there are still some limitations to this study which can be further improved in the following aspects. First, due to the limitations regarding data availability, this study only selected data from 2016 to 2021 and failed to analyze the evolutionary pattern of the tourism economic network of the YRD urban agglomerations over a longer period of time. Second, the study area of this study was limited to only the YRD region, and subsequent studies should be conducted on a larger scale, including areas such as the Yangtze River Basin or the Yellow River Basin, to further expand the scope of the study and the sample size in order to enhance the generalizability of the results. In addition, the factors affecting the urban tourism economic network are multifaceted, and this study only studied six aspects: tourism information flow, tourism resource endowments, transportation convenience, urbanization level, industrial structures and tourism reception capacity. The next step in this research should increase the number of influencing factors to enhance the scientific nature of the research. Finally, this study used QAP regression analysis to explore the influencing factors of tourism economic network structure, which can be further explored with spatial econometric modeling, GTWR modeling and other methods in order to validate and supplement the research results of this study accordingly.

Author Contributions

Writing—original draft preparation, X.F.; writing—review and editing, X.F. and C.P.; visualization, X.F.; supervision, F.X. All authors have read and agreed to the published version of the manuscript.

Funding

This research received no external funding.

Institutional Review Board Statement

Not applicable.

Informed Consent Statement

Not applicable.

Data Availability Statement

Data are available for use upon request.

Conflicts of Interest

The authors declare no conflicts of interest.

Correction Statement

This article has been republished with a minor correction to the readability of figure 1. This change does not affect the scientific content of the article.

References

  1. Dogru, T.; Bulut, U. Is tourism an engine for economic recovery? Theory and empirical evidence. Tour. Manag. 2018, 67, 425–434. [Google Scholar] [CrossRef]
  2. Li, S.; Liu, A.; Song, H. Does tourism support supply-side structural reform in China? Tour. Manag. 2019, 71, 305–314. [Google Scholar] [CrossRef]
  3. Aleksanyan, G.P. The concept of tourism destination in the context of geographical space. Proc. YSU C Geol. Geogr. Sci. 2020, 54, 203–210. [Google Scholar] [CrossRef]
  4. Ma, L.; Long, Y. The spatial correlation of economic growth of inbound tourism in China based on social network analysis. Sci. Geogr. Sin. 2017, 37, 1705–1711. [Google Scholar] [CrossRef]
  5. Leiper, N. The framework of tourism: Towards a definition of tourism, tourist, and the tourist industry. Ann. Tour. Res. 1979, 6, 390–407. [Google Scholar] [CrossRef]
  6. Kim, Y.R.; Williams, A.M.; Park, S.; Chen, J.L. Spatial spillovers of agglomeration economies and productivity in the tourism industry: The case of the UK. Tour. Manag. 2021, 82, 104201. [Google Scholar] [CrossRef]
  7. Yin, P.; Lin, Z.; Prideaux, B. The impact of high-speed railway on tourism spatial structures between two adjoining metropolitan cities in China: Beijing and Tianjin. J. Transp. Geogr. 2019, 80, 102495. [Google Scholar] [CrossRef]
  8. Hua, H.; Wondirad, A. Tourism Network in Urban Agglomerated Destinations: Implications for Sustainable Tourism Destination Development through a Critical Literature Review. Sustainability 2021, 13, 285. [Google Scholar] [CrossRef]
  9. Gan, C.; Voda, M.; Wang, K.; Chen, L.; Ye, J. Spatial network structure of the tourism economy in urban agglomeration: A social network analysis. J. Hosp. Tour. Manag. 2021, 47, 124–133. [Google Scholar] [CrossRef]
  10. Liu, B.; Huang, S.; Fu, H. An application of network analysis on tourist attractions: The case of Xinjiang, China. Tour. Manag. 2017, 58, 132–141. [Google Scholar] [CrossRef]
  11. Kirilenko, A.P.; Stepchenkova, S.O.; Hernandez, J.M. Comparative clustering of destination attractions for different origin markets with network and spatial analyses of online reviews. Tour. Manag. 2019, 72, 400–410. [Google Scholar] [CrossRef]
  12. Pavlovich, K. The evolution and transformation of a tourism destination network: The Waitomo Caves, New Zealand. Tour. Manag. 2003, 24, 203–216. [Google Scholar] [CrossRef]
  13. Asero, V.; Gozzo, S.; Tomaselli, V. Building tourism networks through tourist mobility. J. Travel Res. 2016, 55, 751–763. [Google Scholar] [CrossRef]
  14. D’Agata, R.; Gozzo, S.; Tomaselli, V. Network analysis approach to map tourism mobility. Qual. Quant. 2013, 47, 3167–3184. [Google Scholar] [CrossRef]
  15. Hwang, D.; Chi, S.-H.; Lee, B. Collective action that influences tourism: Social structural approach to community involvement. J. Hosp. Tour. Res. 2016, 40, 497–515. [Google Scholar] [CrossRef]
  16. Mou, N.; Zheng, Y.; Makkonen, T.; Yang, T.; Tang, J.J.; Song, Y. Tourists’ digital footprint: The spatial patterns of tourist flows in Qingdao, China. Tour. Manag. 2020, 81, 104151. [Google Scholar] [CrossRef]
  17. Seok, H.; Barnett, G.A.; Nam, Y. A social network analysis of international tourism flow. Qual. Quant. 2021, 55, 419–439. [Google Scholar] [CrossRef]
  18. He, J.; Li, C.; Yu, Y.; Liu, Y.; Huang, J. Measuring urban spatial interaction in Wuhan Urban Agglomeration, Central China: A spatially explicit approach. Sustain. Cities. Soc. 2017, 32, 569–583. [Google Scholar] [CrossRef]
  19. Wang, K.; Gan, C.; Yang, Y.; Zhang, S. Evolution and driving factors of urban tourism economic network structure in urban agglomeration in the middle reaches of the Yangtze River. Geogr. Geo-Inf. Sci. 2019, 35, 118–125. [Google Scholar] [CrossRef]
  20. Chen, X.; Wang, T.; Zheng, X.; Han, F.; Yang, Z. The structure and evolution of the tourism economic network of the Tibetan Plateau and its driving factors. Land 2022, 11, 241. [Google Scholar] [CrossRef]
  21. Zhang, L.; Marzuki, A.; Liao, Z.; Zhao, K.; Huang, Z.; Chen, W. Spatial and temporal evolution of Guangdong tourism economic network structure from the perspective of social networks. Heliyon 2023, 9, e18570. [Google Scholar] [CrossRef]
  22. Xue, Q.; Yang, X.; Wu, F. A three-stage hybrid model for the regional assessment, spatial pattern analysis and source apportionment of the land resources comprehensive supporting capacity in the Yangtze River Delta urban agglomeration. Sci. Total Environ. 2020, 711, 134428. [Google Scholar] [CrossRef]
  23. Yang, Y.; Fik, T.; Zhang, J. Modeling sequential tourist flows: Where is the next destination? Ann. Tour. Res. 2013, 43, 297–320. [Google Scholar] [CrossRef]
  24. Santana-Gallego, M.; Ledesma-Rodríguez, F.J.; Pérez-Rodríguez, J.V. International trade and tourism flows: An extension of the gravity model. Econ. Model. 2016, 52, 1026–1033. [Google Scholar] [CrossRef]
  25. Cehan, A.; Eva, M.; Iațu, C. A multilayer network approach to tourism collaboration. J. Hosp. Tour. Manag. 2021, 46, 316–326. [Google Scholar] [CrossRef]
  26. Tran, M.T.T.; Jeeva, A.S.; Pourabedin, Z. Social network analysis in tourism services distribution channels. Tour. Manag. Perspect. 2016, 18, 59–67. [Google Scholar] [CrossRef]
  27. Kim, Y.-R.; Scott, N. Network dynamics of tourism development in South Korea. Curr. Issues Tour. 2018, 21, 1239–1259. [Google Scholar] [CrossRef]
  28. Buhalis, D.; Molinaroli, E. Entrepreneurial networks and supply communities in the Italian eTourism. Inf. Technol. Tour. 2002, 5, 175–184. [Google Scholar] [CrossRef]
  29. Pavlovich, K. A rhizomic approach to tourism destination evolution and transformation. Tour. Manag. 2014, 41, 1–8. [Google Scholar] [CrossRef]
  30. Kelliher, F.; Reinl, L.; Johnson, T.G.; Joppe, M. The role of trust in building rural tourism micro firm network engagement: A multi-case study. Tour. Manag. 2018, 68, 1–12. [Google Scholar] [CrossRef]
  31. Wang, S.; Xu, X.; Ma, J. Spatial and temporal evolution of the tourism economy network in Xinjiang: Based on modified gravity model and social network analysis. Arid. Land Geogr. 2020, 43, 458–465. [Google Scholar]
  32. Wang, J.; Xia, J. Study on the spatial network structure of the tourism economy in China and its influencing factors: Investigation of QAP method. Tour. Trib. 2018, 33, 13–25. [Google Scholar]
  33. Wang, K.; Wang, M.; Gan, C.; Chen, Q.; Voda, M. Tourism economic network structural characteristics of national parks in the central region of China. Sustainability 2021, 13, 4805. [Google Scholar] [CrossRef]
  34. Kang, S.; Lee, G.; Kim, J.; Park, D. Identifying the spatial structure of the tourist attraction system in South Korea using GIS and network analysis: An application of anchor-point theory. J. Dest. Mark. Manag. 2018, 9, 358–370. [Google Scholar] [CrossRef]
  35. Stienmetz, J.L.; Fesenmaier, D.R. Estimating value in Baltimore, Maryland: An attractions network analysis. Tour. Manag. 2015, 50, 238–252. [Google Scholar] [CrossRef]
  36. Zhong, Y.; Feng, X.; Wen, Y. The evolvement and driving mechanism of economic network structure in the Changjiang River Economic Zone. Sci. Geogr. Sin. 2016, 36, 10–19. [Google Scholar] [CrossRef]
  37. Dejean, S. The role of distance and social networks in the geography of crowdfunding: Evidence from France. Reg. Stud. 2020, 54, 329–339. [Google Scholar] [CrossRef]
  38. Yu, H.; Lu, L.; Zhu, D.; Zeng, Q. Urban tourism to urban agglomeration tourism: A deepening systematic research. Prog. Geogr. 2012, 31, 1087–1096. [Google Scholar] [CrossRef]
  39. Shi, Q.; Xie, Y.; Han, Z.; Liu, T.; Liu, G.; Du, P. Spatial structure and spatial development patterns of urban tourism economic connections in northeast China. Econ. Geogr. 2018, 38, 211–219. [Google Scholar] [CrossRef]
  40. Zhang, H.; Xia, M. Research on tourism spatial structure of Anhui Province—Based on tourism centrality degrees and tourism economic contact. Econ. Geogr. 2011, 31, 2116–2121. [Google Scholar] [CrossRef]
  41. Yang, L.; Liu, N.; Bai, C. The spatial structure of the tourism economy in Beijing-Tianjin-Hebei-Xiongan region. Sci. Geogr. Sin. 2018, 38, 394–401. [Google Scholar] [CrossRef]
  42. Wang, B.; Wu, Q.; Luo, J. Structure and evolution of tourism economy network in Wuhan metropolitan area. Econ. Geogr. 2015, 35, 192–197. [Google Scholar] [CrossRef]
  43. Wang, D.-g.; Niu, Y.; Qian, J. Evolution and optimization of China’s urban tourism spatial structure: A high speed rail perspective. Tour. Manag. 2018, 64, 218–232. [Google Scholar] [CrossRef]
  44. Xie, W.; Li, H.; Yin, Y. Research on the Spatial Structure of the European Union’s Tourism Economy and Its Effects. Int. J. Environ. Res. Public. Health 2021, 18, 1389. [Google Scholar] [CrossRef] [PubMed]
  45. Baggio, R.; Scott, N.; Cooper, C. Network science: A Review Focused on Tourism. Ann. Tour. Res. 2010, 37, 802–827. [Google Scholar] [CrossRef]
  46. Sørensen, F. The Geographies of Social Networks and Innovation in Tourism. Tour. Geogr. 2007, 9, 22–48. [Google Scholar] [CrossRef]
  47. Ibragimov, K.; Perles-Ribes, J.F.; Ramón-Rodríguez, A.B. The economic determinants of tourism in Central Asia: A gravity model applied approach. Tour. Econ. 2022, 28, 1749–1768. [Google Scholar] [CrossRef]
  48. Bai, J.; Chen, Y.; Long, Y. The structural equivalence of tourism cooperative network in the Belt and Road Initiative Area. Environ. Res. 2021, 197, 111043. [Google Scholar] [CrossRef] [PubMed]
  49. Gafter, L.; Tchetchik, A.; Shilo, S. Urban resilience as a mitigating factor against economically driven out-migration during COVID-19: The case of Eilat, a tourism-based city. Cities 2022, 125, 103636. [Google Scholar] [CrossRef]
  50. Ma, X.; Sun, B.; Hou, G.; Zhong, X.; Li, L. Evaluation and spatial effects of tourism ecological security in the Yangtze River Delta. Ecol. Indic. 2021, 131, 108190. [Google Scholar] [CrossRef]
  51. Ruan, W.; Li, Y.; Zhang, S.; Liu, C.-H. Evaluation and drive mechanism of tourism ecological security based on the DPSIR-DEA model. Tour. Manag. 2019, 75, 609–625. [Google Scholar] [CrossRef]
  52. Ruan, W.; Zhang, S. Can tourism information flow enhance regional tourism economic linkages? J. Hosp. Tour. Manag. 2021, 49, 614–623. [Google Scholar] [CrossRef]
  53. Li, Y.; Li, R.; Ruan, W.; Liu, C.-H. Research of the effect of tourism economic contact on the efficiency of the tourism industry. Sustainability 2020, 12, 5652. [Google Scholar] [CrossRef]
  54. Zheng, B.; Liu, A.; Han, J.; Ming, Q.Z.Z. The Structural Evolution of Yunnan Tourism Economic Contact Network and the Construction of Cooperative Development Model. Econ. Geogr. 2021, 41, 222–231. [Google Scholar] [CrossRef]
  55. Blatnik, P.; Bojnec, Š. Optimal Network of General Hospitals in Slovenia. Int. J. Environ. Res. Public. Health 2023, 20, 4235. [Google Scholar] [CrossRef] [PubMed]
  56. Shao, H.; Wang, Z. Spatial network structure of transportation carbon emission efficiency in China and its influencing factors. Chin. J. Popul. Resour. Environ. 2021, 19, 295–303. [Google Scholar] [CrossRef]
  57. Bai, C.; Zhou, L.; Xia, M.; Feng, C. Analysis of the spatial association network structure of China’s transportation carbon emissions and its driving factors. J. Environ. Manag. 2020, 253, 109765. [Google Scholar] [CrossRef]
  58. Li, S.; Garces, E.; Daim, T. Technology forecasting by analogy-based on social network analysis: The case of autonomous vehicles. Technol. Forecast. Soc. Change 2019, 148, 119731. [Google Scholar] [CrossRef]
  59. Liu, W.; Tao, Y.; Yang, Z.; Bi, K. Exploring and visualizing the patent collaboration network: A case study of smart grid field in China. Sustainability 2019, 11, 465. [Google Scholar] [CrossRef]
  60. Yin, C.; Gu, H.; Zhang, S. Measuring technological collaborations on carbon capture and storage based on patents: A social network analysis approach. J. Clean. Prod. 2020, 274, 122867. [Google Scholar] [CrossRef]
  61. Borgatti, S.P.; Everett, M.G.; Freeman, L.C. Ucinet for Windows: Software for Social Network Analysis; Analytic Technologies: Harvard, MA, USA, 2002; Volume 6. [Google Scholar]
  62. Bastian, M.; Heymann, S.; Jacomy, M. Gephi: An Open Source Software for Exploring and Manipulating Networks. In Proceedings of the International AAAI Conference on Web and Social Media, San Jose, CA, USA, 17–20 May 2009; Volume 3, pp. 361–362. [Google Scholar] [CrossRef]
  63. Freeman, L.C. Centrality in social networks conceptual clarification. Soc. Netw. 1978, 1, 215–239. [Google Scholar] [CrossRef]
  64. Baggio, R. Tourism destinations: A universality conjecture based on network science. Ann. Tour. Res. 2020, 82, 102929. [Google Scholar] [CrossRef]
  65. Wang, F.; Gao, M.; Liu, J.; Fan, W. The spatial network structure of China’s regional carbon emissions and its network effect. Energies 2018, 11, 2706. [Google Scholar] [CrossRef]
  66. Csermely, P.; London, A.; Wu, L.-Y.; Uzzi, B. Structure and dynamics of core/periphery networks. J. Complex. Netw. 2013, 1, 93–123. [Google Scholar] [CrossRef]
  67. Yang, J.; Zhang, M.; Shen, K.N.; Ju, X.; Guo, X. Structural correlation between communities and core-periphery structures in social networks: Evidence from Twitter data. Expert Syst. Appl. 2018, 111, 91–99. [Google Scholar] [CrossRef]
  68. Ma, H.; Hu, X. Regionalization of scientific and technological innovation in China:From the perspective of urban network. Acta. Geogr. Sin. 2022, 77, 3104–3124. [Google Scholar] [CrossRef]
  69. Kim, A.C.H.; Newman, J.I.; Kwon, W. Developing community structure on the sidelines: A social network analysis of youth sport league parents. Soc. Sci. J. 2020, 57, 178–194. [Google Scholar] [CrossRef]
  70. Yang, T.; Ruan, W.; Zhang, S.; Li, Y. The influence of the COVID-19 pandemic on tourism demand for destinations: An analysis of spatial heterogeneity from a multi-scale perspective. Asia Pac. J. Tour. Res. 2021, 26, 793–810. [Google Scholar] [CrossRef]
  71. Zhou, Z.; Huang, Y.; Hsu, M.K. Using Data Envelopment Analysis to Evaluate Efficiency: An Exploratory Study of the Chinese Hotel Industry. J. Qual. Assur. Hosp. Tour. 2008, 9, 240–256. [Google Scholar] [CrossRef]
  72. Marrocu, E.; Paci, R. Different tourists to different destinations. Evidence from spatial interaction models. Tour. Manag. 2013, 39, 71–83. [Google Scholar] [CrossRef]
  73. Pan, Y.; An, Z.; Li, J.; Weng, G.; Li, L. Spatiotemporal Characteristics and Determinants of Tourism Cooperation Network in Beijing–Tianjin–Hebei Region. Sustainability 2023, 15, 4355. [Google Scholar] [CrossRef]
Figure 1. The location of the YRD urban agglomeration.
Tourismhosp 05 00005 g001
Figure 2. Tourism economic connection of the YRD urban agglomeration ((a) 2016, (b) 2021).
Tourismhosp 05 00005 g002
Figure 3. Spatial network density of overall tourism economic connection in YRD urban agglomeration ((a) 2016, (b) 2021).
Tourismhosp 05 00005 g003
Figure 4. Centrality of tourism economic connection network of the YRD urban agglomeration (2016, 2021). (a) Degree Centrality 2016, (b) Degree Centrality 2021, (c) Closeness Centrality 2016, (d) Closeness Centrality 2021, (e) Betweenness Centrality 2016, (f) Betweenness Centrality 2021.
Tourismhosp 05 00005 g004
Figure 5. Core-periphery structure of tourism economic connection in the YRD urban agglomeration (a) 2016, (b) 2021.
Tourismhosp 05 00005 g005
Figure 6. Structure of tourism economic network associations in the YRD urban agglomeration; (a) 2016, (b) 2021.
Tourismhosp 05 00005 g006
Table 1. Network core–periphery density matrix.
Area20162021
CorePeripheryCorePeriphery
Core0.7690.1260.4800.091
Periphery0.1430.0570.1120.071
Table 2. Variable and measurement indexes.
VariableMeasurement IndexesReferences
Tourism information flowBaidu search index[52]
Tourism resource endowmentsA-level attractions[20]
Transportation convenienceRoad density[20]
Urbanization levelUrbanization rate[52]
Industrial structuresThe percentage of total tourism revenue in GDP[56]
Tourism reception capacityStar-rated hotels[52]
Table 3. QAP correlation analysis.
CoefficientSignificance
Tourism information flow0.2790.001
Tourism resource endowments0.2740.001
Transportation convenience0.3510.000
Urbanization level0.3120.007
Industrial structures.−0.2610.124
Tourism reception capacity0.3720.001
Table 4. QAP regression analysis.
UnstandardizedStandardizedSignificance
CoefficientCoefficient
Tourism information flow0.1510.1290.012
Tourism resource endowments0.6850.1640.002
Transportation convenience0.7930.1760.006
Urbanization level0.4170.0800.124
Tourism reception capacity0.9190.2130.019
Intercept0.285
R20.369
AdjR20.363
Disclaimer/Publisher’s Note: The statements, opinions and data contained in all publications are solely those of the individual author(s) and contributor(s) and not of MDPI and/or the editor(s). MDPI and/or the editor(s) disclaim responsibility for any injury to people or property resulting from any ideas, methods, instructions or products referred to in the content.

