
Compete or Avoid? Assessing Brand Competition Strategies with Spatial Colocation Analysis


Abstract
1. Introduction
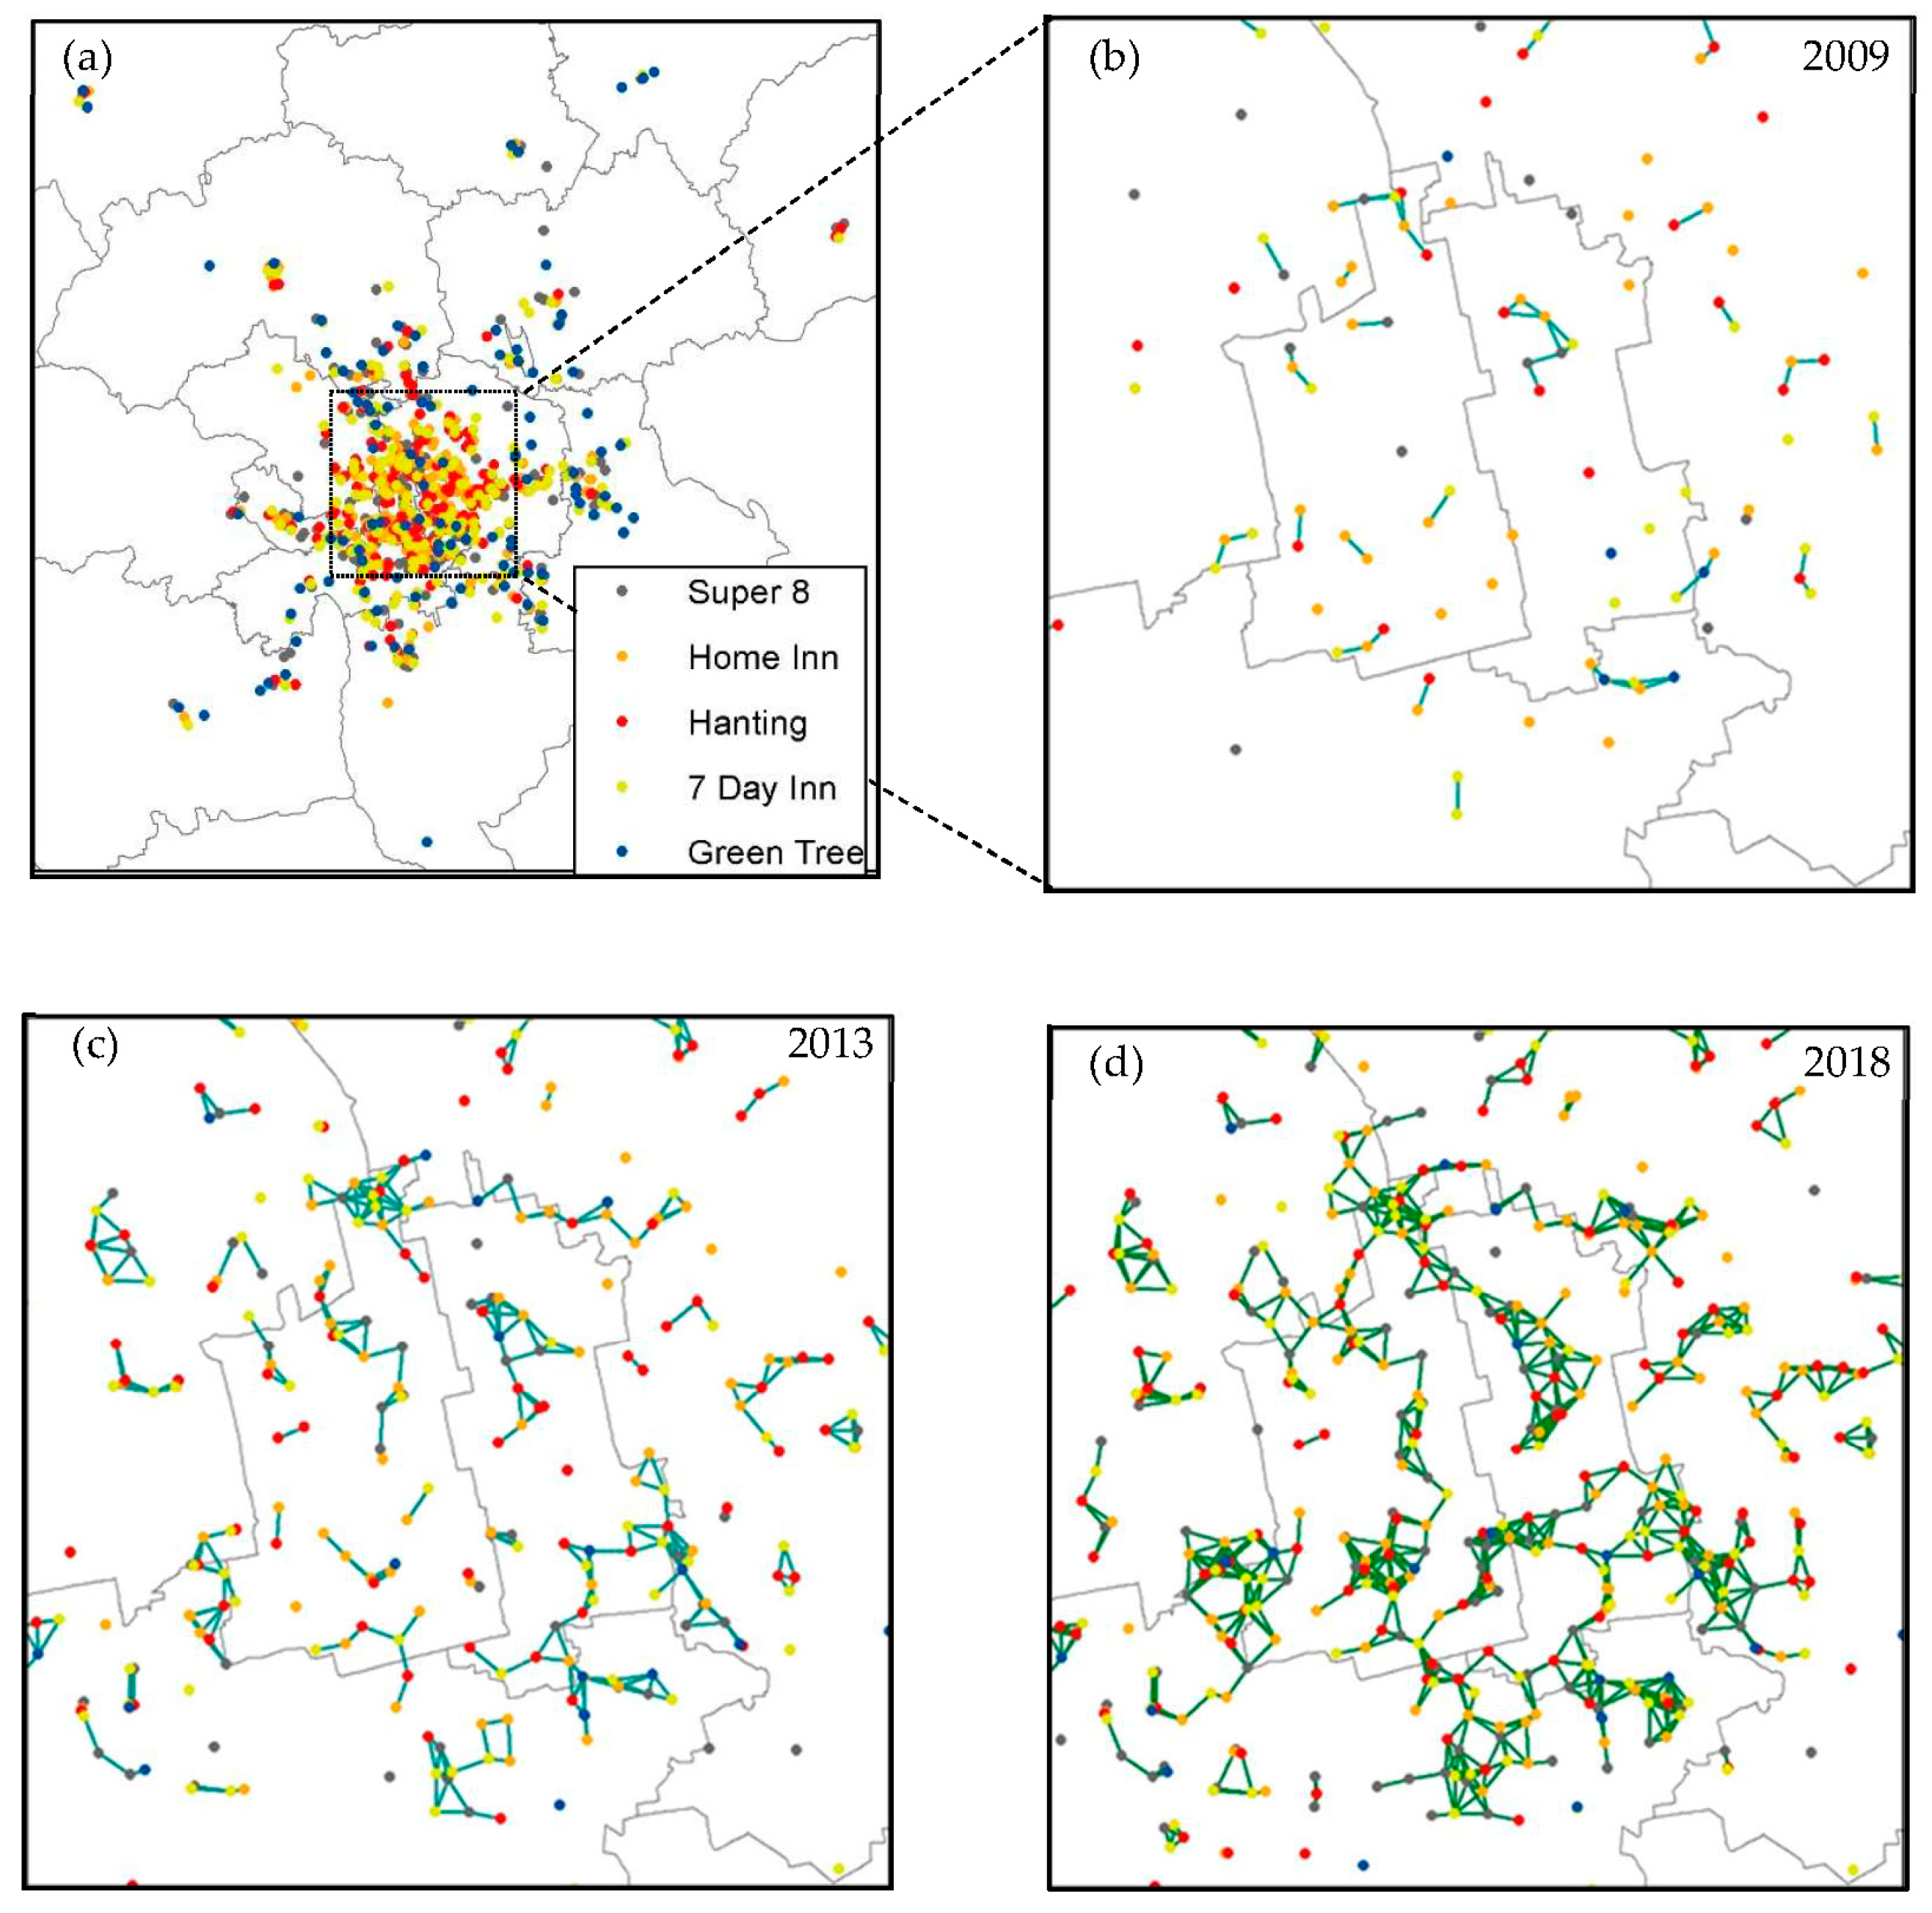
2. Data
3. Method
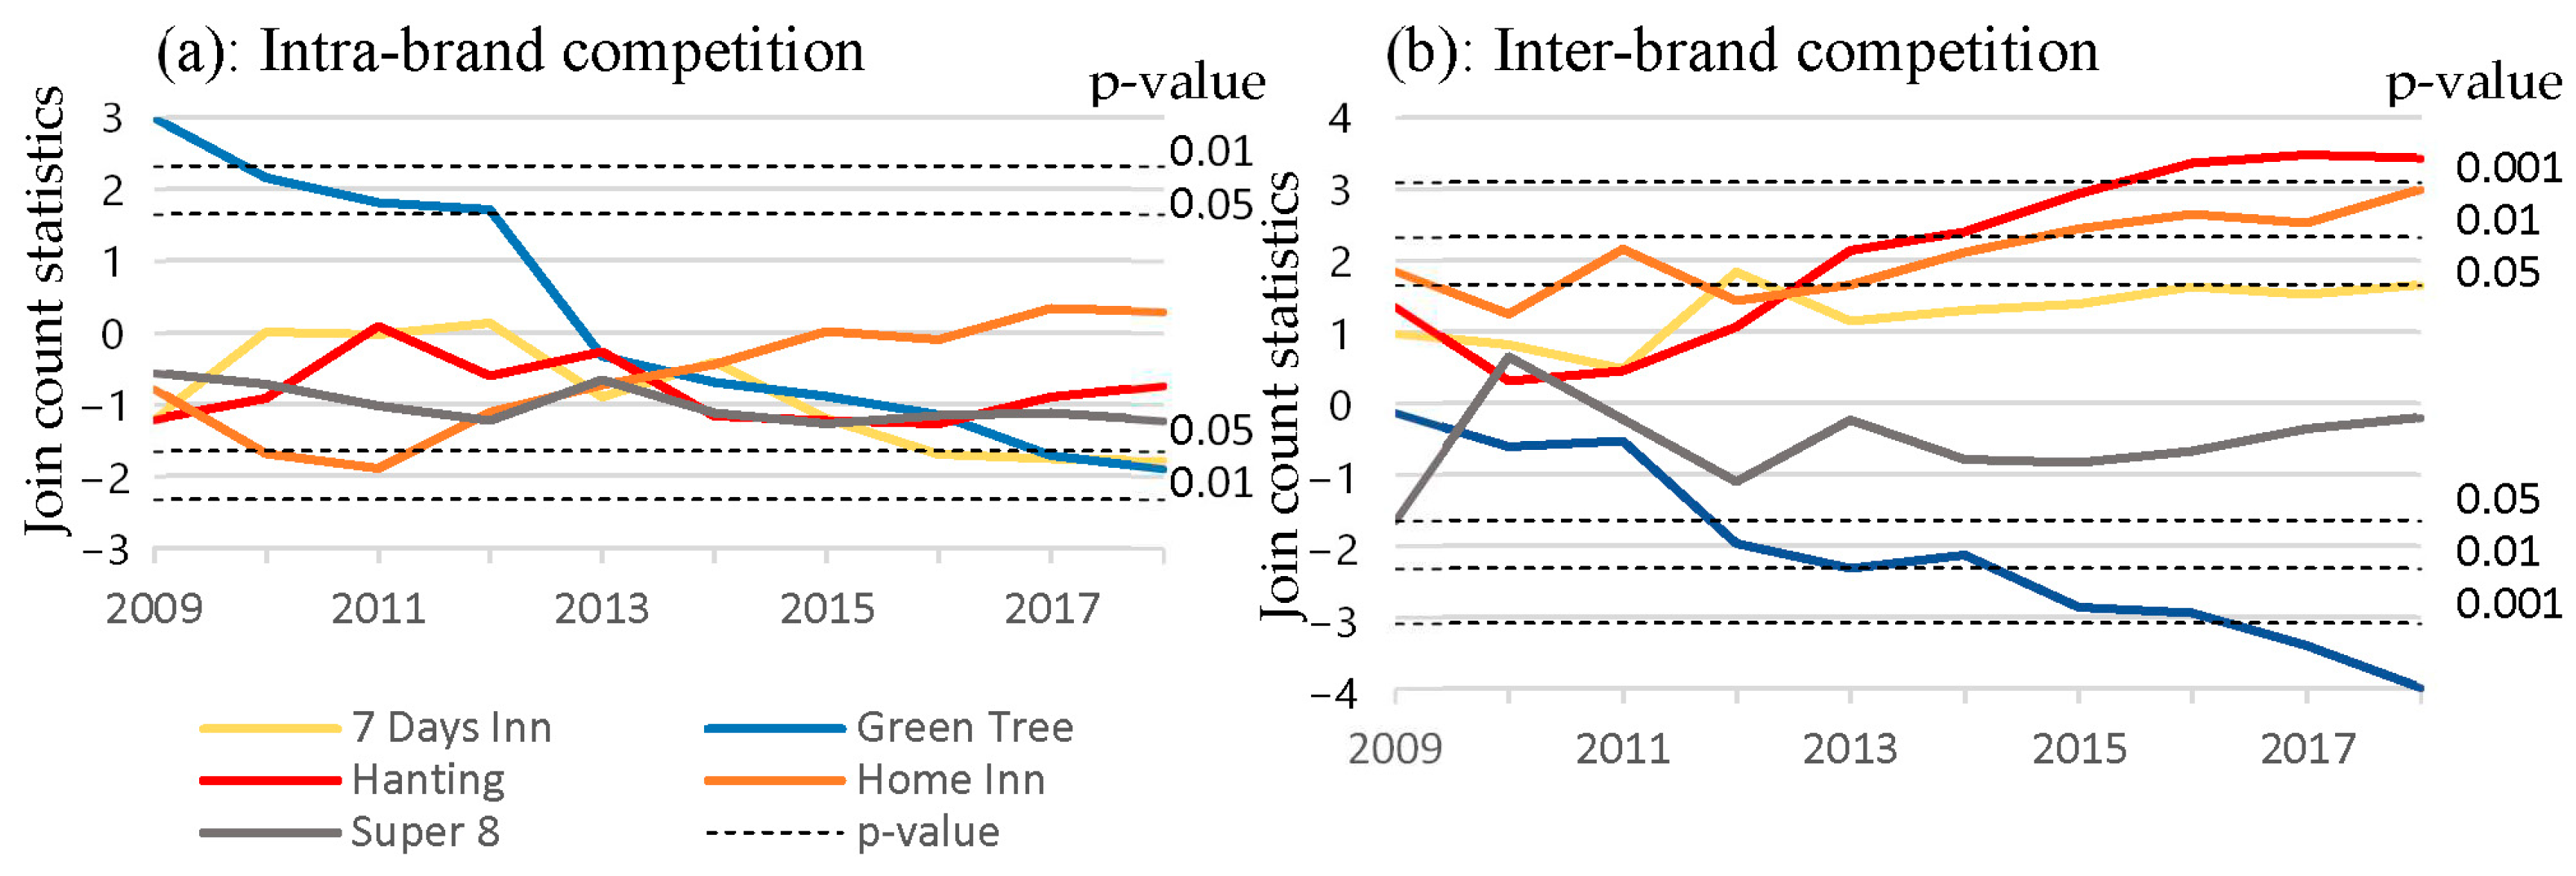
4. Results
5. Conclusions
Author Contributions
Funding
Data Availability Statement
Conflicts of Interest
References
- Dasci, A.; Laporte, G. A continuous model for multistore competitive location. Oper. Res. 2005, 53, 263–280. [Google Scholar] [CrossRef]
- Tavitiyaman, P.; Qu, H.; Zhang, H.Q. The impact of industry force factors on resource competitive strategies and hotel performance. Int. J. Hosp. Manag. 2011, 30, 648–657. [Google Scholar] [CrossRef]
- Qin, J.; Qin, Y.; Liu, C. Location and regionalization patterns of hotel chains: Evidence from China. Tour. Geogr. 2023, 25, 729–755. [Google Scholar] [CrossRef]
- Canina, L.; Enz, C.A.; Harrison, J.S. Agglomeration effects and strategic orientations: Evidence from the US lodging industry. Acad. Manag. J. 2005, 48, 565–581. [Google Scholar] [CrossRef]
- Woo, L.; Mun, S.G. Types of agglomeration effects and location choices of international hotels in an emerging market. Tour. Manag. 2020, 77, 104034. [Google Scholar] [CrossRef]
- Kalnins, A. An empirical analysis of territorial encroachment within franchised and company-owned branded chains. Mark. Sci. 2004, 23, 476–489. [Google Scholar] [CrossRef]
- Kim, T.T.; Jap, S.D. Can Encroachment Benefit Hotel Franchisees? J. Mark. 2022, 86, 147–165. [Google Scholar] [CrossRef]
- Chan, W.W.; Ni, S. Growth of budget hotels in China: Antecedents and future. Asia Pac. J. Tour. Res. 2011, 16, 249–262. [Google Scholar] [CrossRef]
- Zhao, J. (Ed.) The Hospitality and Tourism Industry in China: New Growth, Trends, and Developments; CRC Press: Boca Raton, FL, USA, 2018. [Google Scholar]
- Braha, D.; Stacey, B.; Bar-Yam, Y. Corporate competition: A self-organized network. Soc. Netw. 2011, 33, 219–230. [Google Scholar] [CrossRef]
- Guizzardi, A.; Pons, F.M.E.; Ranieri, E. Competition patterns, spatial and advance booking effects in the accommodation market online. Tour. Manag. 2019, 71, 476–489. [Google Scholar] [CrossRef]
- Fang, L.; Xie, Y.; Yao, S.; Liu, T. Agglomeration and/or differentiation at regional scale? Geographic spatial thinking of hotel distribution—A case study of Guangdong, China. Curr. Issues Tour. 2021, 24, 1358–1374. [Google Scholar] [CrossRef]
- Woo, L.; Assaf, A.G.; Josiassen, A.; Kock, F. Internationalization and hotel performance: Agglomeration-related moderators. Int. J. Hosp. Manag. 2019, 82, 48–58. [Google Scholar] [CrossRef]
- Kim, M.; Oh, C.H.; Han, J. Colocation as network: Types and performance implications of structural positions in colocation network. J. Int. Bus. Stud. 2023, 55, 71–90. [Google Scholar] [CrossRef]
- Morioka, W.; Okabe, A.; Kwan, M.P.; McLafferty, S.L. An exact statistical method for analyzing co-location on a street network and its computational implementation. Int. J. Geogr. Inf. Sci. 2022, 36, 773–798. [Google Scholar] [CrossRef]
- Tao, Z.; Binbin, J. Comparative Study on the Performance of China’s Economy Hotel with Different Chain Organization Modes. In 2015 International Conference on Social Science and Technology Education; Atlantis Press: Dordrecht, The Netherlands, 2015; pp. 845–852. [Google Scholar] [CrossRef]
- China Hospitality Association; Inntie Enterprise Management Consultants. 2018 Development and Investment Report of China’s Chained Hotel. 2018. Available online: http://www.shujuju.cn/lecture/detail/4661 (accessed on 22 February 2024).
- Roubi, S.; Littlejohn, D. What makes hotel values in the UK? A hedonic valuation model. Int. J. Contemp. Hosp. Manag. 2004, 16, 175–181. [Google Scholar] [CrossRef]
- Rusu, A.; Banica, A.; Buraga, A.; Rosu, L. Delineating Catchment Areas for the Eastern European Airports in 2010. Analele Stiintific Ale Univ. “Alexandru Ioan Cuza” Din Iasiseria Geogr. 2014, 60, 143–156. [Google Scholar]
- Shoval, N. The geography of hotels in cities: An empirical validation of a forgotten model. Tour. Geogr. 2006, 8, 56–75. [Google Scholar] [CrossRef]
- Lee, S.K.; Jang, S. Room rates of US airport hotels: Examining the dual effects of proximities. J. Travel Res. 2011, 50, 186–197. [Google Scholar]
- Cliff, A.D.; Ord, J.K. Spatial Processes: Models & Applications; Taylor & Francis: Oxford, UK, 1981. [Google Scholar]
- Anselin, L.; Li, X. Operational local join count statistics for cluster detection. J. Geogr. Syst. 2019, 21, 189–210. [Google Scholar] [CrossRef]
- Porter, M.E. The Competitive Advantages of Nations; The Free Press: New York, NY, USA, 1990. [Google Scholar]
- McCann, B.T.; Folta, T.B. Demand-and supply-side agglomerations: Distinguishing between fundamentally different manifestations of geographic concentration. J. Manag. Stud. 2009, 46, 362–392. [Google Scholar] [CrossRef]
- Luo, H.; Yang, Y. Spatial pattern of hotel distribution in China. Tour. Hosp. Res. 2013, 13, 3–15. [Google Scholar] [CrossRef]


| Brand | n Hotels | Operation Starting Year | Mean over the brand | |||
|---|---|---|---|---|---|---|
| Lowest Rate, USD | n Rooms | n Reviews | Rating | |||
| Super 8 | 214 | 2005 | 40 | 75 | 826 | 3.99 |
| Home Inn | 184 | 2001 | 55 | 112 | 1171 | 4.57 |
| Hanting | 169 | 2006 | 60 | 112 | 767 | 4.43 |
| 7 Days Inn | 190 | 2006 | 43 | 94 | 1402 | 4.34 |
| Green Tree | 113 | 2007 | 42 | 106 | 564 | 4.25 |
| Chain | Distance | Number of Colocations with Different Brands | Number of Colocations with the Same Brand | ||||||||
|---|---|---|---|---|---|---|---|---|---|---|---|
| Obs. | Exp. | Z | p | Strategy | Obs. | Exp. | Z | p | Strategy | ||
| 7 Days Inn | 250 | 78 | 73 | 0.70 | 0.246 | - | 1 | 10 | −2.90 | <0.001 | Avoid |
| 500 | 186 | 168 | 1.50 | 0.054 | - | 10 | 24 | −2.60 | 0.002 | Avoid | |
| 1000 | 560 | 522 | 1.60 | 0.054 | - | 55 | 73 | −1.90 | 0.034 | Avoid | |
| 2000 | 1713 | 1665 | 0.80 | 0.228 | - | 195 | 233 | −1.60 | 0.05 | Avoid | |
| Quad | 371 | 347 | 1.70 | 0.052 | - | 34 | 49 | −2.40 | 0.002 | Avoid | |
| Green Tree | 250 | 47 | 48 | −0.20 | 0.44 | - | 9 | 4 | 2.80 | 0.008 | Avoid |
| 500 | 93 | 111 | −1.70 | 0.058 | - | 9 | 8 | 0.20 | 0.31 | - | |
| 1000 | 255 | 345 | −4.00 | <0.001 | Avoid | 15 | 26 | −2.00 | 0.032 | Avoid | |
| 2000 | 730 | 1102 | −6.60 | <0.001 | Avoid | 36 | 82 | −3.60 | <0.001 | Avoid | |
| Quad | 171 | 230 | −4.50 | <0.001 | Avoid | 12 | 17 | −1.60 | 0.044 | Avoid | |
| Hanting | 250 | 95 | 67 | 3.80 | 0.002 | Compete | 2 | 8 | −2.20 | 0.022 | Avoid |
| 500 | 199 | 154 | 3.80 | 0.002 | Compete | 13 | 19 | −1.20 | 0.124 | - | |
| 1000 | 562 | 478 | 3.60 | 0.002 | Compete | 51 | 58 | −0.70 | 0.254 | - | |
| 2000 | 1671 | 1527 | 2.40 | 0.002 | Compete | 218 | 184 | 1.60 | 0.048 | Compete | |
| Quad | 374 | 319 | 4.00 | 0.002 | Compete | 34 | 38 | −0.90 | 0.252 | - | |
| Home Inn | 250 | 84 | 71 | 1.70 | 0.046 | Compete | 6 | 10 | −1.20 | 0.17 | - |
| 500 | 178 | 164 | 1.10 | 0.138 | - | 19 | 22 | −0.60 | 0.328 | - | |
| 1000 | 577 | 510 | 2.90 | 0.004 | Compete | 71 | 68 | 0.30 | 0.336 | - | |
| 2000 | 1797 | 1627 | 3.00 | 0.002 | Compete | 298 | 218 | 3.60 | 0.002 | Compete | |
| Quad | 381 | 339 | 3.00 | 0.002 | Compete | 49 | 46 | 0.70 | 0.228 | - | |
| Super 8 | 250 | 82 | 79 | 0.40 | 0.322 | - | 3 | 13 | −2.80 | <0.001 | Avoid |
| 500 | 200 | 183 | 1.50 | 0.066 | - | 14 | 30 | −2.60 | <0.001 | Avoid | |
| 1000 | 562 | 567 | −0.20 | 0.414 | - | 78 | 92 | −1.20 | 0.114 | - | |
| 2000 | 1757 | 1809 | −0.90 | 0.172 | - | 296 | 295 | 0.00 | 0.47 | - | |
| Quad | 376 | 377 | −0.10 | 0.418 | - | 52 | 62 | −1.50 | 0.062 | - | |
Disclaimer/Publisher’s Note: The statements, opinions and data contained in all publications are solely those of the individual author(s) and contributor(s) and not of MDPI and/or the editor(s). MDPI and/or the editor(s) disclaim responsibility for any injury to people or property resulting from any ideas, methods, instructions or products referred to in the content. |
© 2024 by the authors. Licensee MDPI, Basel, Switzerland. This article is an open access article distributed under the terms and conditions of the Creative Commons Attribution (CC BY) license (https://creativecommons.org/licenses/by/4.0/).
Share and Cite
Su, L.; Kirilenko, A.; Stepchenkova, S. Compete or Avoid? Assessing Brand Competition Strategies with Spatial Colocation Analysis. Tour. Hosp. 2024, 5, 160-166. https://doi.org/10.3390/tourhosp5010011
Su L, Kirilenko A, Stepchenkova S. Compete or Avoid? Assessing Brand Competition Strategies with Spatial Colocation Analysis. Tourism and Hospitality. 2024; 5(1):160-166. https://doi.org/10.3390/tourhosp5010011
Chicago/Turabian StyleSu, Lijuan, Andrei Kirilenko, and Svetlana Stepchenkova. 2024. "Compete or Avoid? Assessing Brand Competition Strategies with Spatial Colocation Analysis" Tourism and Hospitality 5, no. 1: 160-166. https://doi.org/10.3390/tourhosp5010011
APA StyleSu, L., Kirilenko, A., & Stepchenkova, S. (2024). Compete or Avoid? Assessing Brand Competition Strategies with Spatial Colocation Analysis. Tourism and Hospitality, 5(1), 160-166. https://doi.org/10.3390/tourhosp5010011