
Detecting Tourism Typologies of Regional Destinations Based on Their Spatio-Temporal and Socioeconomic Performance: A Correlation-Based Complex Network Approach for the Case of Greece


Abstract
1. Introduction
2. Methodology and Data
3. Results and Discussion
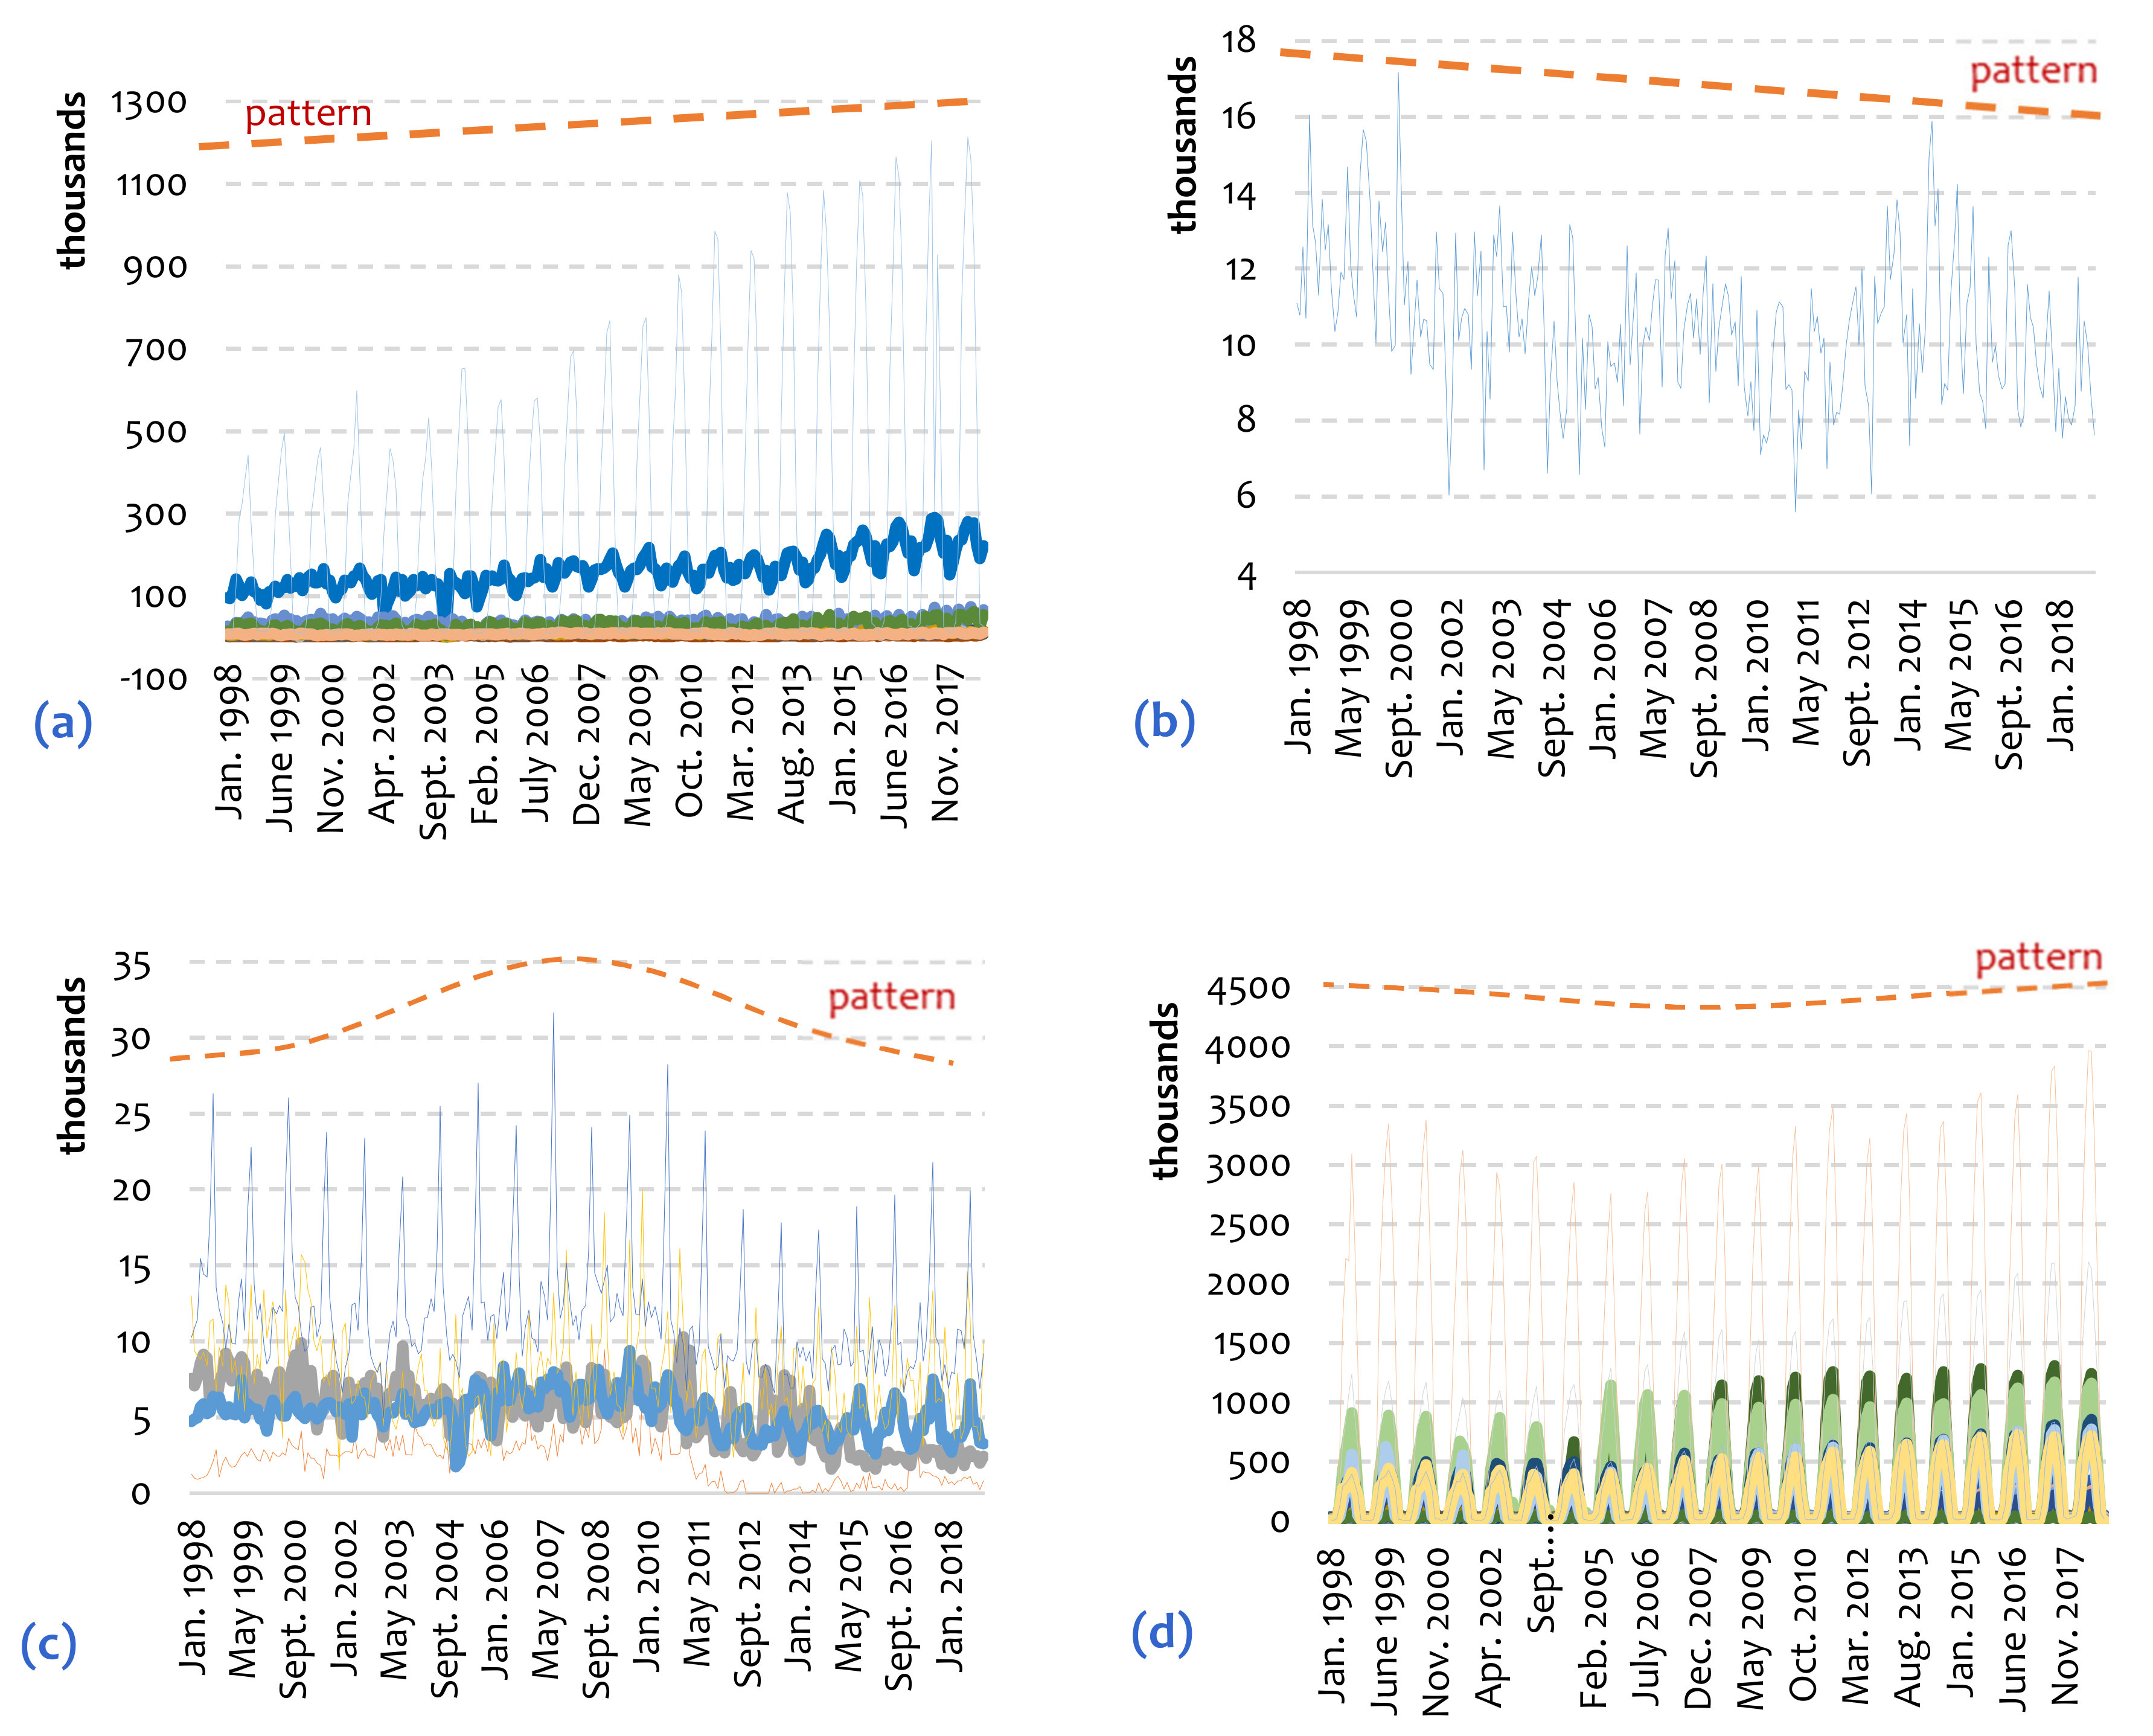
3.1. Data Visualization
3.2. Correlation Analysis
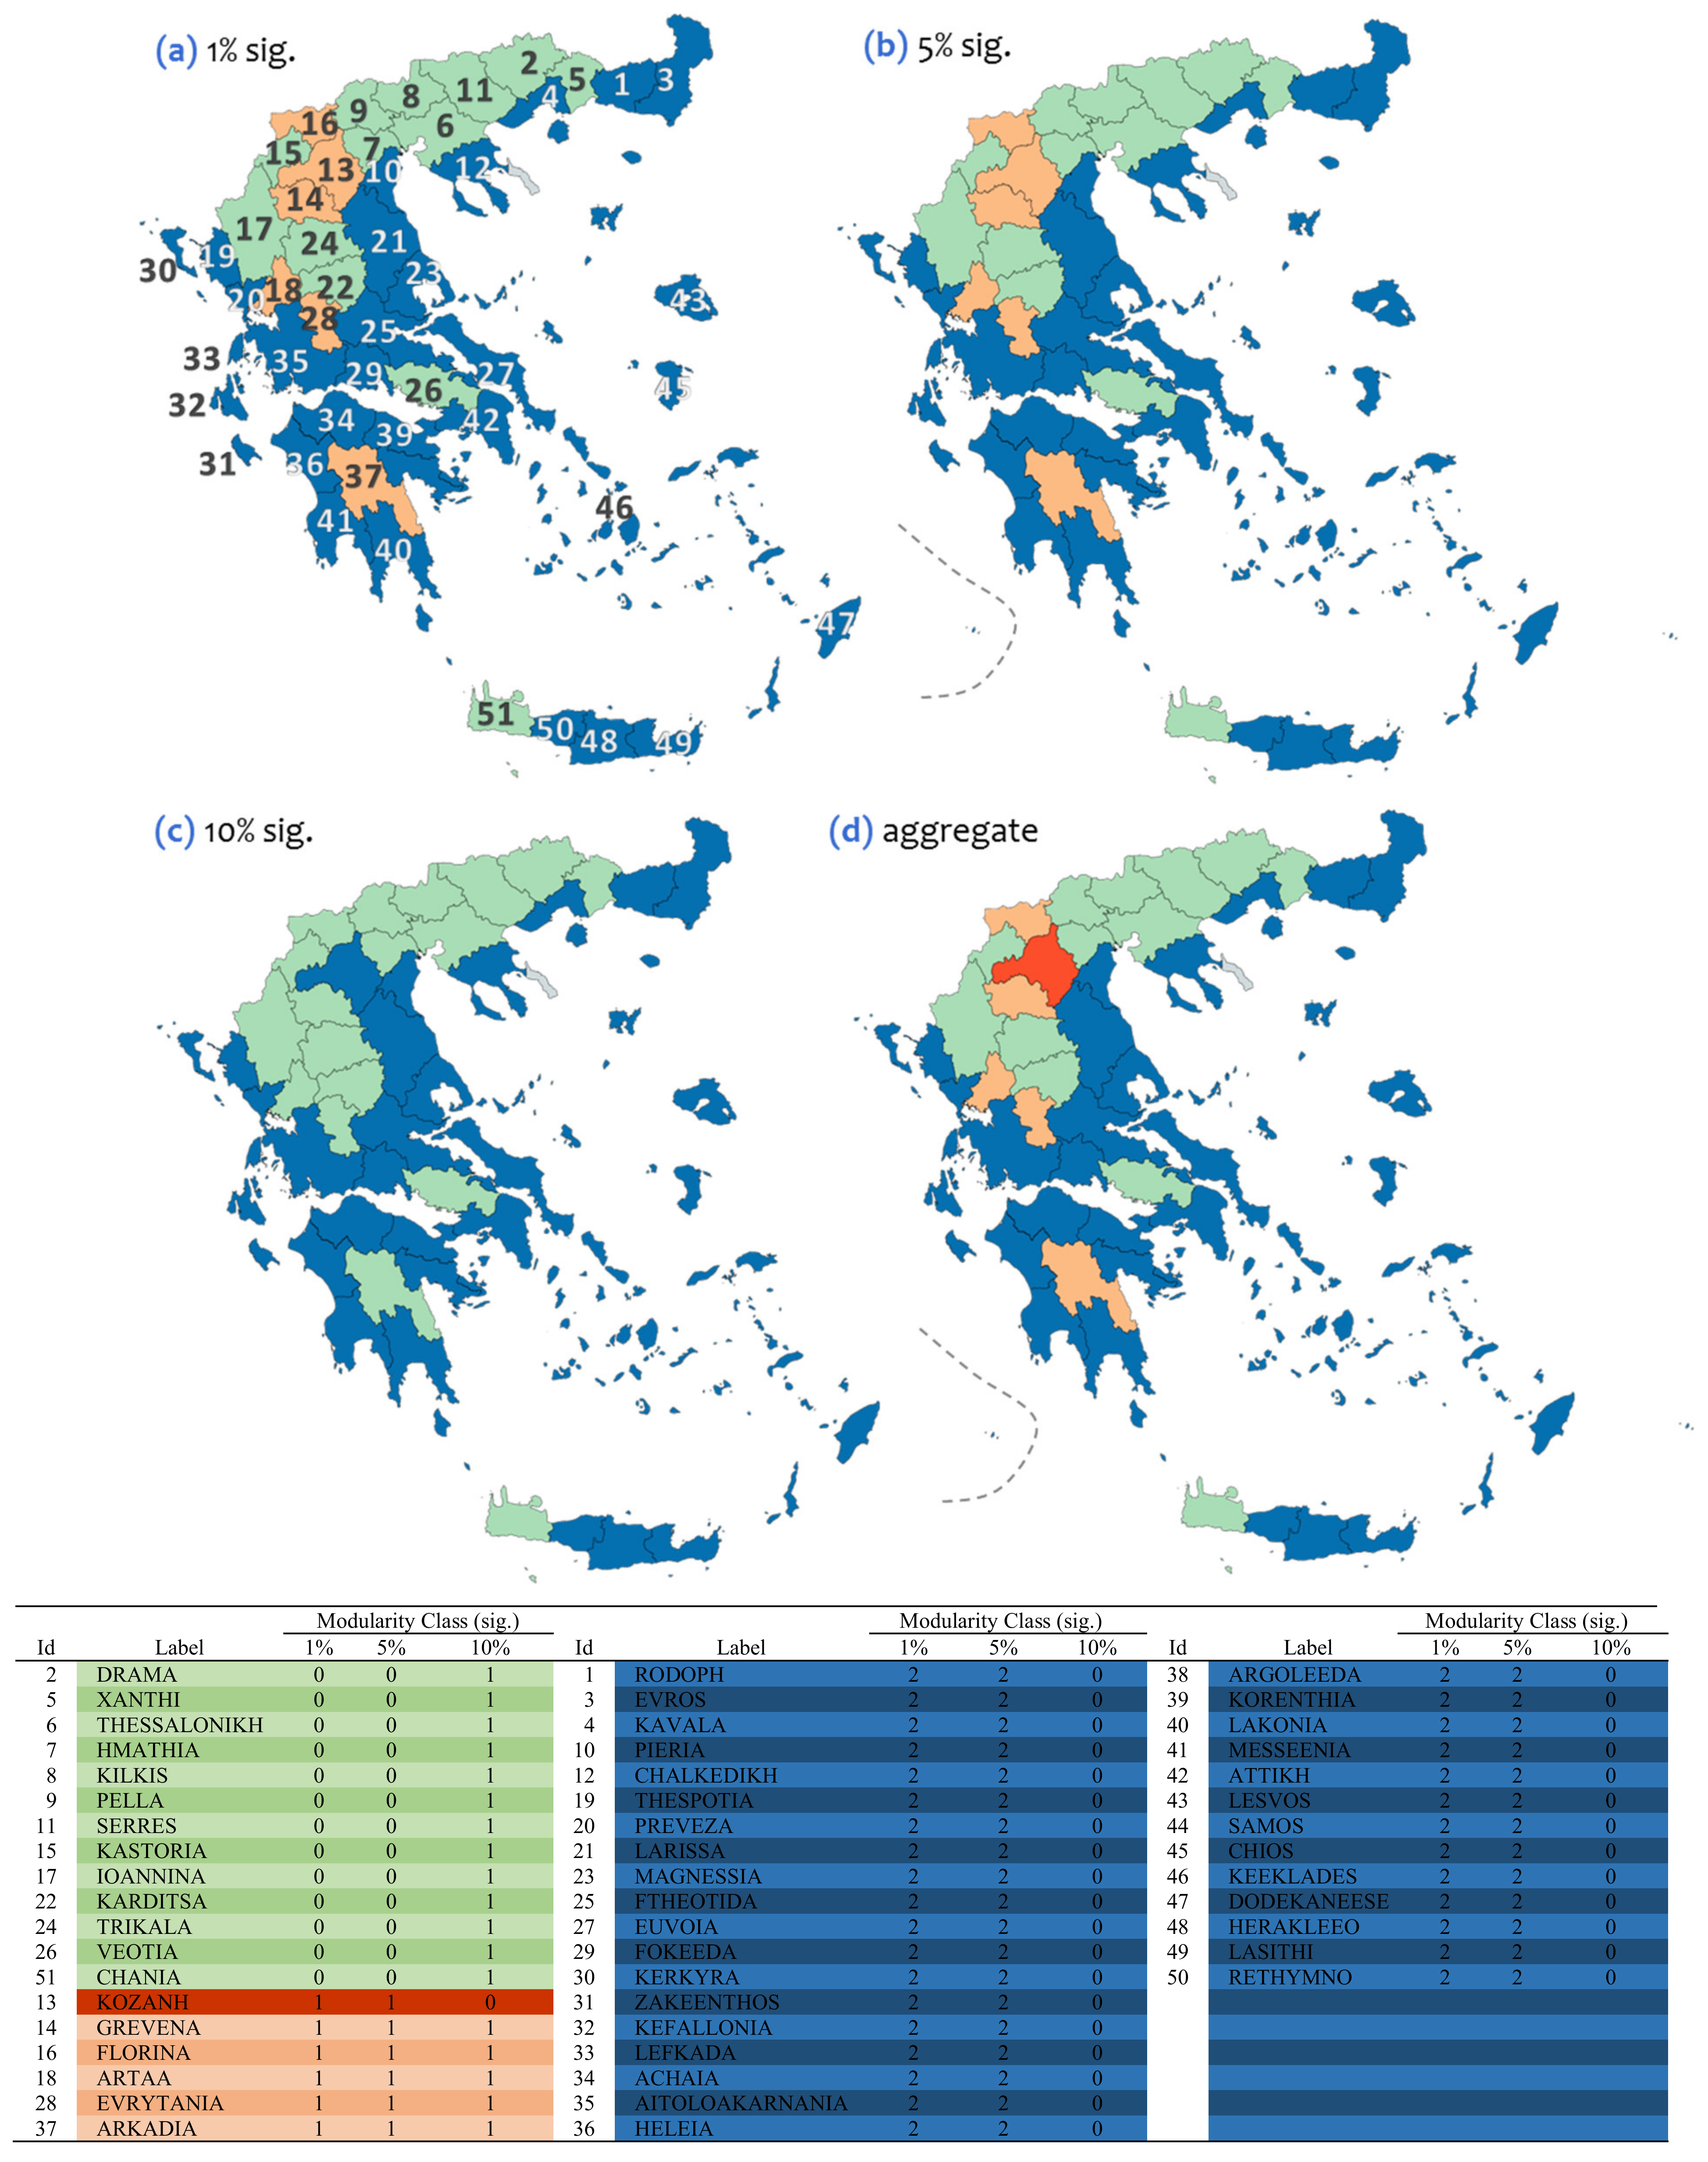
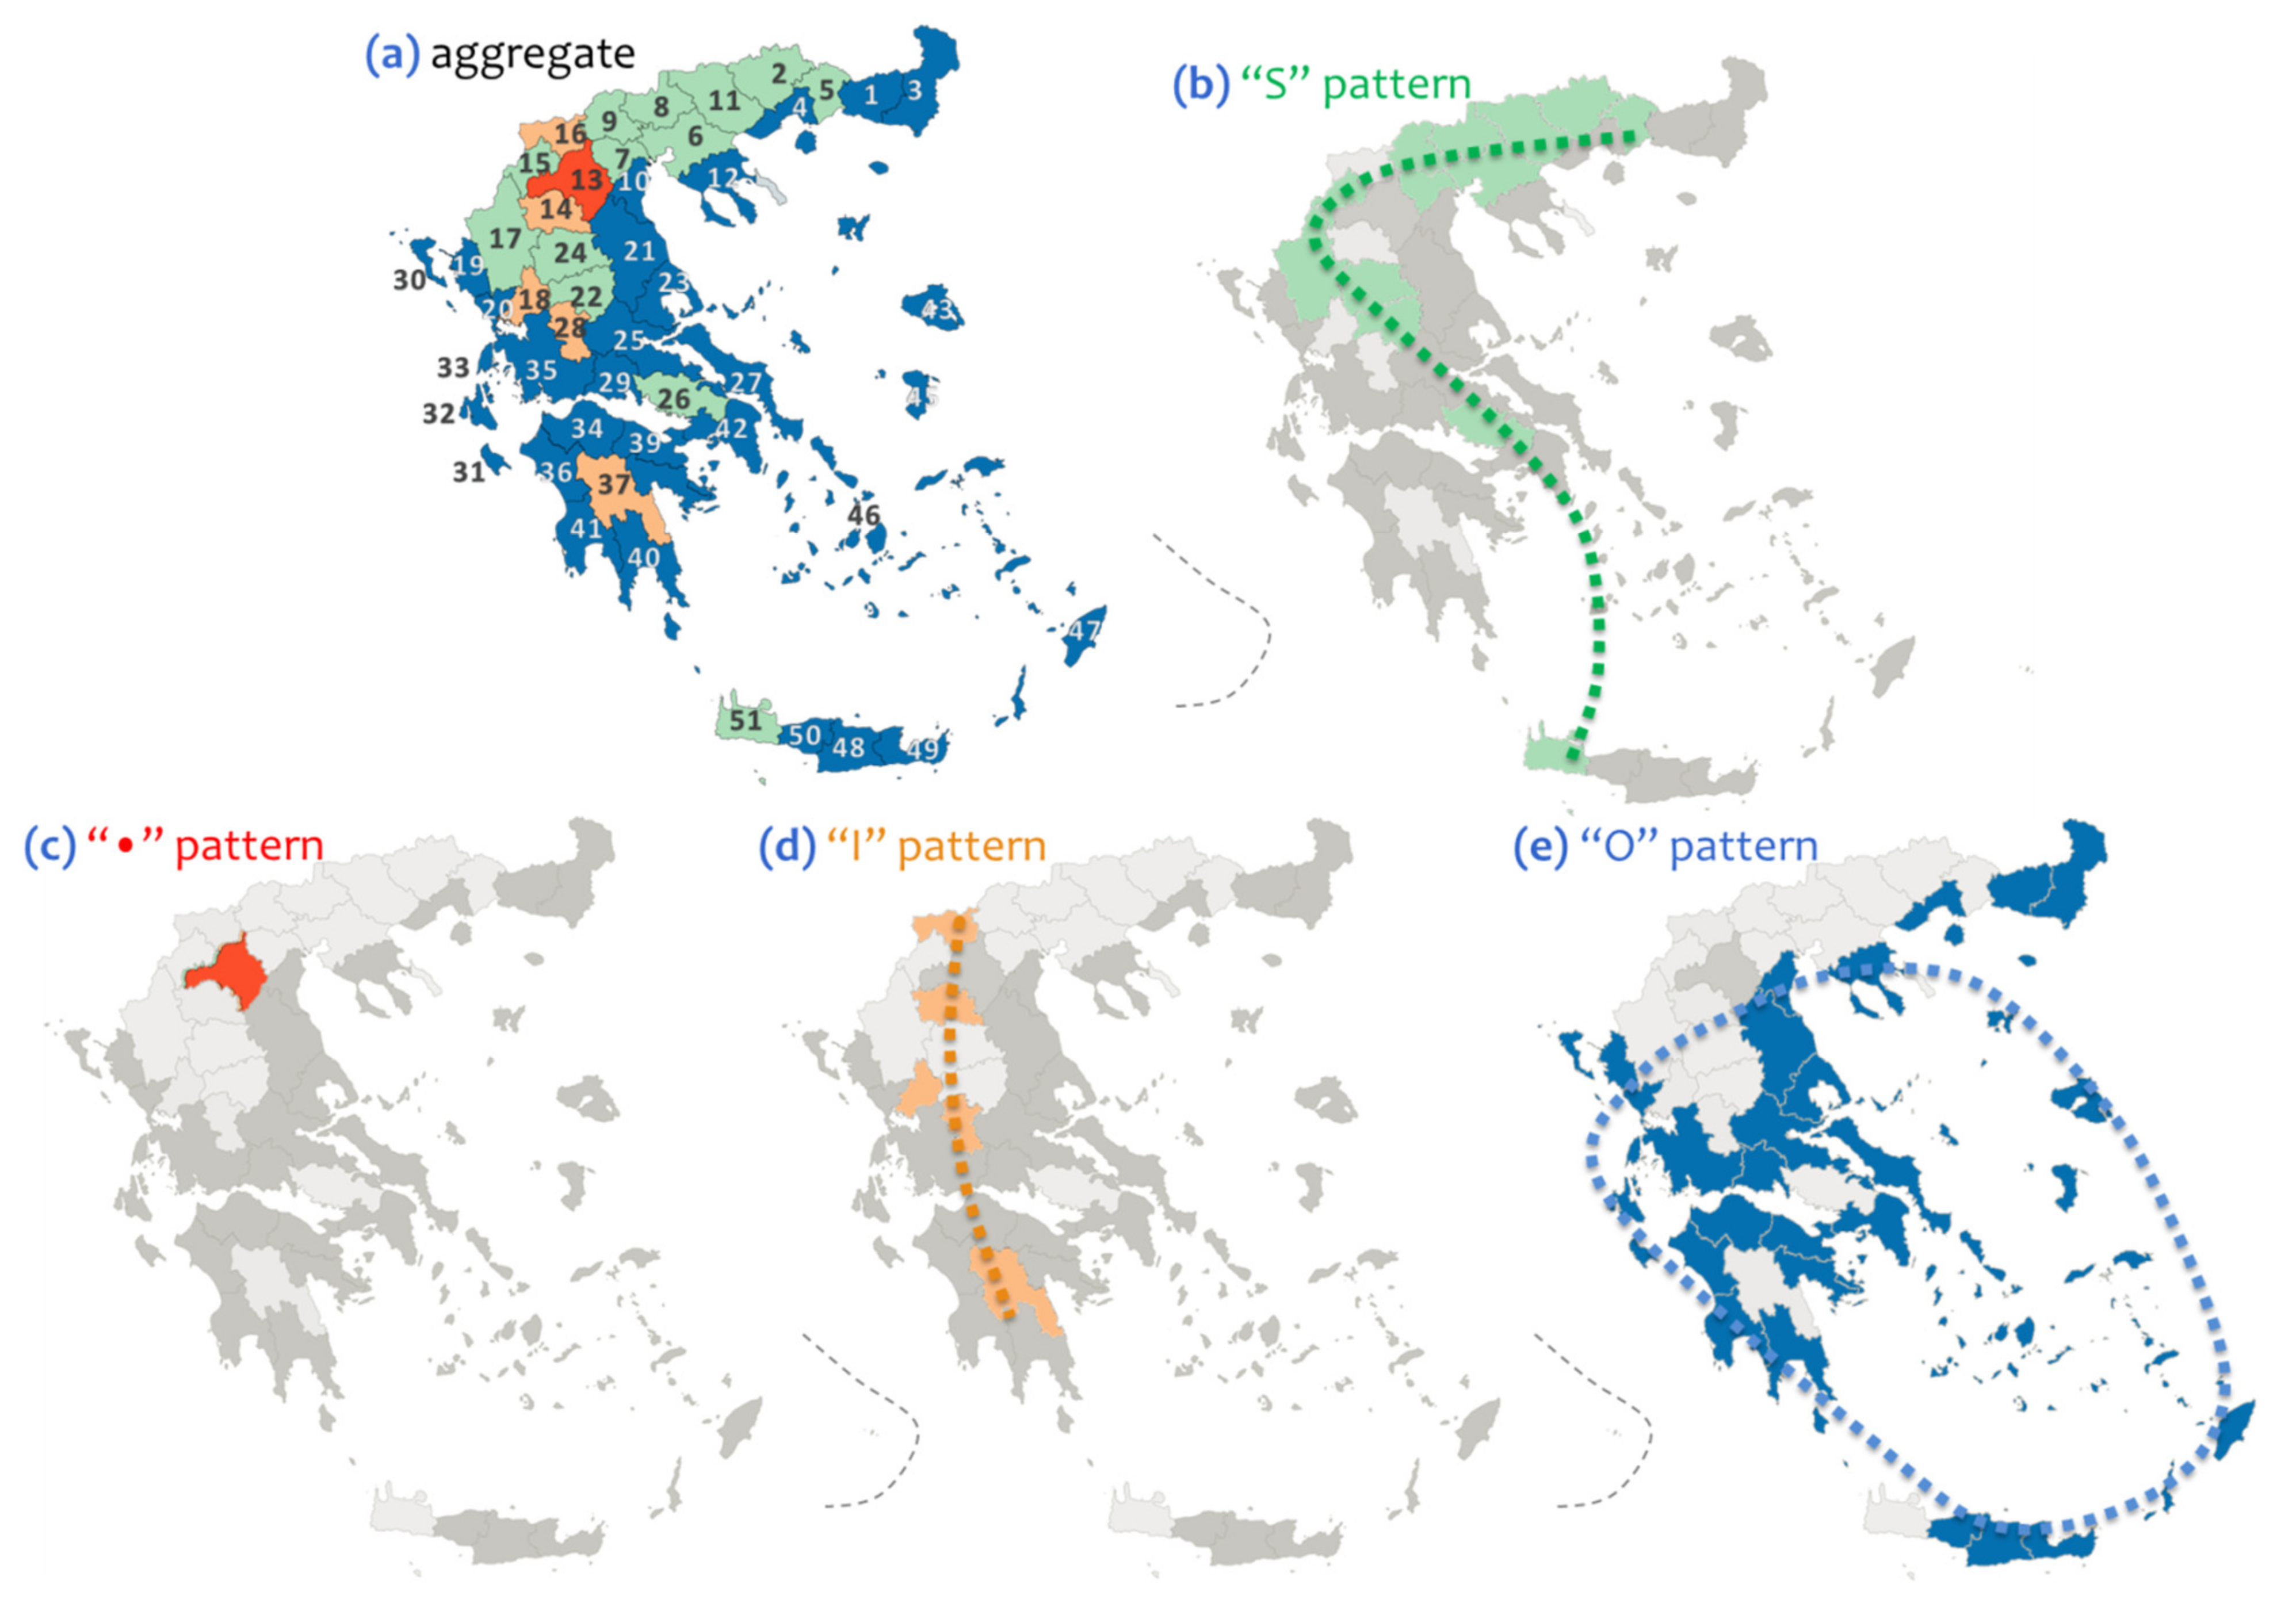
3.3. Classification of Seasonality Patterns Based on Community Detection
3.4. Socio-Economic Determination of the Modularity Seasonal Groups
4. Further Analysis and Overall Assessment
5. Conclusions
Author Contributions
Funding
Data Availability Statement
Acknowledgments
Conflicts of Interest
Appendix A

| TOURISM SEASONALITY | |||||||
|---|---|---|---|---|---|---|---|
| A. CONCEPTUALIZATION | B. MODELING | C. IMPLEMENTATION | |||||
| A1. Definition | A2. Space of Embedding | B1. Variable Complexity | B2. Data | B3. Attribute/Aspect | B4. Models | B5. Approach | C1. Geographical Scale |
| 1. Tourism Demand [1,6,9,12,14,15,16,18,20,21,22,28,30,31,32,34,37,38,39,40,41,44,45], | 1. Socioeconomic [1,9,12,15,16,17,18,20,21,22,28,32,37,41,42,44,45] | 1. Uni-variable (one attribute) [6,14,32,33,40,41,43,45] | 1. Visitors [6,22,30,31,34,39] | 1. Concentration [9,39,40,42,45] | 1. Indicators [6,12,14,18,19,22,28,29,30,31,32,34,35,36,38,39,40,41,45] | 1. Single discipline [6,12,13,14,29,30,31,32,35,38,39,40,41,42,43] | |
| 2. Multivariable (many attributes) [9,15,16,20,21,22,28,31,34] | 2. Arrivals [13,15,16,32,33,34,41,42] | 2. Synergy [5] | 2. Measures/metrics [9,14,21,31,36,40,43] | 2.Multidisciplinary [9,15,16,17,21,22,28,33,34,44,45] | |||
| 3. Overnight-stays [9,12,14,17,18,29,31,32,36,38,40,45] | 3. Traditions [4,6,12,18] | 3. Econometric [15,17,21,22,44,45] | |||||
| 4. Income [16]. | 4. Tourism-capacity [42]. | ||||||
| 5. Occupancy [12,16,17,18,31,35] | 5. Competitiveness [22,23,32,42] | ||||||
| 6. Number of trips [28] | 6. Attractiveness [19,29,44] | ||||||
| 7. Staff [31,45] | 7. Economic structure/configuration [15,44,45] | ||||||
| 8. Prices [31] | 8. Type of tourism product [6,12,17,18,28,30,31,32,35,37,39,40,44] | ||||||
| 2. Time References [1,6,9,11,12,15,17,20,27,29,33,35,40,43,45] | 2. Temporal (time dimension) [9,13,18,29,33,34,35,38,39,41] | 1. Uni-variable [13,29,35,38,39] | 9. Daily [34,35,41] | 9. Scale [4,5,17,27,36,40] | 4. Measures/metrics [5,13,35,36] | 1. Single discipline [6,12,29,35,38,39,40,43] | |
| 10. Weekly [34,41,43] | 10.Variability [4,5,15,28,35,36,41] | 5. Time-series [9,13,29,33,35] | |||||
| 11. Monthly [6,9,12,13,15,16,18,28,29,30,31,33,35,38,39,40,41,43,45] | 11. Periodicity [4,13,15,35,36,38,40,41] | 6. TALC [42,49]. | 2. Multidisciplinary [9,15,17,33,45] | ||||
| 12.Annual [14,19,21,35,40] | 12. Cyclical performance [9,14,29,35,36] | 7. Pattern recognition [9,29,35,36,38,39] | |||||
| 3. Spatial References [6,9,12,14,15,16,17,18,19,20,21,25,28,30,32,34,37,39,40,42,43] | 3. Geography (spatial dimension) [9,12,14,15,16,17,18,19,29,31,34,40,42,43] | 1. Uni-variable (one destination) [12,18,30,32,33,34,35,41] | 13. Location [12,13,18,21,30,32,34,35,41,42] | 13. Geographical scale [6,9,19,28,42,44] | 7. Pattern recognition [12,14,18,42] | 1. Single discipline [6,12,14,29,30,39,40,42,43] | 1. Local [13,17,21,30,32,34,35,41,42] |
| 2. Multivariable (many destinations) [6,9,14,15,16,17,19,28,34,36,38,39,40,43,44,45] | 14. Destination [9,14,15,16,17,22,28,31,33,34,36,38,41,42,43,44,45] | 14. Geomorphology [9,16] | 8. Classification [6,9,14,19,22,44] | 2. Multidisciplinary [9,15,16,17,21,28,34] | 2.Urban [34] | ||
| 3. Climate [15,16],19] | 3. Regional [6,9,16,19,28,29,31,34,38,39,40,43,44,45] | ||||||
| 15. Accessibility [16,30] | 4. National [12,18,22,33,34,40] | ||||||
| 5. International [14,15,36] | |||||||
| Prefecture | Variable Code | Prefecture | Variable Code | Prefecture | Variable Code | Prefecture | Variable Code |
|---|---|---|---|---|---|---|---|
| ACHAIA | 34 | EVROS | 3 | KEFALONIA | 32 | PIERIA | 10 |
| AITOLOAKARNANIA | 35 | EVRYTANIA | 28 | KERKYRA | 30 | PREVEZA | 20 |
| ARGOLIDA | 38 | FLORINA | 16 | KILKIS | 8 | RETHYMNO | 50 |
| ARKADIA | 37 | FOKIDA | 29 | KORINTHIA | 39 | RODOPI | 1 |
| ARTA | 18 | FTHIOTIDA | 25 | KOZANI | 13 | SAMOS | 44 |
| ATTIKI | 42 | GREVENA | 14 | LAKONIA | 40 | SERRES | 11 |
| CHALKIDIKI | 12 | HELEIA | 36 | LARISSA | 21 | THESPOTIA | 19 |
| CHANIA | 51 | HERAKLION | 48 | LASITHI | 49 | THESSALONIKI | 6 |
| CHIOS | 45 | HMATHIA | 7 | LEFKADA | 33 | TRIKALA | 24 |
| CYCLADES | 46 | IOANNINA | 17 | LESVOS | 43 | VIOTIA | 26 |
| DODECANESE | 47 | KARDITSA | 22 | MAGNESIA | 23 | XANTHI | 5 |
| DRAMA | 2 | KASTORIA | 15 | MESSENIA | 41 | ZAKEENTHOS | 31 |
| EVIA | 27 | KAVALA | 4 | PELLA | 9 |
| Code | Variable’s Symbol | Description | Source |
|---|---|---|---|
| SEG.1 | LAT | Latitude, defined by the geographical center of the prefecture. | [63] |
| SEG.2 | LONG | Longitude, defined by the geographical center of the prefecture. | [63] |
| SEG.3 | RSI | The Relative Seasonality Index of the prefectures’ seasonality patterns | [9] |
| SEG.4 | GINI | The Gini coefficient of the prefectures’ seasonality patterns | [9] |
| SEG.5 | ROAD DENSITY | The road density (road length/area) of each prefecture (measured in km/km2). | [64,65,66,67,68] |
| SEG.6 | ROAD LENGTH | The road length of each prefecture (measured in km). | [64,65,66,67,68] |
| SEG.7 | COASTAL | Dummy variable capturing coastal configuration (1 = coastal perfectures; 0 = non-coastal perfectures). | [67] |
| SEG.8 | ISLAND | Dummy variable capturing island configuration. | [59] |
| SEG.9 | INLAND | Dummy variable capturing inland configuration. | [59] |
| SEG.10 | RAIL | The length of the rail network. | [48,68] |
| SEG.11 | PORTS | The number of ports. | [59,68] |
| SEG.12 | AIRPORTS | The number of airports. | [59,68] |
| SEG.13 | AREA | The geographical area (measured in km2). | [59] |
| SEG.14 | POP | The regional population (2011 national census). | [65] |
| SEG.15 | URB | The urbanization level (i.e., the proportion of the capital city’s population to the regional population). | [65] |
| SEG.16 | GDP | Gross Domestic Product. | [65] |
| SEG.17 | Human Capital | Defined by the proportion of labor-force (i.e., population between 18 and 65 years old) to the total population. | [1] |
| SEG.18 | ASEC | The specialization (% of the GDP) in the primary (A) sector. | [66,69] |
| SEG.19 | BSEC | The specialization (% of the GDP) in the secondary (B) sector. | [66,69] |
| SEG.20 | CSEC | The specialization (% of the GDP) in the tertiary (C) sector. | [66,69] |
| SEG.21 | TOURISM GDP | The specialization (% of the GDP) in the tourism sector. | [66] |
| SEG.22 | TILLING LAND | The proportion of the tilling-land areas to the total regional area. | [67] |
| SEG.23 | FORESTS | The proportion of forest-areas to the total regional area. | [67] |
| SEG.24 | INLAND WATERS | The proportion of the inland-water-areas to the total regional area. | [67] |
| SEG.25 | INDUSTRIAL AREA | The proportion of the industrial-areas to the total regional area. | [67,69] |
| SEG.26 | LAND AREA | The proportion of (non-mountainous) land-areas to the total regional area. | [67] |
| SEG.27 | SEMI MOUNTAIN AREA | The proportion of the semi-mountain areas to the total regional area. | [67] |
| SEG.28 | MOUNTAIN AREA | The proportion of the mountain-areas to the total regional area. | [67] |
| SEG.29 | MOUNT ACTIVITIES | The number of mountain-activities (e.g., walking paths, mount sports, climb fields). | [67] |
| SEG.30 | CLIMB FIELDS | The number of climb-fields. | [67] |
| SEG.31 | MOUNT ROUTES | The number of mountain-routes. | [67] |
| SEG.32 | RAFTING POINTS | The number of rafting-points. | [67] |
| SEG.33 | CANYONING POINTS | The number of canyoning-points. | [67] |
| SEG.34 | SKI CENTERS | The number ski-centers. | [67] |
| SEG.35 | SKI ROUTES LENGTH | The length of the ski-routes (measured in km). | [67] |
| SEG.36 | RESTAURANTS | The number of restaurants. | [67] |
| SEG.37 | NATURA AREA | The geographical area of the Natura parks (i.e., environmentally protected areas). | [67] |
| SEG.38 | WOODLANDS PARKS | The number of woodland-parks. | [67] |
| SEG.39 | HOTELS | The number of hotels. | [66] |
| SEG.40 | CAMPING | The number of camping sites. | [66] |
| SEG.41 | BLUE FLAG | The number of beaches that are granted a blue flag. | [66] |
| SEG.42 | BEACHES | The number of organized beaches. | [66] |
| SEG.43 | ANC MONUMENTS | The number of ancient monument sites. | [66] |
| SEG.44 | UNESCO MONUMENTS | The number of UNESCO monument sites. | [66] |
| SEG.45 | HOTEL BEDS | The number of hotel beds (bed capacity). | [66] |
| SEG.46 | ROOMS | The number of rooms to let (non-hotel accommodation). | [66] |
| SEG.47 | ROOMS BEDS | The number of rooms’ beds (non-hotel accommodation capacity). | [66] |
| SEG.48 | ACCOMMODATION BEDS | The number of other types of accommodation beds. | [66] |
| SEG.49 | CULTURAL RESOURCES | The number of cultural-resources sites. | [67] |
| SEG.50 | BEACHES LENGTH | The length of beaches. | [67] |
| SEG.51 | SAND BEACHES LENGTH | The length of sand beaches. | [67] |
| MODULARITY GROUPS | |||||
|---|---|---|---|---|---|
| Variable Code | Variable Name | (0,0,1) | (1,1,0) | (1,1,1) | (2,2,0) |
| GEOGRAPHIC | |||||
| SEG1 | LAT | MAX | MAX | MIN | |
| SEG2 | LONG | MAX | MIN | MAX | |
| SEG3 | COASTAL | MIN | MIN | MAX | |
| SEG4 | ISLAND | MIN | MIN | MAX | |
| SEG5 | INLAND | MIN | MAX | ||
| SEG6 | AREA | MIN | MAX | MIN | |
| SEG7 | TILLING LAND | MAX | MIN | MIN | |
| SEG8 | FORESTS | MAX | MIN | ||
| SEG9 | INLAND WATERS | MIN | MAX | MIN | |
| SEG10 | LAND AREA | MAX | MIN | ||
| SEG11 | SEMI MOUNTAIN AREA | MIN | MAX | MIN | MIN |
| SEG12 | MOUNTAIN AREA | MAX | MIN | ||
| SEASONALITY | |||||
| SEG13 | RSI | MIN | MIN | MAX | |
| SEG14 | GINI | MIN | MIN | MIN | MAX |
| TRANSPORT | |||||
| SEG15 | ROAD DENSITY | MIN | MAX | ||
| SEG16 | ROAD LENGTH | ||||
| SEG17 | RAIL | MAX | MIN | ||
| SEG18 | PORTS | MIN | MIN | MIN | MAX |
| SEG19 | AIRPORTS | MAX | MIN | ||
| DEMOGRAPHIC | |||||
| SEG20 | POP | MAX | MIN | ||
| SEG21 | URB | MAX | MIN | MAX | MAX |
| SEG22 | HUMAN CAPITAL | MAX | MIN | ||
| PRODUCTIVITY | |||||
| SEG23 | GDP | MAX | MIN | ||
| SEG24 | ASEC | MIN | MAX | ||
| SEG25 | BSEC | MIN | MAX | MIN | MIN |
| SEG26 | CSEC | MIN | MAX | MAX | |
| SEG27 | TOURISM GDP | MAX | MIN | ||
| SEG28 | INDUSTRIAL AREA | MIN | MAX | MIN | MIN |
| TOURISM | |||||
| SEG29 | HOTELS | MIN | MIN | MAX | |
| SEG30 | HOTEL BEDS | MIN | MIN | MAX | |
| SEG31 | ROOMS | MIN | MIN | MAX | |
| SEG32 | ROOMS BEDS | MIN | MIN | MAX | |
| SEG33 | ACCOMMODATION BEDS | MIN | MIN | MAX | |
| SEG34 | CAMPING | MIN | MIN | MIN | MAX |
| SEG35 | RESTAURANTS | MIN | MIN | MAX | |
| SEG36 | MOUNT ACTIVITIES | MAX | MIN | MIN | |
| SEG37 | CLIMB FIELDS | MAX | MIN | MAX | MAX |
| SEG38 | MOUNT ROUTES | MAX | MIN | MIN | |
| SEG39 | RAFTING POINTS | ||||
| SEG40 | CANYONING POINTS | MIN | MAX | ||
| SEG41 | SKI CENTERS | MAX | MIN | MAX | MIN |
| SEG42 | SKI ROUTES LENGTH | MAX | MIN | ||
| ENVIRONMENTAL | |||||
| SEG43 | NATURA AREA | MAX | MIN | MAX | MAX |
| SEG44 | WOODLANDS PARKS | MAX | MIN | ||
| SEG45 | BLUE FLAG BEACHES | MIN | MIN | MAX | |
| SEG46 | BEACHES | MIN | MIN | MIN | MAX |
| SEG47 | BEACHES LENGTH | MIN | MIN | MIN | MAX |
| SEG48 | SAND BEACHES LENGTH | MIN | MIN | MIN | MAX |
| CULTURAL | |||||
| SEG49 | ANC MONUMENTS | MIN | MAX | ||
| SEG50 | UNESCO MONUMENTS | MIN | MIN | MAX | |
| SEG51 | CULTURAL RESOURCES | MIN | MAX | ||
References
- Polyzos, S. Regional Development; Kritiki: Athens, Greece, 2019; ISBN 9789602187302. [Google Scholar]
- Mastronardi, L.; Cavallo, A. The Spatial Dimension of Income Inequality: An Analysis at Municipal Level. Sustainability 2020, 12, 1622. [Google Scholar] [CrossRef]
- Vo, D.H.; Nguyen, T.C.; Tran, N.P.; Vo, A.T. What Factors Affect Income Inequality and Economic Growth in Middle-Income Countries? J. Risk Financial Manag. 2019, 12, 40. [Google Scholar] [CrossRef]
- Charles-Edwards, E.; Bell, M. Seasonal Flux in Australia’s Population Geography: Linking Space and Time. Popul. Space Place 2013, 21, 103–123. [Google Scholar] [CrossRef]
- Romão, J.; Saito, H. A spatial analysis on the determinants of tourism performance in Japanese Prefectures. Asia-Pac. J. Reg. Sci. 2017, 1, 243–264. [Google Scholar] [CrossRef]
- Batista e Silva, F.; Kavalov, B.; Lavalle, C. Socio-Economic Regional Microscope Series—Territorial Patterns of Tourism Inten-Sity and Seasonality in the EU; Publications Office of the European Union: Luxembourg, 2019. [Google Scholar] [CrossRef]
- Ulbrich, P.; de Albuquerque, J.P.; Coaffee, J. The Impact of Urban Inequalities on Monitoring Progress towards the Sustainable Development Goals: Methodological Considerations. ISPRS Int. J. Geo-Inf. 2018, 8, 6. [Google Scholar] [CrossRef]
- Băndoi, A.; Jianu, E.; Enescu, M.; Axinte, G.; Tudor, S.; Firoiu, D. The Relationship between Development of Tourism, Quality of Life and Sustainable Performance in EU Countries. Sustainability 2020, 12, 1628. [Google Scholar] [CrossRef]
- Tsiotas, D.; Krabokoukis, T.; Polyzos, S. Detecting Interregional patterns in tourism-seasonality of Greece: A principal components analysis approach. Reg. Sci. Inq. 2020, 12, 91–112. [Google Scholar]
- Krabokoukis, T.; Polyzos, S. An Investigation of Factors Determining the Tourism Attractiveness of Greece’s Prefectures. J. Knowl. Econ. 2020. [Google Scholar] [CrossRef]
- Saarinen, J.; Rogerson, C.M.; Hall, C.M. Geographies of tourism development and planning. Tour. Geogr. 2017, 19, 307–317. [Google Scholar] [CrossRef]
- Butler, R.W. Seasonality in tourism: Issues and implications. In Tourism: The State of the Art; Seaton, A., Ed.; Wiley: Chichester, UK, 1994; ISBN 978-0471950929. [Google Scholar]
- Gil-Alana, L.A. International Arrivals in the Canary Islands: Persistence, Long Memory, Seasonality and other Implicit Dynamics. Tour. Econ. 2010, 16, 287–302. [Google Scholar] [CrossRef]
- Ferrante, M.; Magno, G.L.L.; De Cantis, S. Measuring tourism seasonality across European countries. Tour. Manag. 2018, 68, 220–235. [Google Scholar] [CrossRef]
- Duro, J.A.; Turrión-Prats, J. Tourism seasonality worldwide. Tour. Manag. Perspect. 2019, 31, 38–53. [Google Scholar] [CrossRef]
- Sæþórsdóttir, A.D.; Hall, C.M.; Stefánsson, Þ. Senses by Seasons: Tourists’ Perceptions Depending on Seasonality in Popular Nature Destinations in Iceland. Sustainability 2019, 11, 3059. [Google Scholar] [CrossRef]
- Corluka, G.; Mikinac, K.; Milenkovska, A. Classification of tourist season in coastal tourism. UTMS J. Econ. 2016, 7, 71–83. [Google Scholar]
- Butler, R.W. Seasonality in Tourism: Issues and Implication. In Seasonality in Tourism; Baum, T., Lundtorp, S., Eds.; Elsevier Ltd.: Oxford, UK, 2001; ISBN 9780080436746. [Google Scholar]
- Fang, Y.; Yin, J. National Assessment of Climate Resources for Tourism Seasonality in China Using the Tourism Climate Index. Atmosphere 2015, 6, 183–194. [Google Scholar] [CrossRef]
- De Almeida, A.L.; Kastenholz, E. Towards a Theoretical Model of Seasonal Tourist Consumption Behaviour. Tour. Plan. Dev. 2018, 16, 533–555. [Google Scholar] [CrossRef]
- Choe, Y.; Kim, H.; Joun, H.-J. Differences in Tourist Behaviors across the Seasons: The Case of Northern Indiana. Sustainability 2019, 11, 4351. [Google Scholar] [CrossRef]
- Liu, Y.; Li, Y.; Parkpian, P. Inbound tourism in Thailand: Market form and scale differentiation in ASEAN source countries. Tour. Manag. 2018, 64, 22–36. [Google Scholar] [CrossRef]
- Gómez-Vega, M.; Picazo-Tadeo, A.J. Ranking world tourist destinations with a composite indicator of competitiveness: To weigh or not to weigh? Tour. Manag. 2019, 72, 281–291. [Google Scholar] [CrossRef]
- Niavis, S.; Tsiotas, D. Decomposing the price of the cruise product into tourism and transport attributes: Evidence from the Mediterranean market. Tour. Manag. 2018, 67, 98–110. [Google Scholar] [CrossRef]
- Tsiotas, D.; Niavis, S.; Sdrolias, L. Operational and geographical dynamics of ports in the topology of cruise networks: The case of Mediterranean. J. Transp. Geogr. 2018, 72, 23–35. [Google Scholar] [CrossRef]
- Niavis, S.; Tsiotas, D. Assessing the tourism performance of the Mediterranean coastal destinations: A combined efficiency and effectiveness approach. J. Destin. Mark. Manag. 2019, 14, 100379. [Google Scholar] [CrossRef]
- Romão, J.; Guerreiro, J.; Rodrigues, P.M.M. Territory and Sustainable Tourism Development: A Space-Time Analysis on European Regions. Region 2017, 4, 1–17. [Google Scholar] [CrossRef]
- Fernández-Morales, A.; Cisneros-Martínez, J.D.; McCabe, S. Seasonal concentration of tourism demand: Decomposition analysis and marketing implications. Tour. Manag. 2016, 56, 172–190. [Google Scholar] [CrossRef]
- Cuccia, T.; Rizzo, I. Tourism seasonality in cultural destinations: Empirical evidence from Sicily. Tour. Manag. 2011, 32, 589–595. [Google Scholar] [CrossRef]
- Lundtorp, S.; Rassing, C.R.; Wanhill, S. The off-Season is ‘No Season’: The Case of the Danish Island of Bornholm. Tour. Econ. 1999, 5, 49–68. [Google Scholar] [CrossRef]
- Martín, J.M.M.; Fernández, J.A.S. Comprehensive evaluation of the tourism seasonality using a synthetic DP2 indicator. Tour. Geogr. 2019, 21, 284–305. [Google Scholar] [CrossRef]
- Andriotis, K. Seasonality in Crete: Problem or a Way of Life? Tour. Econ. 2005, 11, 207–224. [Google Scholar] [CrossRef]
- Assaf, A.G.; Barros, C.P.; Gil-Alana, L.A. Persistence in the Short- and Long-Term Tourist Arrivals to Australia. J. Travel Res. 2010, 50, 213–229. [Google Scholar] [CrossRef]
- Þórhallsdóttir, G.; Ólafsson, R. A method to analyse seasonality in the distribution of tourists in Iceland. J. Outdoor Recreat. Tour. 2017, 19, 17–24. [Google Scholar] [CrossRef]
- De Cantis, S.; Ferrante, M.; Vaccina, F. Seasonal Pattern and Amplitude—A Logical Framework to Analyse Seasonality in Tourism: An Application to Bed Occupancy in Sicilian Hotels. Tour. Econ. 2011, 17, 655–675. [Google Scholar] [CrossRef]
- Magno, G.L.L.; Ferrante, M.; De Cantis, S. A new index for measuring seasonality: A transportation cost approach. Math. Soc. Sci. 2017, 88, 55–65. [Google Scholar] [CrossRef]
- Koenig-Lewis, N.; Bischoff, E.E. Seasonality research: The state of the art. Int. J. Tour. Res. 2005, 7, 201–219. [Google Scholar] [CrossRef]
- Fernández-Morales, A. Decomposing seasonal concentration. Ann. Tour. Res. 2003, 30, 942–956. [Google Scholar] [CrossRef]
- Cisneros-Martínez, J.D.; Fernández-Morales, A. Cultural tourism as tourist segment for reducing seasonality in a coastal area: The case study of Andalusia. Curr. Issues Tour. 2013, 18, 765–784. [Google Scholar] [CrossRef]
- Duro, J.A. Seasonality of hotel demand in the main Spanish provinces: Measurements and decomposition exercises. Tour. Manag. 2016, 52, 52–63. [Google Scholar] [CrossRef]
- Rosselló, J.; Sansó, A. Yearly, monthly and weekly seasonality of tourism demand: A decomposition analysis. Tour. Manag. 2017, 60, 379–389. [Google Scholar] [CrossRef]
- Terkenli, T.S. Human Activity in Landscape Seasonality: The Case of Tourism in Crete. Landsc. Res. 2005, 30, 221–239. [Google Scholar] [CrossRef]
- Ahas, R.; Aasa, A.; Mark, Ü.; Pae, T.; Kull, A. Seasonal tourism spaces in Estonia: Case study with mobile positioning data. Tour. Manag. 2007, 28, 898–910. [Google Scholar] [CrossRef]
- Connell, J.; Page, S.J.; Meyer, D. Visitor attractions and events: Responding to seasonality. Tour. Manag. 2015, 46, 283–298. [Google Scholar] [CrossRef]
- Cisneros-Martínez, J.D.; McCabe, S.; Morales, A.F. The contribution of social tourism to sustainable tourism: A case study of seasonally adjusted programmes in Spain. J. Sustain. Tour. 2018, 26, 85–107. [Google Scholar] [CrossRef]
- World Bank. World Development Indicators: Travel and Tourism. 2020. Available online: http://wdi.worldbank.org/table/6.14 (accessed on 18 December 2020).
- INSETE. The Contribution of Tourism to the Greek Economy. 2020. Available online: https://insete.gr/bi/ (accessed on 18 December 2020).
- Tsiotas, D. The imprint of tourism on the topology of maritime networks: Evidence from Greece. Anatolia 2016, 28, 52–68. [Google Scholar] [CrossRef]
- Polyzos, S.; Tsiotas, D.; Kantlis, A. Determining the Tourism Developmental Dynamics of the Greek Regions, by using TALC Theory, Tourismos: An International Multidisciplinary. J. Tour. 2013, 8, 159–178. [Google Scholar]
- Kalantzi, O.; Tsiotas, D.; Polyzos, S. The contribution of tourism in national economies: Evidence of Greece. EJBSS 2016, 5, 41–64. [Google Scholar]
- Barabási, A.-L. Network science. Philos. Trans. R. Soc. A Math. Phys. Eng. Sci. 2013, 371, 20120375. [Google Scholar] [CrossRef] [PubMed]
- Newman, M.E.J. Networks: An Introduction; Oxford University Press: Oxford, UK, 2010. [Google Scholar]
- Boccaletti, S.; Bianconi, G.; Criado, R.; del Genio, C.; Gómez-Gardeñes, J.; Romance, M.; Sendiña-Nadal, I.; Wang, Z.; Zanin, M. The structure and dynamics of multilayer networks. Phys. Rep. 2014, 544, 1–122. [Google Scholar] [CrossRef]
- Tsiotas, D. Detecting different topologies immanent in scale-free networks with the same degree distribution. Proc. Natl. Acad. Sci. USA 2019, 116, 6701–6706. [Google Scholar] [CrossRef]
- Baggio, R.; Valeri, M. Network science and sustainable performance of family businesses in tourism. J. Fam. Bus. Manag. 2020. [Google Scholar] [CrossRef]
- Valeri, M.; Baggio, R. Italian tourism intermediaries: A social network analysis exploration. Curr. Issues Tour. 2020, 1–14. [Google Scholar] [CrossRef]
- Valeri, M.; Baggio, R. Social network analysis: Organizational implications in tourism management. Int. J. Organ. Anal. 2020. [Google Scholar] [CrossRef]
- Tsiotas, D.; Tselios, V. Understanding the uneven spread of COVID-19 in the context of the global interconnected economy. arXiv 2021, arXiv:2101.11036. [Google Scholar]
- Hellenic Statistical Authority—ELSTAT 2019a. Number of Monthly Overnight-Stays in the Greek Prefectures for the Period 1998–2018. Available online: www.statistics.gr (accessed on 18 December 2020).
- Walpole, R.E.; Myers, R.H.; Myers, S.L.; Ye, K. Probability & Statistics for Engineers & Scientists, 9th ed.; Prentice Hall Publications: New York, NY, USA, 2012; ISBN 9780321629111. [Google Scholar]
- Fortunato, S. Community detection in graphs. Phys. Rep. 2010, 486, 75–174. [Google Scholar] [CrossRef]
- Blondel, V.D.; Guillaume, J.-L.; Lambiotte, R.; Lefebvre, E. Fast unfolding of communities in large networks. J. Stat. Mech. Theory Exp. 2008, 2008, P10008. [Google Scholar] [CrossRef]
- Google Maps. Google Mapping Services. 2020. Available online: www.google.gr/maps?hl=el (accessed on 18 December 2020).
- Tsiotas, D. Links between network topology and socio-economic framework of railway transport: Evidence from Greece. J. Eng. Sci. Technol. Rev. 2017, 10, 175–187. [Google Scholar] [CrossRef]
- Hellenic Statistical Authority—ELSTAT. Population and Social Conditions. 2019. Available online: https://www.statistics.gr/el/statistics/pop (accessed on 3 June 2020).
- Hellenic Statistical Authority—ELSTAT. Economy, Indices. 2019. Available online: https://www.statistics.gr/el/statistics/eco (accessed on 3 June 2020).
- Hellenic Statistical Authority—ELSTAT. Environment and Energy. 2019. Available online: https://www.statistics.gr/el/statistics/env (accessed on 3 June 2020).
- Polyzos, S.; Tsiotas, D. The contribution of transport infrastructures to the economic and regional development. Theor. Empir. Res. Urban Manag. 2020, 15, 5–23. [Google Scholar]
- Polyzos, S.; Tsiotas, D. Measuring structural changes of the Greek economy during the period of economic crisis. Manag. Res. Pract. 2020, 12, 5–24. [Google Scholar]


| Modularity Groups (Size) | Socio-Economic and Geographical Semiology | |
|---|---|---|
| MAX (a) | MIN (b) | |
| Group (0,0,1) (13 prefectures) | Northern and eastern location; urbanization; specialization in winter tourism activities; environmental wealth. | Area; seasonality; ports; camping; beaches. |
| Group (1,1,0) (1 prefecture) | Northern and west location; rich geomorphological configuration; mainland geomorphology; rich rail and airport configuration; high secondary sector specialization; high mountainous activities. | Coastal or island area; seasonality; poor road density and roads; low primary and tertiary sector specialization; low tourism profile; low environmental wealth, low cultural resources profile. |
| Group (1,1,1) (5 prefectures) | Mainland geomorphology; urbanization; high tertiary sector specialization; high environmental wealth. | Coastal or island area; poor geomorphological configuration; seasonality; poor ports and airports configuration; population and human capital; low income; low secondary sector specialization; low tourism profile; low beach environment; low cultural resources profile. |
| Group (2,2,0) (32 prefectures) | Southern and eastern location; coastal or island area, high seasonality; rich road density and ports configuration; high urbanization; high primary and tertiary sector specialization; high tourism profile; high environmental quality; high capacity of cultural resources. | Poor geomorphological configuration; poor rail configuration; low secondary sector specialization; low mountainous activities. |
| Modularity Group | |||||||||||||||||||
| Group Size | |||||||||||||||||||
| 32 | 13 | 5 | 1 | 32 | 13 | 5 | 1 | 32 | 13 | 5 | 1 | 32 | 13 | 5 | 1 | ||||
| Group Label | |||||||||||||||||||
| (2,2,0) | (0,0,1) | (1,1,1) | (1,1,0) | (2,2,0) | (0,0,1) | (1,1,1) | (1,1,0) | (2,2,0) | (0,0,1) | (1,1,1) | (1,1,0) | (2,2,0) | (0,0,1) | (1,1,1) | (1,1,0) | ||||
| Common Cases Between MOD and PCA Groups (intersection) | |||||||||||||||||||
| Group Size | Group Label | ◂Relevance to PCA Groups | Intersection Frequencies | ▴Relevance to MOD Groups | Differences in Relevance (MOD-PCA) | ||||||||||||||
| PCA Group | #1 (max filtering) | 38 | PCM#1 | 84.2% | 13.2% | 2.6% | 32 | 5 | 1 | 100% | 38.5% | 20.0% | 15.8% | 25.3% | 17.4% | ||||
| 7 | PCM#2 | 100% | 7 | 53.8% | −46.2% | ||||||||||||||
| 4 | PCM#3 | 100% | 4 | 80.0% | −20.0% | ||||||||||||||
| 1 | PCM#4 | 100% | 1 | 100% | |||||||||||||||
| 1 | PCM#5 | 100% | 1 | 7.7% | −92.3% | ||||||||||||||
| #2 (min filtering) | 1 | PCM#1 | 100% | 1 | 7.7% | −92.3% | |||||||||||||
| 7 | PCM#2 | 85.7% | 14.3% | 6 | 1 | 18.8% | 20.0% | −67.0% | 5.7% | ||||||||||
| 13 | PCM#3 | 69.2% | 30.8% | 9 | 4 | 28.1% | 30.8% | −41.1% | |||||||||||
| 14 | PCM#4 | 7.1% | 14.3% | 14.3% | 1 | 2 | 2 | 3.1% | 15.4% | 40.0% | −4.0% | 1.1% | 25.7% | ||||||
| 8 | PCM#5 | 50.0% | 37.5% | 12.5% | 4 | 3 | 1 | 12.5% | 23.1% | 100% | −37.5% | −14.4% | 87.5% | ||||||
| 5 | PCM#6 | 20.0% | 40.0% | 40.0% | 1 | 2 | 2 | 3.1% | 15.4% | 40.0% | −16.9% | −24.6% | |||||||
| 3 | PCM#7 | 66.7% | 33.3% | 2 | 1 | 6.3% | 7.7% | −60.4% | −25.6% | ||||||||||
| Lagend | 0% | 0–20% | 20–40% | 40–60% | 60–80% | ≥80%% | PCA < 0 | MOD > 0 | |||||||||||
Publisher’s Note: MDPI stays neutral with regard to jurisdictional claims in published maps and institutional affiliations. |
© 2021 by the authors. Licensee MDPI, Basel, Switzerland. This article is an open access article distributed under the terms and conditions of the Creative Commons Attribution (CC BY) license (http://creativecommons.org/licenses/by/4.0/).
Share and Cite
Tsiotas, D.; Krabokoukis, T.; Polyzos, S. Detecting Tourism Typologies of Regional Destinations Based on Their Spatio-Temporal and Socioeconomic Performance: A Correlation-Based Complex Network Approach for the Case of Greece. Tour. Hosp. 2021, 2, 113-139. https://doi.org/10.3390/tourhosp2010007
Tsiotas D, Krabokoukis T, Polyzos S. Detecting Tourism Typologies of Regional Destinations Based on Their Spatio-Temporal and Socioeconomic Performance: A Correlation-Based Complex Network Approach for the Case of Greece. Tourism and Hospitality. 2021; 2(1):113-139. https://doi.org/10.3390/tourhosp2010007
Chicago/Turabian StyleTsiotas, Dimitrios, Thomas Krabokoukis, and Serafeim Polyzos. 2021. "Detecting Tourism Typologies of Regional Destinations Based on Their Spatio-Temporal and Socioeconomic Performance: A Correlation-Based Complex Network Approach for the Case of Greece" Tourism and Hospitality 2, no. 1: 113-139. https://doi.org/10.3390/tourhosp2010007
APA StyleTsiotas, D., Krabokoukis, T., & Polyzos, S. (2021). Detecting Tourism Typologies of Regional Destinations Based on Their Spatio-Temporal and Socioeconomic Performance: A Correlation-Based Complex Network Approach for the Case of Greece. Tourism and Hospitality, 2(1), 113-139. https://doi.org/10.3390/tourhosp2010007