1. Introduction
Zoo enclosures do not fully meet the needs of wild animals [
1] meaning that animals cannot experience the habitat structures or features that they would in the wild. Appropriate territory or home range areas and specific biotic conditions that are required for the performance of adaptive behaviour patterns can be hard to replicate in captivity [
2,
3], limiting activity patterns or behavioural outputs [
4,
5]. Limits on activity patterns often correspond to the amount of biologically relevant space provided in the enclosure since a limited amount of useable space can reduce the range of behaviours an animal can perform [
6,
7]. Understanding how environmental conditions specifically influence an animal’s responses can be achieved through the monitoring of behaviour and occupancy of space [
8,
9]. Assessment of daily activity patterns within the different spatial zones provided is an important tool that can (in part) infer welfare states [
3,
9,
10]. Such data collection enables detailed behavioural profiles to be created, which in turn enable our understanding of what an animal gains and needs from its immediate environment [
11]. This eventually allows for the creation of enclosures tailored to the behavioural and biological priorities of species or individual animals [
12]. Identification of positive welfare outputs can be inferred from enclosure use studies that observe an animal occupying multiple zones throughout the enclosure and that document specific zones being actively avoided [
13].
Different research approaches can be applied to understand enclosure use and inform future improvements, including multi-zoo comparison studies [
14] and post-occupancy evaluation of behaviour and space use across conditions [
15,
16]. To further improve the helpfulness of these empirical studies it is important to expand the researcher’s understanding of whether certain methods of measuring space usage (especially those that consider the biological relevance of enclosure zones) are more appropriate under certain conditions, such as for social species where usage of an enclosure will be influenced by ties to the group overall. Distribution of flamingos across their enclosure for example, be they standing as a tight group in one location or loosely associating in smaller cohorts across numerous enclosure areas, provides information on flock level welfare [
17,
18], as the more enclosure space used, the more comfortable the flock is within its environment.
Three examples of empirical methods for assessing an animal’s spatial use of an enclosure are the unmodified Spread of Participation Index, SPI [
19], the modified SPI, mSPI [
20] and the Electivity Index, EI [
21,
22]. Each of these methods vary in how they calculate enclosure usage, but all ultimately provide a score that can be used to interpret how evenly enclosure zones are being used. SPI involves an enclosure being zoned into areas of equal size and the time an animal spends in each zone is recorded. Use of the unmodified SPI is preferable when an animal’s entire available space needs investigating and either resources are distributed evenly throughout each zone or enclosure complexity means assigning zones on a resource level is challenging. mSPI was developed to study enclosure use from a resource-based context, which is helpful for assessing space usage when an enclosure contains multiple zones of differing sizes and value to the animal.
Like mSPI, EI allows the assessment of use of biologically relevant zones that are uneven in size, but in this case each zone can be assessed in terms of utilisation [
23]. Identification of species enclosure areas that are under-utilised and that are over-utilised allows for preferred enclosure features to be recognised (and potentially increased in availability) and provides keepers a clear idea of areas in need of improvement. These different methods can provide incredibly useful quantifiable evidence to inform animal care and enclosure design. However, despite some studies [
24,
25,
26,
27,
28] there is minimal literature available on the use of such enclosure usage tools on social or colonial species, such as flock-dwelling birds.
Enclosure use studies commonly focus on individual animals or small groups and can neglect assessment of how enclosure use may vary in large, social groups where the instinct to stay with the group may be stronger than moving around independently. Social relationships that are present between individuals that live in large groups will influence behaviour, and therefore how individuals use their space. There is a need to understand how applicable and informative methods of measuring enclosure use are on social species. To address this gap in the literature, flamingos (Phoenicopteriformes) were selected as the study species. A highly social nature and large global captive population make flamingos ideal candidates to determine if current methods of enclosure use measurements are appropriate for group-living, colonial species. Research has already addressed how season and time influence flamingo activity and welfare [
25]. However it is not yet clear whether measuring individual activity or the flock’s behaviour overall is the more appropriate approach for providing a clearer picture of enclosure usage, especially given the evidence that individual animals display different personalities and hence responses to environmental variables [
29].
The main aim of this project was to evaluate if group level enclosure usage assessment provides useful information on individual choices (of where to be within the space provided). Whilst the influence of remaining with the main colony may be strong for individual animals of colonial or gregarious species, counting where the main group is and using this as an assessment of overall enclosure usage may mean important data on individual needs (e.g., opportunities for assessment of zone preferences) can be missed. This study aimed to determine whether the results obtained from the use of three indices (SPI, mSPI and EI) can provide comparable information on preferences for enclosure usage at the individual and group level. We aimed to understand whether certain methods are more applicable and informative when applied to group-living species and how they use their space. Measures of enclosure usage were considered alongside environmental and anthropogenic factors to capture as many potential influences as possible on how birds use their space.
2. Materials and Methods
Data collection for this study was originally undertaken for a larger project “Listening to the Zoo” funded by the Economic and Social Council (ESRC Grant ES/R009554/1) and all data were collected by the corresponding author as a postdoctoral researcher on this grant. The first author of this paper extracted all enclosure usage data from video recording of the birds made for the original project, to use these data as much as possible.
2.1. Sample Populations and Enclosure Zones
Two species of flamingo at two zoological collections were used for observational data collection. Bristol Zoo Gardens (BZ) houses greater flamingos (Phoenicopterus roseus), n = 56, in a mixed-species (several species of smaller wading birds and waterfowl), walk-through aviary. Paignton Zoo Environmental Park (PZ) houses Chilean flamingos (P. chilensis), n = 53, in a mixed-species (various species of waterfowl), open-topped enclosure with no walk-through access. Both flamingo species were fed a flamingo-specific pellet twice a day, provided in a separate feeding area of each enclosure. Husbandry routines were performed daily by keepers at each zoo but were unobtrusive and not disruptive to the bird’s general activity.
The enclosure at PZ is at the front of the zoo and is accessible to visitors as they leave the main entrance building and start their journey around the zoo. Visitors can choose to turn left, walking past the flamingos to the reptile house, or right, and away from the flamingos into a large walk-through aviary. The flamingo enclosure at BZ is also at the front of the zoo, and is one of two exhibits (the other, at the time of data collection, housed drills, Mandrillus leucophaeus) that visitors first experience as they walk into the zoo.
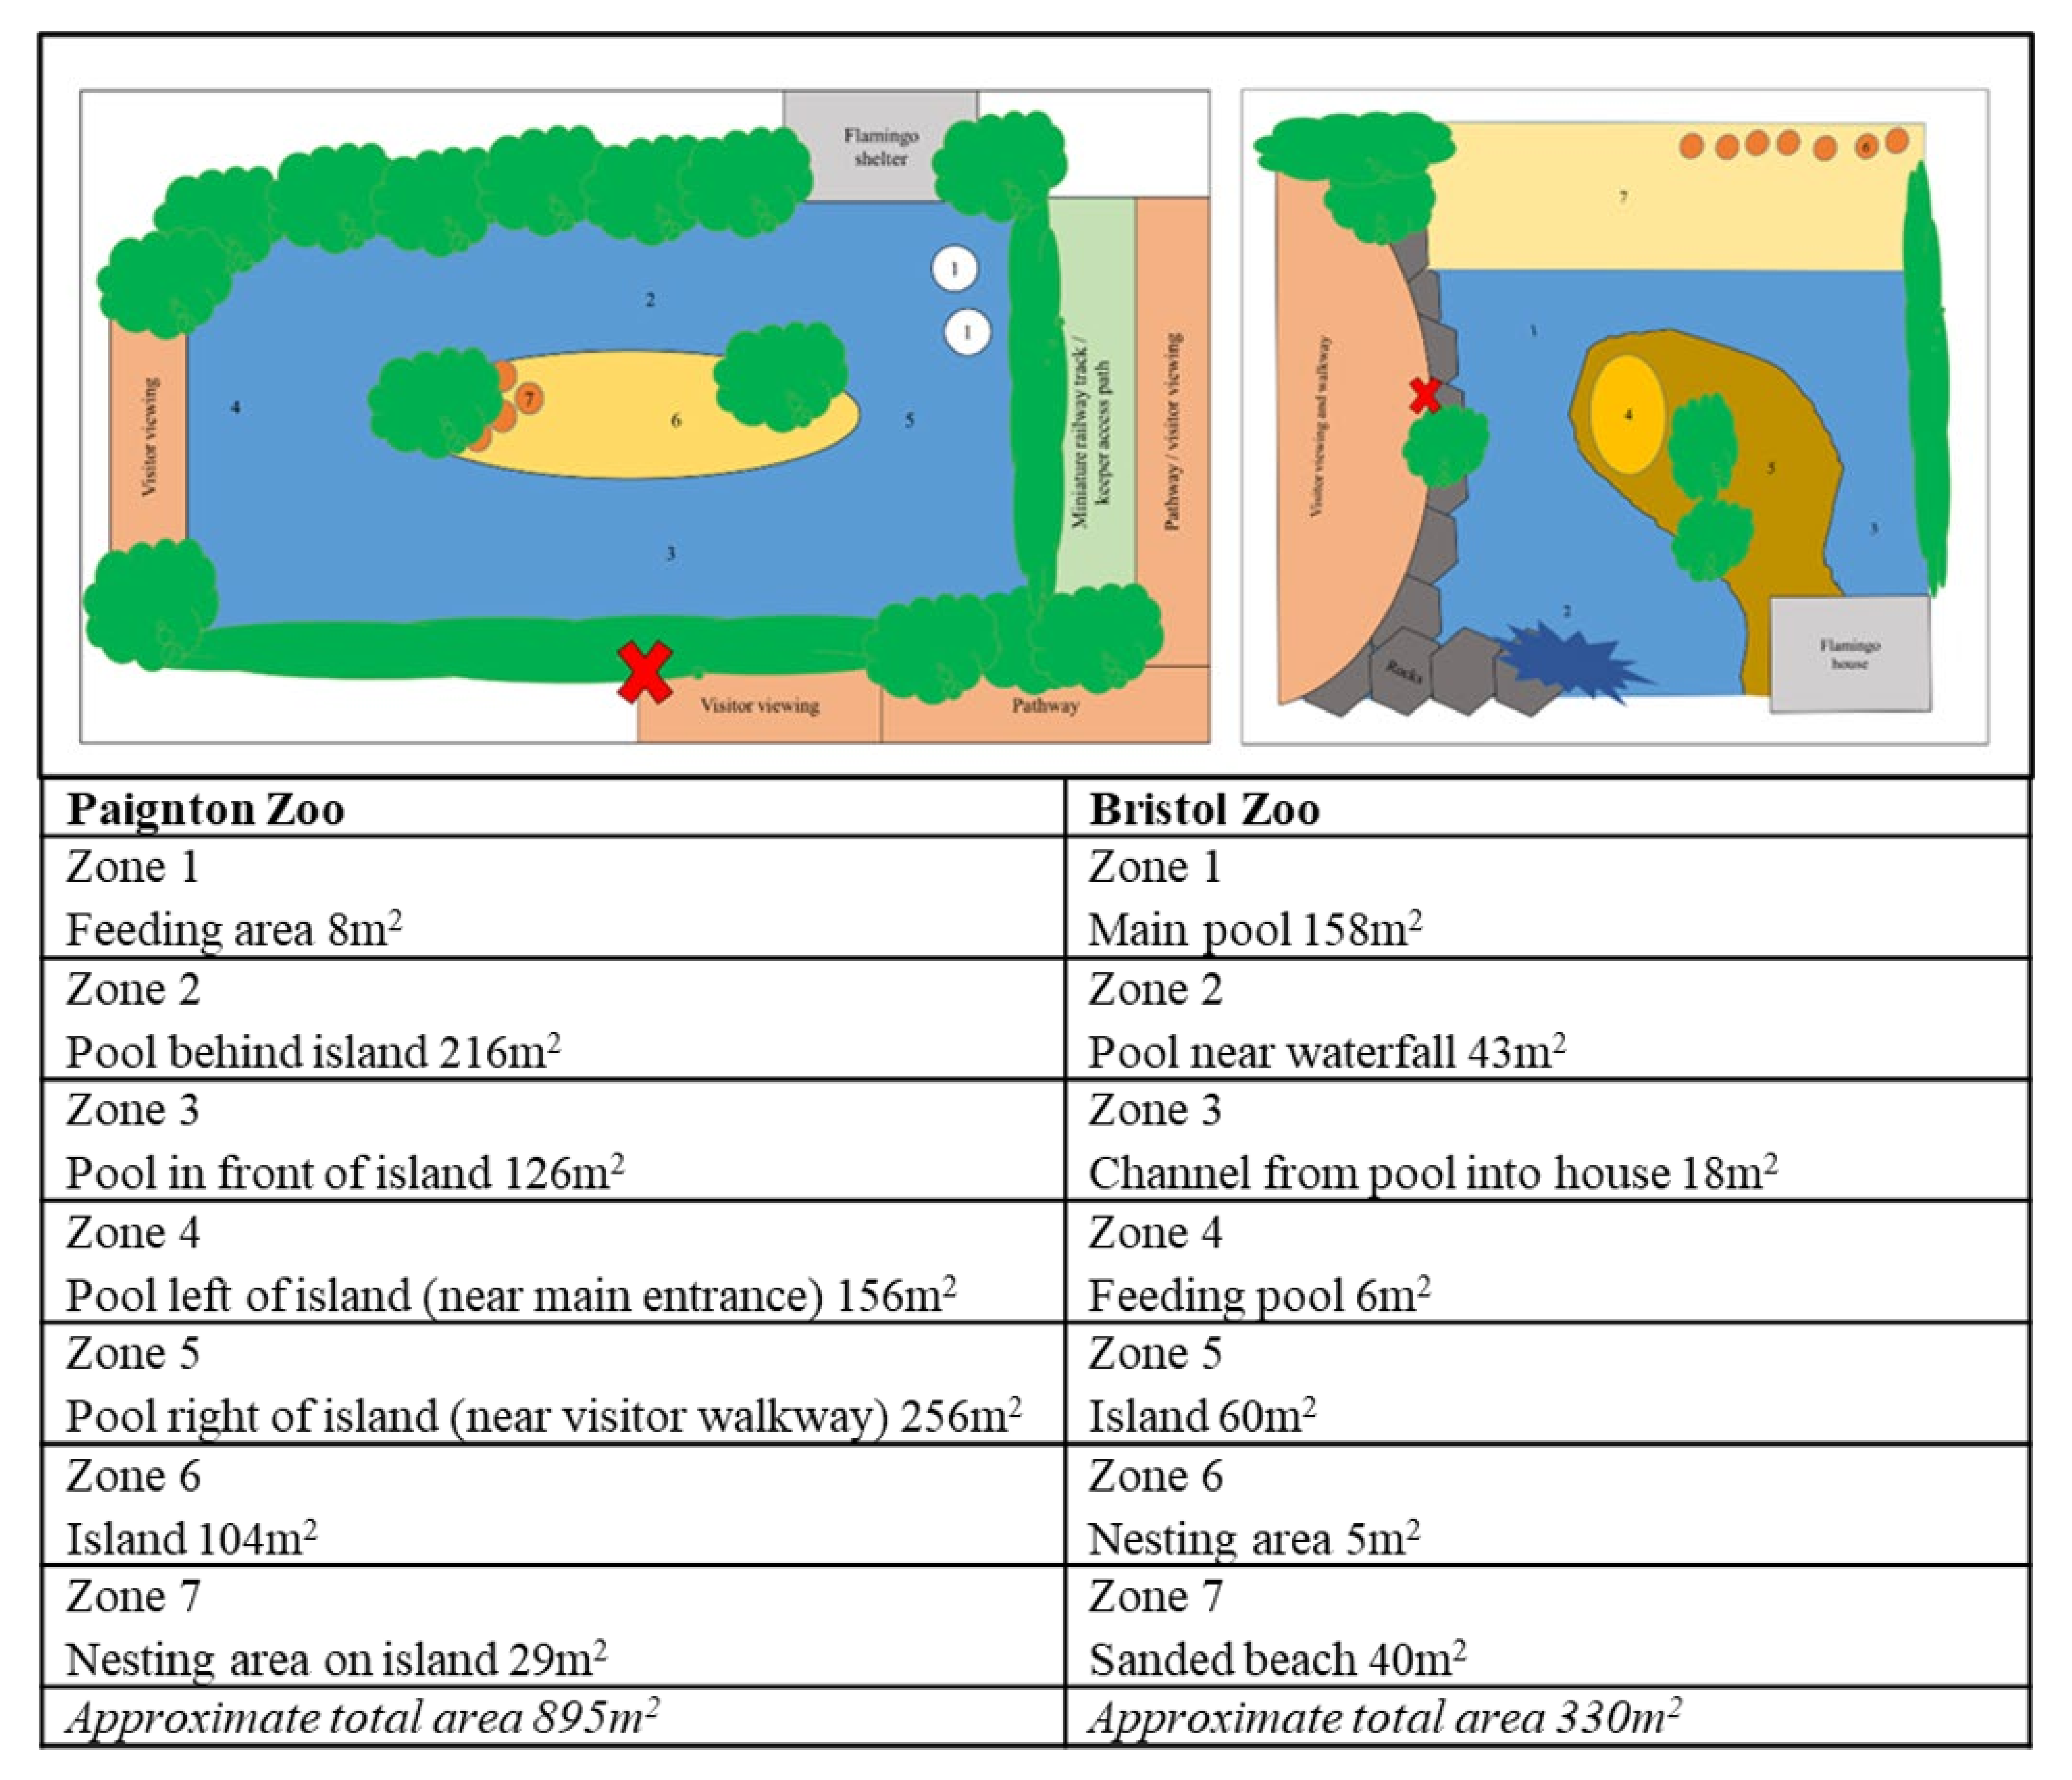
Each enclosure was divided into zones based on the biological relevance of space and resources to the flamingos (i.e., exhibit features that could be accessed and used by the flamingos for specific activities). These zones were measured as discrete sections of the overall enclosure area (
Figure 1). The total area of each enclosure was calculated using the “draw polygon” function from Google Earth Pro v. 7.3.2.5776 (Google, 2019).
Figure 1 provides information on the zone sizes within each enclosure. The number of zones was influenced by the size of dry land and water in the exhibits, with a large pool being divided into front, back, left, and right based on water depth and access for the birds.
2.2. Collecting Enclosure Usage Data
Data from each flamingo flock were recorded at five separate times per day for five days, with observations lasting 20 min each time. Video footage was collected from PZ on 15th, 26th, 29th April 2019 and the 3rd and 16th May 2019 at 10:00, 11:00, 12:00, 14:00 and 15:00 for each day. No 15:00 observation took place on 15th April due to unforeseen circumstances. Data were collected at BZ on 30 April 2019 and 4–7 May 2019 with the same observation sample times. An HD Panasonic Lumix digital camera was used to record all footage at both zoos and the camera was maintained at the same location within the enclosure for each recording session.
We distinguish between “flock” referring to the population of birds in the enclosure at the zoo, “group” referring to data collected at the group level by counting birds and “individual” referring to data collected by following individually identifiable flamingos. Group and individual bird enclosure usage data were collected from video and photographic records. For group-level enclosure usage, data were collected by counting the number of flamingos occupying each zone at one-minute sample points using an instantaneous scan sampling method [
30]. To capture any birds that had moved out of view of the video camera, still photos, taken on an Honor 10 Lite smartphone, allowed the maximal number of flamingos to be recorded per sampling point. To collect individual flamingo data, each 20 min video was paused at the start of play, and flamingos were assigned numbers from left to right of the screenshot to allow for different birds to be randomly selected. A random number generator [
31] was used to identify the 12 individual flamingos that would be followed (i.e., bird number 6 would be the sixth bird from the left, bird number 15 would be the fifteenth bird from the left and so on). Instantaneous focal sampling with the same one-minute intervals was used to record the enclosure use of individuals during the 20 min sampling period. If a focal bird moved out of view, the footage was reversed and replayed to relocate the individual, if possible. If it was impossible to relocate a specific individual, the footage would be restarted, and a new random number generated to recommence data collection on a different individual bird.
2.3. Calculating Enclosure Usage
We compared the difference between the SPI, the mSPI and an EI at the group and individual level to see how much the “pull” of the group influences the choice of the individual when deciding on where to be within the enclosure. Not all data points could be analysed for individual birds, as recordings from 11:00 4 May 2019 at BZ, and recordings from 15:00 26 April 2019, 15:00 29 April 2019 and 12:30 3 May 2019 at PZ did not provide clear enough footage to follow individual flamingos due to the bird’s behaviour. Here, it is specified how the equation was applied based on whether individual data (individual) or group data (group) were being inputted. Enclosure use for group data was calculated for each one-minute observation period. Enclosure use for the individual flamingos was calculated for the total 20 min observation period.
2.3.1. Traditional SPI
N is the total number of observations in all zones (individual) or the total number of flamingos in all zones during that sample time (group).
M is the mean frequency of observations (individual) or flamingos (group) per zone (i.e., N divided by the number of zones).
nb is the number of zones with observations (individual) or flamingos (group) less than M.
na is the number of zones with observations (individual) or flamingos (group) greater than M.
Fa is the total number of observations (individual) or flamingos (group) in all zones with observations/flamingos less than M.
Fb is the total number of observations (individual) or flamingos (group) in all zones with observations/flamingos greater than M.
A score between 0 and 1 is generated, with values approaching 0 suggesting that all zones are being used equally and those approaching 1 implying uneven enclosure zone occupancy, i.e., some zones are used more often than others. When the traditional SPI was applied, zones were combined into five zones of equal size, rather than broken into biological zones, to fit the requirements of the equation. For PZ this meant combining the nesting and island zones (Zone numbers 6 and 7) together and the pool on the right of the enclosure and the feeding zone together. The island and feeding area (Zone numbers 4 and 5), and the sandy area zone and nesting area zone were combined at BZ (Zone numbers 6 and 7).
2.3.2. Modified SPI
N is the total number of observations (individual) or flamingos (group) in all zones.
fo is the observed frequency of observations (individual) or flamingos (group) in a given zone.
fe is the expected number of observations (individuals) or flamingos (group) in a given zone based on the zone’s size.
femin is the expected number of observations (individual) or flamingos (group) in the smallest zone.
The same 0 to 1 score is provided as per the traditional SPI.
2.3.3. Electivity Index
ri is the observed proportion of time spent in a zone (individual) or number of flamingos (group).
pi is the expected time (individual) or flamingos (group) in that zone.
n refers to the number of zones available to the study animal.
Values are generated for each zone and can range from −1 to 1, with −1 representing a zone that is under-utilised and 1 representing an over-utilised zone. A score of 0 suggests equal usage of that zone.
2.4. Data Analysis
Data analysis was conducted in R v. 4.1.0 using RStudio v 1.4.1717 [
32,
33] and Minitab v 20.3 [
34]. To address the problem of multiple observations taken on the same birds, differences in group SPI compared to individual SPI were assessed using repeated measures models run in R Studio using the “lmerTest” package [
35] for each flock of flamingos in turn. Each model included time of day as a fixed factor and date as a random factor. Model fit was assessed using plots of standardised residuals using the “plot(model name)” function in RStudio, in addition to the assessment of the calculated r
2 value using the “MuMin” package. To remove any predictors that may covary, the “car” package [
36] was used to calculate a variance inflation factor (VIF). Any predictors with a VIF >2 were removed from the model.
To evaluate overall daily variation in individual SPI compared to daily variation in group SPI, one-sample sign tests were run in Minitab. This test assessed differences in mSPI and SPI for both group and individual enclosure measurements at each zoo with median group m/SPI values calculated for comparison against individual m/SPIs for each condition at each zoo.
The same RStudio packages were used to determine differences in group and individual EI for each zoo. Due to the multiple running of the model for each enclosure zone, the “anova(model name)” function was run, and significance calculated using Satterthwaite’s method. For these models, the outcome variable was the calculated EI for each observation for that specific enclosure zone, with time of day and group/individual data included as predictors. Date was included as a random factor. Due to the comparisons of multiple
p values, a corrected significance level was calculated using the Benjamini–Hochberg technique to avoid false discovery [
37] and the resulting Q values examined for any significant difference.
Any difference in time spent within each zone for the group and the individual birds was analysed using one-factor chi-squared tests run in Minitab. Significant occupancy of a zone across all time periods and avoidance of a zone was also analysed using cross-tabulation and chi-squared testing in Minitab. Again, comparison of multiple
p values was undertaken using a Benjamini and Hochberg [
37] correction to avoid false discovery.
3. Results
3.1. Comparing m/SPI Outputs When Using Group versus Individual Data
At PZ, there was a significant difference between the SPI for the individual birds and those values calculated for the group, with individual SPI being higher than for group data (model estimate = 0.13; SE = 0.021; df = 362.9; t value = 6.48; p < 0.001). There was no significant influence of time of day on the bird’s enclosure use at group or individual level. The same relationship is noted for the mSPI, with no effect of time of day but showing individual mSPI values to be significantly higher than those for the group (model estimate = 0.114; SE = 0.014; df = 361.8; t value = 7.99; p < 0.001).
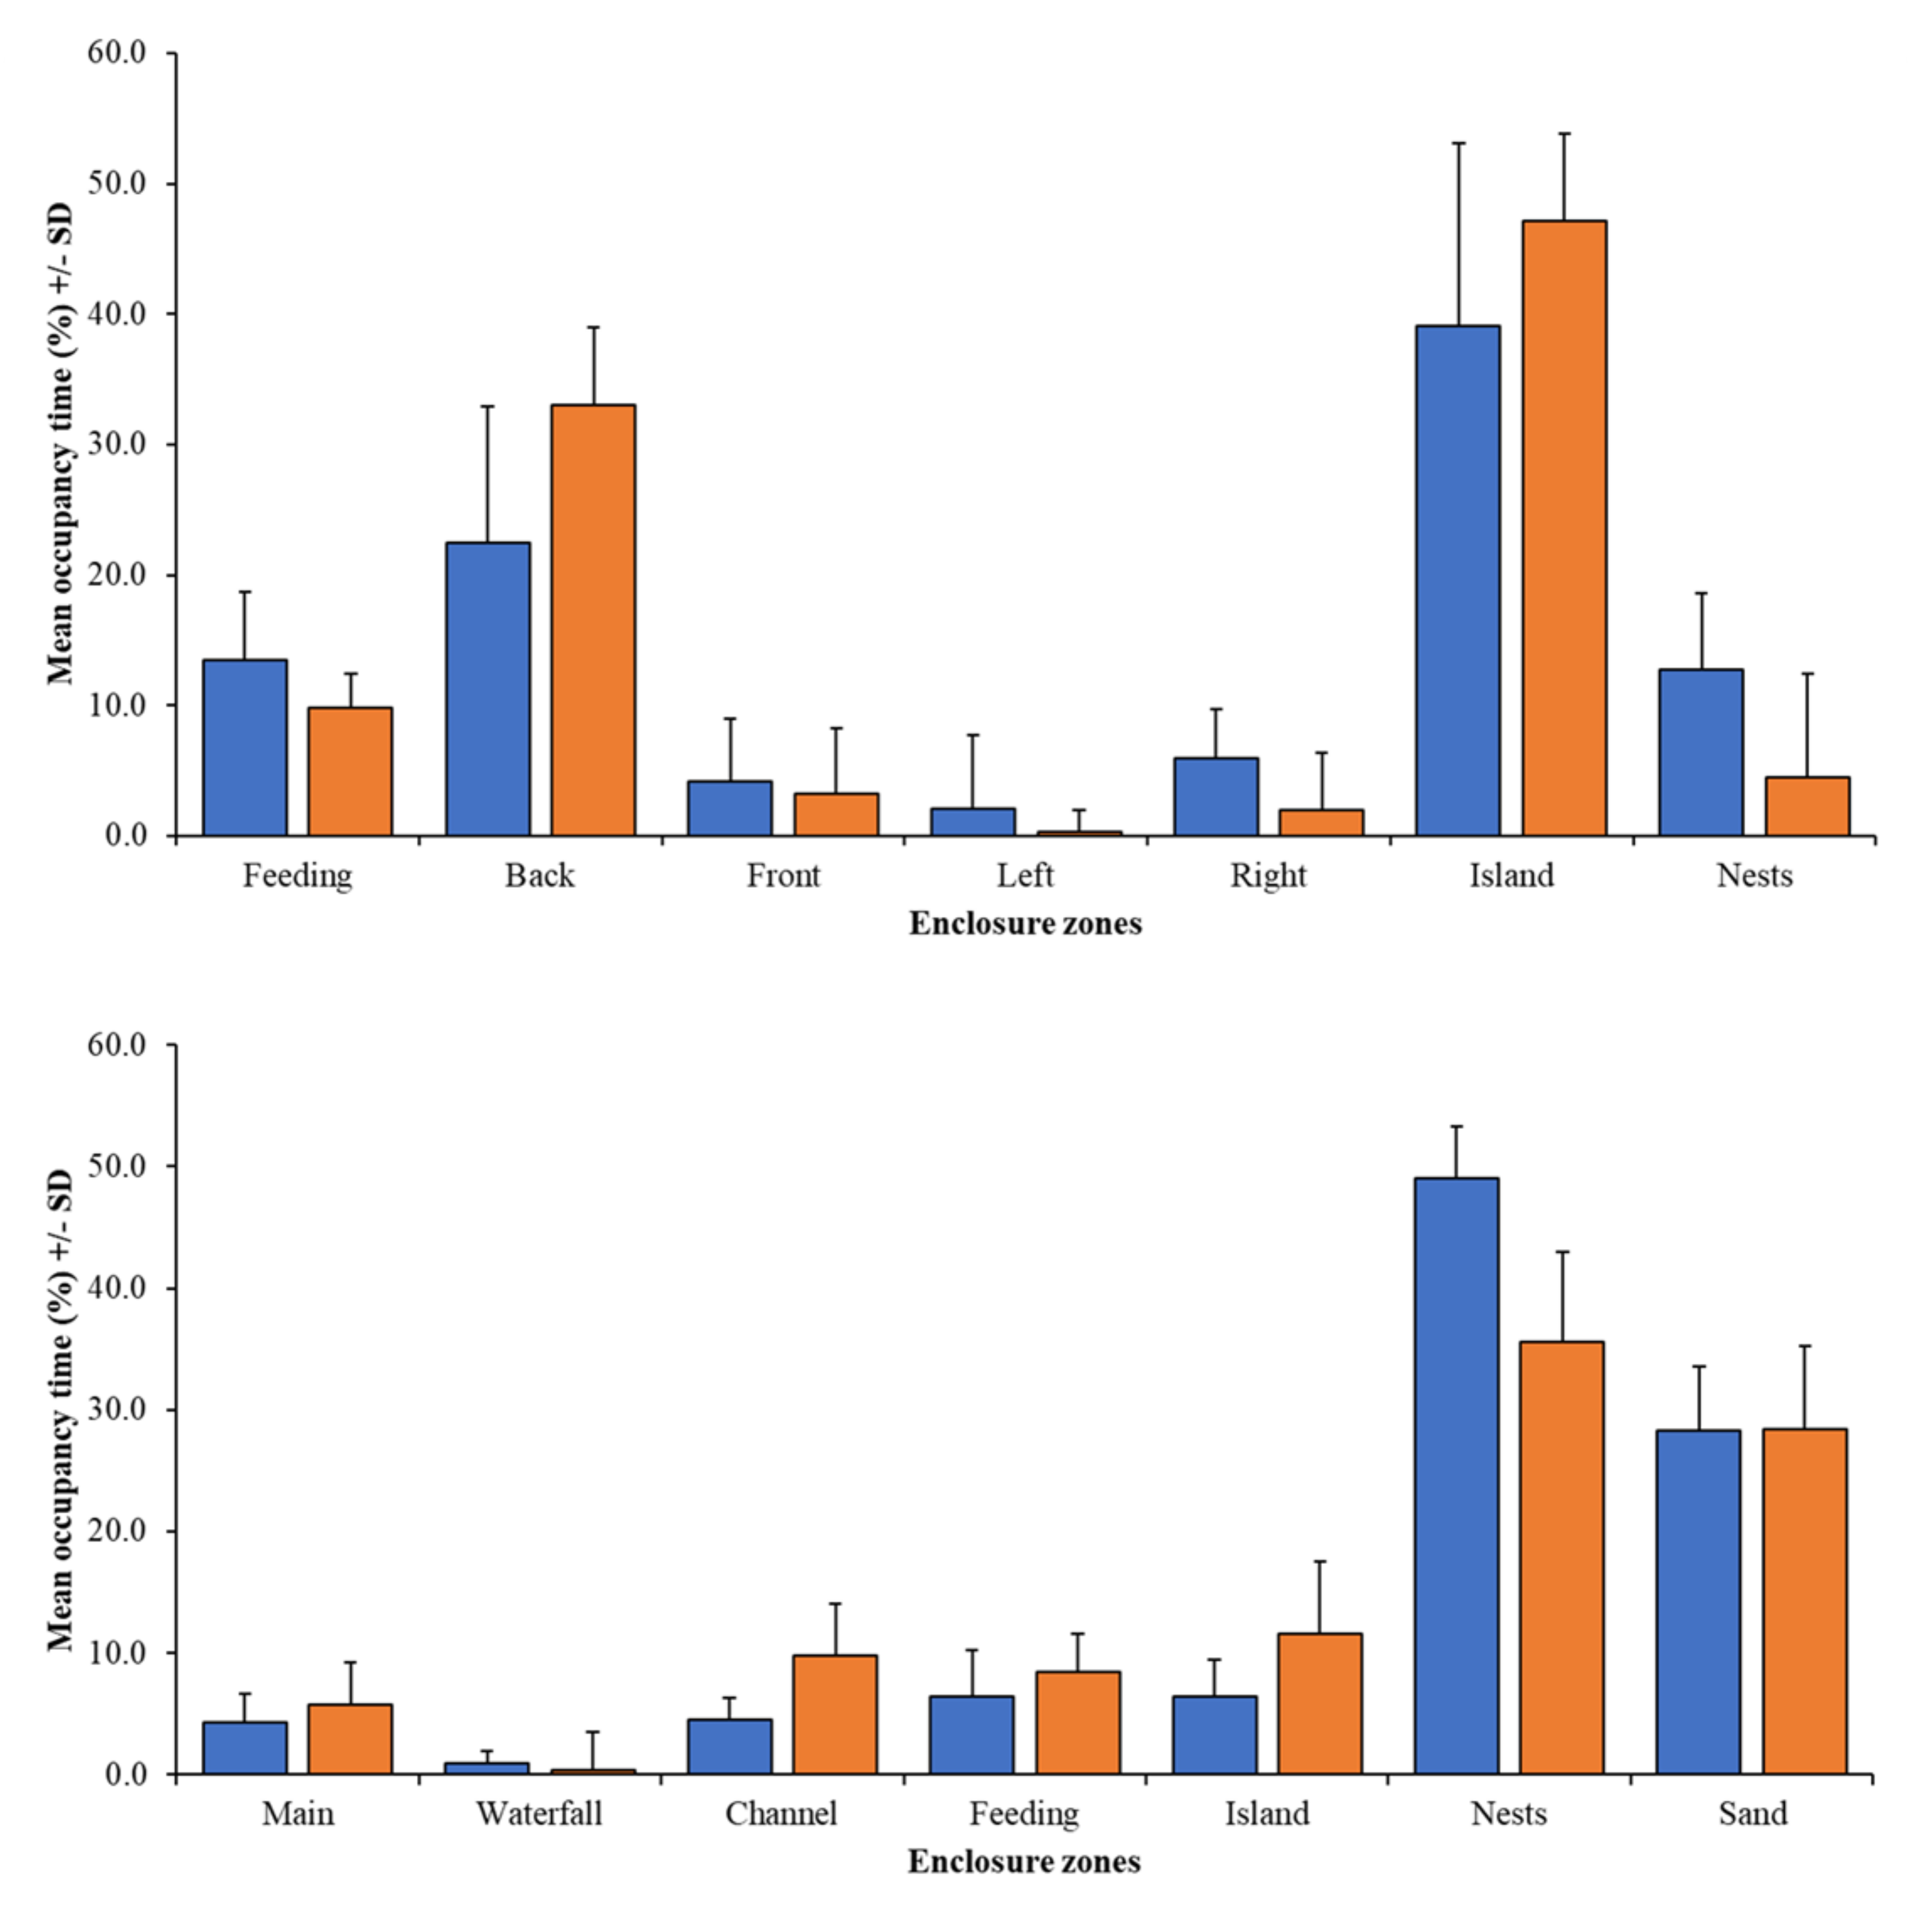
For BZ, enclosure usage calculation (group or individual) and time of day was significantly different for SPI and mSPI, with enclosure usage becoming less varied up to early afternoon (
Figure 2). However, the same pattern holds true as seen at PZ where individual m/SPI results are higher than for those of the group (SPI model estimate = 0.067; SE = 0.011; df = 778.3; t value = 6.328;
p < 0.001/mSPI model estimate = 0.086; SE = 0.0081; df = 778.3; t value = 10.69;
p < 0.001).
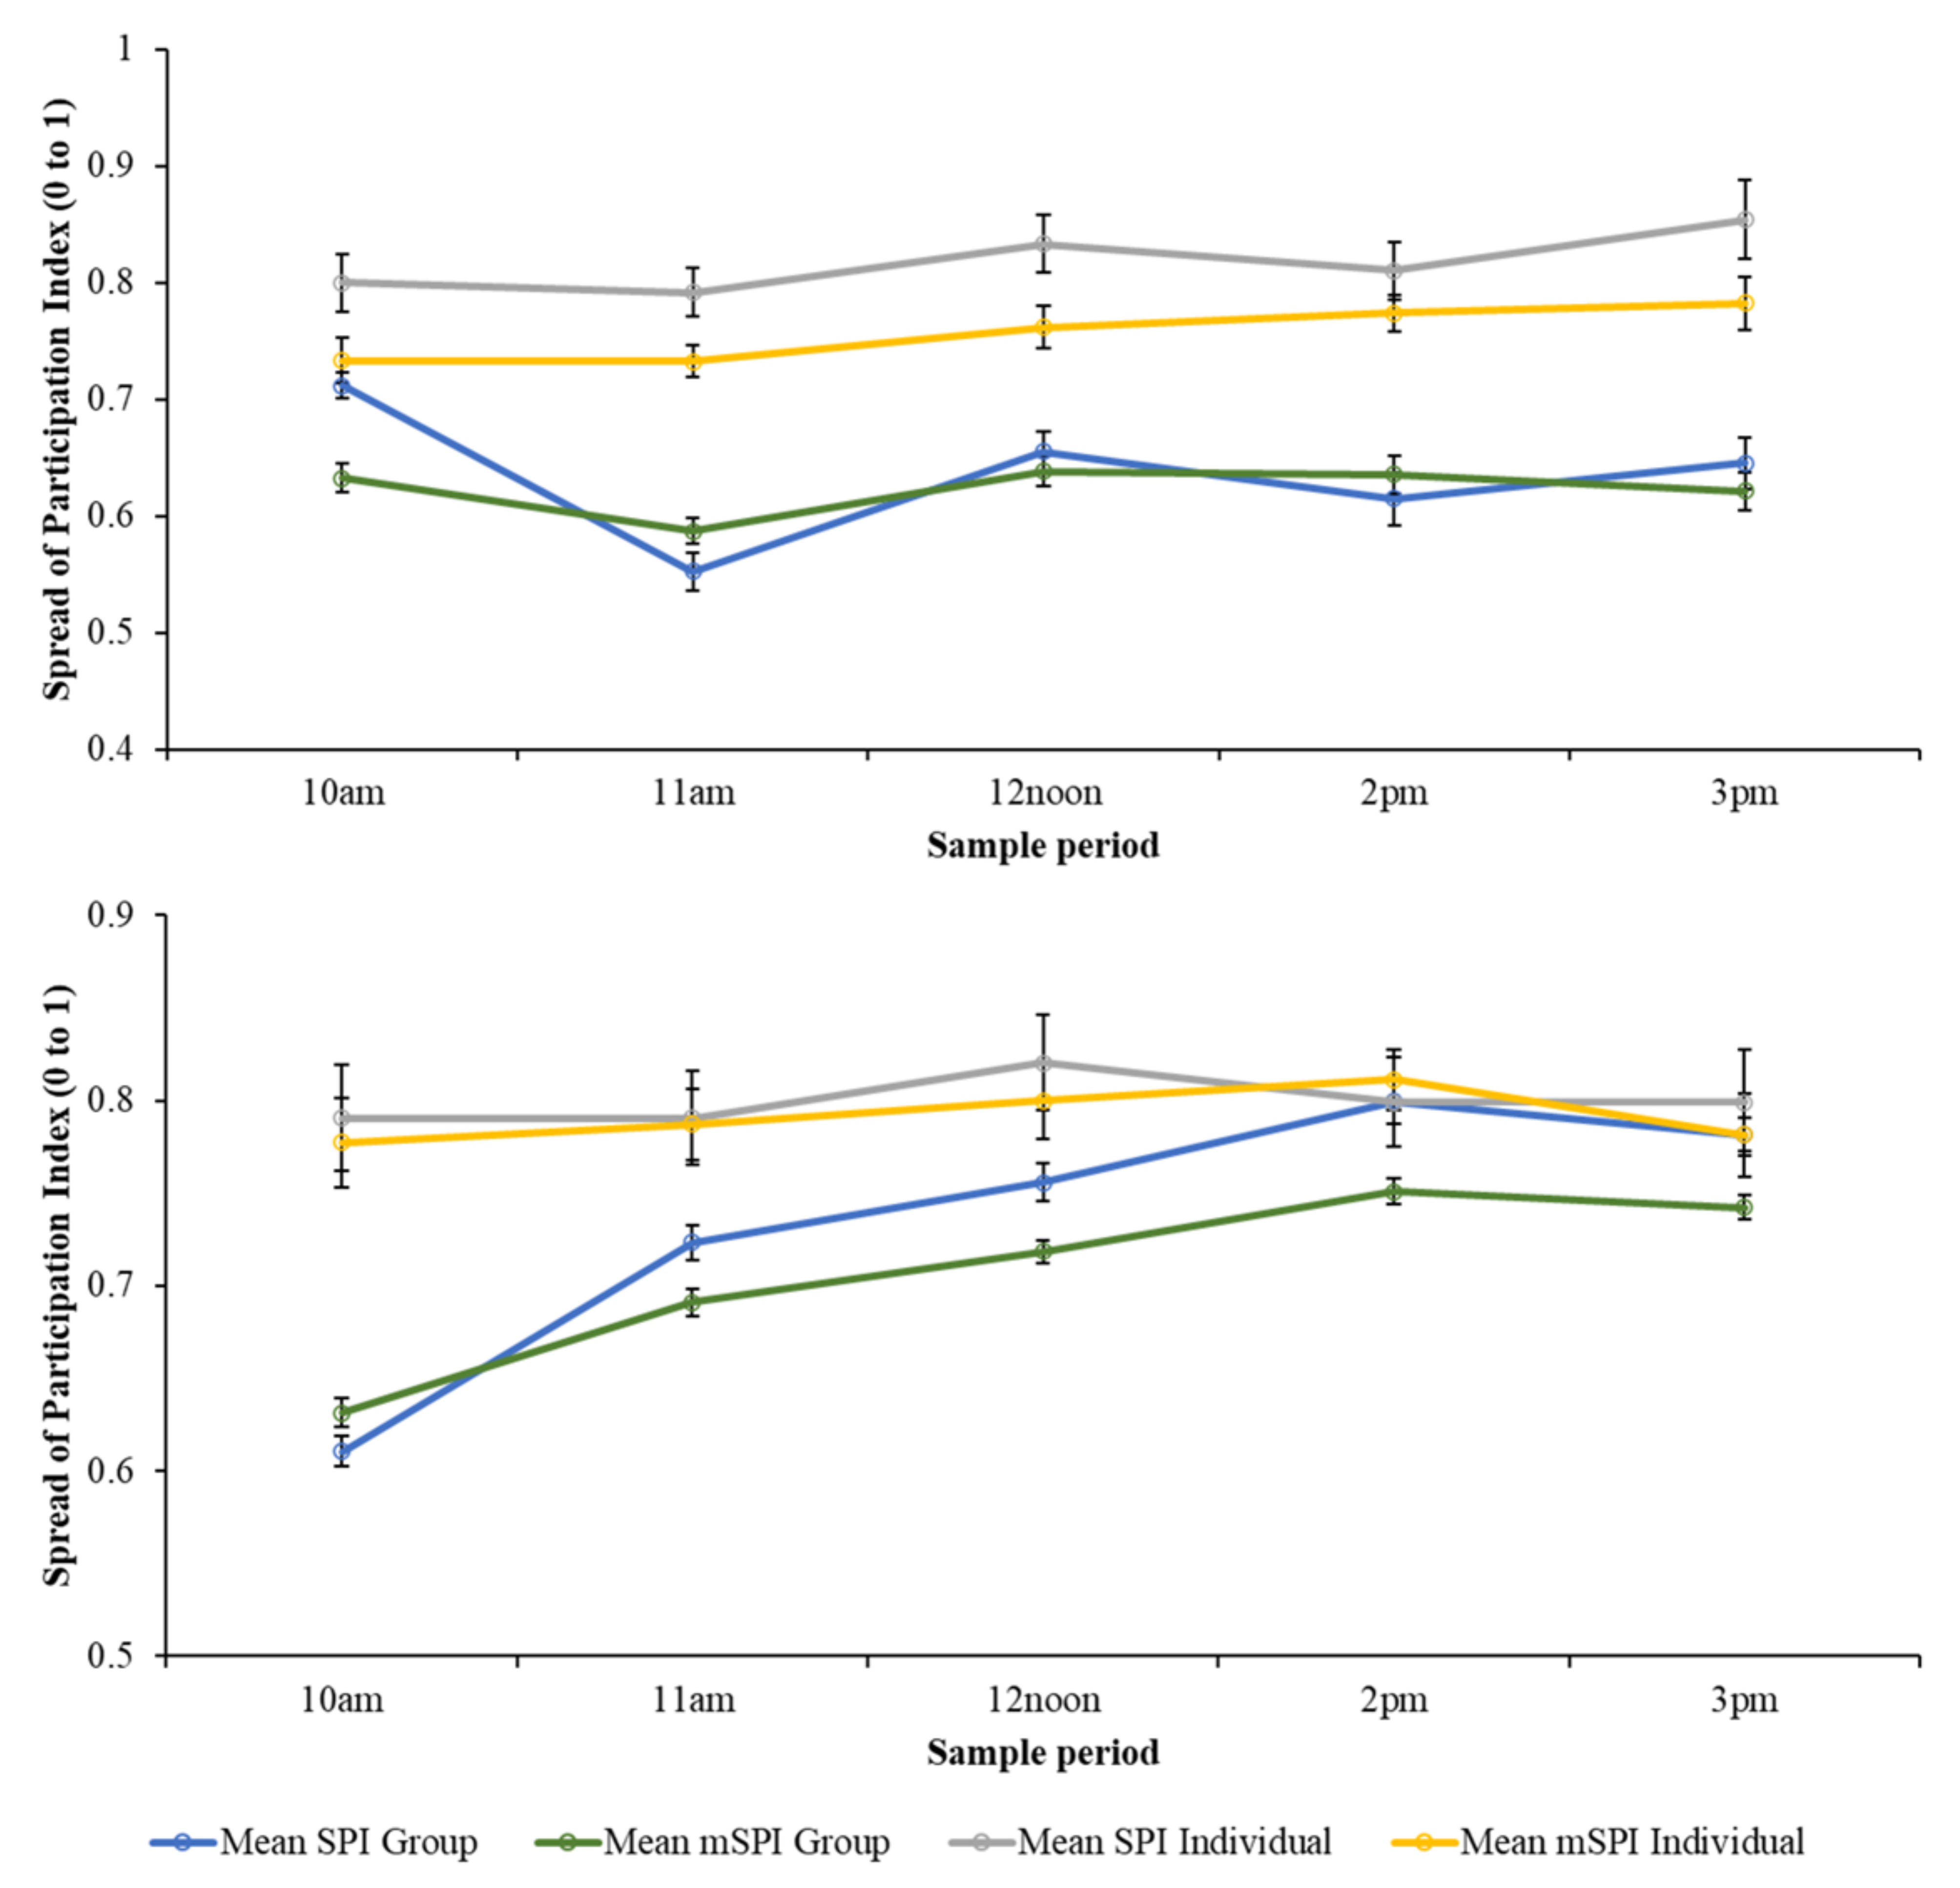
The output from a one-sample sign test showed that when comparing the BZ mSPI group median (SPI = 0.71) to the individual mSPI values, more individual mSPI values were higher than the group median (214/288). Similarly, significantly more individual mSPI values from PZ (223 out of 252) were higher than the group mSPI median value (SPI = 0.6068). When comparing SPI values from BZ, significantly more individual SPI values were higher (190 out of 288) than the group median value (SPI = 0.73). At PZ, significantly more individual SPI values were higher (185 out of 252) than the group median value (SPI = 0.73).
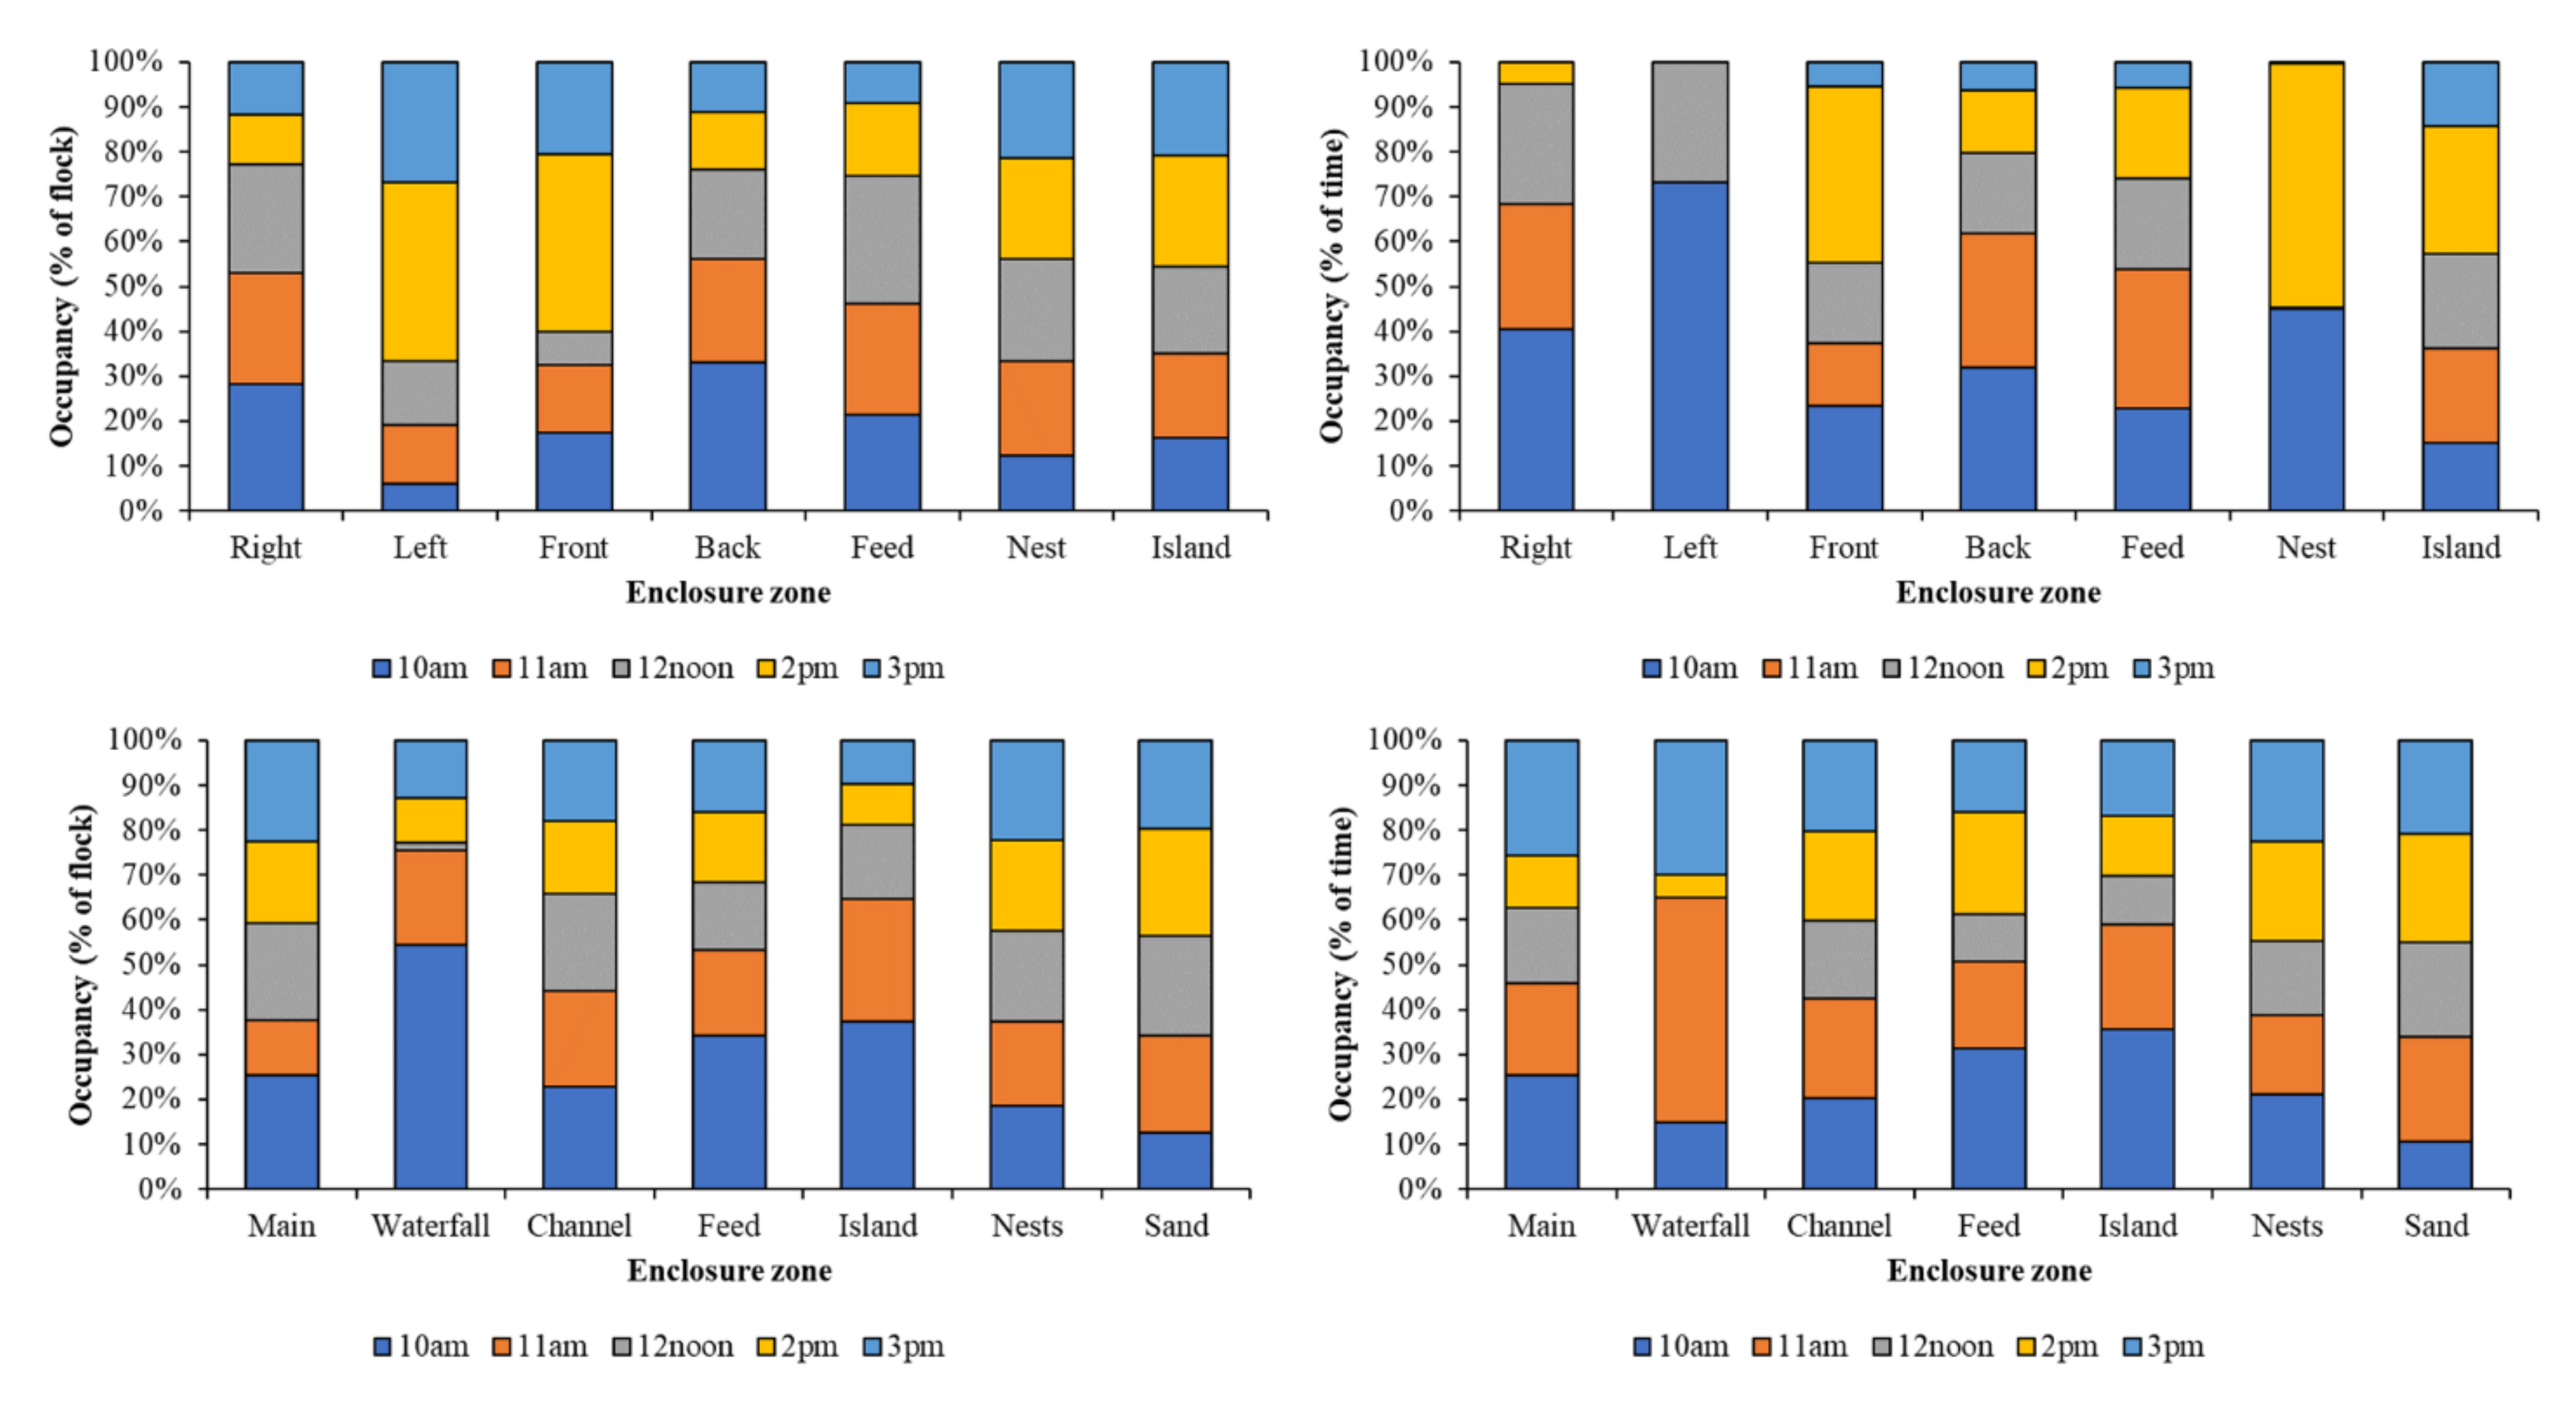
Although there were fewer zones included in the SPI calculation and a wider range of zone sizes included in the mSPI calculation,
Figure 2 shows a similar pattern of zone occupancy for the SPI and mSPI data, for both group and individual birds.
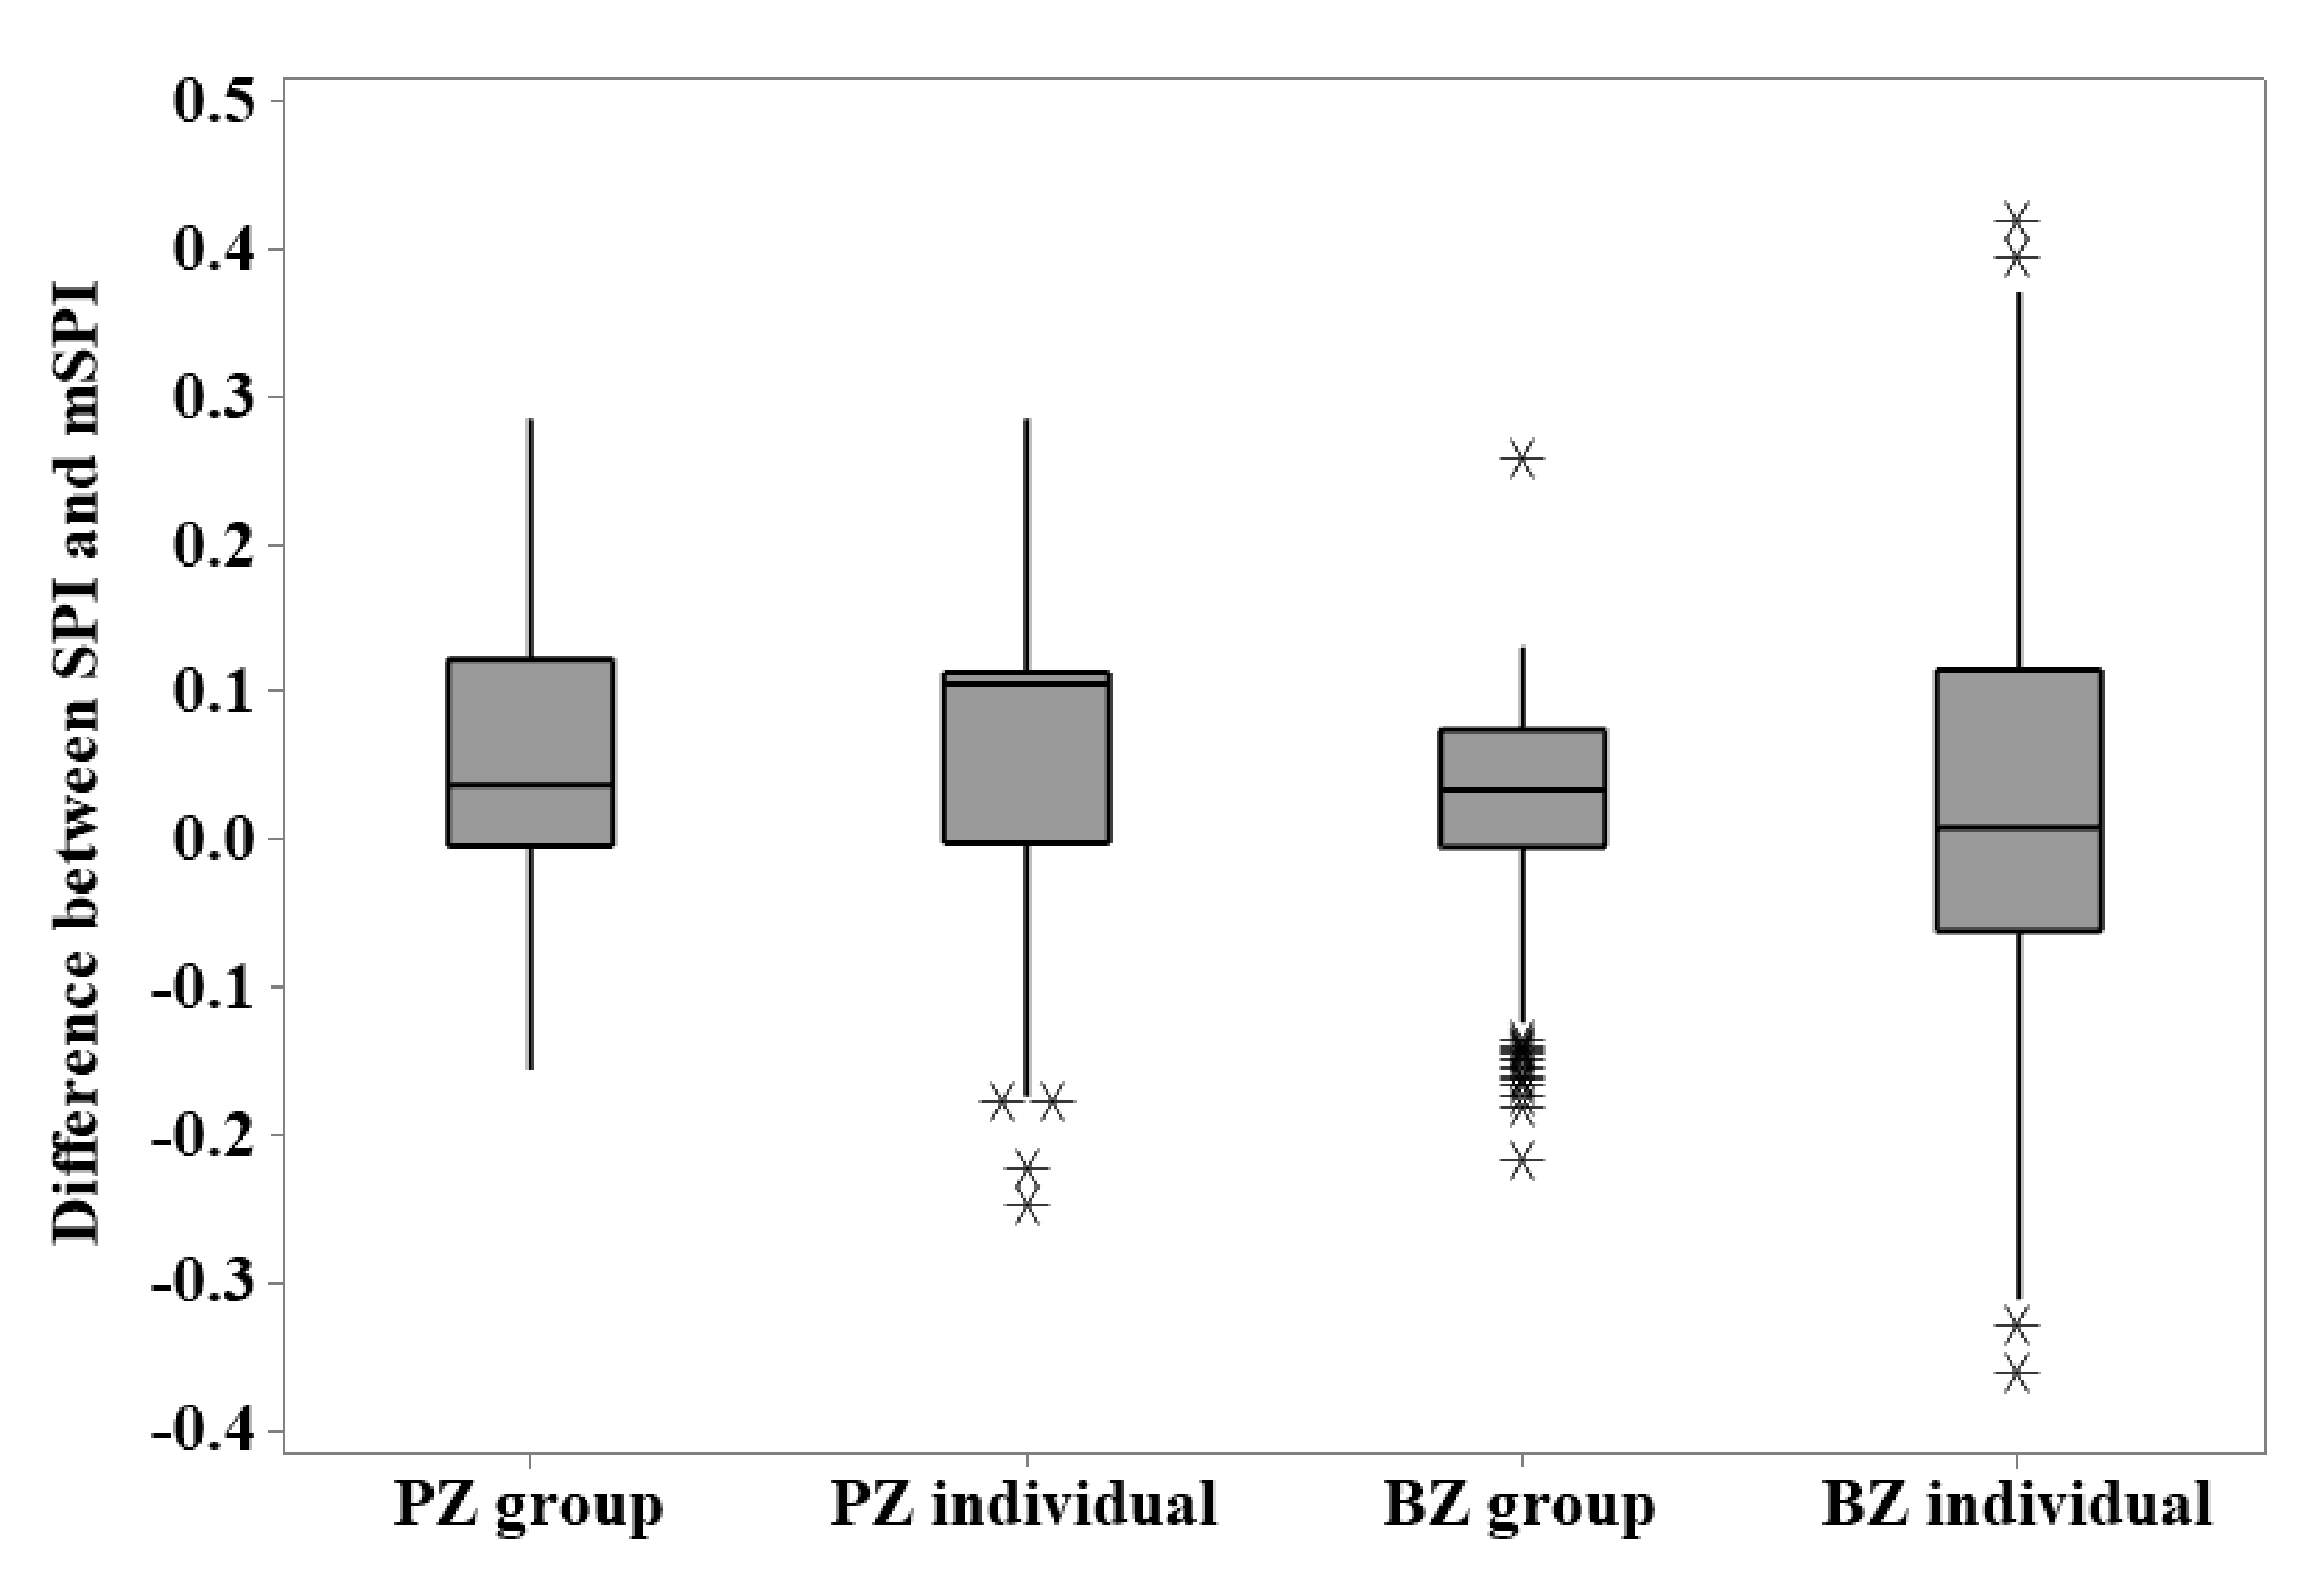
When considering variation in calculated SPI using the unmodified and modified versions,
Figure 3 shows that the number of zones included in data collection and the characteristics of the zoo’s specific animal population will influence the difference between the index calculated from the unmodified and modified formula at the individual or group level. However, for each zoo, there is more variation apparent when individual animal SPI calculations are used compared to those calculated from the group data.
Figure 4 identifies different patterns of enclosure usage by individual birds at each observation point compared to the group observation. This is particularly evident for the Left Pool at PZ and the Waterfall at BZ, where individual bird preferences for occupancy of these zones appears to be linked to specific times of the day. No equal occupancy of enclosure zones for each time period is noted for either group or individual data.
3.2. Evaluation of the EI
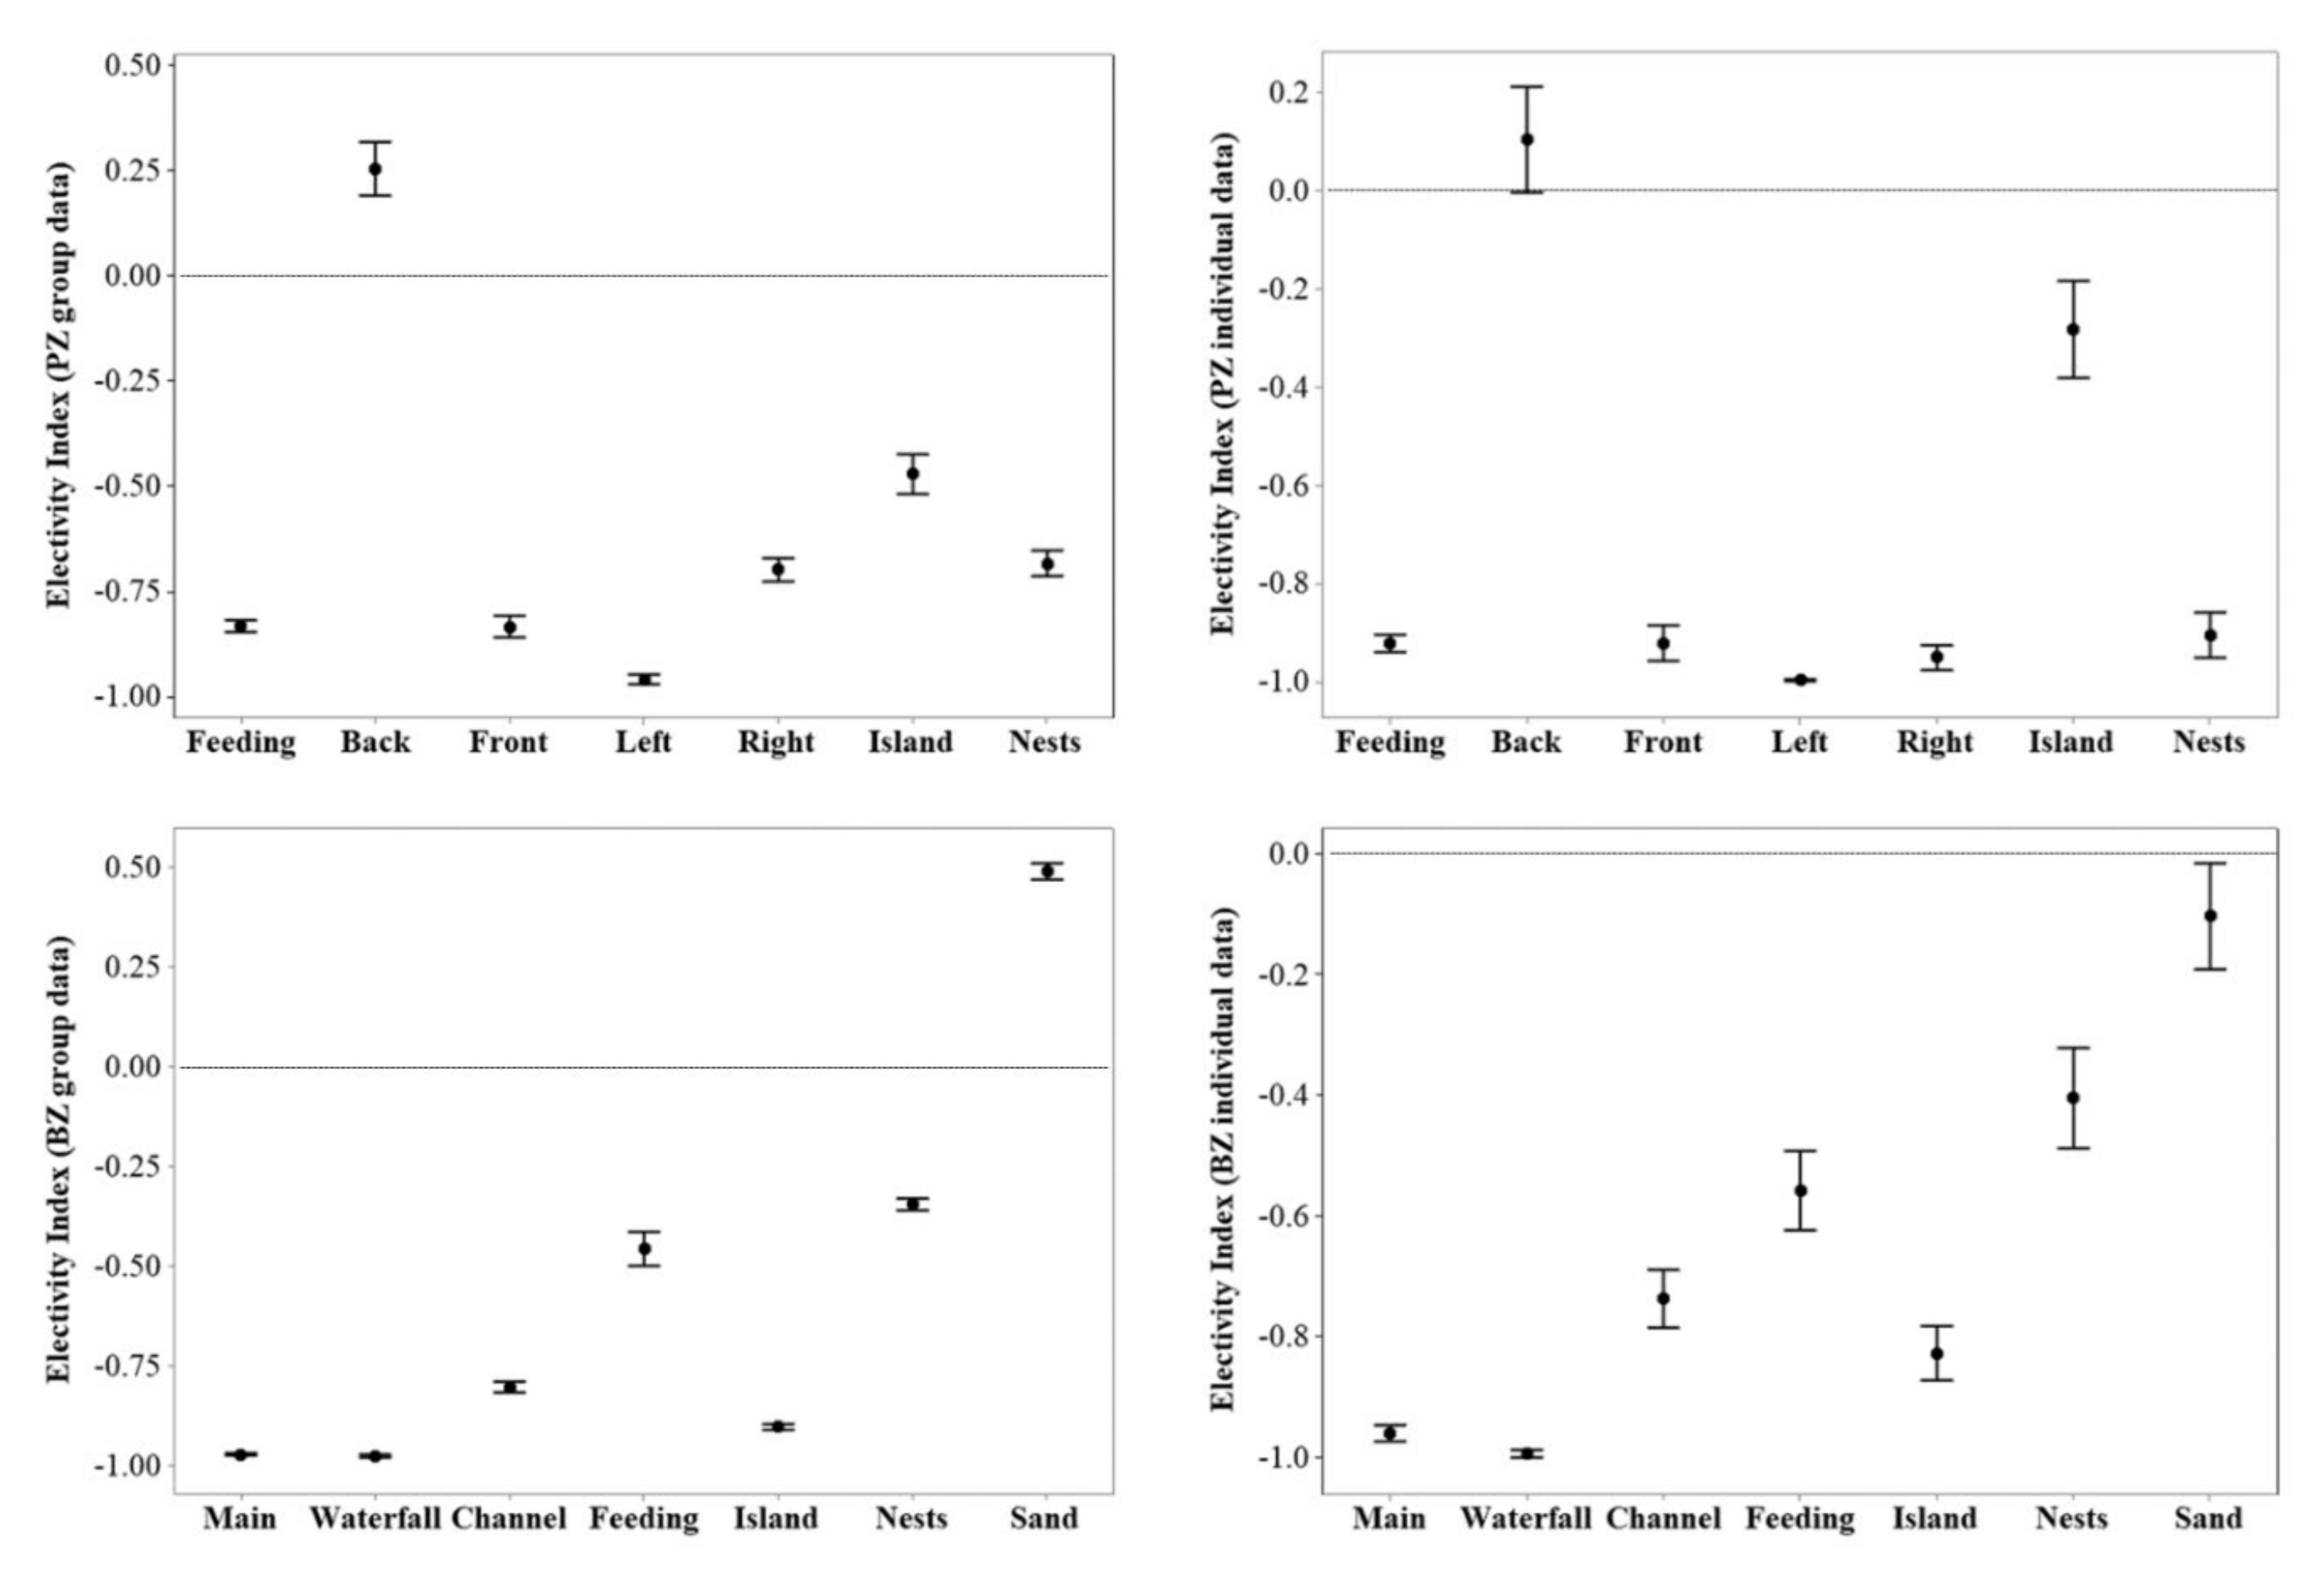
Flamingos at both zoos were under-utilising a range of the zones in their enclosures (
Figure 5), with only the back pool at PZ and the sanded beach area at BZ (but only for group data) showing an overuse. No equal usage of enclosure zones was demonstrated from these EIs, in a similar pattern to the picture provided from SPI data (
Figure 2).
A repeated measures ANOVA showed a significant difference (using Satterthwaite’s method) in EI between group and individual data at PZ for use of the feeding area (F1, 722.14 = 67.39; p < 0.001; Q = 0.008*), the back of the pool (F1, 722.21 = 7.63; p = 0.006; Q = 0.05), the front of the pool (F1, 722.24 = 16.69; p < 0.001; Q = 0.017), the left side of the pool (F1, 722.33 = 18.42; p < 0.001; Q = 0.03), the island (F1, 722.08 = 18.71; p < 0.001; Q = 0.033) and the nesting area (F1, 722.53 = 66.17; p < 0.001; Q = 0.042). The r2 value for this model was 22%. All VIF values were below 2. Multiple p values were compared to a corrected significance level (however this did not differ from the original of 0.05) and new Q values are provided. Significant Q values are marked with *.
For BZ, there was a significant difference in EI between group and individual data for the main pool (F1, 779.36 = 4.67; p = 0.031; Q = 0.043*), the waterfall (F1, 779.01 = 25.44; p < 0.001; Q = 0.007*), the channel between pool and house (F1, 778.34 = 10.04; p = 0.002; Q = 0.029*), the feeding area (F1, 778.76 = 8.35; p = 0.004; Q = 0.036*), the island (F1, 782 = 18.28; p < 0.001; Q = 0.014*) and the sanded beach (F1, 778.47 = 281.31; p < 0.001; Q = 0.02*). There was no significant difference in group or individual EI for the nesting area (F1, 778.68 = 3.22; p = 0.07; Q = 0.05). Multiple p values were compared to a corrected significance level of 0.043 and new Q values are provided. Significant Q values are marked with *.
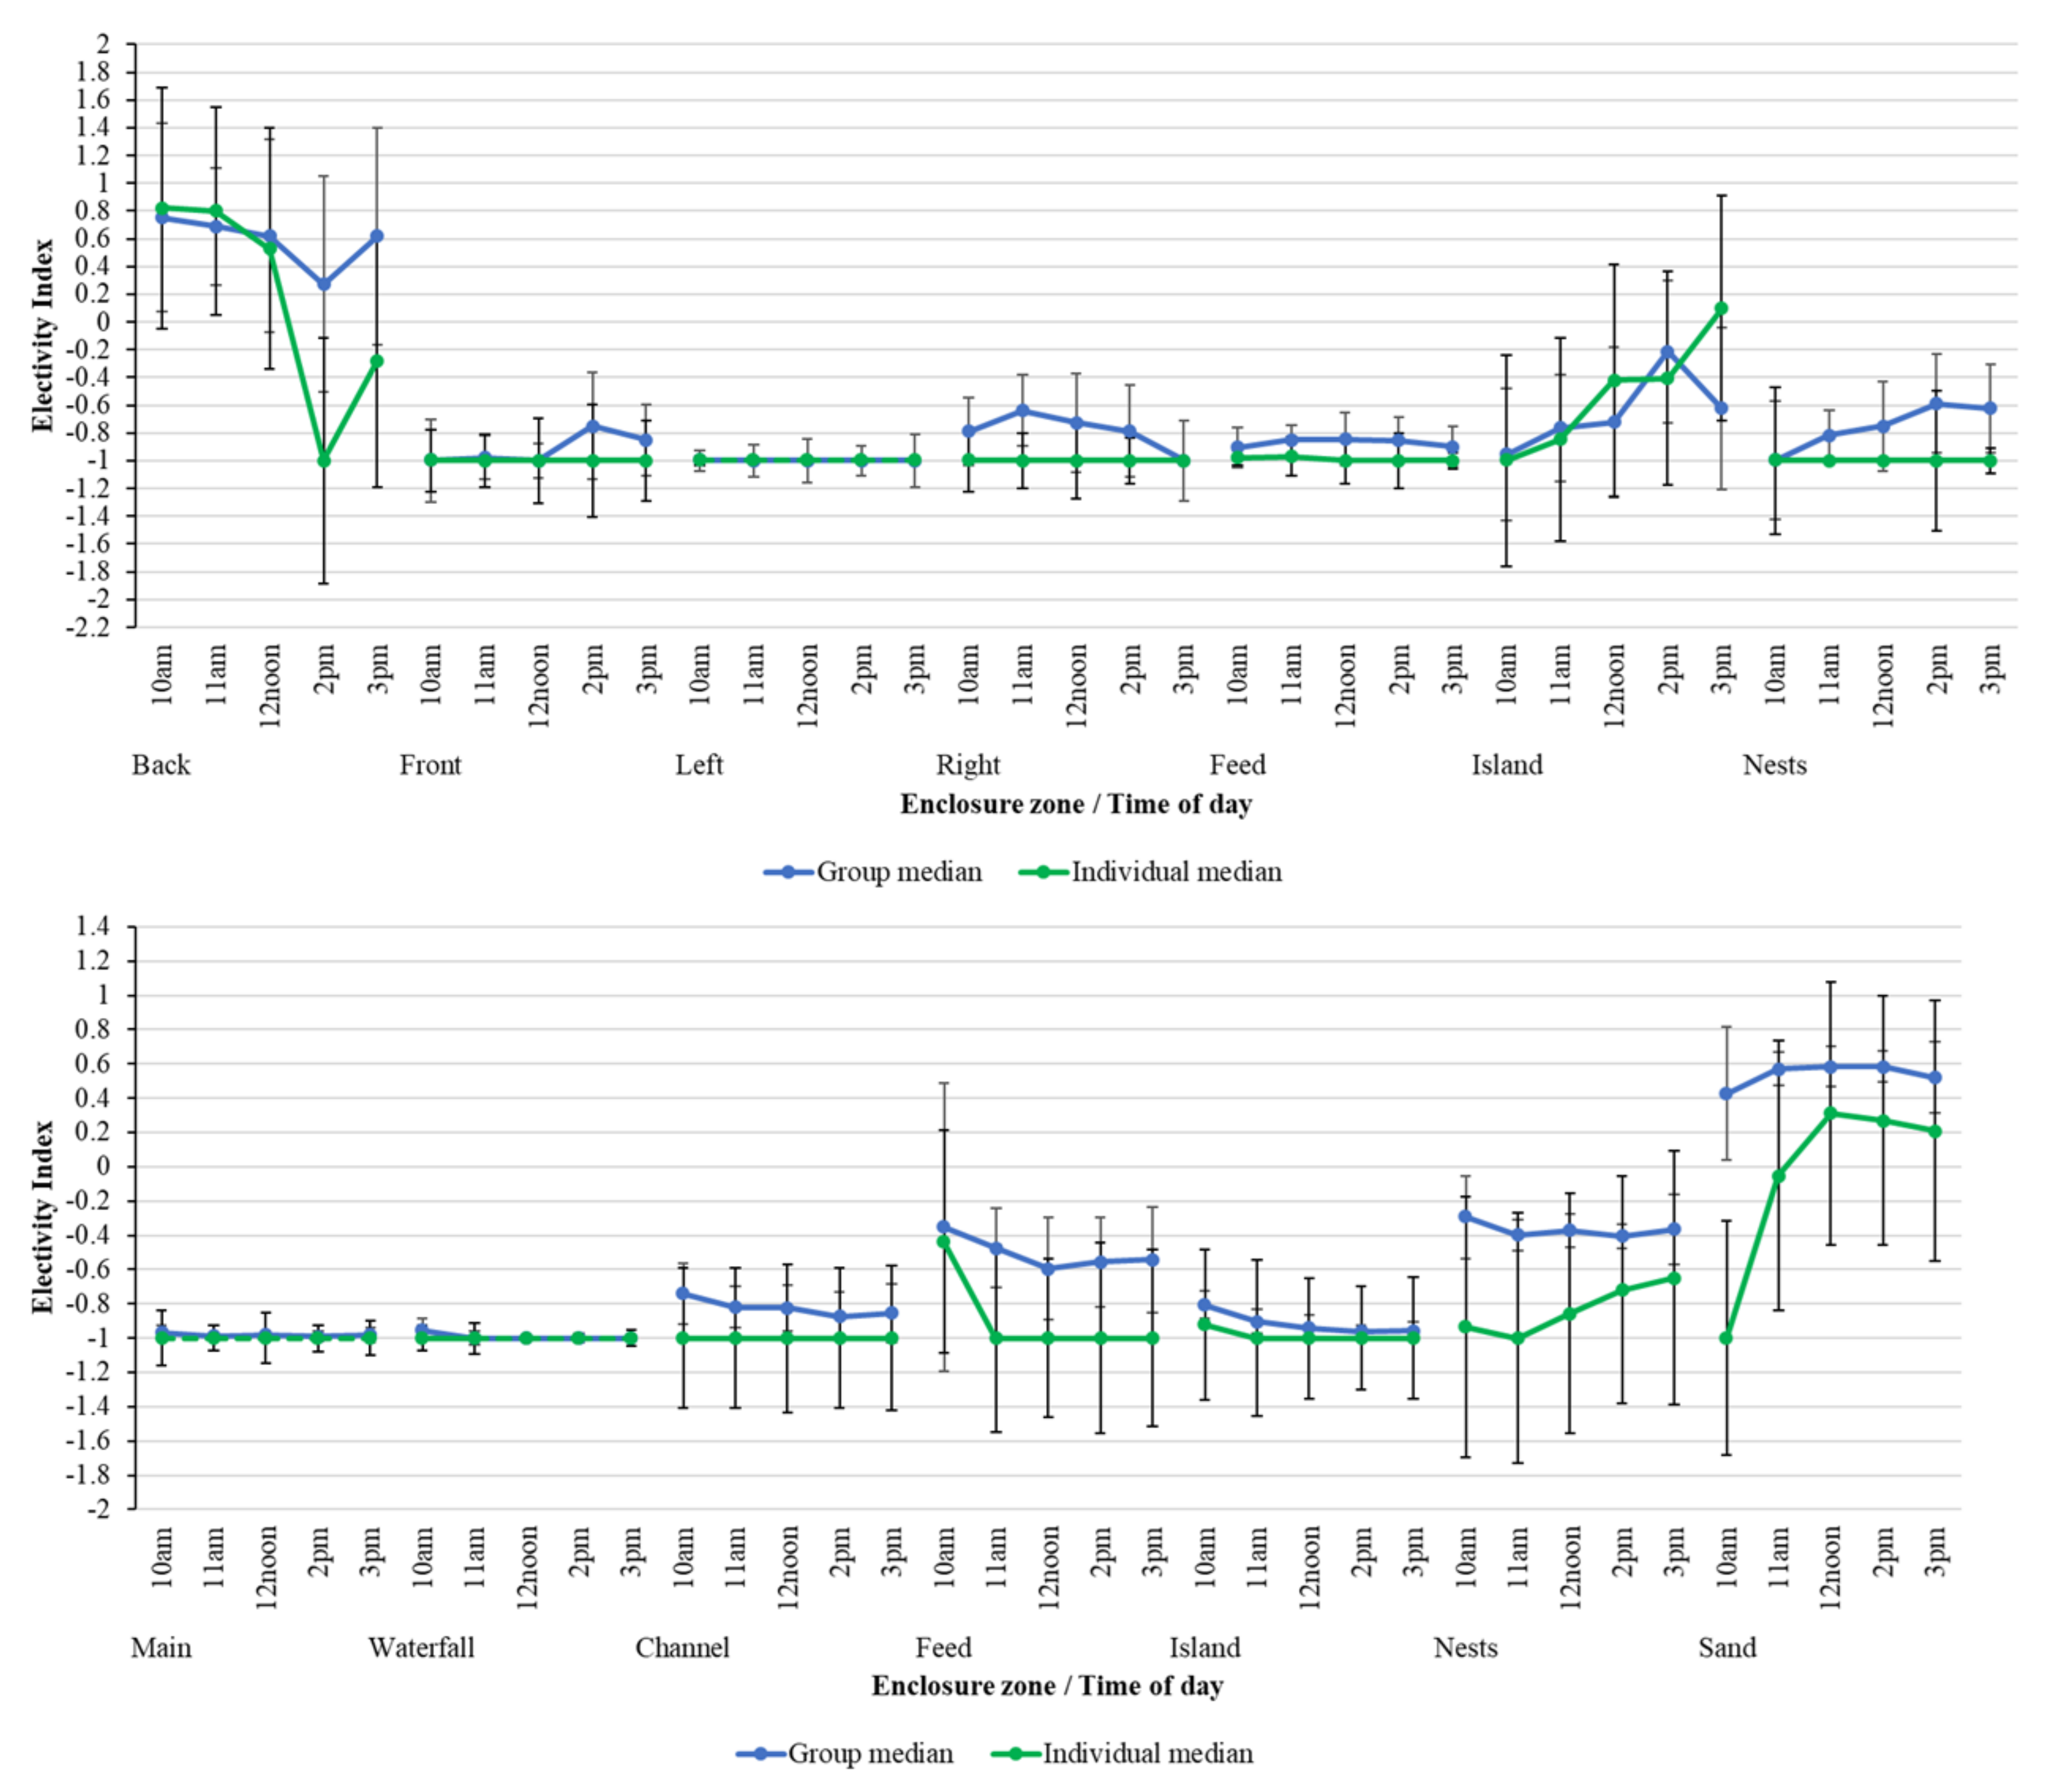
Although median group EI values mirror those from individual birds over time, there are some variations in the choice of zone usage between the individual bird and the group (
Figure 6). For example, back pool use in PZ is less favoured by specific individual flamingos in the early afternoon compared to that calculated for the group overall. Although pool usage for both individuals and the group overall is very consistent at BZ, differences over time in the usage of the nesting area and sanded beach area are more apparent. Individual birds are less likely to favour these areas compared to the flock overall.
3.3. Time Spent in Each Zone
Figure 7 shows that the mean time spent in specific enclosure zones by the group and individual birds can be different, but only for the nesting zone at PZ is the difference in occupancy significant (χ2 = 3.99; N = 17.22; df = 1;
p = 0.046).
Overall,
Table 1 indicates that the largest number of birds seen within a specific zone corresponds to the maximum observation time per individual sample of a bird in that same zone, although variation in preferred zone occupancy at the individual level is apparent for times when the majority of the group is in a different enclosure zone to that chosen by the individual bird.
Table 2 shows that these observations of flamingos within a preferred zone or outside of an avoided zone were significantly consistent for both the group and individual data, suggesting that specific enclosure zones hold particular importance for the birds within each zoo and this should be further investigated. When not including times of day, individual and group choice of preferred enclosure zone usage/zone avoidance is the same.
4. Discussion
This study utilised a range of commonly available space use indices to compare and contrast results on enclosure zone occupancy for individual flamingos and the flock these individuals belonged to. Although calculated metrics of enclosure usage differ (
Figure 2 and
Figure 6), average occupancy times within specific enclosure zones can be similar for group and individual data (
Table 1), but occupancy differs across time of day. For social species, it is evident that measuring the enclosure occupancy at the group level misses data on individual choices in enclosure usage, and therefore limits any evaluation of why this may be occurring and inferences on underlying welfare states. Time of day influences individual enclosure zone occupancy, with individual birds partitioning their time within each enclosure zone differently compared to rates of group-level occupancy. Individual differences in motivation for specific behaviour patterns (e.g., differing degrees of hunger, or the need to bathe and preen) may account for this. Choosing to socialise with particular conspecifics [
24,
38] or to regulate internal physiology [
39], or move away from visitor presence [
26,
40] or from the presence of other species in the enclosure [
41], will also cause individual specific patterns in enclosure use.
Individual SPI and mSPI are generally higher than those calculated for the group overall (
Figure 2), and therefore group-wide m/SPI suggests more even enclosure usage than when following individual birds. This is likely to be influenced by the behaviour of specific birds, who choose to move away from the main flock to perform specific behaviours at certain times of the day. For example, non-breeding birds may not join in with reproductive behaviours and spend time in a quieter area of their enclosure. To provide a complete picture of the enclosure usage of social species in the future, the number of animals per zone or the time spent within a zone should be evaluated alongside the calculated overall enclosure usage index to see where each member of the group is at each sample point. Time of day and season may be especially important to assess the EI. For example, the nesting flamingos at BZ may be the reason for wider variation between individual and group EI results for several zones in this enclosure (
Figure 5). Birds may be deliberately moving away from the nesting area when they have completed their incubation duties (handing over to a partner) or non-breeding birds are actively avoiding areas where aggressive, breeding adults are situated. Consideration of animal physiological states and how these fluctuate seasonally and temporally is key to understanding the meaning behind enclosure usage data, especially if modifications to an exhibit are planned to improve the diversity of space use after observational data have been collected.
How data are compared or analysed also needs to be considered, e.g., analysed across the entire study period or by specific observation points, as results can differ based on where the animals are and why. For example, overall mean enclosure usage data for each zoo reveals limited differences in time spent in each zone between individuals and the group (
Figure 7), but when analysing by sample point, key differences emerge in how the birds are occupying their space at the individual level compared to as a flock (
Figure 5).
The number of zones constructed within an enclosure can also influence the overall mSPI scores calculated. Previous research on flamingos has identified that too much complexity in enclosure zoning can impact the reliability of enclosure occupancy indices [
25], and evenness of enclosure occupancy will differ, based on mSPI calculation, when zones are combined and fewer zones are considered [
26]. Consideration of biological relevance when defining what constitutes a zone is clearly very important [
20], but is even more important when assessing individual enclosure usage for species with a strong tie to a social group. This will enable the researcher to distinguish between an animal choosing to occupy a zone based on its own preferences compared to when it may be motivated to be with the majority of its social group. We have shown, in this study, that individuals will deviate from the main social group when moving around an enclosure and when choosing to occupy specific enclosure zones. Therefore, to fully comprehend an individual animal’s welfare state, individual enclosure usage indices should be evaluated alongside group data. The number of zones has been shown to be important when managing behavioural interaction during times of social disruption for socially living species [
42]. Therefore, assessing where a group spends the majority of its time and also observing where specific individuals differ from this can help when managing social animals during times of new introductions.
Despite differences in the number and size of zones used for the SPI and mSPI calculation, overall patterns of zone occupancy are similar within each zoo (
Figure 2). However, when comparing different SPI formulae, more variation is apparent when using individual data (
Figure 3) compared to that seen for the group. Consideration of the biological importance of enclosure zoning is also essential when deciding on which method to use for calculating zone occupancy (SPI or mSPI). Exhibits with diverse and complex features, and where limited or valued resources may cause individuals to congregate in specific areas, are best evaluated using the mSPI [
20]. In these flamingo enclosures, we divided each exhibit into areas that are likely to be used by the birds for specific behaviours (e.g., the island for roosting and loafing, the pool for bathing and wading), and whilst there is some reflection in the pattern of enclosure usage across time between the SPI and mSPI (
Figure 2), calculated indices are significantly different when applying the SPI or mSPI to this enclosure. Therefore, consideration of the enclosure complexity and what is causing individuals to use specific areas needs to take place before data are collected and before any space use index is calculated. This is important for social species specifically, as resources that are limited or highly valued may cause overuse of specific areas and concentrate interactions that may affect how other areas of the enclosure can be used at certain times of the day.
Differences in the season that the birds were studied may also account for the variation seen between flocks, in addition to the characteristics of the m/SPI and EI calculations. As the BZ flock was in the breeding season, there may be more profound differences in enclosure zone occupancy between certain individuals—those invested in nesting and those not breeding—despite attempts to randomly select birds. For PZ, flamingos observed during the run-up to nesting, where the flock was performing group courtship display, may have a more uniform enclosure usage as the majority of birds were seen displaying in the same area of their enclosure. This may explain the similarity between the group and individual PZ data (difference between SPI and mSPI) in
Figure 3, compared to the wider degree of variation noted for BZ. To further understand the effects of seasonality on flamingo enclosure usage, flocks could be sampled (using all of the methods included in this paper) at different times of the year. It may be that some forms of enclosure usage calculation are better suited to estimating zone occupancy in the breeding season and others are better for the non-breeding season.
The number of flocks sampled (N = 2) for this research, including no repeats for either species, should also be considered in light of the wider application of findings and how representative they may be of flamingos more broadly. Species and enclosure effects may be causing the changes in enclosure usage, but also the randomness associated with small sample sizes. Multi-zoo study across further flocks of these two flamingo species would enable analysis of how these birds were using their space in comparison to other captive groups (especially if occupancy of standardised “habitat areas”, i.e., identifying the same accessible resources within flamingo exhibits, were evaluated across different enclosures).
More detailed analysis of how favoured zone occupancy was affected by time of day would be helpful. It may be that specific aspects of husbandry or individual preferences for different parts of the enclosure are aligned to behavioural circadian rhythms. These differences may be more pronounced in individuals but diluted when the group is observed collectively. Using a larger individual dataset to understand enclosure usage may help better control the large amounts of variation noted in some analysis (e.g., in the error bars on
Figure 6). Further research should also investigate how individual and group results change over extended periods of time to confirm that enclosure usage is dependent upon season or time of year (for example), and to fully determine if methods such as m/SPI and EI can fully illustrate these influences. For instance, a relevant project extension would be to determine whether BZ results would show more uniformity outside of breeding season and more similarity to those at PZ. These data may help improve husbandry routines to ensure seasonally biologically important zones are appropriate and appealing for the species based on time of year. As determining the effect of outside influences on flamingo enclosure usage can be complex [
26], a larger dataset would help to unpick other external factors that have caused differences in the enclosure usage of the group compared to the individual bird.
Finally, consideration of visitor presence and potential associated impacts, in addition to the presence of caregivers [
26,
43]—both factors that are shown to influence zoo bird behaviour and space use—should be measured in space occupancy studies as some individual animals may (at specific times of their development or temporal cycle) be more impacted by anthropogenic activities and behaviour than at others.
5. Conclusions
This study has helped identify how these methods for evaluating enclosure zone occupancy can be applied and adapted to ensure that research on socially living species is as informative as possible. When measuring enclosure usage in the zoo or aquarium, the specific population of animals, their prevailing environmental and husbandry conditions, and physiological, temporal and seasonal effects on activity, are all likely to influence how space within their enclosure is utilised and occupied. It is clear from this research that group-level enclosure usage calculation does not provide an accurate picture of what the individual is choosing to do. Therefore, for group-living animals, assessment of space usage and zone occupancy needs to include the elements of individual difference and individual choice.
We recommend further study and investigation into enclosure usage indices, especially SPI, to determine ways of adapting such methods to successfully capture the group’s influence on the individual, in addition to the individual’s role in group-level decisions. For individual animals, review of time spent in the enclosure’s zones (as a proportion of a given sampling period) may be the most valuable data points when understanding individual differences in space use, and therefore individual choice in space usage that may differ from where the main part of the focal animal’s group is located. Although m/SPI or EI may be useful overall calculations to determine where an animal is, actual occupancy time may be more helpful for evaluating what is causing the individual to use that space or resources more (or less) than the other areas that it has access to (and how or why this differs from what the group overall is doing).


