
A System for Monitoring Acoustics to Supplement an Animal Welfare Plan for Bottlenose Dolphins

 ,
,
Abstract
1. Introduction
2. System Description: Methods and Results
- Monitors for the presence of ‘normal, average’ communicative behavior for a thriving group of dolphins;
- Allows for the identification of seasonal, diurnal, and hormonal trends in vocal behavior following integration with veterinary data;
- Gives insight into the dolphins’ habituation to novel situations, including novel environments during Navy dolphin deployments;
- Alerts animal care professionals to times of abnormally high and/or low rates of vocalizations;
- Allows caretakers to localize dolphins when doing open water training exercises outside of enclosures;
- Provides insight to the valence and arousal levels of dolphins during in-session training settings and off-session social interactions;
- Allows for identification of noise conditions that with potential for masking dolphin vocalizations and/or acoustic behavioral response to anthropogenic noise in San Diego Bay.
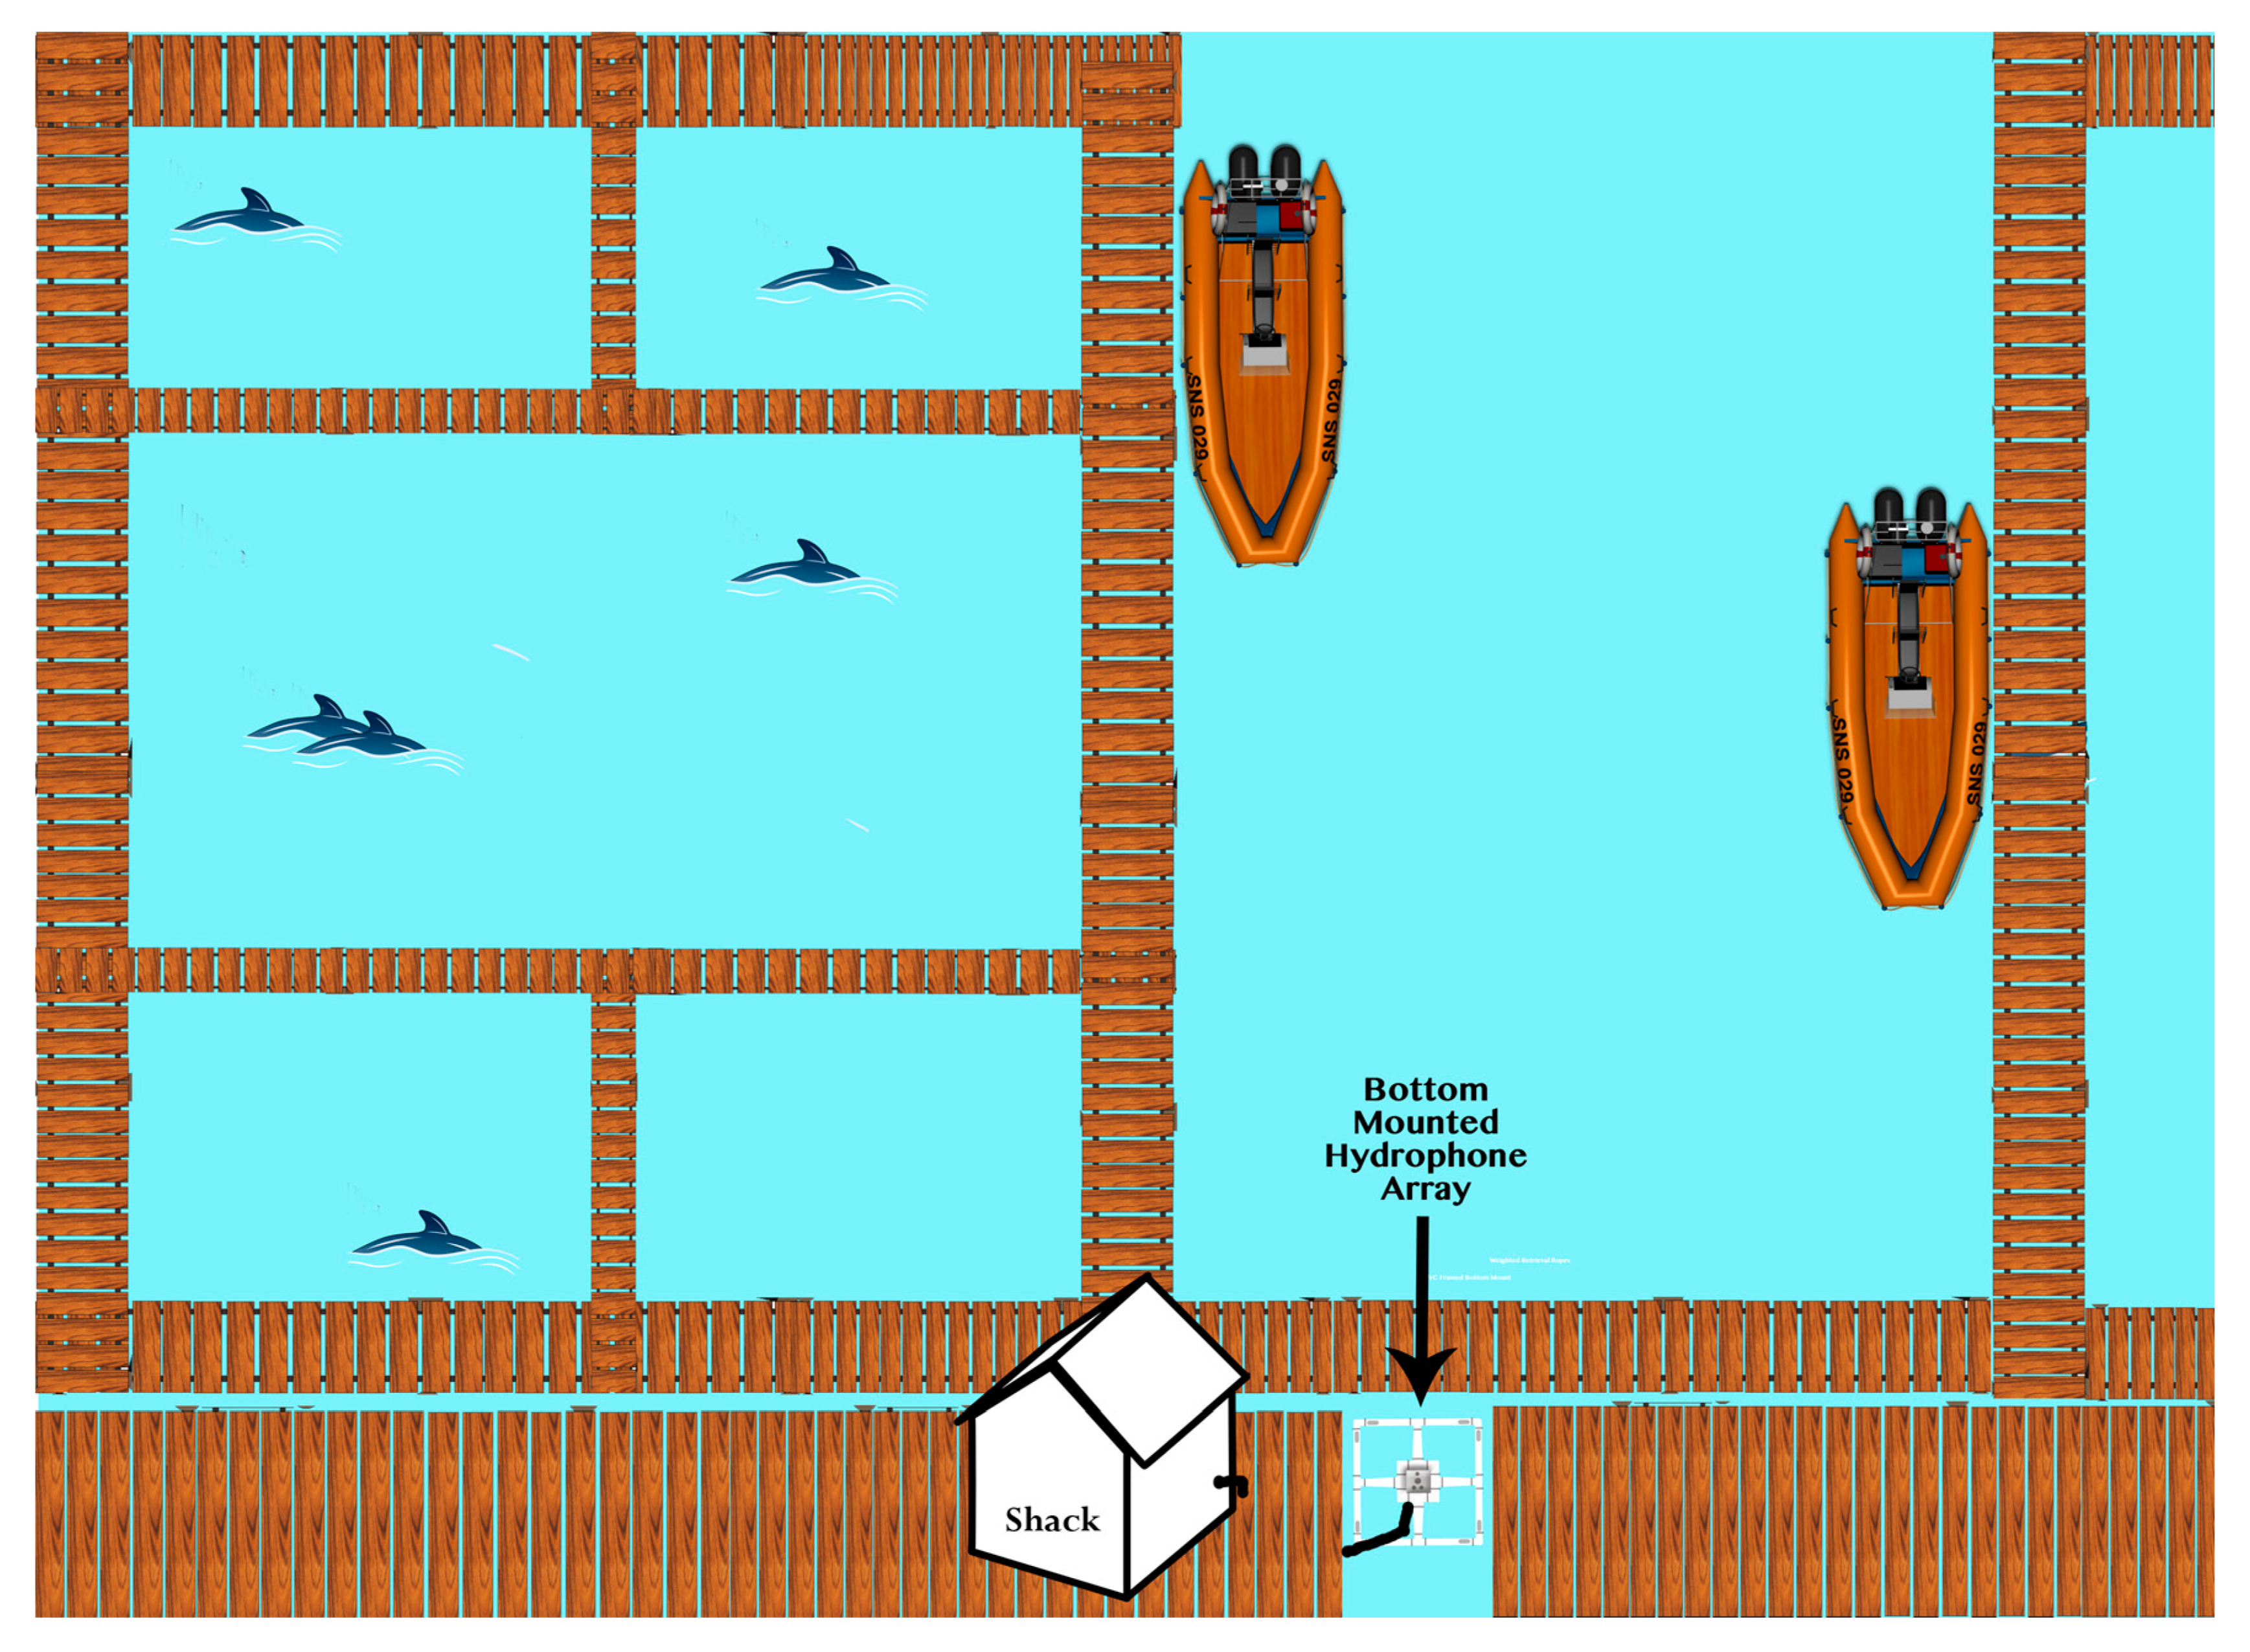
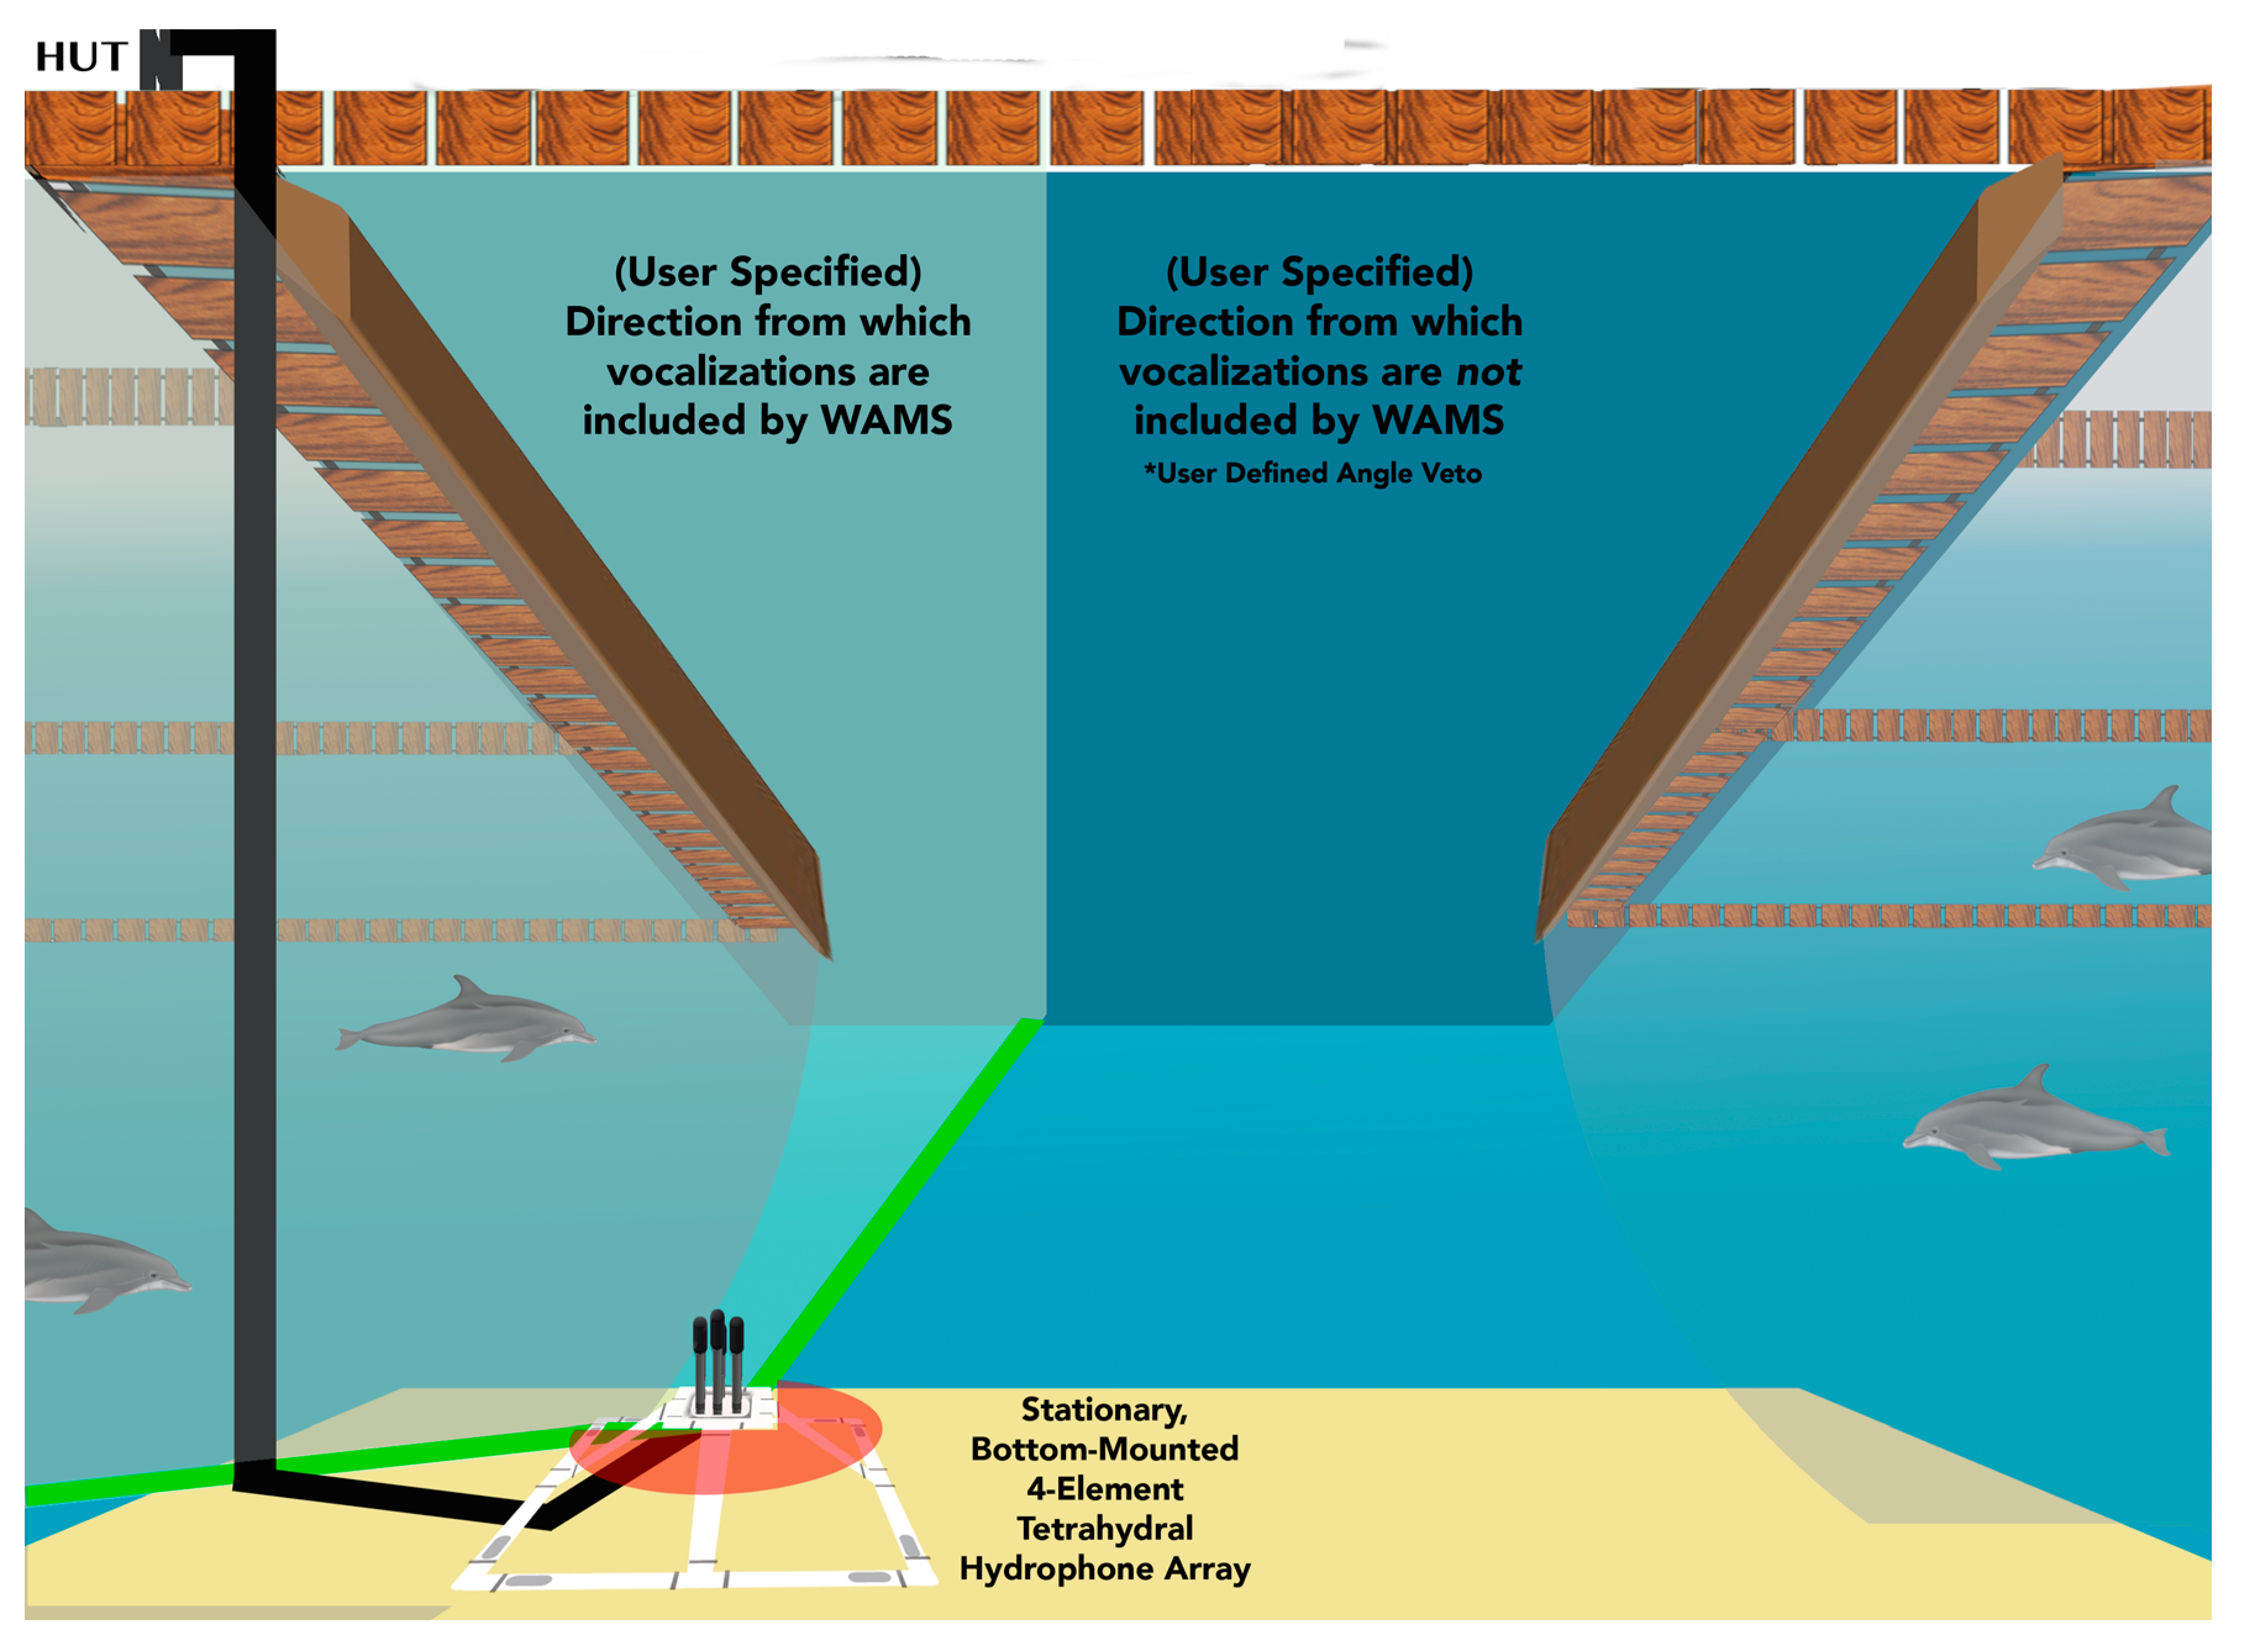
2.1. Hardware
2.2. Study Group
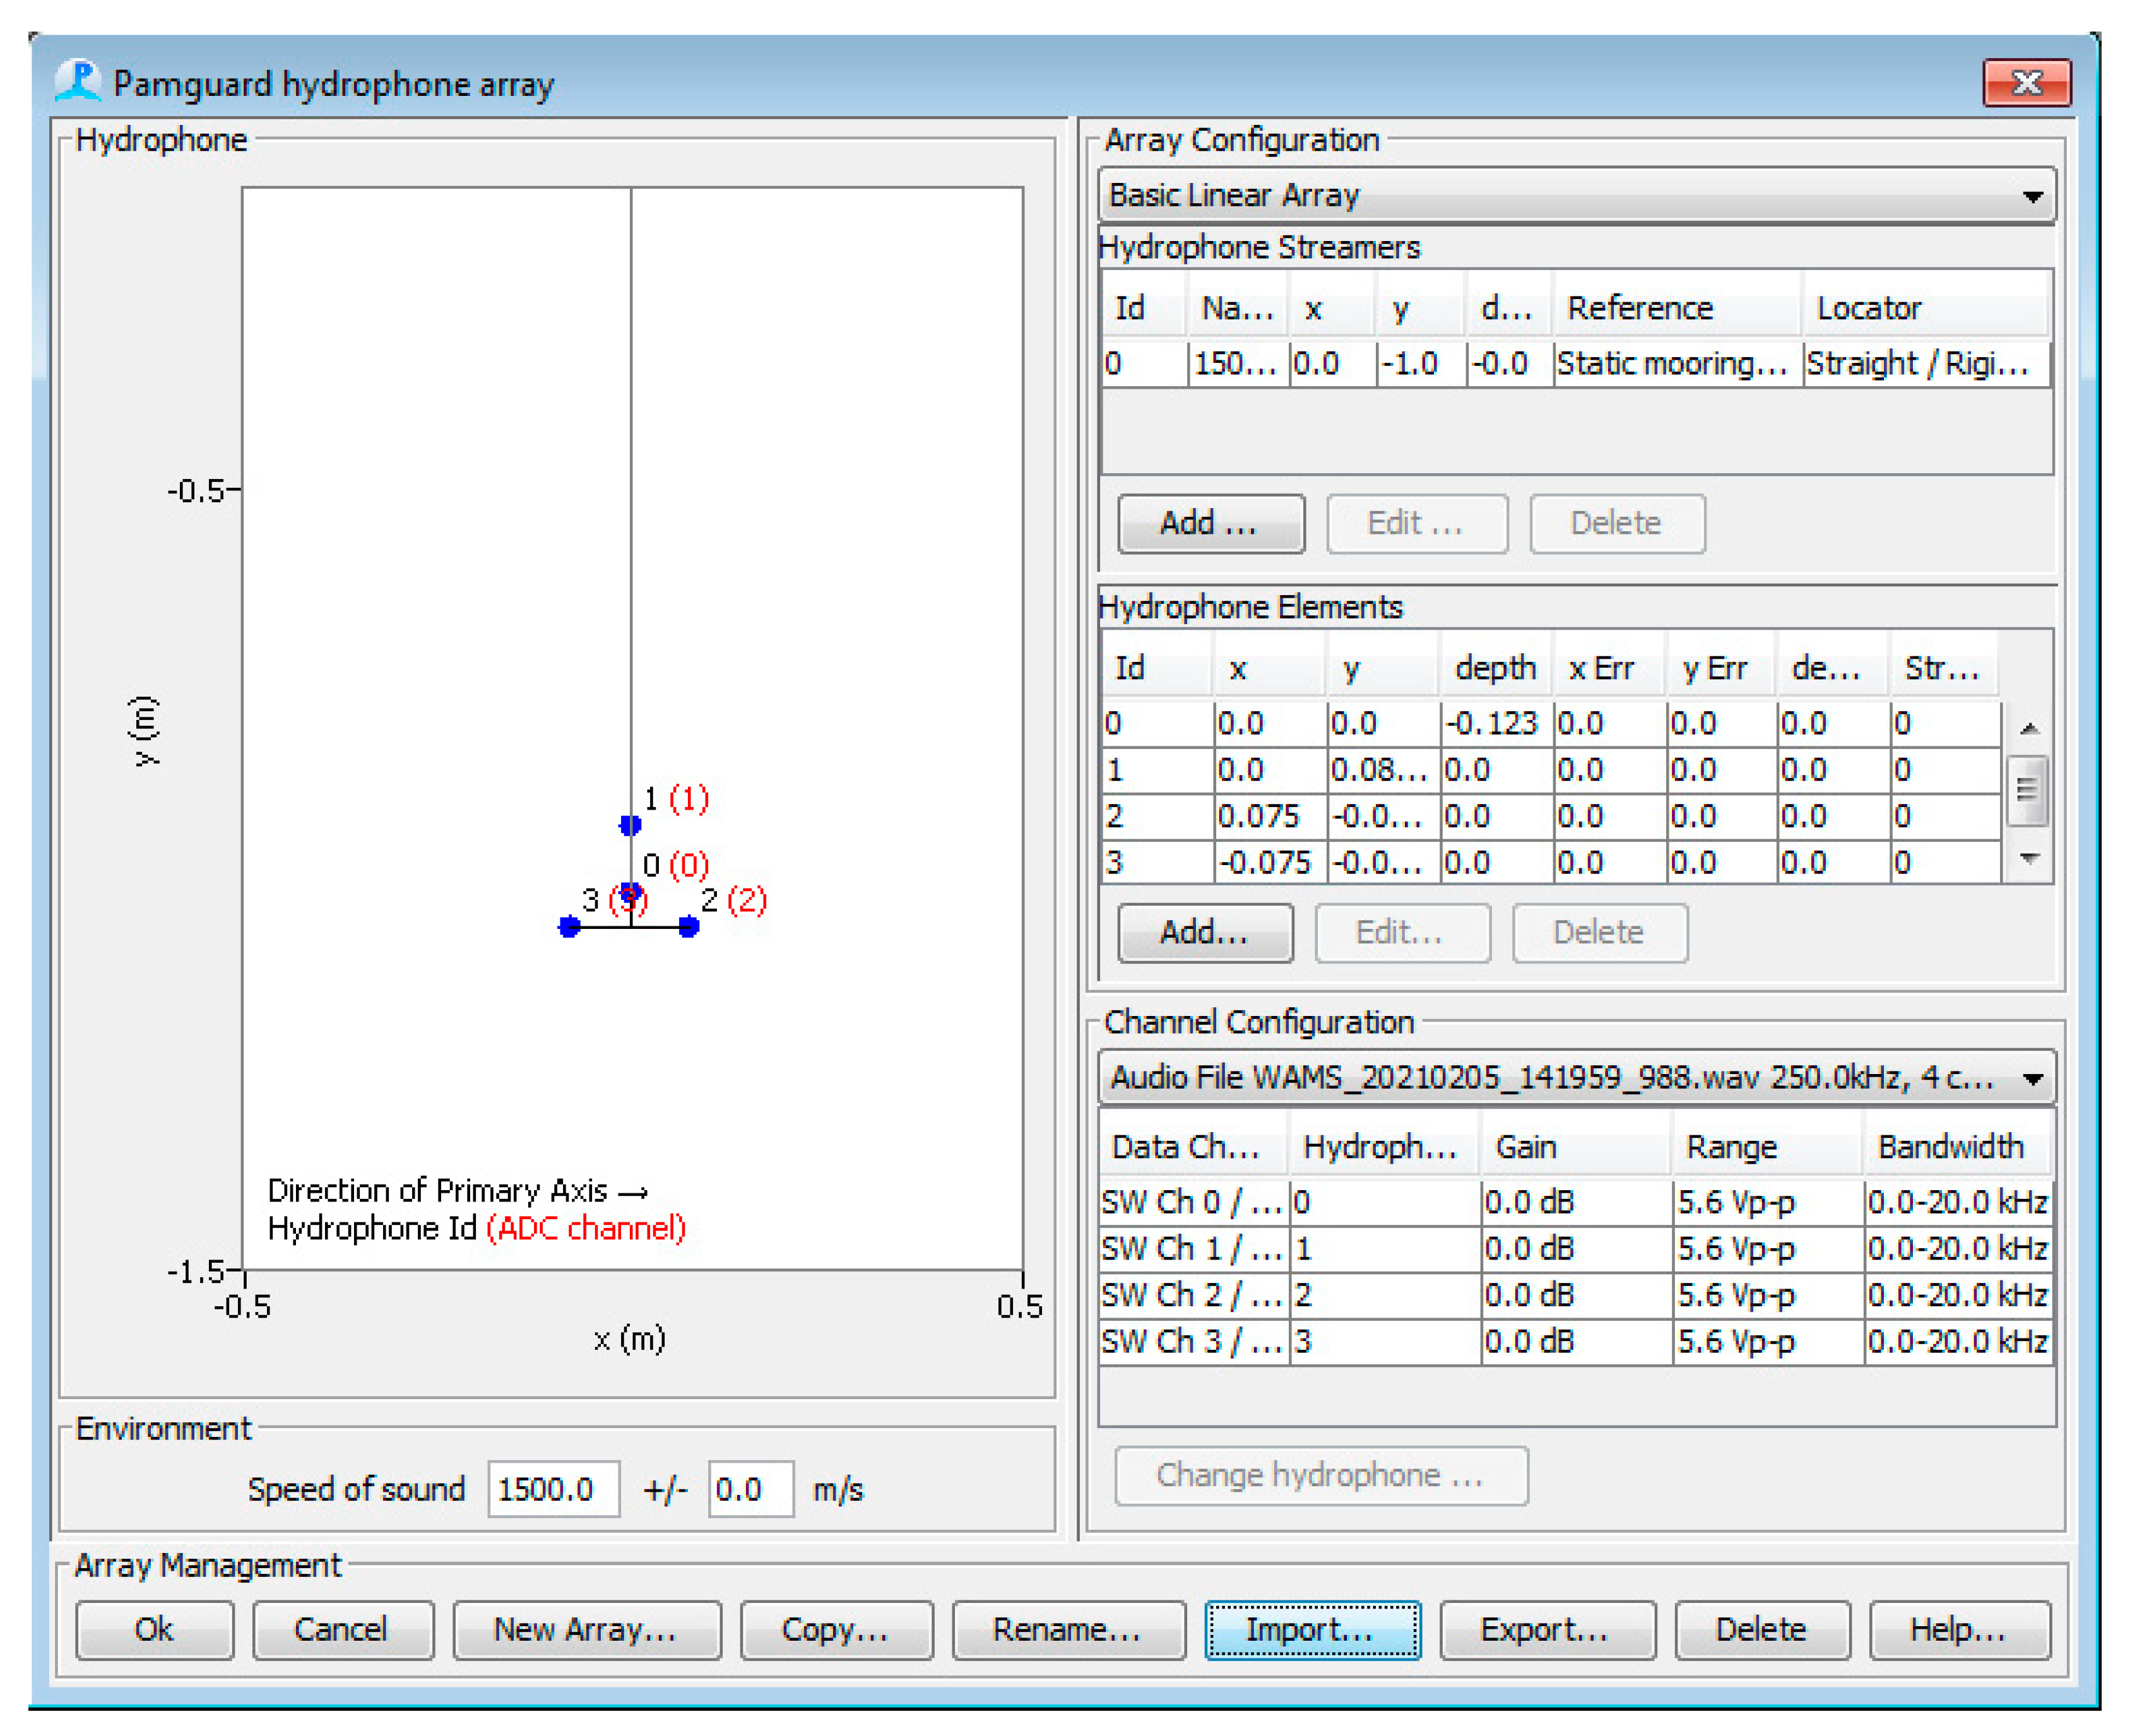
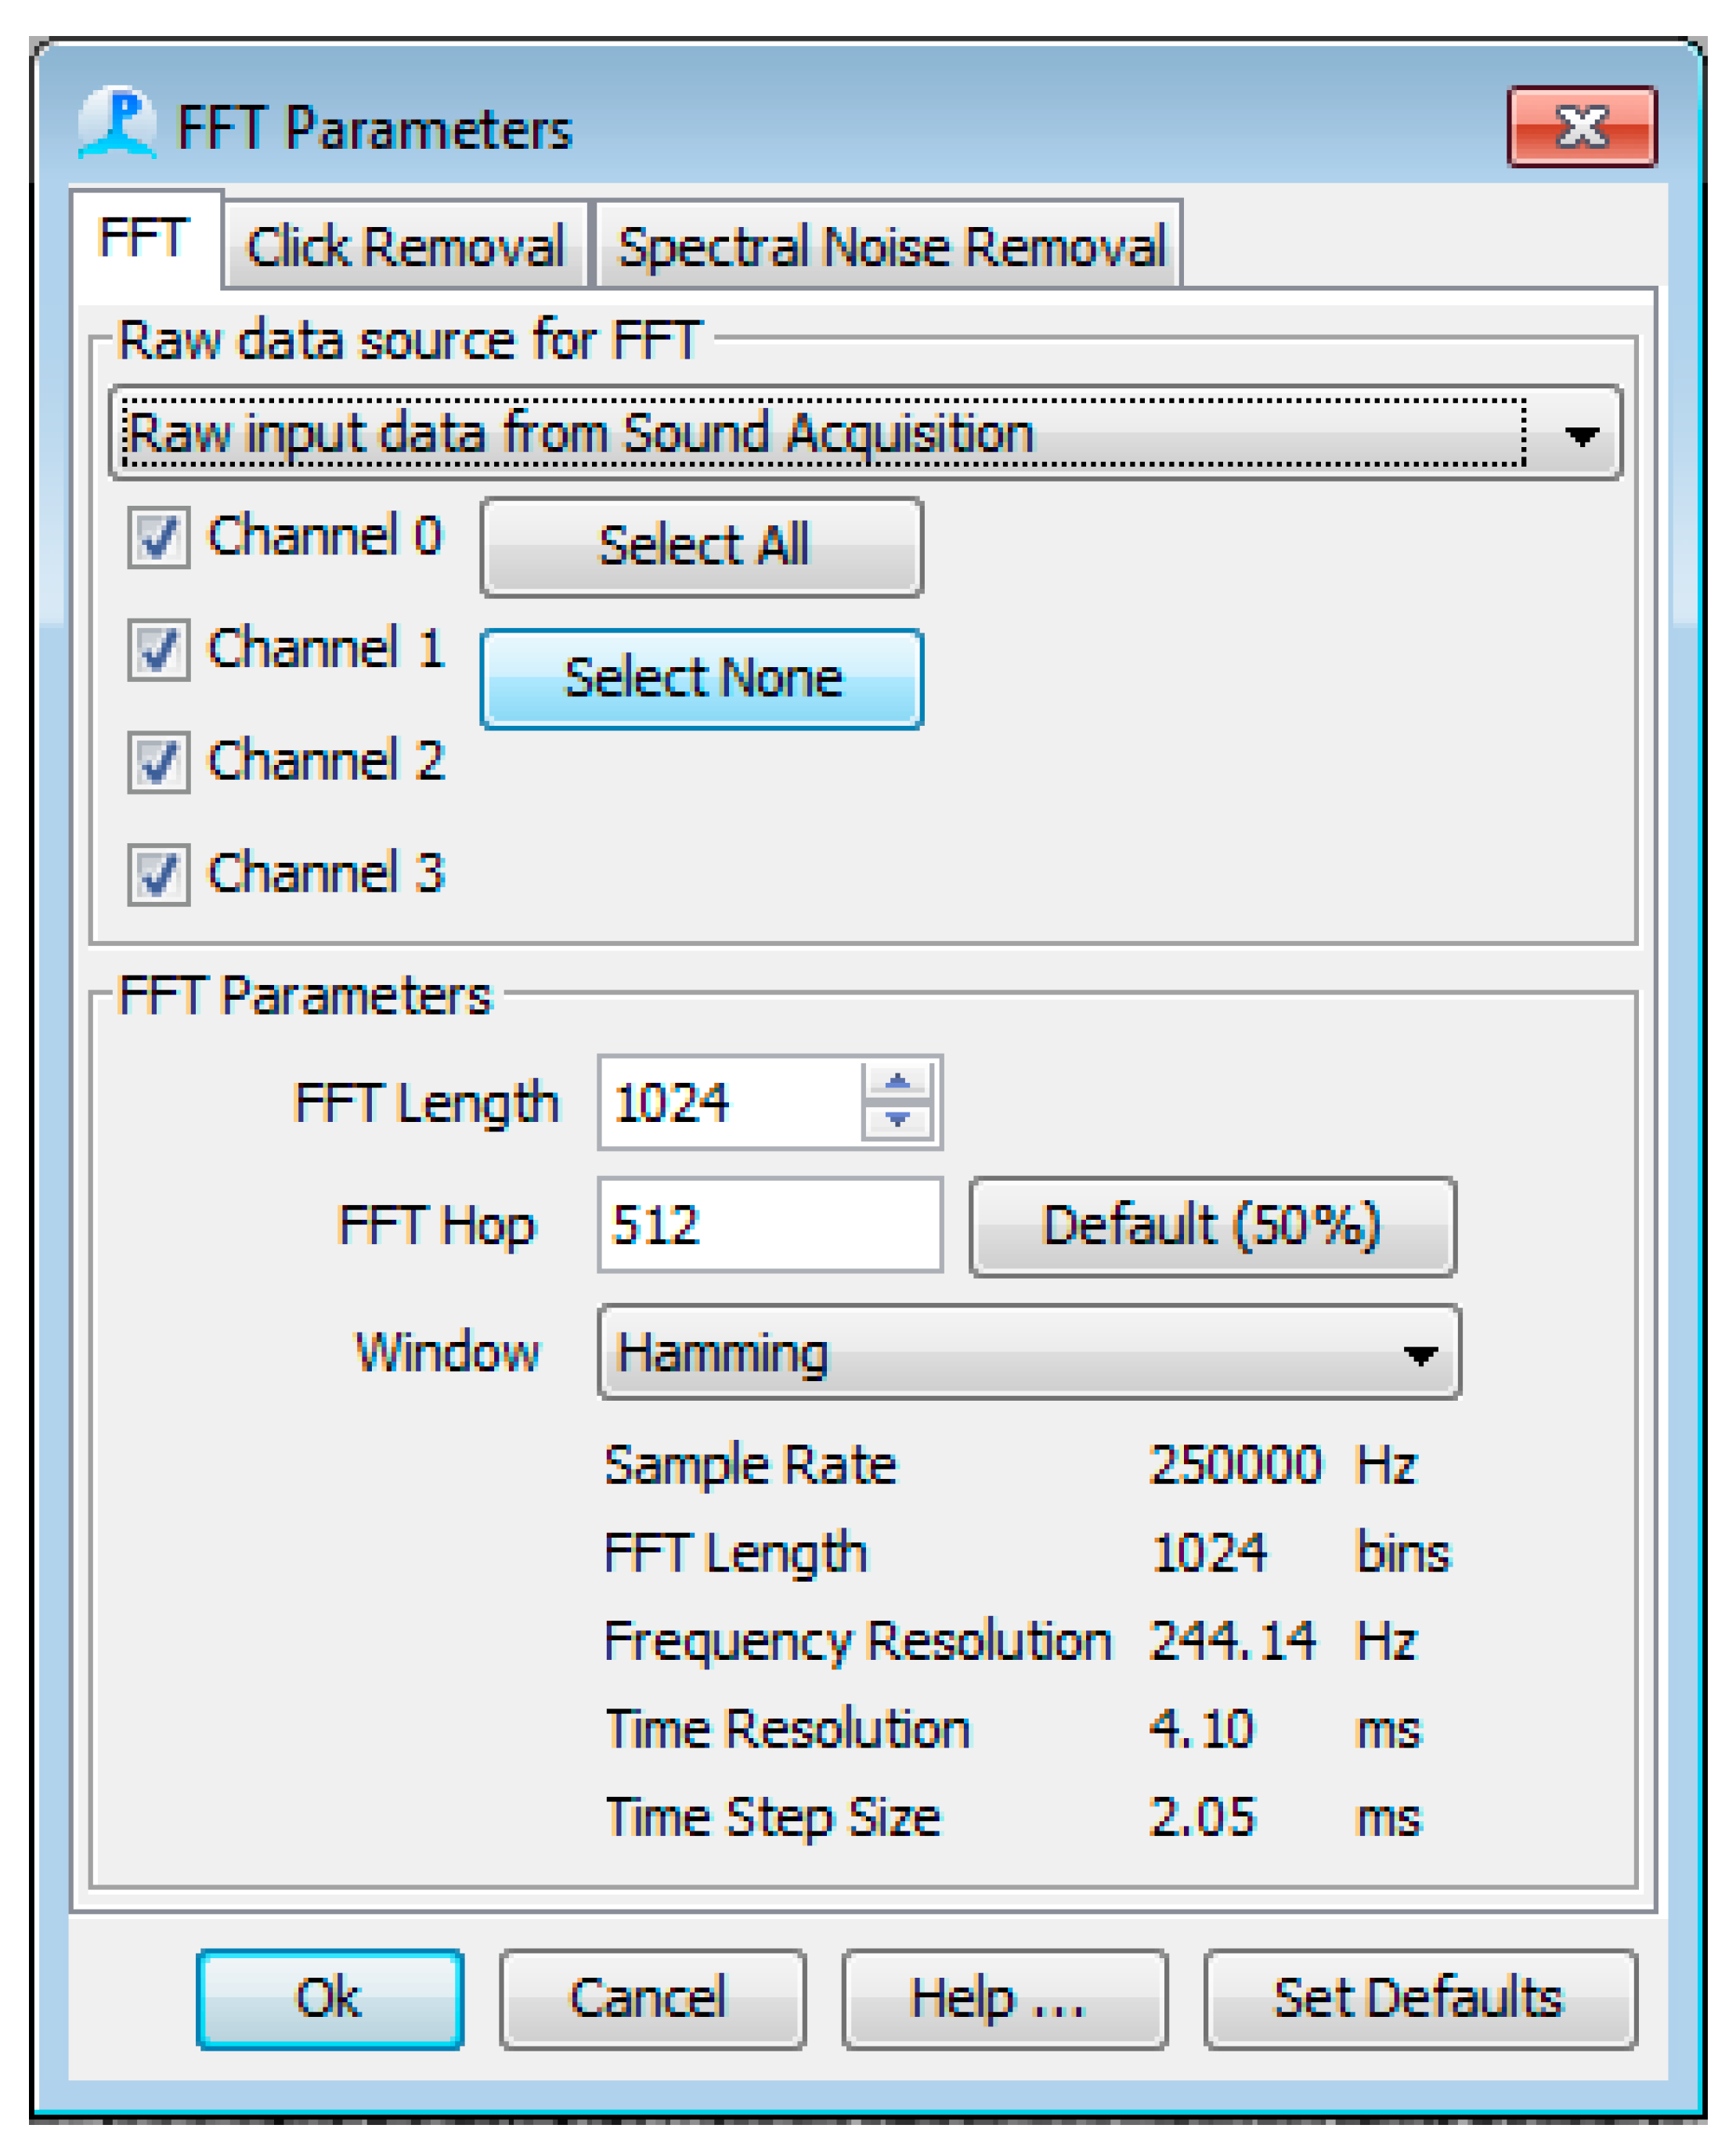
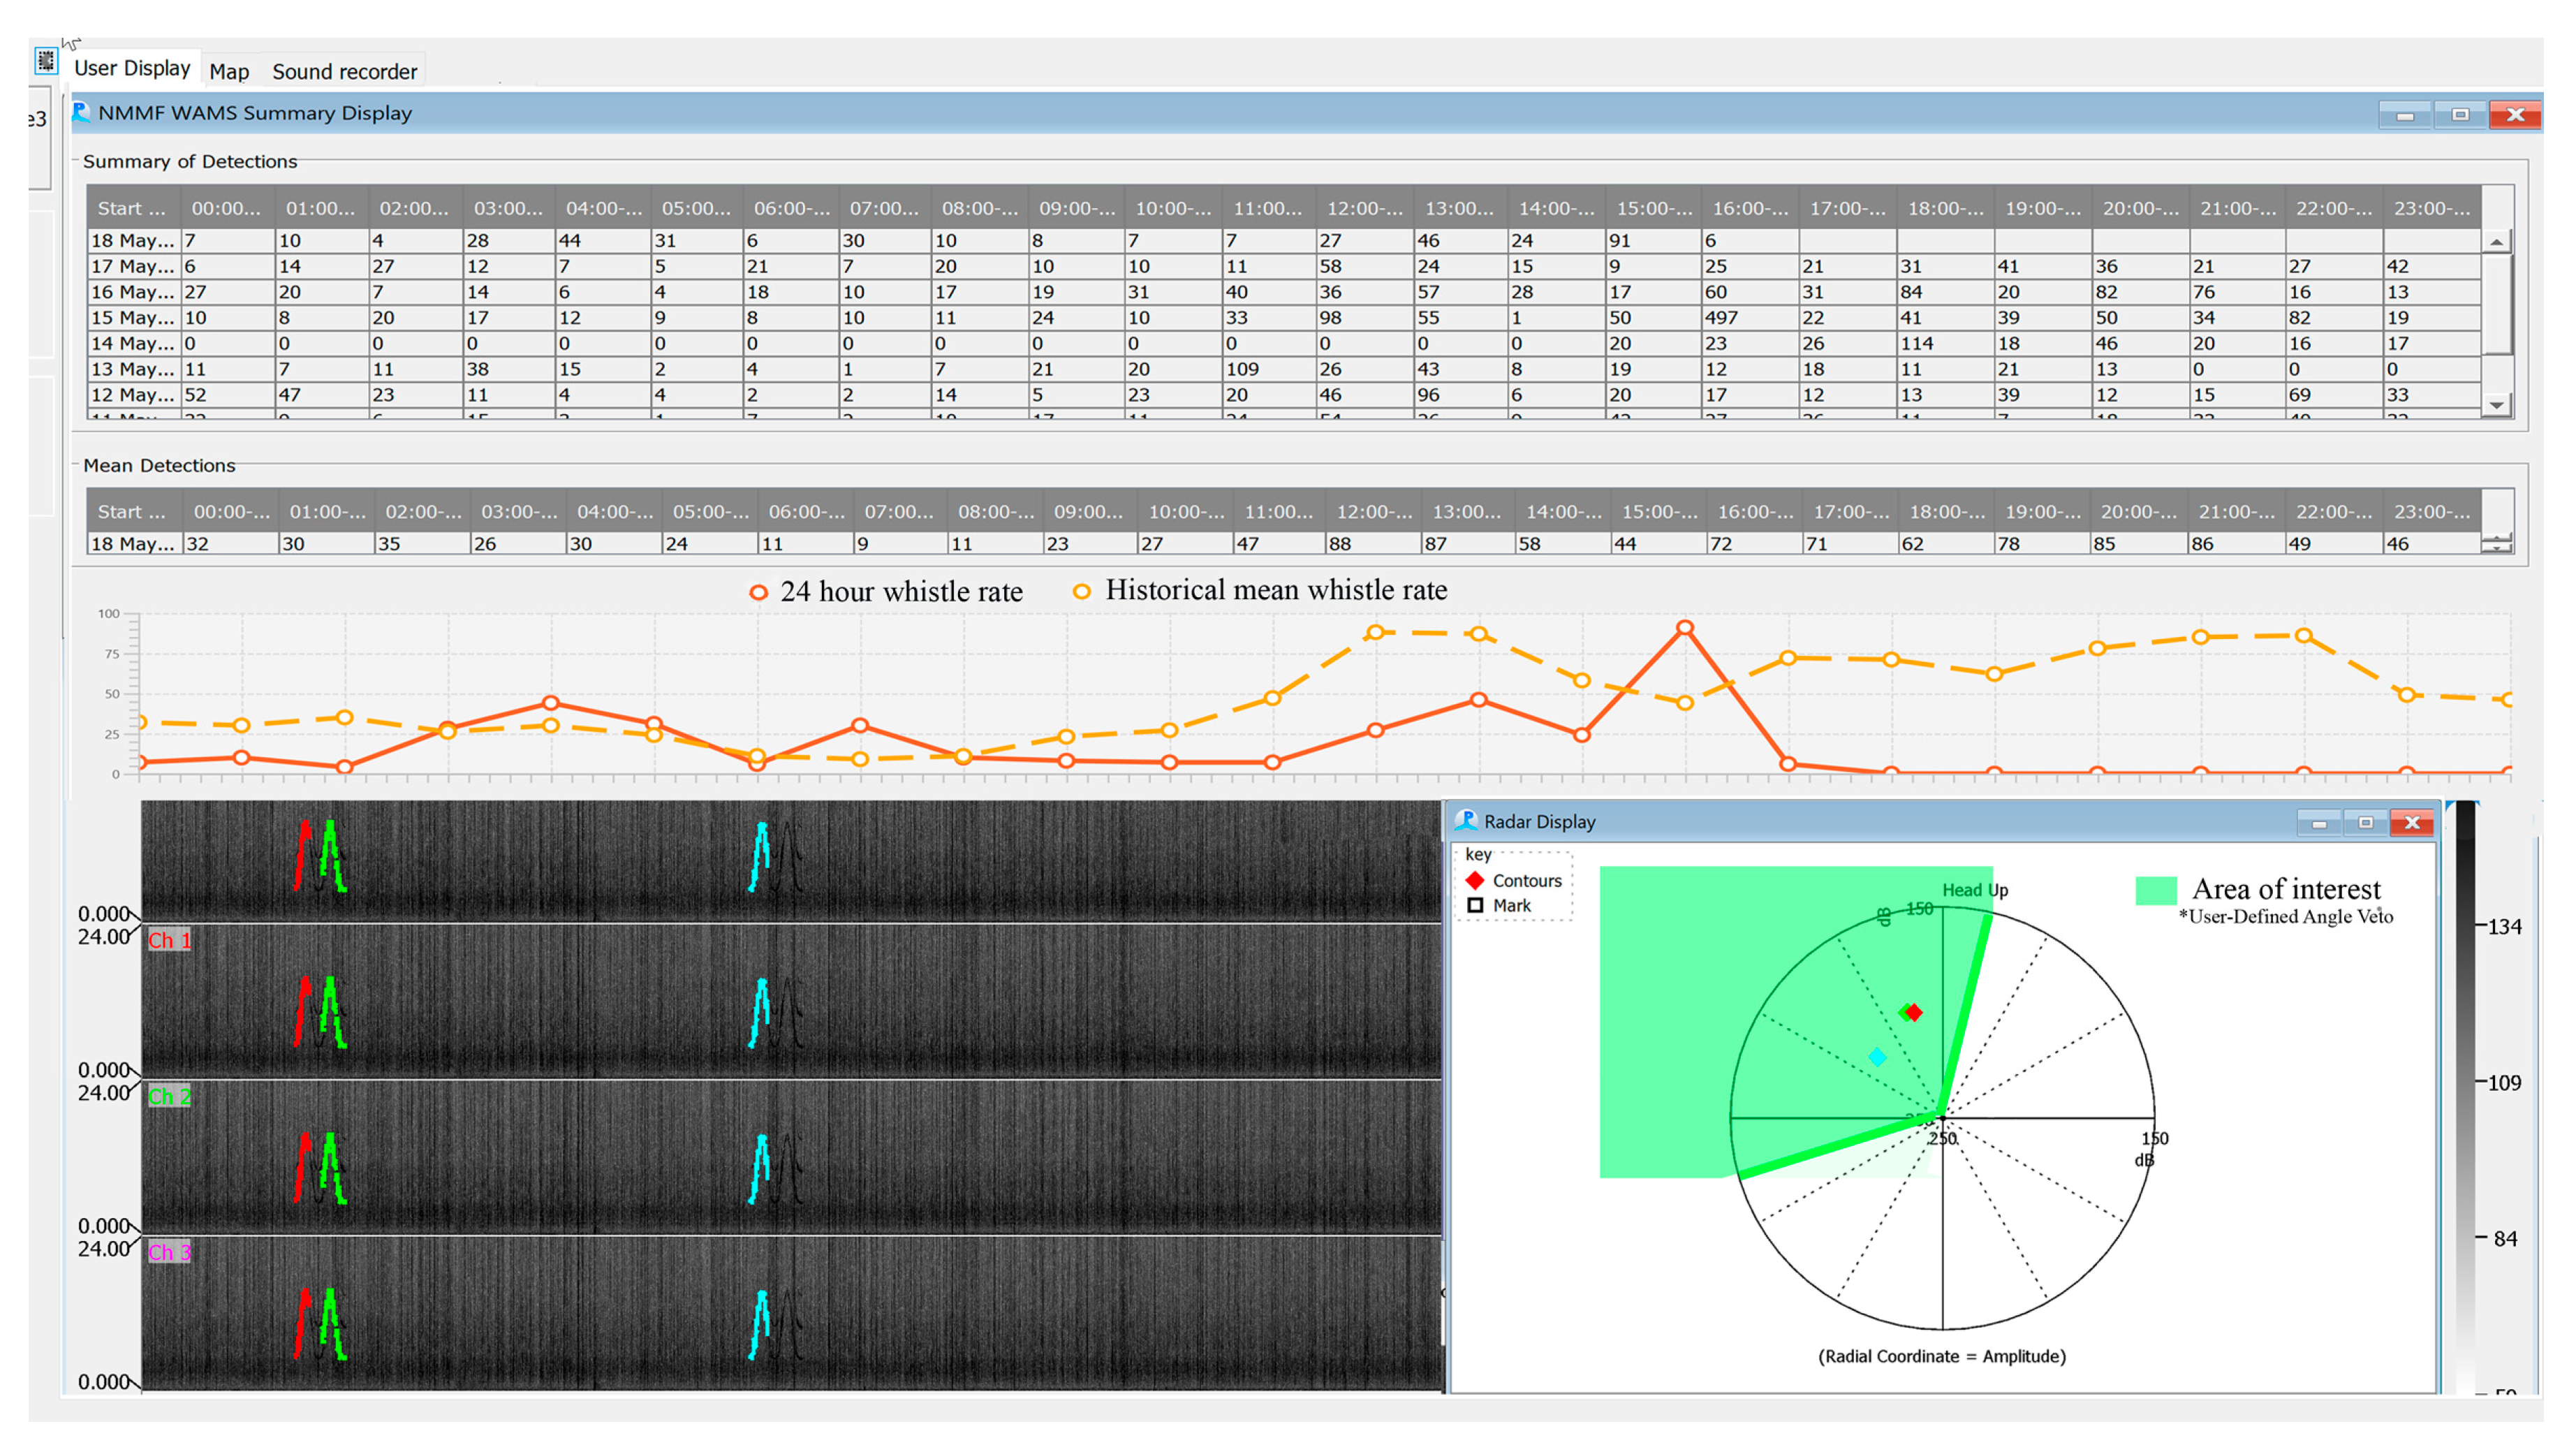
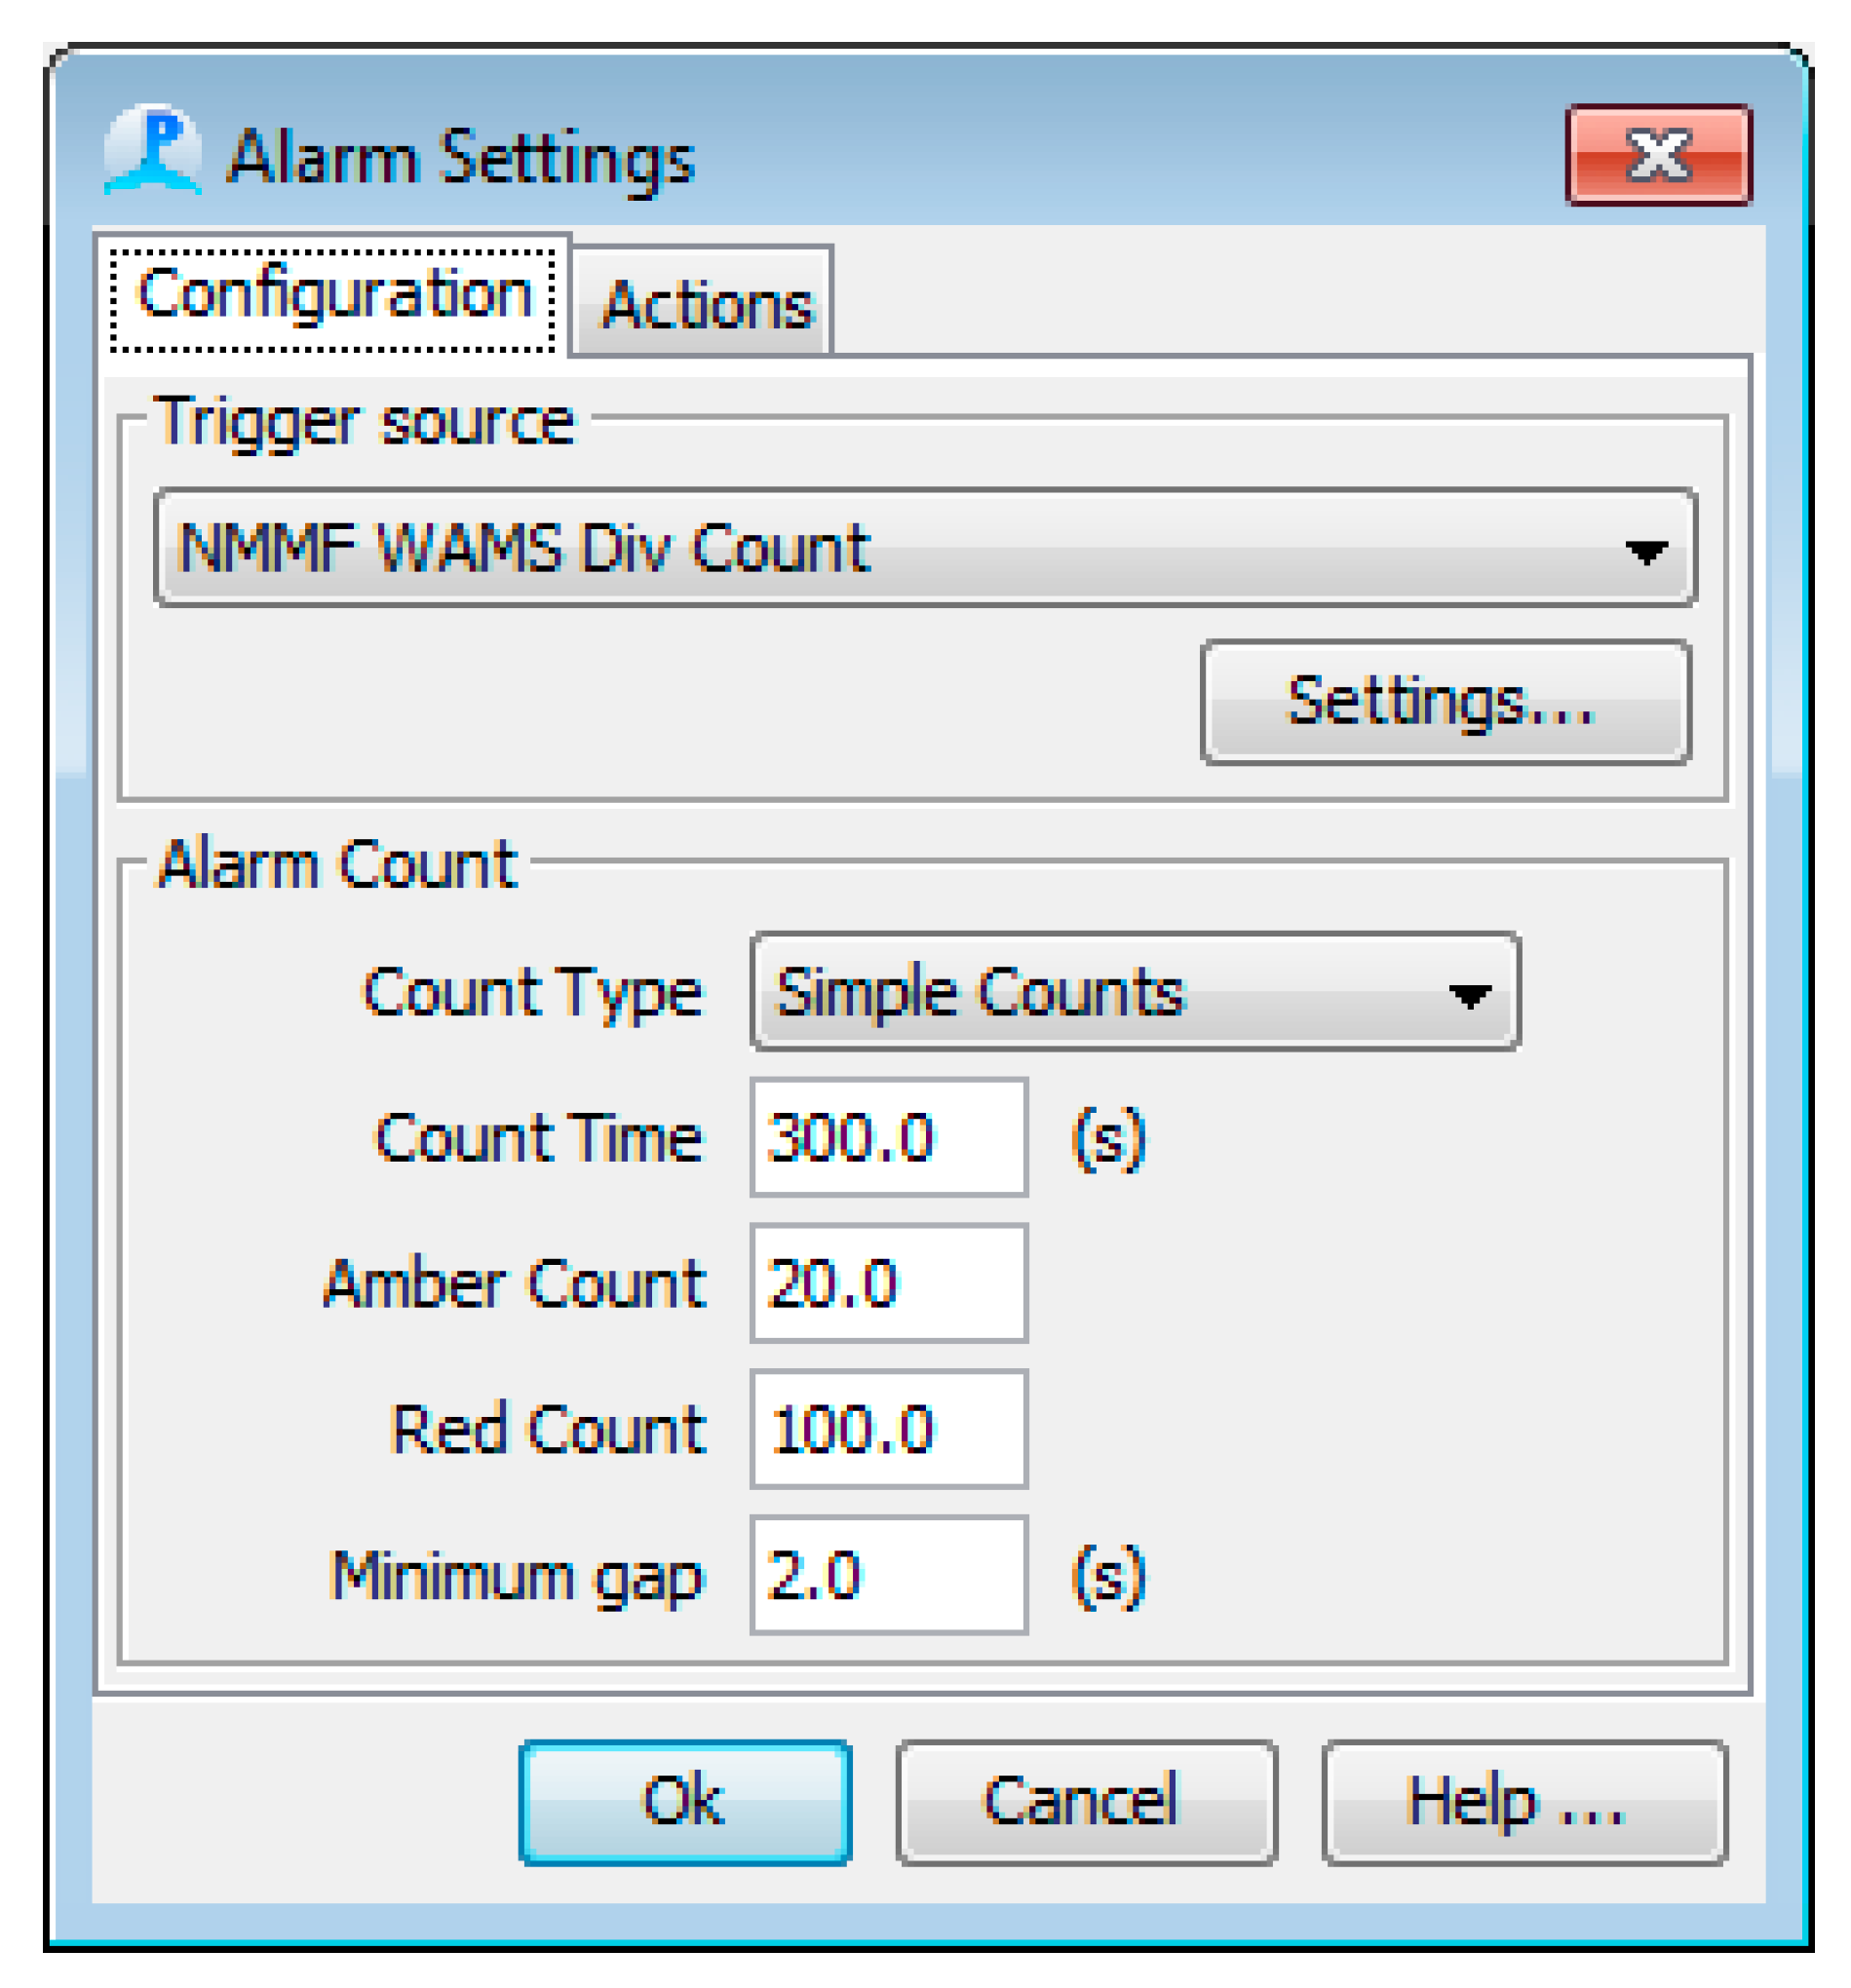
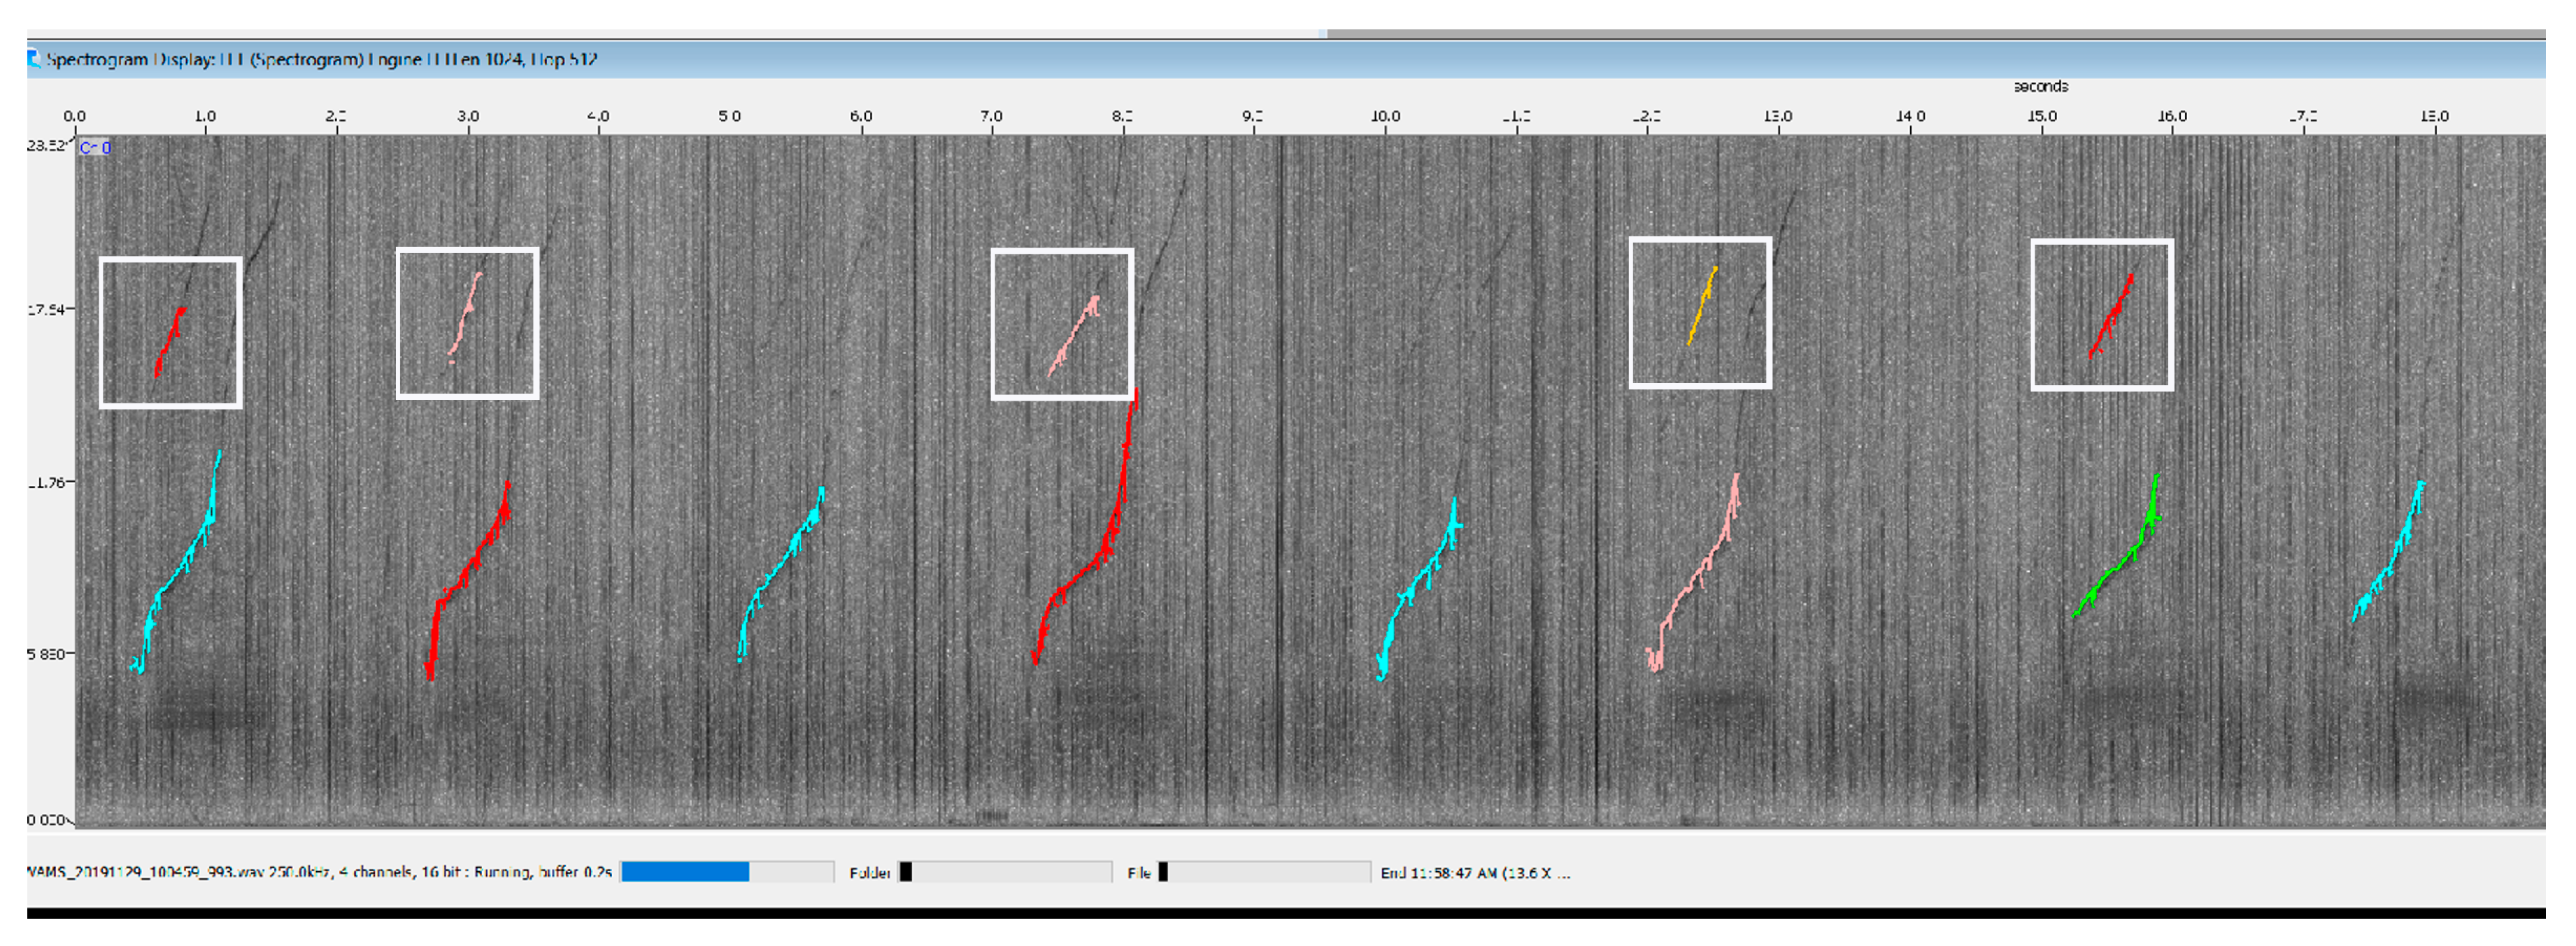
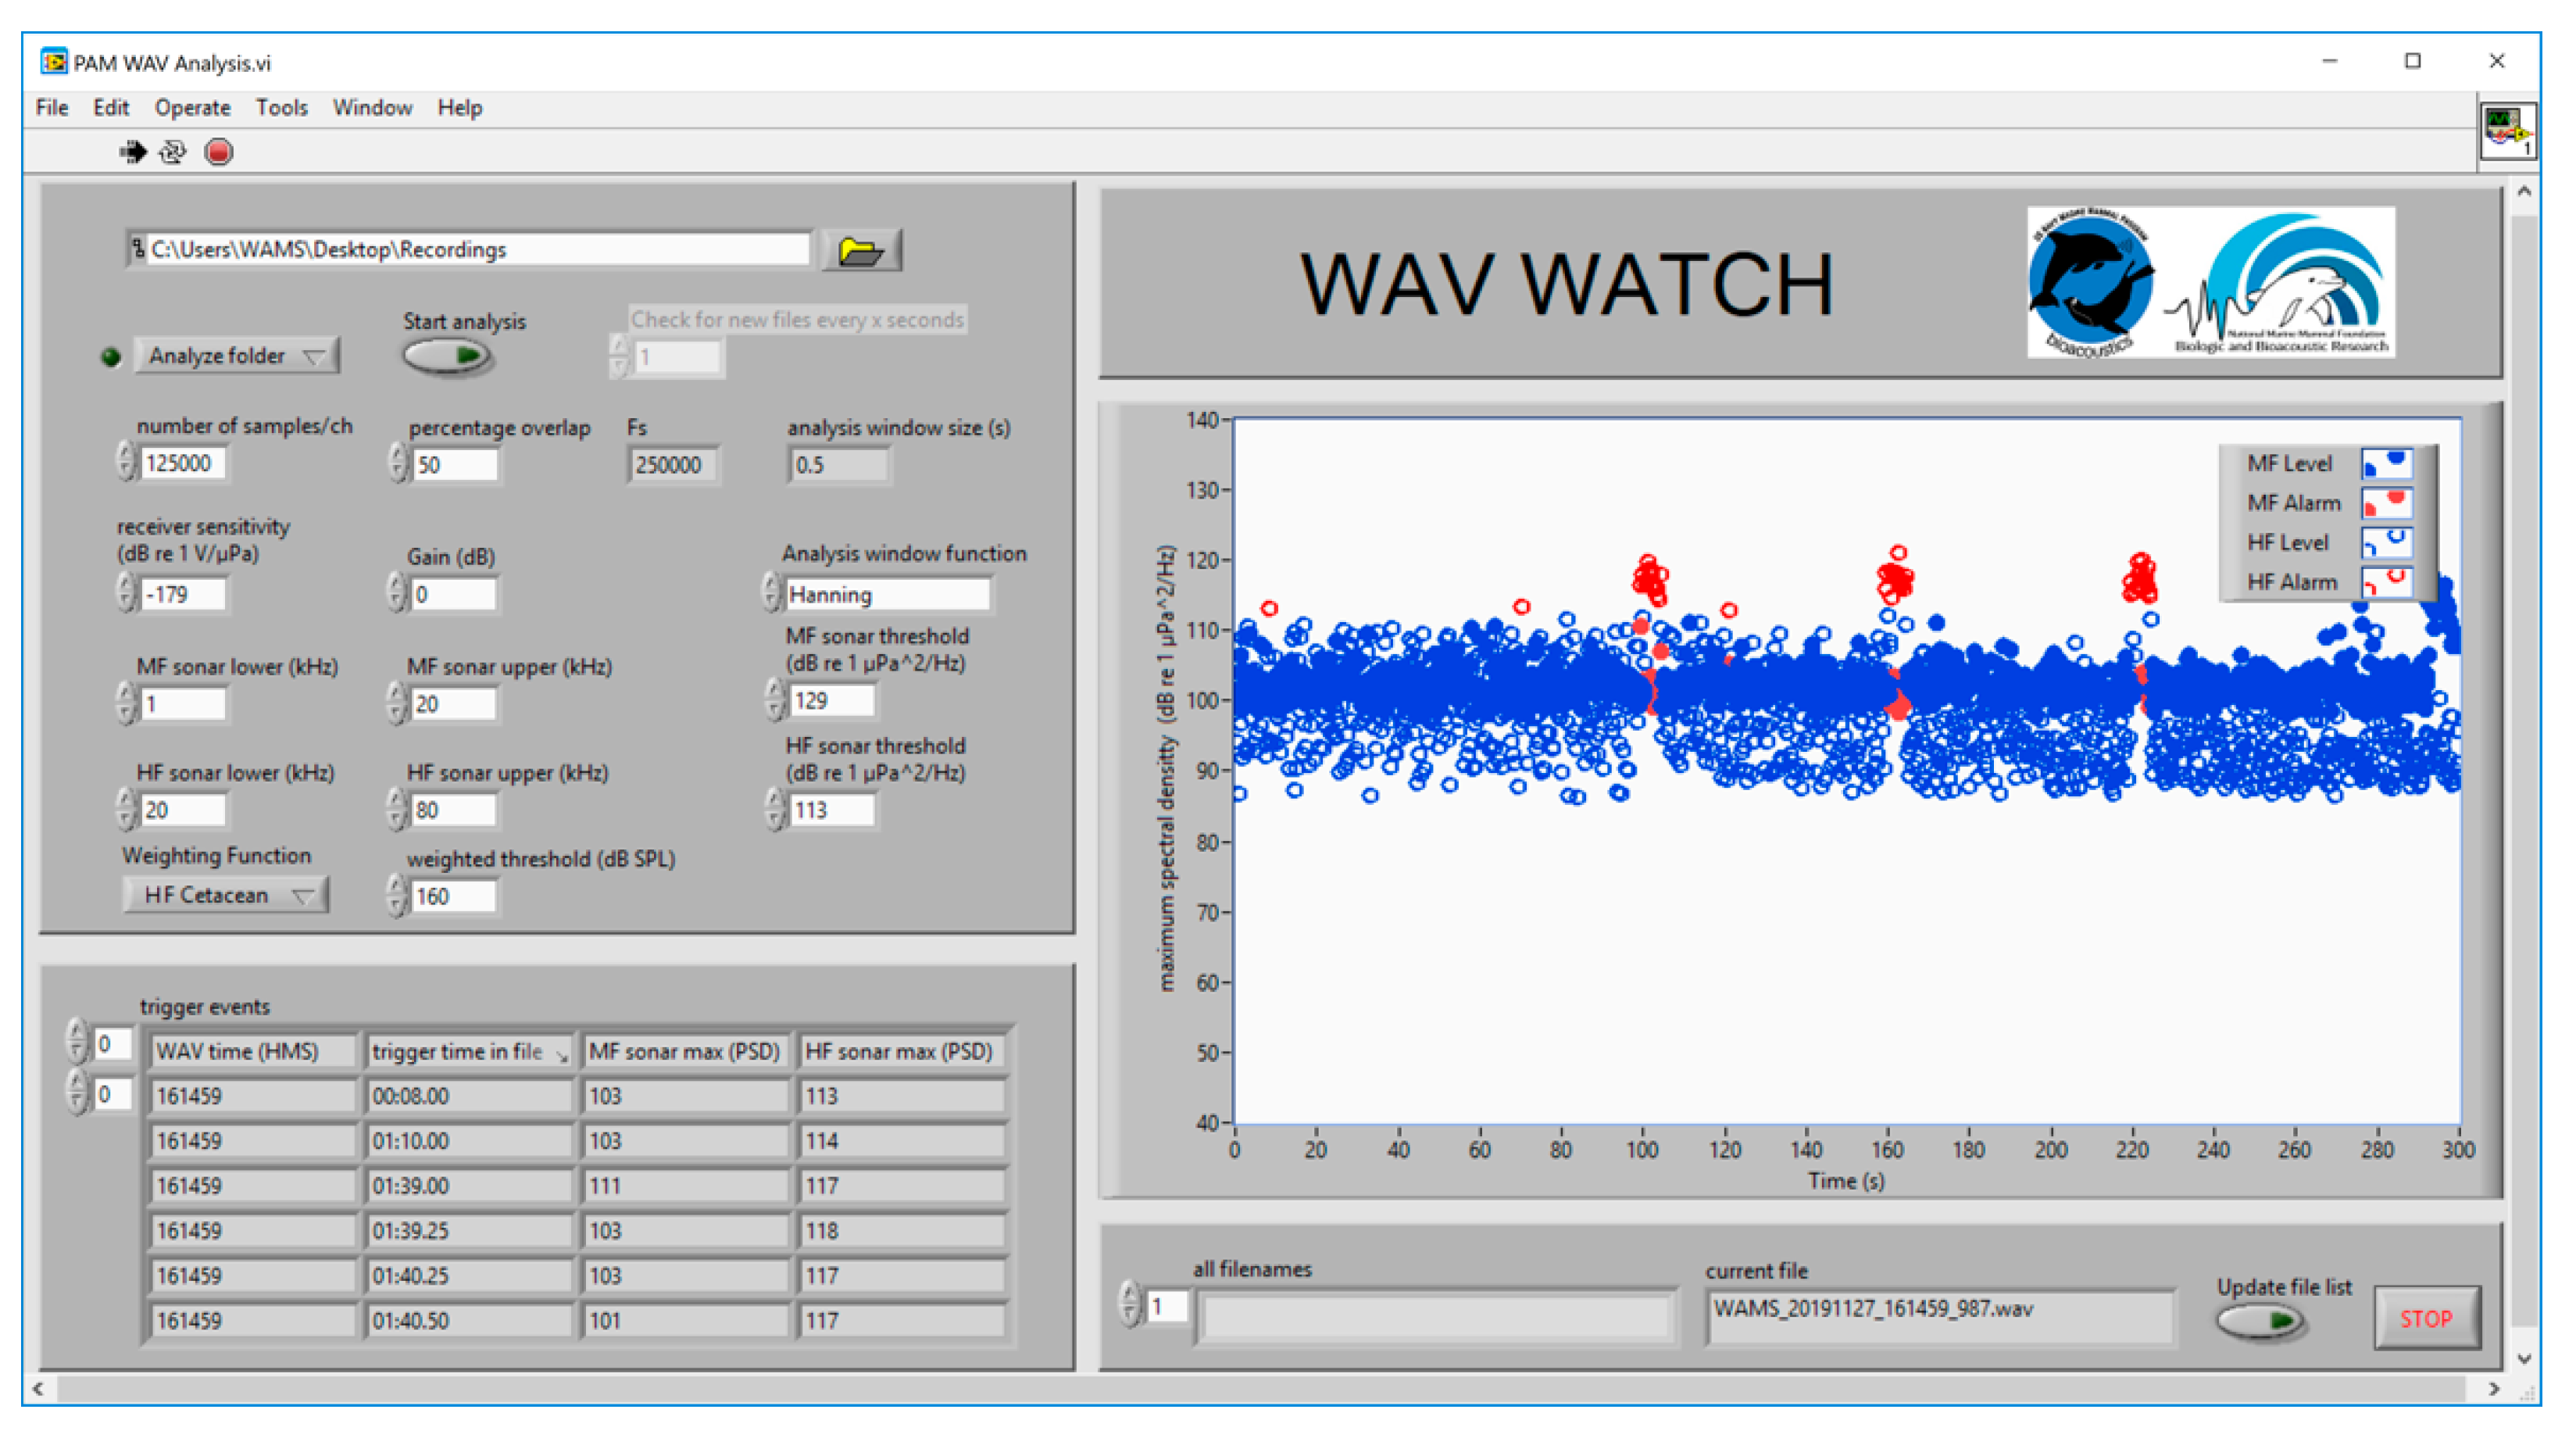
2.3. Software
3. Discussion
Author Contributions
Funding
Institutional Review Board Statement
Data Availability Statement
Acknowledgments
Conflicts of Interest
Appendix A

| Setting | Description |
|---|---|
| Maximum and Minimum Frequency | Defines the frequency range within which whistles will be detected. |
| Connection Type | Which pixels will be examined when trying to trace out a whistle fragment. |
| Connection Type 4 | |
| Indicates that the algorithm will try to connect with the pixel above, below, to the left or to the right of the current pixel. | |
| Connection Type 8 | |
| Also adds the diagonal pixels to the potential search area. | |
| Minimum Length | Whistle fragments shorter than the minimum length (measured in time slices, or fft/Fs) will be discarded. |
| Minimum Total Size | Whistle fragments shorter than the minimum total size (measured in number of pixels) will be discarded. |
| Crossing/Joining | How the Whistle & Moan Detector deals with overlapping whistles. |
| Leave branched regions intact | |
| Branched regions will be left intact and may contain more than one actual sound. | |
| Discard branched joins | |
| Any region that has more than one detected frequency peak in any time slice will be discarded. | |
| Separate all branches | |
| All branches will be separated and passed on as individual sounds. | |
| Relink across joins | |
| The algorithm will attempt to re-join individual tones across joins. The sound is first broken up as above, and the individual fragments are then re-joined according to a set of rules (see the help files for details). | |
| Max Cross Length | Threshold used when analyzing crossed whistles. Where whistles cross, two separate branches of a connected region merge, then re-separate. If the number of time partitions in the merged section is less than the Max Crossing Length, then it is assumed that this is indeed a genuine whistle crossing and the connected region is separates into two whistles. If the merged region is longer than this, then the region is split into four separate component (the two entering the merged region and the two leaving it). |
| Median Filter Length | Within each spectrogram slice, the median value about each point is calculated and subtracted from that point. The larger the median filter length, the greater the number of points used to calculate the median. |
| Average Subtraction Update Constant | A decaying average spectrogram is computed and subtracted from the current spectrogram value. The smaller the number, the greater/longer the averaging. |
| Threshold | A threshold value (in dB) below which data is set to 0. |
References
- Mcloughlin, M.P.; Stewart, R.; McElligott, A.G. Automated bioacoustics: Methods in ecology and conservation and their potential for animal welfare monitoring. J. R. Soc. Interface 2019, 16, 20190225. [Google Scholar] [CrossRef] [PubMed]
- Brando, S.; Broom, D.M.; Acasuso-Rivero, C.; Clark, F. Optimal marine mammal welfare under human care: Current efforts and future directions. Behav. Process. 2018, 156, 16–36. [Google Scholar] [CrossRef] [PubMed]
- Clegg, I.; Borger-Turner, J.L.; Eskelinen, H.C. C-Well: The development of a welfare assessment index for captive bottlenose dolphins (Tursiops truncatus). Anim. Welf. 2015, 24, 267–282. [Google Scholar] [CrossRef]
- Jones, B.; Zapetis, M.; Samuelson, M.M.; Ridgway, S.H. Sounds produced by bottlenose dolphins (Tursiops): A review of the defining characteristics and acoustic criteria of the dolphin vocal repertoire. Bioacoustics 2019, 29, 399–440. [Google Scholar] [CrossRef]
- Moore, S.E.; Ridgway, S.H. Patterns of dolphin sound production and ovulation. Aquat. Mamm. 1996, 22, 175–184. [Google Scholar]
- Ridgway, S.H. Dolphin hearing and sound production in health and illness. In Hearing and Other Senses; Far, R.R., Gourevitch, G., Eds.; Amphora Press: Groton, CT, USA, 1983; pp. 247–296. [Google Scholar]
- Overstrom, N.A. Association between burst-pulse sounds and aggressive behavior in captive Atlantic bottlenosed dolphins (Tursiops truncatus). Zoo Biol. 1983, 2, 93–103. [Google Scholar] [CrossRef]
- Caldwell, M.C.; Caldwell, D.K. Individualized whistle contours in bottlenosed dolphins (Tursiops truncatus). Nature 1965, 207, 434–435. [Google Scholar] [CrossRef]
- Kuczaj, S.A., II; Frick, E.E.; Jones, B.L.; Lea, J.S.E.; Beecham, D.; Schnöller, F. Underwater observations of dolphin reactions to a distressed conspecific. Learn. Behav. 2015, 43, 289–300. [Google Scholar] [CrossRef] [PubMed]
- Lilly, J.C. Distress call of the bottlenose dolphin: Stimuli and evoked behavioral responses. Science 1963, 139, 116–118. [Google Scholar] [CrossRef] [PubMed]
- Blomqvist, C.; Amundin, M. High-frequency burst-pulse sounds in agonistic/aggressive interactions in bottlenose dolphins, Tursiops truncatus. In Echolocation in Bats and Dolphins; Thomas, J.A., Moss, C.F., Vater, M., Eds.; University of Chicago: Chicago, IL, USA, 2004; pp. 425–431. [Google Scholar]
- Vannoni, E.; Torriani, M.V.G.; McElligott, A.G. Acoustic signaling in cervids. Cogn. Brain Behav. 2005, 9, 551–565. [Google Scholar]
- Gillespie, D.; Caillat, M.; Gordon, J.; White, P. Automatic detection and classification of odontocete whistles. J. Acoust. Soc. Am. 2013, 134, 2427–2437. [Google Scholar] [CrossRef] [PubMed]
- Rankin, S.; Archer, F.; Keating, J.L.; Oswald, J.N.; Oswald, M.; Curtis, A.; Barlow, J. Acoustic classification of dolphins in the California current using whistles, echolocation clicks, and burst pulses. Mar. Mamm. Sci. 2016, 33, 520–540. [Google Scholar] [CrossRef]
- Houser, D.S.; Yost, W.; Burkard, R.; Finneran, J.J.; Reichmuth, C.; Mulsow, J. A review of the history, development and application of auditory weighting functions in humans and marine mammals. J. Acoust. Soc. Am. 2017, 141, 1371–1413. [Google Scholar] [CrossRef] [PubMed]
- Southall, B.; Finneran, J.J.; Reichmuth, C.; Nachtigall, P.E.; Ketten, D.R.; Bowles, A.E.; Ellison, W.T.; Nowacek, D.P.; Tyack, P.L. Marine mammal noise exposure criteria. Aquat. Mamm. 2019, 45, 125–232. [Google Scholar] [CrossRef]
- Schön, P.C.; Puppe, B.; Manteuffel, G. Automated recording of stress vocalisations as a tool to document impaired welfare in pigs. Anim. Welf. 2004, 13, 105–110. [Google Scholar]
- Silva, M.; Ferrari, S.; Costa, A.; Aerts, J.M.; Guarino, M.; Berckmans, D. Cough localization for the detection of respiratory diseases in pig houses. Comput. Electron. Agric. 2008, 64, 286–292. [Google Scholar] [CrossRef]
- Pamguard. Available online: https://www.pamguard.org/downloads.php?cat_id=9 (accessed on 1 June 2020).


| Maximum Frequency | Minimum Frequency | Connection Type | Minimum Length | Minimum Total Size | Crossing/Joining | Maximum Cross Length | Median Filter Length | Subtraction Constant | Threshold |
|---|---|---|---|---|---|---|---|---|---|
| 20 kHz | 3 kHz | 8 sides | 10 slices | 50 | Relink | 5 slices | 61 | 0.02 | 8 dB |
Publisher’s Note: MDPI stays neutral with regard to jurisdictional claims in published maps and institutional affiliations. |
© 2021 by the authors. Licensee MDPI, Basel, Switzerland. This article is an open access article distributed under the terms and conditions of the Creative Commons Attribution (CC BY) license (https://creativecommons.org/licenses/by/4.0/).
Share and Cite
Jones, B.L.; Oswald, M.; Tufano, S.; Baird, M.; Mulsow, J.; Ridgway, S.H. A System for Monitoring Acoustics to Supplement an Animal Welfare Plan for Bottlenose Dolphins. J. Zool. Bot. Gard. 2021, 2, 222-233. https://doi.org/10.3390/jzbg2020015
Jones BL, Oswald M, Tufano S, Baird M, Mulsow J, Ridgway SH. A System for Monitoring Acoustics to Supplement an Animal Welfare Plan for Bottlenose Dolphins. Journal of Zoological and Botanical Gardens. 2021; 2(2):222-233. https://doi.org/10.3390/jzbg2020015
Chicago/Turabian StyleJones, Brittany L., Michael Oswald, Samantha Tufano, Mark Baird, Jason Mulsow, and Sam H. Ridgway. 2021. "A System for Monitoring Acoustics to Supplement an Animal Welfare Plan for Bottlenose Dolphins" Journal of Zoological and Botanical Gardens 2, no. 2: 222-233. https://doi.org/10.3390/jzbg2020015
APA StyleJones, B. L., Oswald, M., Tufano, S., Baird, M., Mulsow, J., & Ridgway, S. H. (2021). A System for Monitoring Acoustics to Supplement an Animal Welfare Plan for Bottlenose Dolphins. Journal of Zoological and Botanical Gardens, 2(2), 222-233. https://doi.org/10.3390/jzbg2020015