1. Introduction
As the global community continues to combat the accelerating threat of climate change, reducing anthropogenic carbon dioxide (CO
2) emissions has become an urgent scientific and political imperative. According to the Intergovernmental Panel on Climate Change (IPCC), limiting global warming to below 2 °C requires dramatic reductions in CO
2 emissions and the deployment of technologies capable of removing CO
2 from the atmosphere [
1].
One of the most promising approaches in this context is carbon capture and storage (CCS), a suite of technologies that involve capturing CO
2 from significant point sources, transporting it to a storage site, and injecting it into deep geological formations for long-term isolation from the atmosphere [
2,
3]. Among the various storage options, saline aquifers, depleted oil and gas fields, and unmineable coal seams have gained particular attention due to their large storage capacities, widespread distribution, and geological characteristics that are favorable for long-term containment [
4,
5].
A considerable amount of research has been conducted on injecting CO
2 into geological reservoirs. This research has focused on how fluids flow, how they become trapped, and how the rocks respond to the injection [
4,
6,
7]. Bashir et al. [
4], for example, provide a detailed examination of the concepts of geological storage of CO
2 and its potential for trapping. Song et al. [
6] and Chen et al. [
7] discuss the primary geomechanical issues, including changes in stress, reactivation of faults, and maintaining the integrity of the caprock during high-pressure injection. The lack of site-specific or material-specific modeling results has not been considered, such as those involving shale formations like Opalinus Clay.
Recent advances have also highlighted the potential of hydrate-based CO
2 capture and storage, particularly under cold and high-pressure subsurface conditions. Has-sanpouryouzband et al. [
6] demonstrated that injecting CO
2-rich flue gas into methane hydrate-bearing sediments can result in over 60% CO
2 capture efficiency through hydrate formation, with performance susceptible to pressure, temperature, and hydrate saturation levels. Building on this, further studies confirmed CO
2 capture efficiencies of up to 92 mol% under optimized conditions, emphasizing the role of sediment type and kinetic factors, as well as the structural evolution of clathrates in selectively trapping CO
2 over N
2 [
7]. The results mention the central role of multiphase thermodynamic and kinetic behavior in determining CO
2 sequestration efficiency and system stability, paralleling the significance of the pressure-dependent mechanisms explored in caprock integrity modeling.
Central to the effectiveness and safety of geological CO
2 storage is the integrity of the caprock. The low-permeability geological formation over the storage reservoir prevents CO
2 from rising [
6]. Due to their limited permeability and geomechanical robustness, shale formations make good caprocks. CO
2 injection into the subsurface may compromise the physical and mechanical properties of caprocks, affecting their sealing integrity [
7]. Understanding the relationship between injected CO
2, pore structure, and caprock mineralogical composition is crucial for assessing the long-term stability of geological carbon dioxide (CO
2) storage sites. Specifically, the clay mineral content (e.g., smectite, illite, kaolinite) influences swelling or shrinkage behavior. The porosity and permeability of carbonate rocks, such as calcite, change in response to acidic conditions. Therefore, mineralogical parameters govern the geochemical reactivity and mechanical strength of the caprock over extended periods.
Shale formations typically consist of fine-grained sedimentary rocks composed predominantly of clay minerals, quartz, carbonates, and organic matter. Their low permeability and high capillary entry pressure make them suitable natural seals [
8,
9]. However, in response, their behavior under CO
2-rich environments is complex. Exposure to CO
2-saturated brine can induce physical changes such as swelling, shrinkage, or micro-fracturing, as well as chemical alterations, including mineral dissolution, precipitation, and changes in pore structure [
10]. These processes can alter the permeability and mechanical strength of the shale, potentially creating pathways for leakage of stored CO
2.
Numerical simulations are crucial for studying CO
2 storage systems. They may evaluate geomechanical coupling processes in geological formations, anticipate subsurface system evolution over decades, and assess risks of leakage and system failure [
11,
12]. Geomechanical models can simulate stress, strain, and fractures between CO
2, brine, and minerals [
13].
Caprock behavior has been studied using continuum-based finite element, finite difference, and discrete fracture network models [
14,
15]. These models utilize constitutive relationships to explain rock deformation and reactive transport equations for failure criteria, enabling the prediction of fracture initiation and propagation. Integrating these methods—such as finite element models for stress and strain analysis, discrete fracture networks for capturing fracture propagation, and reactive transport models for simulating mineral-fluid interactions—enables a comprehensive understanding of how CO
2 injection affects caprock stability. As a result, this integrated approach helps capture the fluid flow behavior and mechanical deformation, thereby improving the accuracy and risk assessment for long-term storage.
However, the geomechanical characteristics, mineralogy, porosity, permeability, and boundary conditions of the input data determine the reliability of the numerical model. To achieve predictive power, models must be calibrated and tested against laboratory trials, field observations, or pilot projects. The realistic data from site-specific investigations are valuable for model creation and testing [
16]. While generic caprock behavior models might be helpful, they fail to capture geological complexity. For instance, a generic model may assume homogeneous permeability or linear elastic behavior across the caprock, which overlooks localized heterogeneities such as bedding planes, variable clay content, or existing microfractures—all of which significantly influence CO
2 migration and mechanical response in real formations. Investigations at individual sites provide a complete understanding of CO
2 injection and storage procedures. They help identify crucial caprock integrity elements in certain formations and establish specialized monitoring, risk assessment, and management techniques.
The Opalinus Clay shale formation has been extensively investigated in Europe, primarily in Switzerland [
17]. It is preferable for numerical CO
2 storage impact studies due to the abundance of high-quality, site-specific data on its mineralogy and porosity. This large dataset reduces model uncertainty, making it a vital benchmark for coupled hydromechanical model calibration and validation. The Opalinus Clay is a Middle Jurassic argillaceous formation widely present in the Swiss Plateau and adjacent regions [
18]. It typically consists of alternating layers of claystone and marlstone, with dominant clay minerals such as illite, kaolinite, and smectite, along with calcite, quartz, and feldspar. The formation exhibits extremely low permeability (10
−21 to 10
−18 m
2), high capillary entry pressure, and favorable self-sealing properties [
19].
Previous studies on Opalinus Clay have explored its geomechanical behavior and poroelastic properties [
20]. Experimental work has examined its swelling and shrinkage potential, as well as fracture propagation under various stress states in CO
2-rich fluids [
21]. However, comprehensive numerical investigations into the coupled geomechanical effects of CO
2 injection on Opalinus Clay as a caprock remain limited.
It is essential to understand the strength of Opalinus Clay in storing CO
2, not only for its relevance to future storage projects in Switzerland but also because it serves as a well-characterized analog for other clay-rich formations worldwide. Insights gained from its documented behavior, such as low permeability, self-sealing capacity, and predictable hydromechanical responses, can inform the design, risk assessment, and modeling strategies for similar argillaceous caprocks in regions lacking extensive site-specific data. Few studies have examined the flow behavior and geomechanical interactions between CO
2 and clay-rich caprocks in realistic subsurface conditions [
22]. Second, modest mineralogical changes and stress redistribution do not significantly restrict caprock integrity over time.
Numerous numerical studies have focused on sandstone reservoirs and their surroundings [
23], whereas claystone caprocks have received less attention [
6]. A case study of Opalinus Clay utilizing advanced coupled modeling approaches can provide valuable insights into its effectiveness as a CO
2 seal, considering the importance of site-specific features. This research addresses these deficiencies using a fully coupled computational model that incorporates geomechanical and flow behavior, realistic material properties, and various injection scenarios. It simulates the caprock’s geomechanical integrity over time in response to CO
2 exposure, taking into account changes in pore pressure and stress redistribution.
This study numerically investigates the effects of CO2 injection on the integrity of the Opalinus Clay caprock and models the associated geomechanical processes. It assesses fracture risks, permeability changes, and mineralogical impacts on sealing capacity. Specifically, it identifies critical failure conditions such as the exceedance of capillary entry pressure, stress-induced fracture initiation, and permeability thresholds beyond which CO2 may migrate uncontrollably. These factors compromise the caprock’s sealing integrity. The study then develops a validated framework for assessing and evaluating long-term risks at storage sites in shale systems.
2. Governing Equations
This study utilizes a coupled multiphase flow and geomechanics framework to simulate the behavior of Opalinus Clay during CO
2 injection. The model accounts for two immiscible fluid phases (water and CO
2) within a deformable porous medium, applying the principles of mass conservation, Darcy’s law, and poroelasticity, as outlined in COMSOL 6.2 [
24].
The general mass conservation equation for each phase (
β) is expressed as
where
φ is the porosity,
S is the saturation,
is the density (kg/m
3),
u is the Darcy velocity (m/s), and
Ψ represents source or sink term. The Darcy velocity is given by
where
is the intrinsic permeability (mD),
is the relative permeability, and
P is the fluid pressure (Pa). The source term (
) includes contributions from volumetric strain through the Biot coefficient (
), as follows:
where
is the volumetric strain. In the present study, the effects of gravity are neglected; therefore, the pressure gradient acts as the sole driving force for oil transport within the core and fracture regions. The Biot modulus (
M) and the Biot coefficient (
) can be expressed as
where
is the drained bulk modulus (MPa), and
is the solid bulk modulus (MPa). Substituting Equations (2)–(5) into Equation (1), the governing mass conservation equation can be used for the fully coupled scheme can be expressed as
where
is the volumetric strain for the 2D model in Equation (8)
in the form of a strain tensor.
where
d is the displacement (mm). The force equilibrium (or solid deformation) can be represented by
where
and
are the total and effective stress (MPa), respectively, and I is the second-order identity tensor. The porosity changes within the matrix are analyzed concerning the generated strain, as described by Equation (8) [
20], as follows:
The porosity (
φ) dependent on elastic modulus (
E) is considered in the present work and is given in Equation (9) [
21], as follows:
As the rock undergoes compression, the ability of multiphase flow through it changes. The permeability of the rock matrix (
) can be expressed as [
22]
where
is the initial rock matrix permeability (mD), and
E is Young’s modulus (GPa) of the rock matrix. The positive sign refers to dilatational loading, and the negative sign corresponds to the compressional loading [
25].
The effective viscosity is given in Equation (11), as follows:
Total density is represented in Equation (12), as follows:
The Brooks and Corey approach models the contact between the rock matrix and the fracture zone [
26]. According to this method, the fluid saturation (
S) of the phases can be expressed as
where the subscripts
i and
r represent initial and residual, respectively.
The Brooks and Corey method is used to compute the capillary pressure as a function of water saturation at the fracture matrix interface, which can be expressed as
where
is the entry capillary pressure (Pa), and
is the pore size distribution index.
The relative permeability is computed as a function of the water saturation and pore size distribution index (
) using the Brooks and Corey method, as expressed below
4. Results and Discussion
In this section, we compare and contrast the different results. First, we measure the entry capillary pressure using results from the CO2 injection of shaly OPA and compare them to experimental data, with a focus on the sample’s initial saturation. Next, we examine how the CO2 saturation changes when the pressure upstream in the sample rises. Finally, we discuss how stress affects permeability.
4.1. Entry Capillary Pressure
Figure 2 illustrates the hydraulic response, showing how the recorded capillary pressure changes over time on the downstream side. Initially, as the CO
2 pressure increases to 4 MPa upstream, there is no significant change in the downstream capillary pressure, which remains at 491.73 Pa. This indicates that the material acts as a perfect barrier, preventing CO
2 from passing through and spreading. However, in the next stage, when the upstream CO
2 pressure rises to 8 MPa, the downstream capillary pressure drops to 6.35 Pa, which indicates that something has changed. This drop suggests that the sample’s entry capillary pressure has been exceeded, allowing CO
2 to displace water and flow through the pore network toward the downstream side. As CO
2 penetrates the material, it replaces the wetting phase (water), reducing the capillary forces that initially resisted flow. This displacement of water by the non-wetting CO
2 phase results in a measurable decrease in downstream capillary pressure, indicating the onset of two-phase flow and partial desaturation within the caprock matrix. In the third phase, this trend intensifies as the CO
2 pressure increases to 12 MPa. This causes the capillary pressure downstream to drop even more, down to 5.57 Pa, which is lower than in the previous steps. In the final step, when the injection pressure is lowered to 8 MPa, a slight rise in downstream capillary pressure occurs. Notably, the observed reduction in downstream capillary pressure cannot be attributed to a diffusive flow mechanism within a brief time frame [
27].
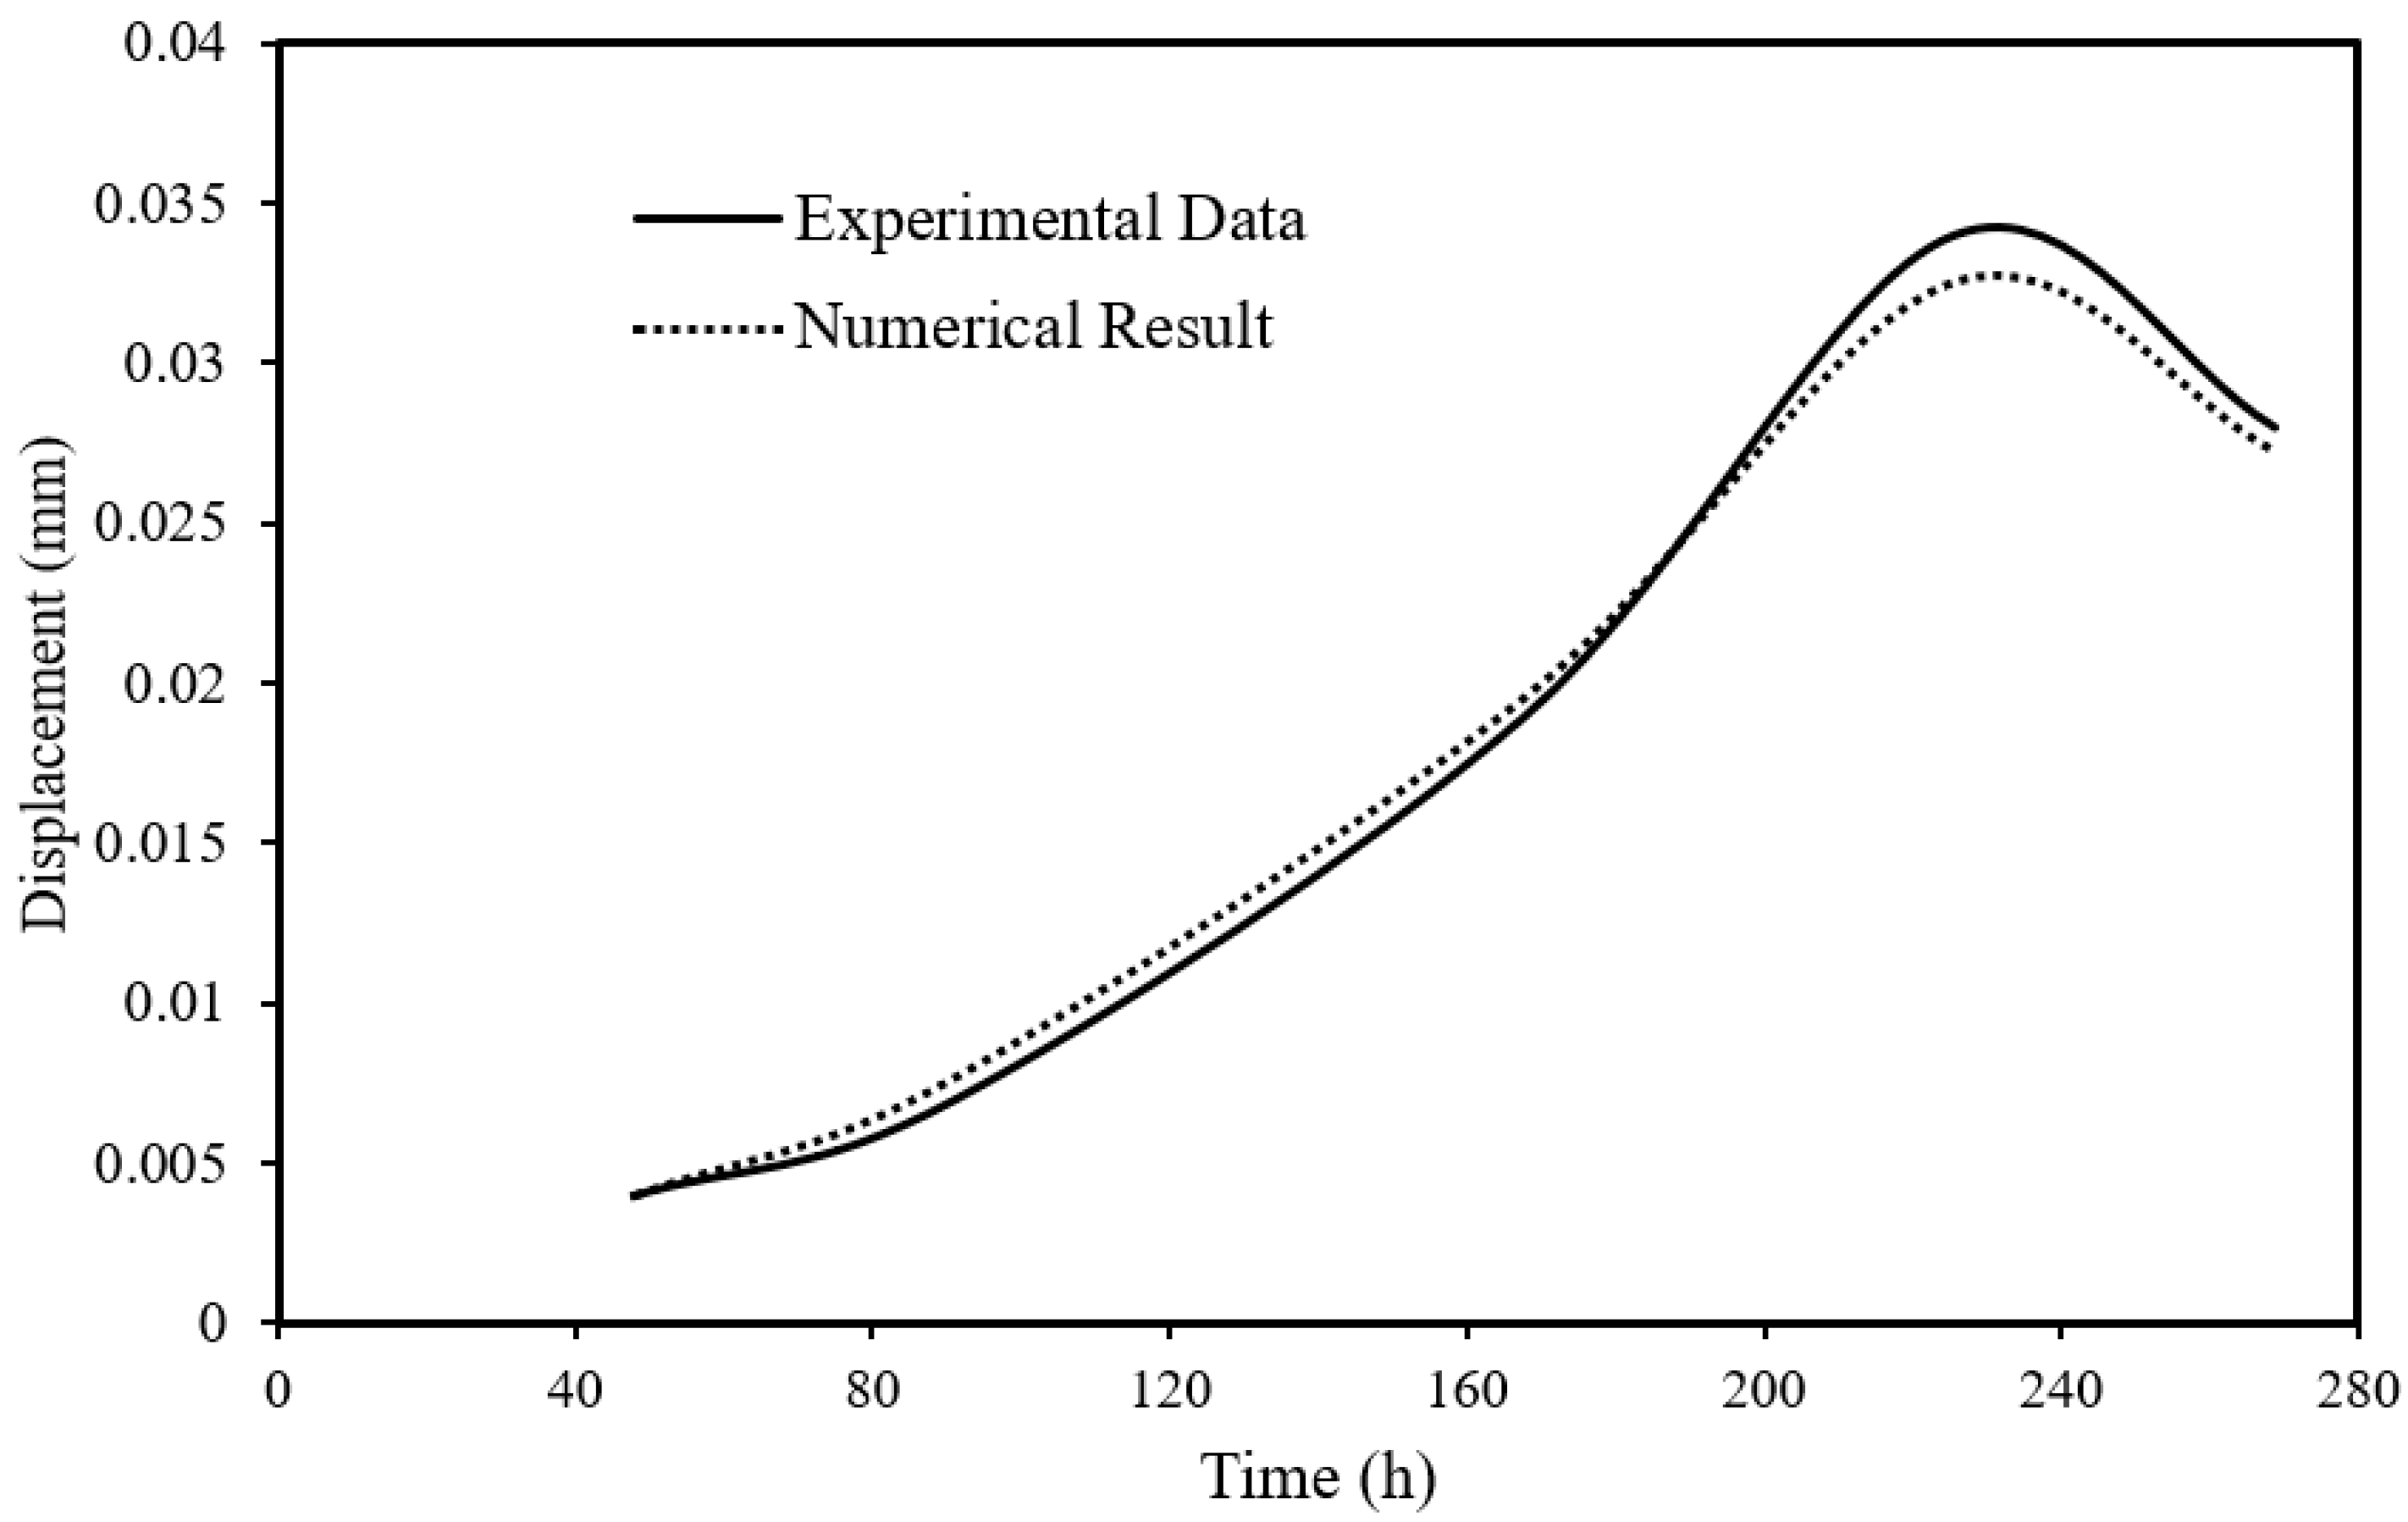
Figure 3 illustrates the numerical mechanical behavior of the sample, as measured by axial displacements and validated against experimental data [
21]. The numerical behavior of the shaly OPA results matches the experimental data within a margin of less than 10%. Positive displacements indicate compaction. Each increment in CO
2 pressure at the upstream side results in observable compaction. An immediate displacement occurs upon an increase in CO
2 pressure, followed by delayed compaction at a slower rate. The presence of creep is evident after the CO
2 injection pressure rise, particularly during the initial step (Step 1), in the sample’s response before and after water replacement with CO
2 at a pressure of 2 MPa.
The hydro-mechanical behaviors of Opalinus Clay when CO2 is injected are closely tied to capillary forces arising within water-saturated samples. In a single-fluid system, increased injection pressure results in material expansion due to a decrease in effective stress. However, when two immiscible fluids, such as CO2 and water, are present, capillary forces develop at their interface, preventing pressure transmission from the injected fluid to the pore fluid. Instead, these capillary forces generate additional effective stress at the grain scale by pulling water toward pore throats and effectively drawing mineral grains together. This increases intergranular attractive forces, reducing the pore volume and leading to mechanical compaction of the rock matrix even without external loading changes. Capillary forces, roughly estimated using the Young–Laplace equation, are particularly significant in geomaterials such as Opalinus Clay and shales due to their small pore sizes, often in the nanometer range. The extent of capillary force influence during CO2 injection depends on the saturation levels of CO2 and water in the sample. If most pores are filled with CO2, the overall increase in pore pressure from injection predominates over capillary effects.
Before CO2 penetration into the sample (during Step 2 with an injection pressure of 4 MPa), capillary forces only exerted themselves on the upstream boundary of the sample. These forces adequately counteracted the CO2 overpressure, resulting in slight material compaction. This capillary barrier effectively prevented CO2 migration across the sample, with no pressure fluctuations detected downstream. However, upon CO2 recovery downstream (Step 3, with injection pressure increased to 8 MPa), capillary forces began to manifest within the sample, following pathways that conveyed CO2 through the material. This phenomenon led to more substantial material compaction during the subsequent steps (Steps 3 and 4, with injection pressures of 8 and 12 MPa, respectively). The observed behavior supports the notion that CO2 displaced water within the pore space, penetrating the material along localized pathways with lower water retention capacities, resulting in partial desaturation of the sample. The mechanical response in Step 5, when the injection pressure is lowered, further supports this argument. When the pressure of CO2 decreases, the capillary forces also decrease, causing the sample to expand.
4.2. CO2 Saturation
Figure 4 depicts the initial phase of gas injection, emphasizing the entry of carbon dioxide (CO
2) into the system under an upstream pressure of 2 MPa. This stage marks the initiation of the CO
2 injection process, which is crucial for various industrial applications, including enhanced oil recovery and carbon capture and storage projects.
It is worth noting that there are no significant changes in CO2 saturation within the OPA clay during this preliminary phase. This lack of substantial change is due to the fact that the downstream pressure remains constant during the initial injection stage.
The stability of CO2 saturation levels inside the OPA clay during this period implies that the gas was introduced gradually and deliberately into the system. This controlled method is crucial for effectively monitoring and managing the injection process, leading to optimal performance and adherence to predefined operational criteria.
Figure 5 illustrates the evolution of CO
2 saturation as the upstream pressure rises for 4 MPa, 8 MPa, 12 MPa, and 8 MPa from step 2 to step 5, respectively. It is clear that as the upstream pressure increases to 4 MPa at the second step, the CO
2 saturation in the system slightly rises, indicating that the entry capillary pressure of the sample has been surpassed, allowing CO
2 to penetrate through the sample toward the downstream side. This trend intensifies in the third and fourth steps, as the upstream pressure rises to 8 MPa and 12 MPa, resulting in a more significant increase in upstream pressure than in the previous step, and the CO
2 saturation rises significantly toward the downstream. Upon reducing the upstream pressure back to 8 MPa in the final step, a decrease in the pressure increase at the downstream side is noted, and the CO
2 saturation is also reduced.
As the upstream pressure rises to 4 MPa in the second stage, the CO2 saturation level increases dramatically. This spike indicates that the sample’s entry capillary pressure has been exceeded, allowing CO2 to pass through and reach the downstream side. The increase in saturation is slight at this moment, but it is a sign of bigger changes that will happen in the following steps.
As the numerical investigation advances to the third and fourth phases, where the upstream pressure rises to 8 MPa and 12 MPa, respectively, the trend of CO2 saturation accelerates significantly. The significant increase in upstream pressure compared to the preceding stage causes a noticeable rise in CO2 saturation toward the downstream side. This event demonstrates how pressure levels influence the extent to which CO2 can penetrate a sample. It also reflects the importance of adjusting pressure to control gas flow and saturation.
In the last step, lowering the upstream pressure back to 8 MPa reduces the pressure rise on the downstream side, resulting in a decrease in CO2 saturation. This decrease indicates that gas saturation in the sample is dynamic and fluctuates in response to changes in pressure.
Figure 5 presents the overall view of CO
2 saturation, illustrating how pressure changes and gas flows through the sample in a complex manner. By examining these trends, researchers can gain valuable insights into how gas moves through porous surfaces [
28,
29]. Understanding how CO
2 saturation changes during the first injection stage provides us with essential information about how gas injection works, which enables us to devise methods to improve its effectiveness and efficiency. By closely monitoring and analyzing the early stages, operators can refine injection procedures, mitigate risks, and optimize environmental outcomes and process efficiency.
4.3. Impact on Permeability
To fully understand the importance of initial sample saturation in measuring sealing capacity, we conducted a strict repeat CO
2 injection using the same shaly OPA sample. This test was performed with a range of stress-loading settings, from 5 MPa to 30 MPa, while maintaining a steady upstream pressure of 12 MPa. This multifaceted investigation addresses an intriguing question regarding material permeability, initially highlighted by Haghi et al. [
30], which remains unresolved in the existing literature.
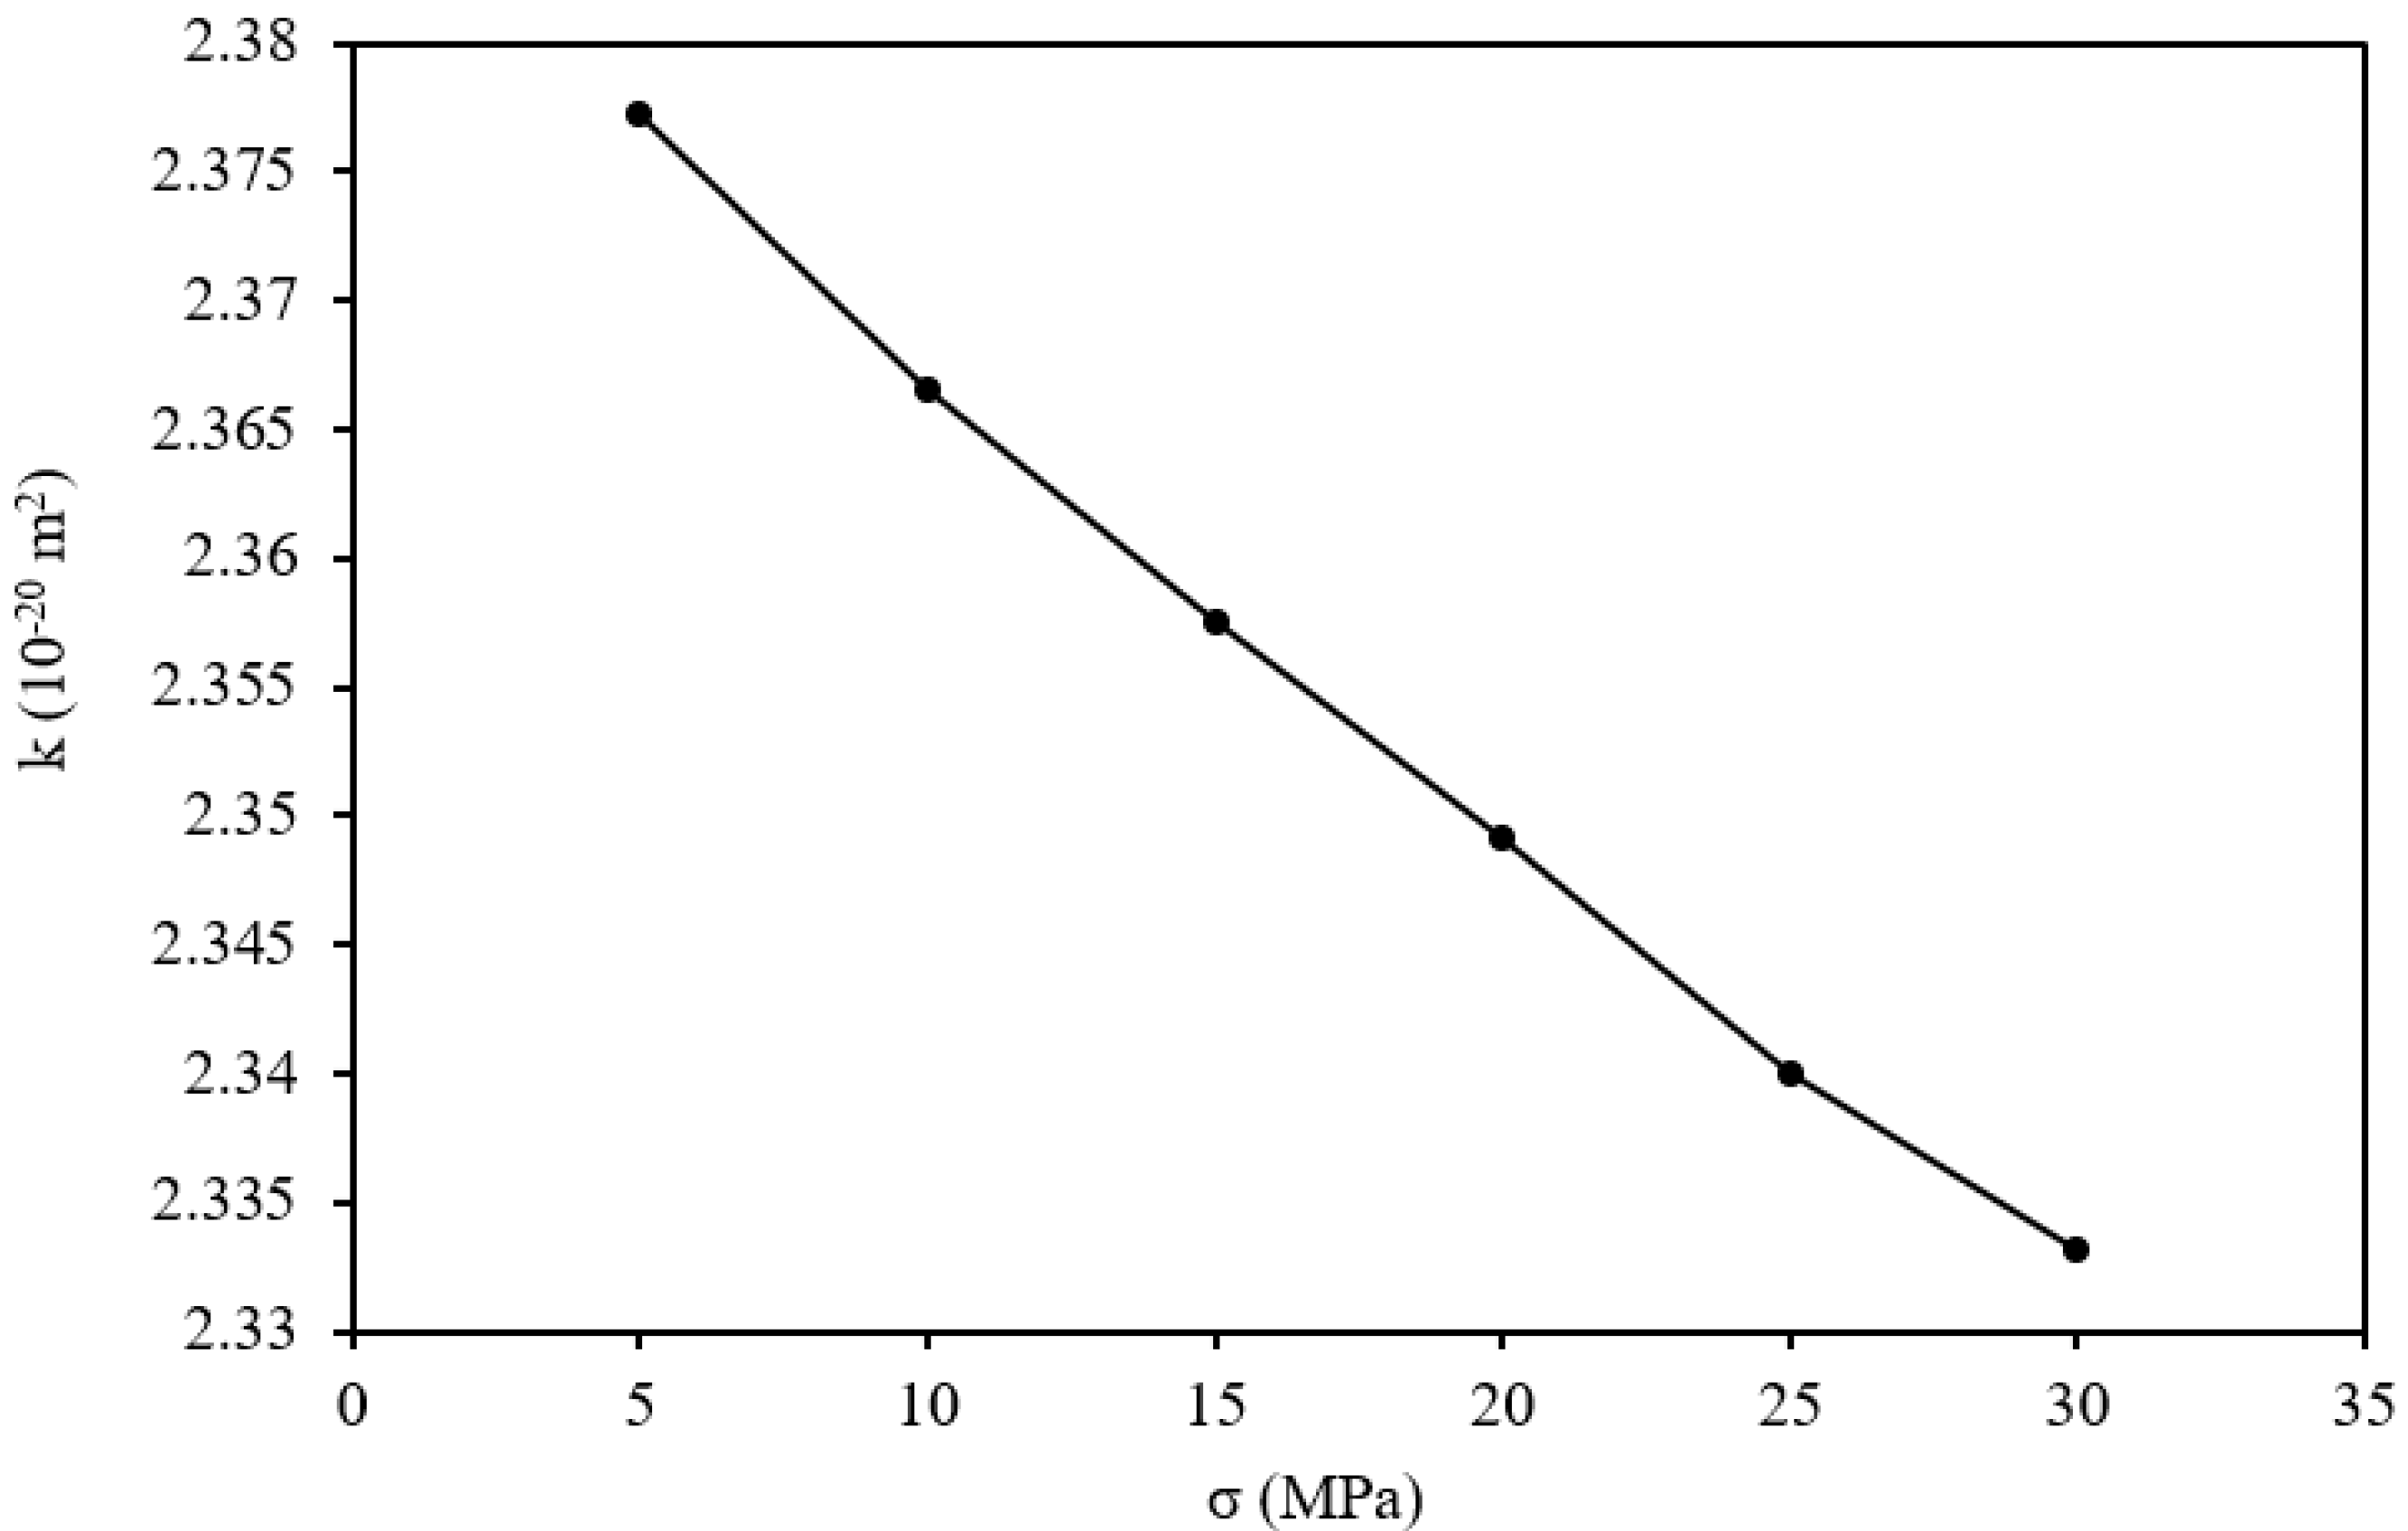
The observed variations in permeability (denoted as k) of the OPA sample as a function of stress loading (σ) are graphically represented in
Figure 6. A discernible trend emerges as stress loading increases: the matrix permeability exhibits a discernible, roughly linear decrease. Specifically, under a stress loading of 5 MPa, the permeability registers at 2.377 × 10
−20 m
2. With an increase in stress loading to 10 MPa, a marginal reduction in matrix permeability is observed, dropping to 2.367 × 10
−20 m
2, representing a decrease of 0.45%. As the stress loading escalates to 15 MPa, the matrix permeability undergoes further diminishment, measuring 2.357 × 10
−20 m
2, reflecting a reduction of 0.35%. This downward trend persists with stress loading increments to 20 MPa, 25 MPa, and 30 MPa, resulting in respective permeability decreases of 0.39%, 0.30%, and 0.35%.
Moreover, these results reveal a consequential relationship: the fluid’s capacity to pass through the matrix decreases with a decrease in permeability due to mineralogical alteration processes, such as the dissolution of carbonates (e.g., calcite) and the precipitation of secondary minerals, like clays or silicates, which can either open or clog pore spaces. These chemical changes, coupled with mechanical responses such as compaction, alter pore connectivity and throat size, ultimately reducing overall permeability [
31,
32]. These results demonstrate how stress alters the permeability of the matrix structure and how such changes affect the flow of fluids within the matrix. This information is essential for determining how well-sealing devices perform under various types of stress and is particularly useful for subsurface engineering projects, such as geological carbon storage.
4.4. Impact on Porosity
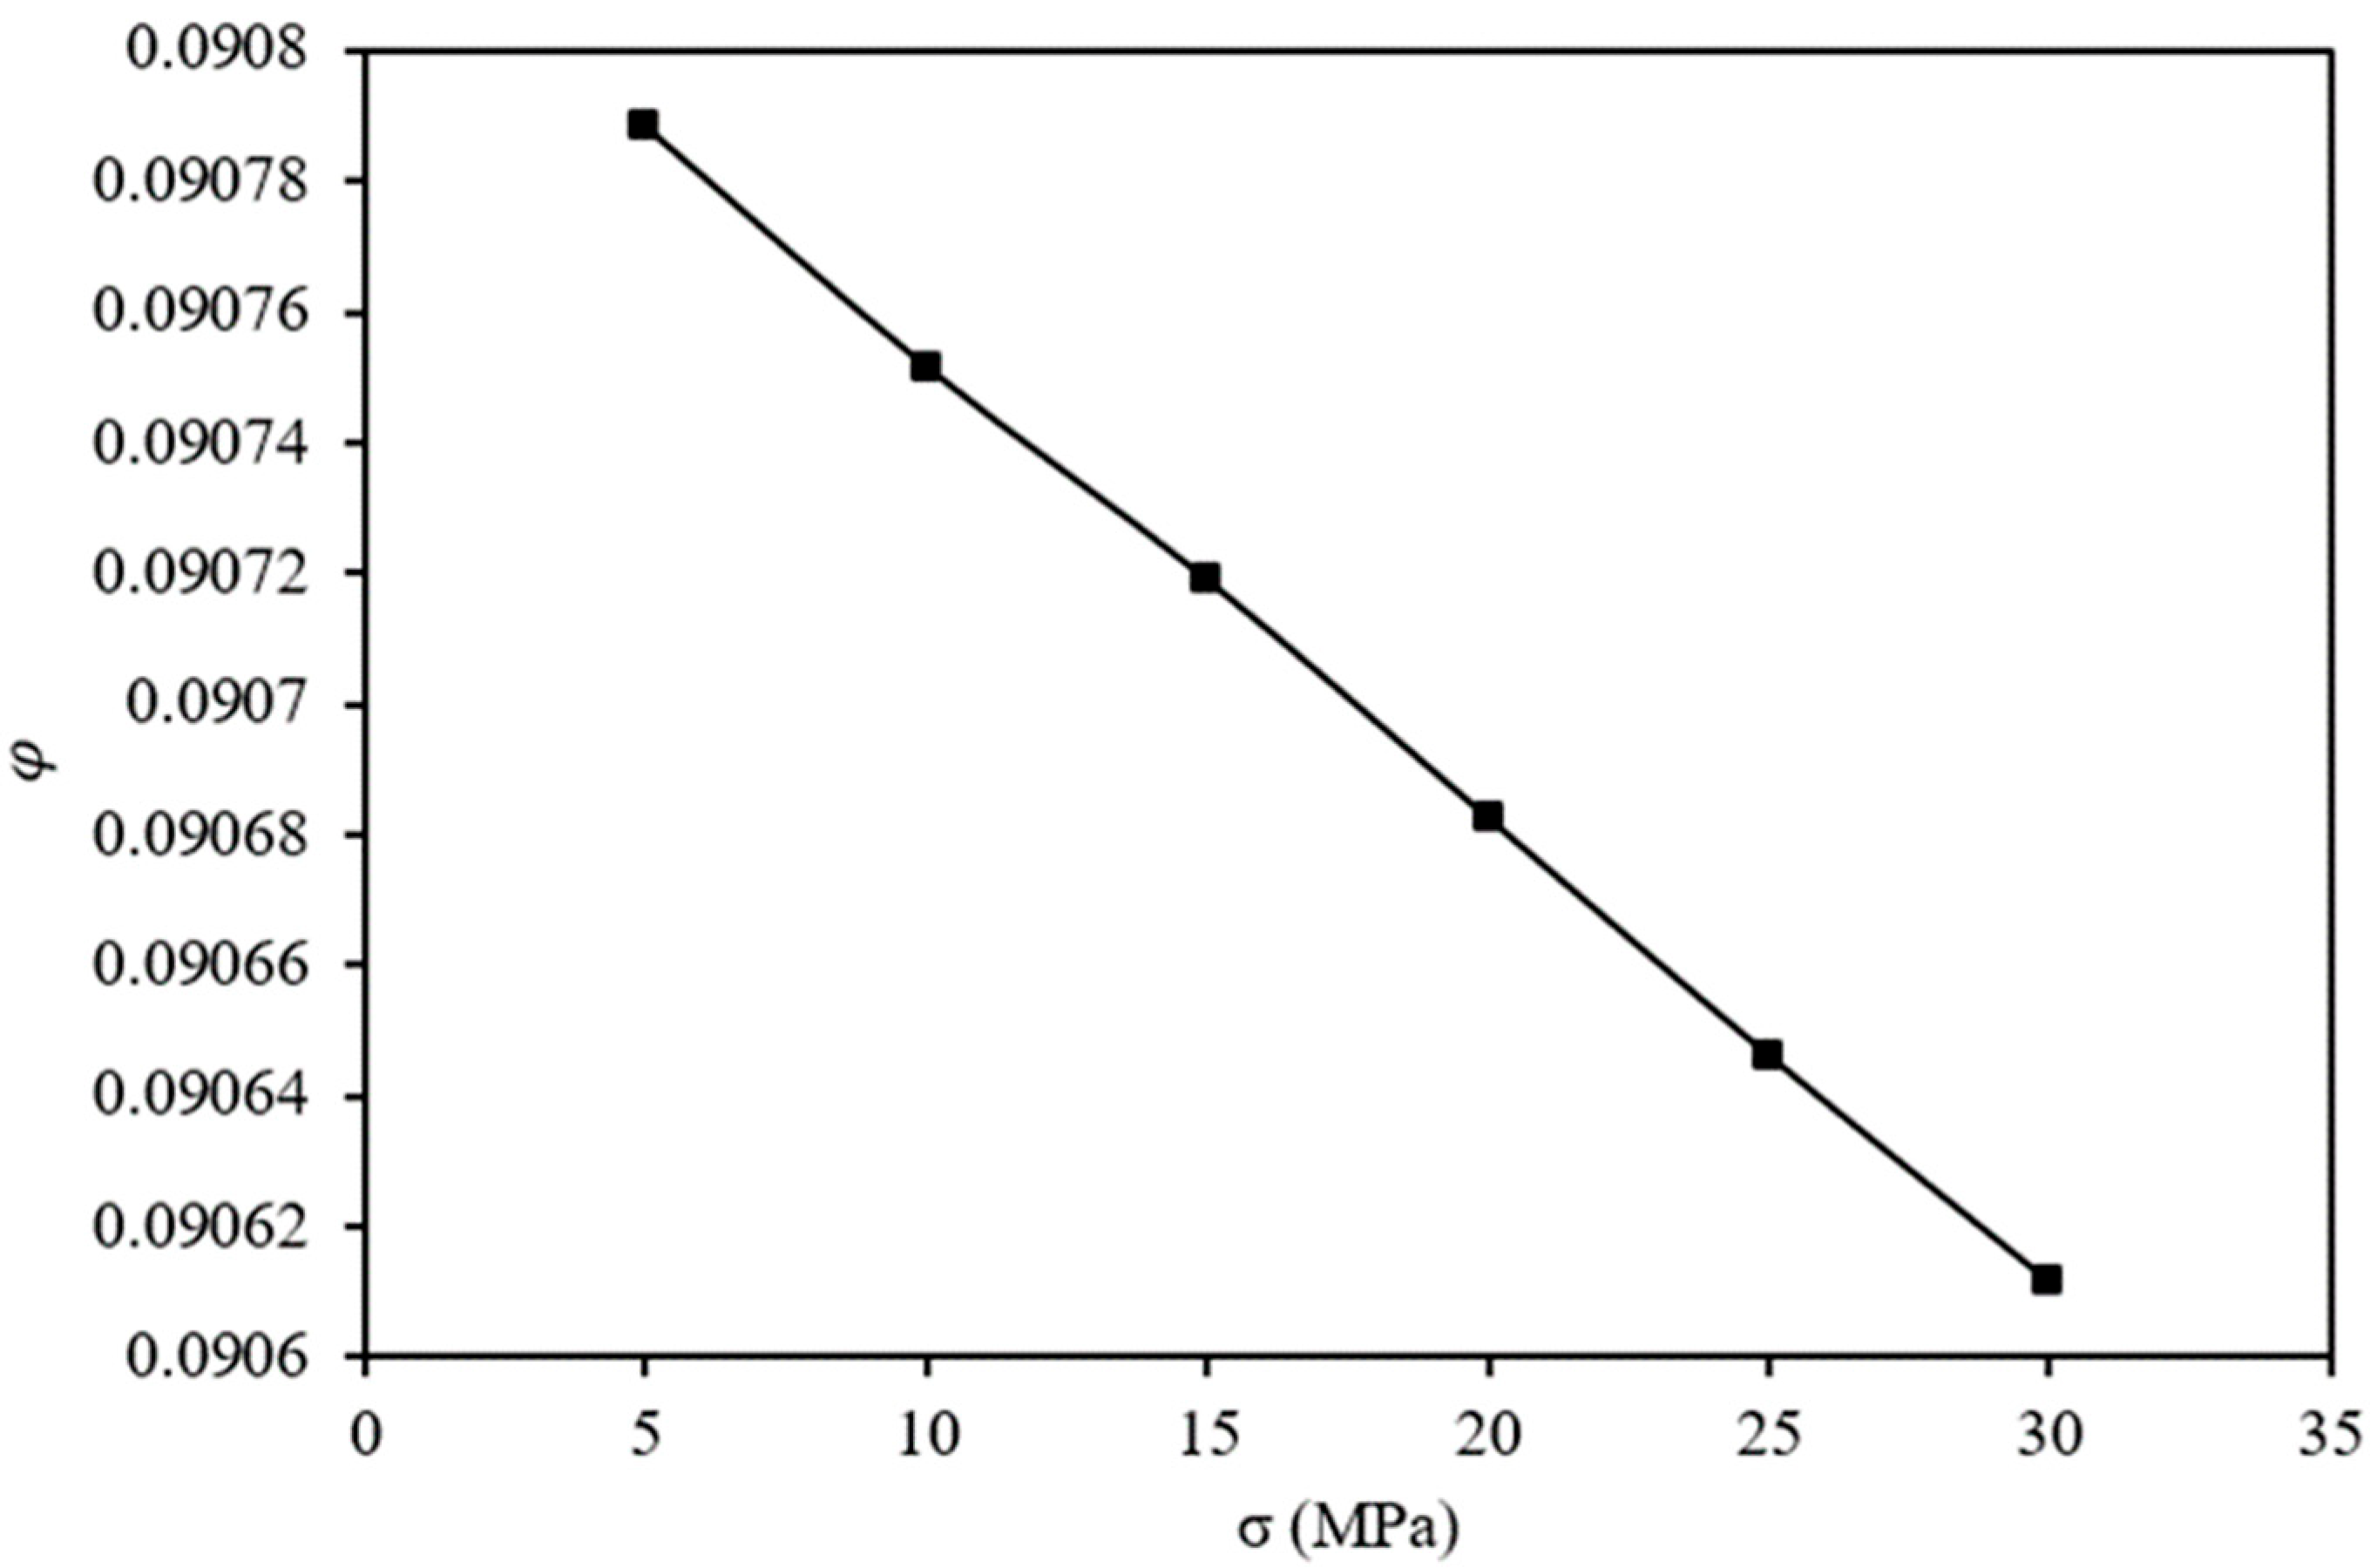
As depicted in
Figure 7, stress loading leads to a decrease in porosity. The reduction in porosity follows an approximately linear trend as the stress increases. Specifically, the initial porosity of the OPA reduces by 9.21%, 9.25%, 9.28%, 9.32%, 9.35%, and 9.39% under stress loadings of 5 MPa, 10 MPa, 15 MPa, 20 MPa, 25 MPa, and 30 MPa, respectively.
Stress modifies the porosity of a material, although these changes are not as significant as the changes in permeability that happen under the same loading conditions. Vairogs et al. [
33] and Jones and Owens [
34] have also reported similar findings in the literature. During the loading process, the volumes of pores and channels undergo reduction, significantly impacting permeability due to channel closure. However, porosity experiences less noticeable alteration since its primary component, pore volume, remains relatively unaffected. Consequently, the stress dependency of porosity is anticipated to be lower than that of permeability.


 ,
, 


