1. Introduction
GHG (Green House Gas) emissions from the combustion of hydrocarbon fuels are linked to climate change and threaten human health. The pollution of the air through global warming eventually becomes irreversible. However, lower emissions will be demanded to mitigate the marine industry’s transition to clean energy fuel. Most researchers’ vision for the new century is the option to use alternative fuel. Hydrogen is one of the clean energy fuels to replace hydrocarbon fuel, which is a promising energy to replace fossil energy and plays a significant role in future energy systems; the main reason is that the final product of hydrogen combustion is pure water.
This serious focus on the hydrogen research area is that the production of hydrogen is directly linked to hydrogen storage and safety factors. Moreover, Hydrogen is the energy carrier, and pure hydrogen gas is not a natural resource like natural gas and oil. Hydrogen can be produced from various sources, such as fossil fuels, biomass, water, etc. Also, efficient hydrogen production is still in the pipeline research area, such as hydrogen fuel cells, steam methane reforming, and membrane technology. The marine industry community still questions all these production methods linked to direct costs, practicalities, and development in good performance, durability, and manufacturing methods.
Classified Hydrogen is based on production methods, such as Grey Hydrogen, Blue Hydrogen, and Green Hydrogen. Grey Hydrogen is created from natural gas, or methane, using steam methane reformation but without capturing the greenhouse gases made in the process. Hydrogen production includes carbon capture and storage, called blue Hydrogen. Grey Hydrogen is essentially the same as blue Hydrogen but without carbon capture and storage. Another type of Hydrogen is Green Hydrogen, produced from a clean method such as water electrolysis cells.
Despite the growing number of renewable energy sources in the research area, hydrocarbon fuels are still the dominant source of energy usage. One of the Offshore Marine producers of hydrocarbon fuel is the LNG production platform of FLNG. The first step of the clean energy trial effort for FLNG is clean energy to use onboard power generation requirements. This clean energy mindset is vital to utilise hydrocarbon fuel most sustainably. This research paper aims to use the reforming method of Hydrogen production onboard FLNG from Natural Gas and BOG and clean hydrogen fuel for FLNG power generation.
Interestingly, methane can be obtained from natural gas and BOG onboard FLNG. Since the BOG handling system onboard FLNG is crucial, most of the excess BOG is burnt in the GCU (Gas Combustion Unit) without using it as an energy source. The reason for choosing Hydrogen as a clean energy fuel is production from Natural Gas and BOG fuel, which consists of methane with four hydrogen atoms and one carbon atom, as the higher H/C ratio contains more energy per mass.
The hydrogen production methodology will be the methane reforming process, which is most considerable for the high level of hydrogen production. The reforming method occurs when natural gas, together with either steam and/or oxygen, reacts by being transported over catalyst beds at high temperatures. Natural gas is mixed with either steam, oxygen, or both. This decides whether the process is a steam methane reforming (SMR) process, a partial oxidation (POX) process, or an autothermal reforming (ATR) process.
The difference between the SMR and ATR processes is how the heat is input to the system boundary. The SMR reforming process is an exothermic reaction that requires external combustion heat to supply the system; on the other hand, the ART reforming process is an endothermic reaction that requires internal combustion heat within the system boundary. Research analysis will briefly explain the beneficial techniques for hydrogen production, as well as the complex reforming process analyses to produce Hydrogen from natural gas and BOG.
This study uses Aspen HYSYS software as a simulation tool to achieve a comparable process model. For fair analysis, the process must follow the same defined specifications within the decided specifications, including the constraints and system boundaries for the model. All cases developed in this study must provide the methods for achieving the objectives.
2. Materials and Methods
The availability of Hydrogen on board an FLNG is to be considered based on the hydrogen production methods and the main source of gas supplied, such as NG, LNG, BOG, etc. This paper proposes hydrogen production through a steam reforming plant, using the excess BOG as raw material, thus avoiding it being burnt in the GCU. At present, LNG vessels and FLNG without reliquefaction plants consume the BOG (boil-off gas) in their engines, and the excess is burnt in the gas combustion unit without recovering any of its energy content. Excess BOG energy could be captured to produce Hydrogen, a fuel with high energy density and zero emissions, through the installation of a reforming plant.
Thus, to obtain greater versatility, the installation of a reforming plant will be energetically viable. To test the feasibility of the reforming plant, an actual study of the gas management process on the FLNG with a power production unit, along with a thermodynamic simulation of the reforming plant.
3. Overview of Hydrogen
Another marine fuel consideration is hydrogen for several maritime alternative fuels in the global marine market. Still, few hydrogen fuel usage vessels are in the marine industry due to two significant problems pending solutions: hydrogen storage and high production cost. Also, hydrogen-related ammonia corrosive action might significantly obstruct the complete application of hydrogen as a marine fuel in the future.
Hydrogen is not an energy source. It is an energy carrier. Hydrogen can be stored and delivered as usable energy. The usage of hydrogen as a marine fuel continues under intense research and development in many countries, particularly Japan and Korea. It is widely agreed that Hydrogen will be the future marine fuel if the researchers can resolve the problems related to the following factors:
cost-effective hydrogen production,
safe and compact storage on board,
reliability and operational safety for fuel.
3.1. Hydrogen Storage
The biggest obstacle facing the marine industry is onboard hydrogen storage technology since it takes up a lot of volume. Current hydrogen storage technologies include gaseous hydrogen storage, liquefied hydrogen storage, and metal hydride storage, among others.
The characteristics of gaseous hydrogen indicate that one gram occupies approximately 12 Lat atmospheric pressure. In its liquefied state, one gallon of gasoline weighs around 2.75 kg, while one gallon of hydrogen weighs approximately 0.00075 kg at 1 atm pressure and 0 °C. Hydrogen can be stored using two methods: as a pressurised gas or in a liquefied state.
Furthermore, the criteria influencing the selection of the optimal storage method depend on the appropriate quantity for the necessary duration, energy density, and expense. The three primary systems can be examined as liquid storage techniques for substantial hydrogen quantities, long-term storage solutions, and compressed storage methods for limited hydrogen amounts over brief durations.
The cryogenic liquefaction technique, which cools the hydrogen to cryogenic temperatures of −253 °C, turning it into a liquid for storage, is currently the best method of storing hydrogen for marine usage due to the high amounts of fuel needed for extended hydrogen storage. Upon liquefaction, hydrogen’s volume diminishes to 1/800th of its gaseous state. Liquefied hydrogen possesses a density of 70.1 kg/m3, which is significantly lower than that of conventional liquid fuels, which have densities ranging from 840 to 1010 kg/m3.
The techniques for hydrogen gas storage include compressing the gas at pressures between 350 bar and 700 bar and then transferring it into hydrogen tank systems, with storage capacity dependent on the density at the designated pressure. An increase in storage pressure will lead to higher operational costs. The concept of this paper using hydrogen fuel straight after reforming from BOG was developed to mitigate the financial impact on hydrogen storage.
3.2. Heat Value Analysis of Hydrogen
The heat value of hydrogen is the amount of heat released during hydrogen combustion and measured as a fuel’s energy density in energy (joules) per specified amount (e.g., kilograms). Compared to other fuels, hydrogen has the highest energy heat value content, MJ/kg, higher than the heat values of other fuels when combusted, as shown in
Table 1, and it produces only water with no carbon. This has a high potential to become the classified marine fuel with zero carbon emissions.
Hydrogen properties compared with other fuels as per
Table 1. That liquid hydrogen heating value is about 3.3 times higher than that of diesel fuel. However, hydrogen contains less energy per unit volume than all other fuels, requiring hydrogen consumption rates to be proportional with others. Same as for LNG and BOG, vapourisation will be high if there is not enough consumption rate onboard [
1,
2].
Table 1.
Comparison of the heat value of different fuels (Data Source from reference [
2]).
Table 1.
Comparison of the heat value of different fuels (Data Source from reference [
2]).
| Fuel Type | Heat Value |
|---|
| Hydrogen (H2) | 120–142 MJ/kg |
| Ammonia (NH3) | 22.5 MJ/kg |
| Methane (CH4) | 50–55 MJ/kg |
| Methanol (CH3OH) | 22.7 MJ/kg |
| Dimethyl ether—DME (CH3OCH3) | 29 MJ/kg |
| Petrol/gasoline | 44–46 MJ/kg |
| Diesel fuel | 42–46 MJ/kg |
| Crude oil | 42–47 MJ/kg |
| Liquefied petroleum gas (LPG) | 46–51 MJ/kg |
| Natural gas | 42–55 MJ/kg |
| Hard black coal (IEA definition) | >23.9 MJ/kg |
| Hard black coal (Australia and Canada) | c. 25 MJ/kg |
| Sub-bituminous coal (IEA definition) | 17.4–23.9 MJ/kg |
| Sub-bituminous coal (Australia and Canada) | c. 18 MJ/kg |
| Lignite/brown coal (IEA definition) | <17.4 MJ/kg |
| Lignite/brown coal (Australia, electricity) | c. 10 MJ/kg |
| Firewood (dry) | 16 MJ/kg |
| Natural uranium in LWR (normal reactor) | 500 GJ/kg |
| Natural uranium, in LWR with U and Pu, recycle | 650 GJ/kg |
| Natural uranium, in FNR | 28,000 GJ/kg |
| Uranium enriched to 3.5% in LWR | 3900 kg |
3.3. Comparison of Hydrogen Properties with Other Fuel
Furthermore, Hydrogen contains less energy per unit volume than all other fuels that require the hydrogen consumption rates to be proportional with others. Also, hydrogen evaporated vapour is the same as LNG carrier BOG, and vapourisation will be high if there is not enough consumption rate onboard. Hydrogen properties are compared with other fuels as per
Table 2.
4. Hydrogen Production
Hydrogen does not typically exist in nature and must be produced from compounds that contain it, such as Methane (Natural Gas), in a process that produces carbon dioxide and other greenhouse gases. Hydrogen Production is still carried out more in the R&D stage to generate Methods and technologies of hydrogen economically compared with conventional marine fuels. According to the report of Future Hydrogen, Hydrogen demand is increasing, and it is expected to be five times more by the end of 2030.
Methods for hydrogen production are continually evolving, including steam reforming (SR), coal gasification, auto-thermal reforming (ATR), dry reforming (DR), and partial oxidation (POX). Also, Hydrogen can be generated from water by electrical energy, with thermolysis and electrolysis serving as effective methods for hydrogen production. Among these technologies, steam reforming is the most extensively researched due to its better hydrogen production relative to alternatives such as ATR, POX, and DR [
3,
4].
Hydrogen has a very low energy density (per volume) because of its low density. When producing blue hydrogen (derived from fossil fuels and carbon capture and storage) and green hydrogen (derived from renewable energy sources) are referred to in the DNV-GL hydrogen Journal [
5].
Conclusion: As per the list below, many Hydrogen production methods are underway. Still, the production cost cannot be more economical since hydrogen fuel is not mass-production for marine vessels [
5,
6].
4.1. Hydrogen Production Method of Reforming from Hydrocarbon
Reforming the process of hydrogen production is the most interesting process in the marine industry, in which high-temperature steam (700 °C to 1000 °C) is used, referred to as “endothermic”, to produce hydrogen from methane, methanol, ethanol, propane, or gasoline. Also, research activities are being conducted on Autothermal Reforming (ATR) combined with Steam Reforming (SR), Partial Oxidation of Methane (POM), and Partial Oxidation (POX) processes. Oxygen from air or water is used to produce hydrogen, which releases heat as the process is “exothermic”. The total reaction to improving hydrogen yields adds one more process: water gas separation (WGS). Subsequently, in the “water-gas shift reaction”, the carbon monoxide and steam are reacted using a catalyst to produce carbon dioxide and more hydrogen. The exclusive feature of the reforming processes is still considering the possible configuration for different applications.
4.1.1. Steam Reforming Method (SMR)
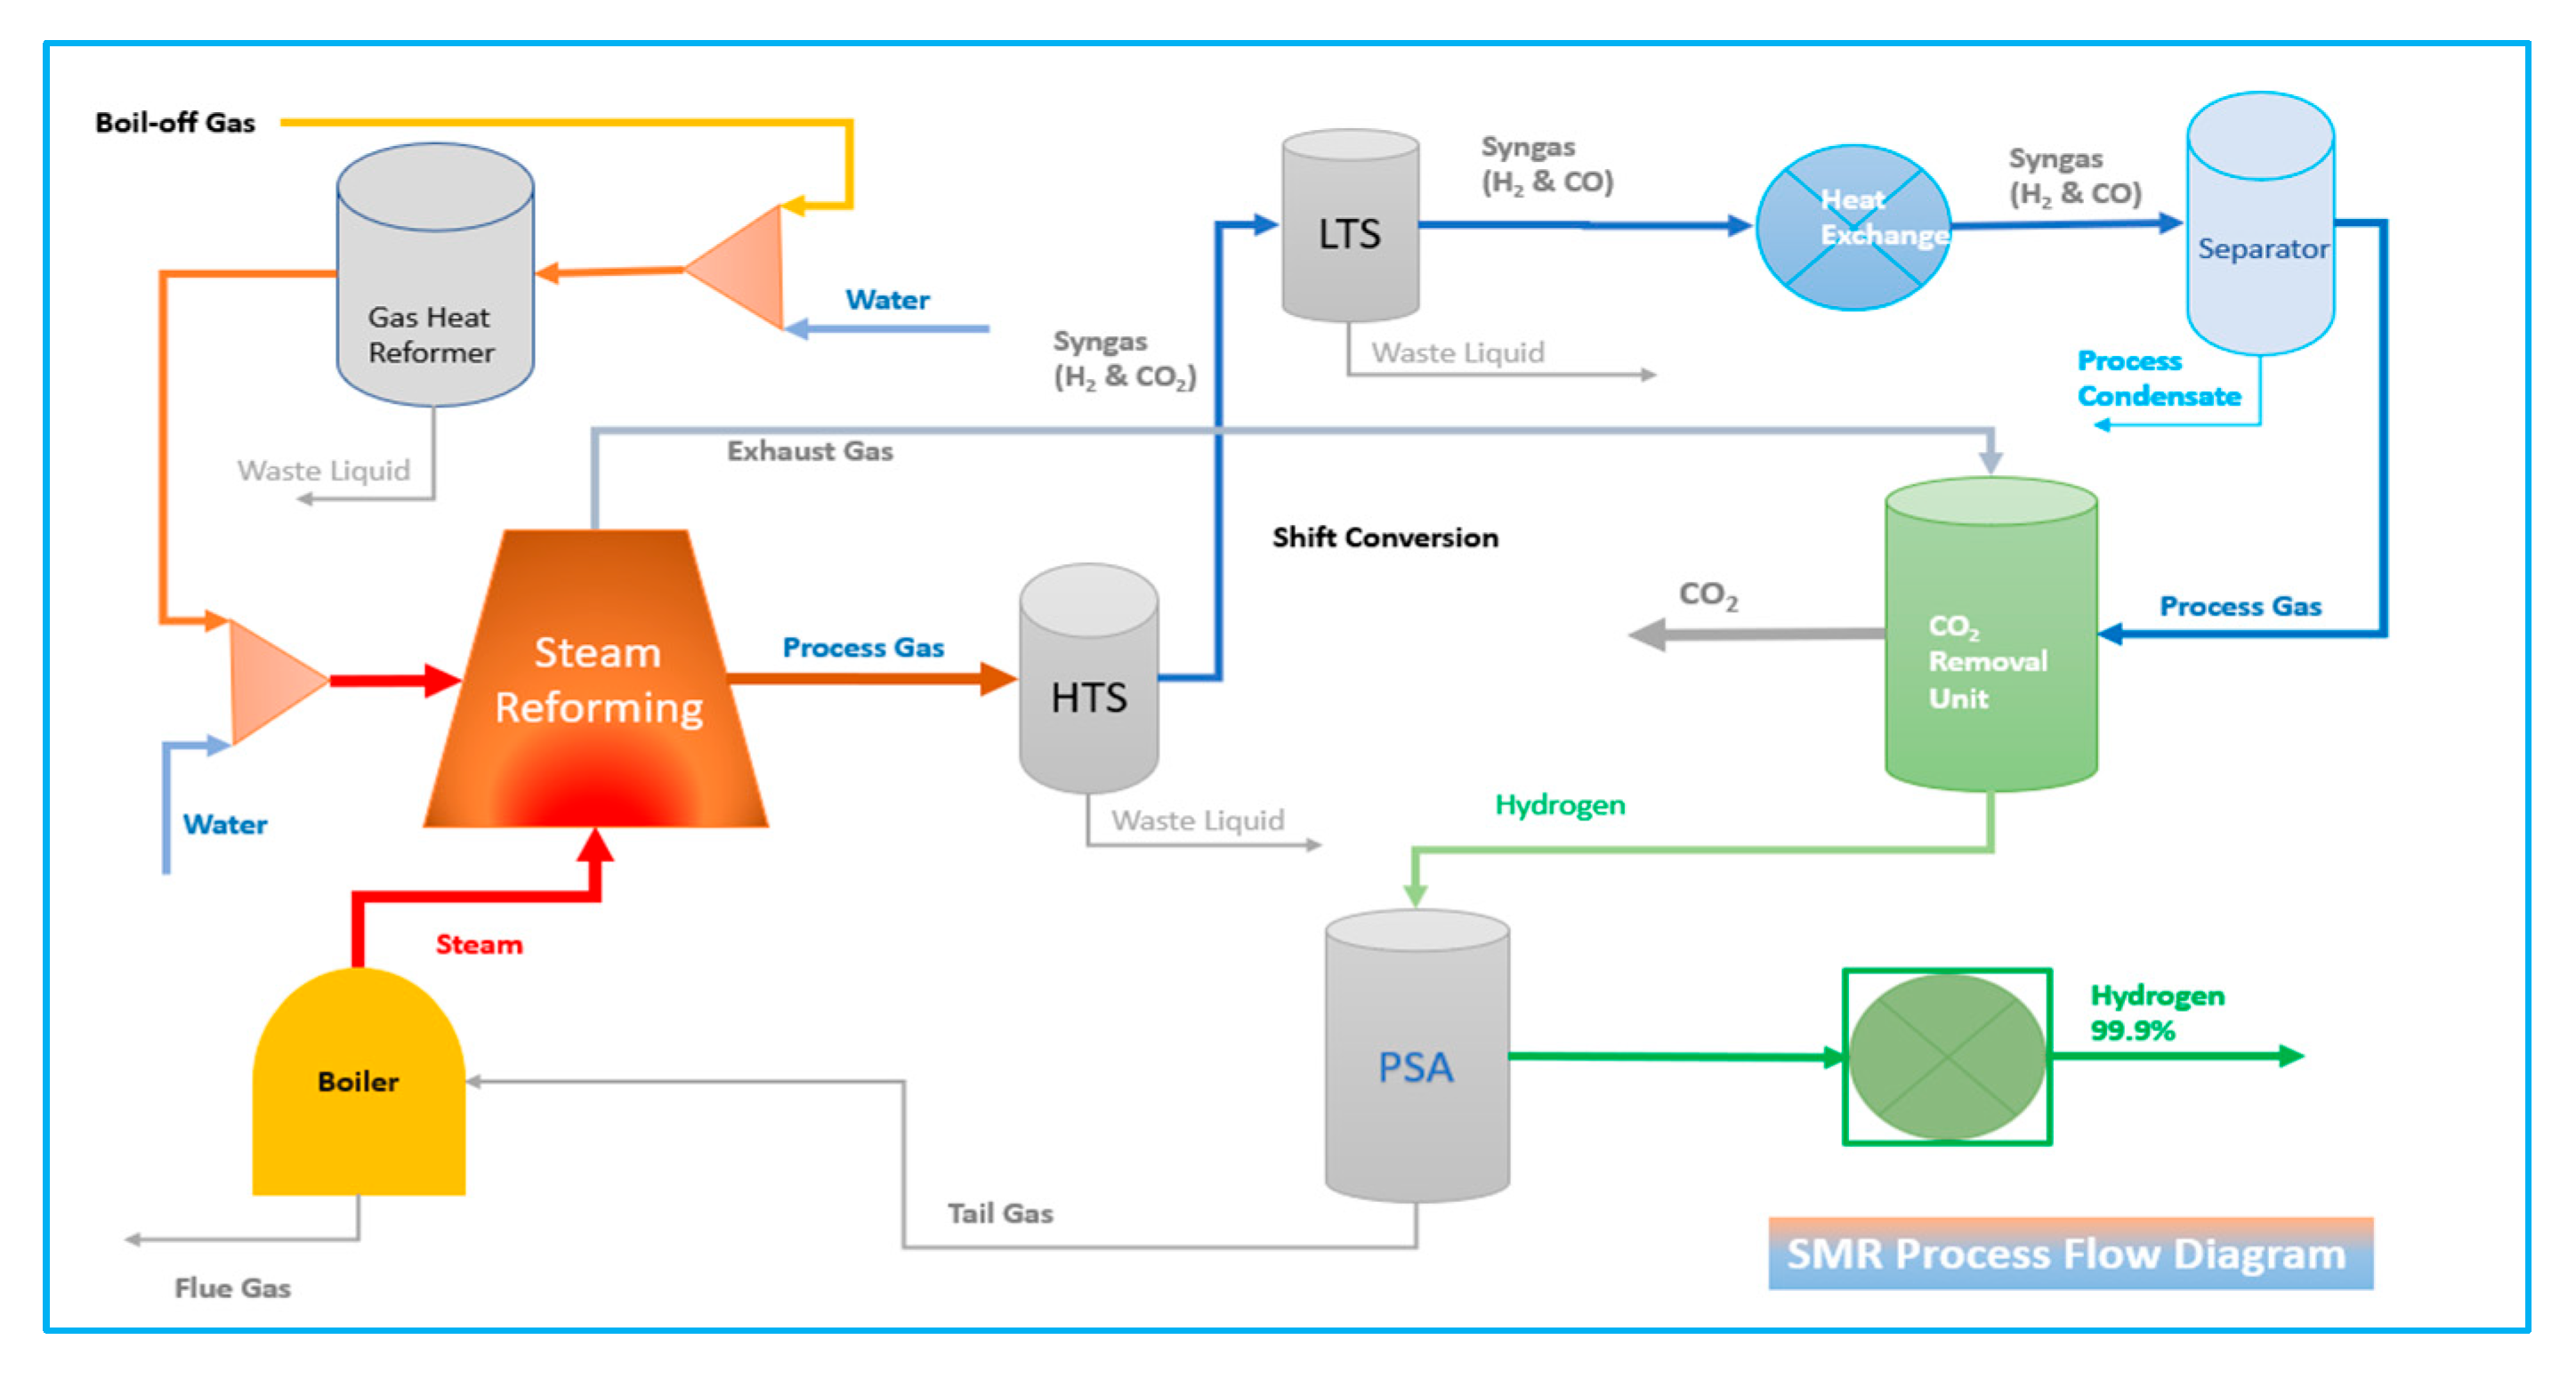
Steam methane reforming (SMR) method of hydrogen production from fossil fuel is one of the most exciting processes in the marine industry. Methane reaction is reacted with water vapour at temperatures (700–850 °C) in the presence of a supported nickel catalyst. In steam-methane reforming, methane interacts with steam at pressures of 25 bar in the presence of a catalyst, yielding hydrogen, carbon monoxide, and a small quantity of carbon dioxide. Steam reforming is an endothermic reaction. Heat must be provided to the process for the response to advance.
Figure 1 illustrates the fundamental process of steam reforming.
The reaction product equation of Reform 1 and Reform 2 as per below is syngas (a mixture of hydrogen and carbon monoxide by the Partial Oxidation of Methane (POM), which contains approximately 12% carbon monoxide, which can be converted to more hydrogen by the Water-Gas Shift (WGS) as equation Shift 1. In this step, carbon monoxide reacts with water vapour over a shift catalyst to produce.
In summary, the method is methane’s autothermal reforming, which combines the SMR process. In thermodynamic terms, endothermic is a process that requires or absorbs thermal energy from its surroundings and is usually in the form of heat with POM.
In thermodynamic terms, exothermic is a process or reaction that releases energy from the system to its surroundings, usually in the form of heat. The total reaction is exothermic; once more, WGS improves the hydrogen yields [
4].
The steam methane reforming reaction starts with a reformer where methane and larger amounts of hydrocarbons react with steam to produce carbon monoxide and hydrogen, as shown in the equation [
3,
4].
In the water-gas shift reaction, the carbon monoxide reacts with steam to generate carbon dioxide and hydrogen in the water-gas shift refers to Equation (4). This reaction is exothermic, meaning it releases heat.
4.1.2. Partial Oxidation (POX)
Partial oxidation can carry out the conversion of fuels to hydrogen. The partial oxidation method relies on the reaction of the fuel, such as methane, with air to produce carbon oxides and hydrogen with other compounds. Partial oxidation is an exothermic process of heat transfer. Typically, the process is much faster than steam reforming and requires a smaller reactor vessel. Subsequently, in a water-gas shift reaction, the carbon monoxide reacts with water to form carbon dioxide and hydrogen.
This hydrogen production technology closely resembles the SMR process, except for the beginning phase. The beginning stage involves the partial burning of methane using pure oxygen. The process produces carbon monoxide and hydrogen. This reaction is exothermic and is as follows.
Partial oxidation of methane reaction
Water-gas shift reaction: after partial combustion of methane in the above equation, the gas enters the water-gas shift step, where carbon monoxide reacts with steam and creates carbon dioxide and hydrogen as in Equation (6).
As seen in chemical reactions of partial oxidation, this process initially produces less hydrogen per unit of the input fuel than is obtained by steam reforming the same fuel.
4.1.3. Autothermal Reforming Process (ATR)
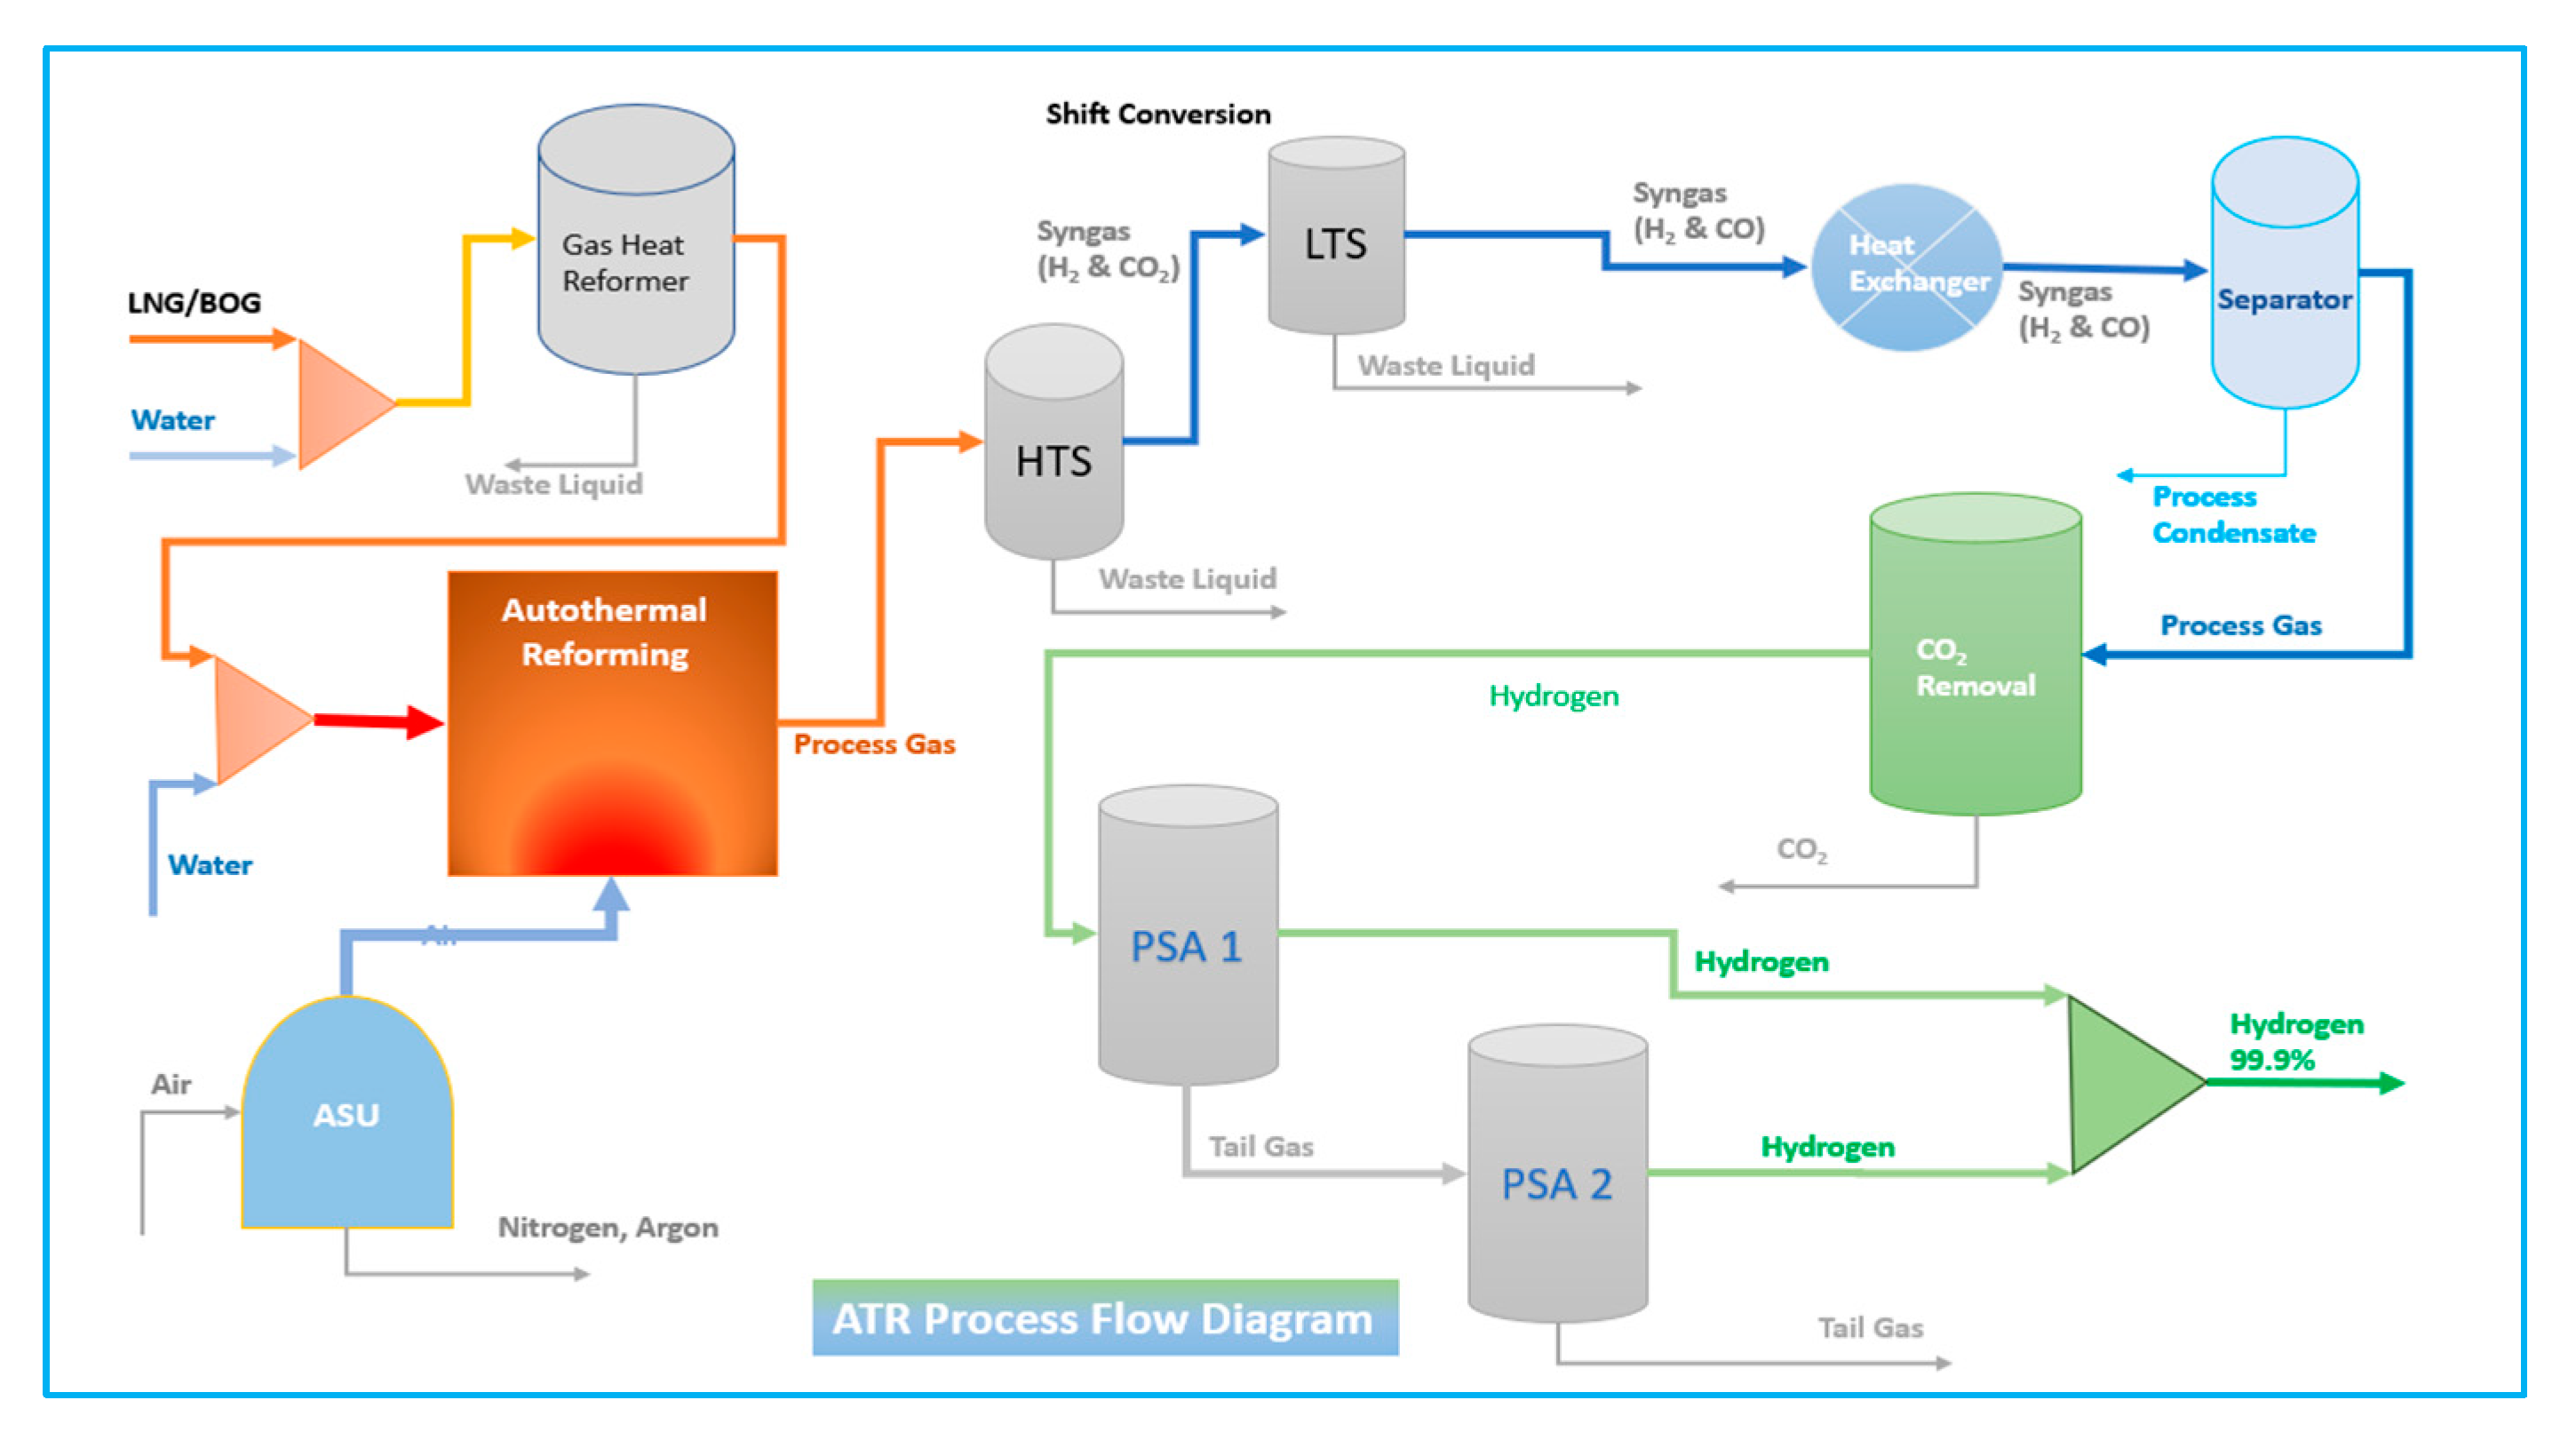
The autothermal reforming process is the process of merging the Steam Methane Reforming (SMR) and Partial Oxidation (POX) processes. The steps are equal to the SMR process after the reforming unit. The ATR process is the same reaction as the SMR process; hydrocarbon reacts with steam to provide the syngas composed of hydrogen, carbon monoxide, and carbon dioxide; after that part of the fuel reacts with oxygen as in Equation (7). The fundamentals of ATR are summarised in the given reaction equations.
The ATR process is one of the most cost-effective solutions to produce low-carbon hydrogen at scale if it can be combined with CO-Shift and carbon capture system technology. The Autothermal process flow is presented in
Figure 2 [
3].
4.2. Comparison of the SMR and ATR
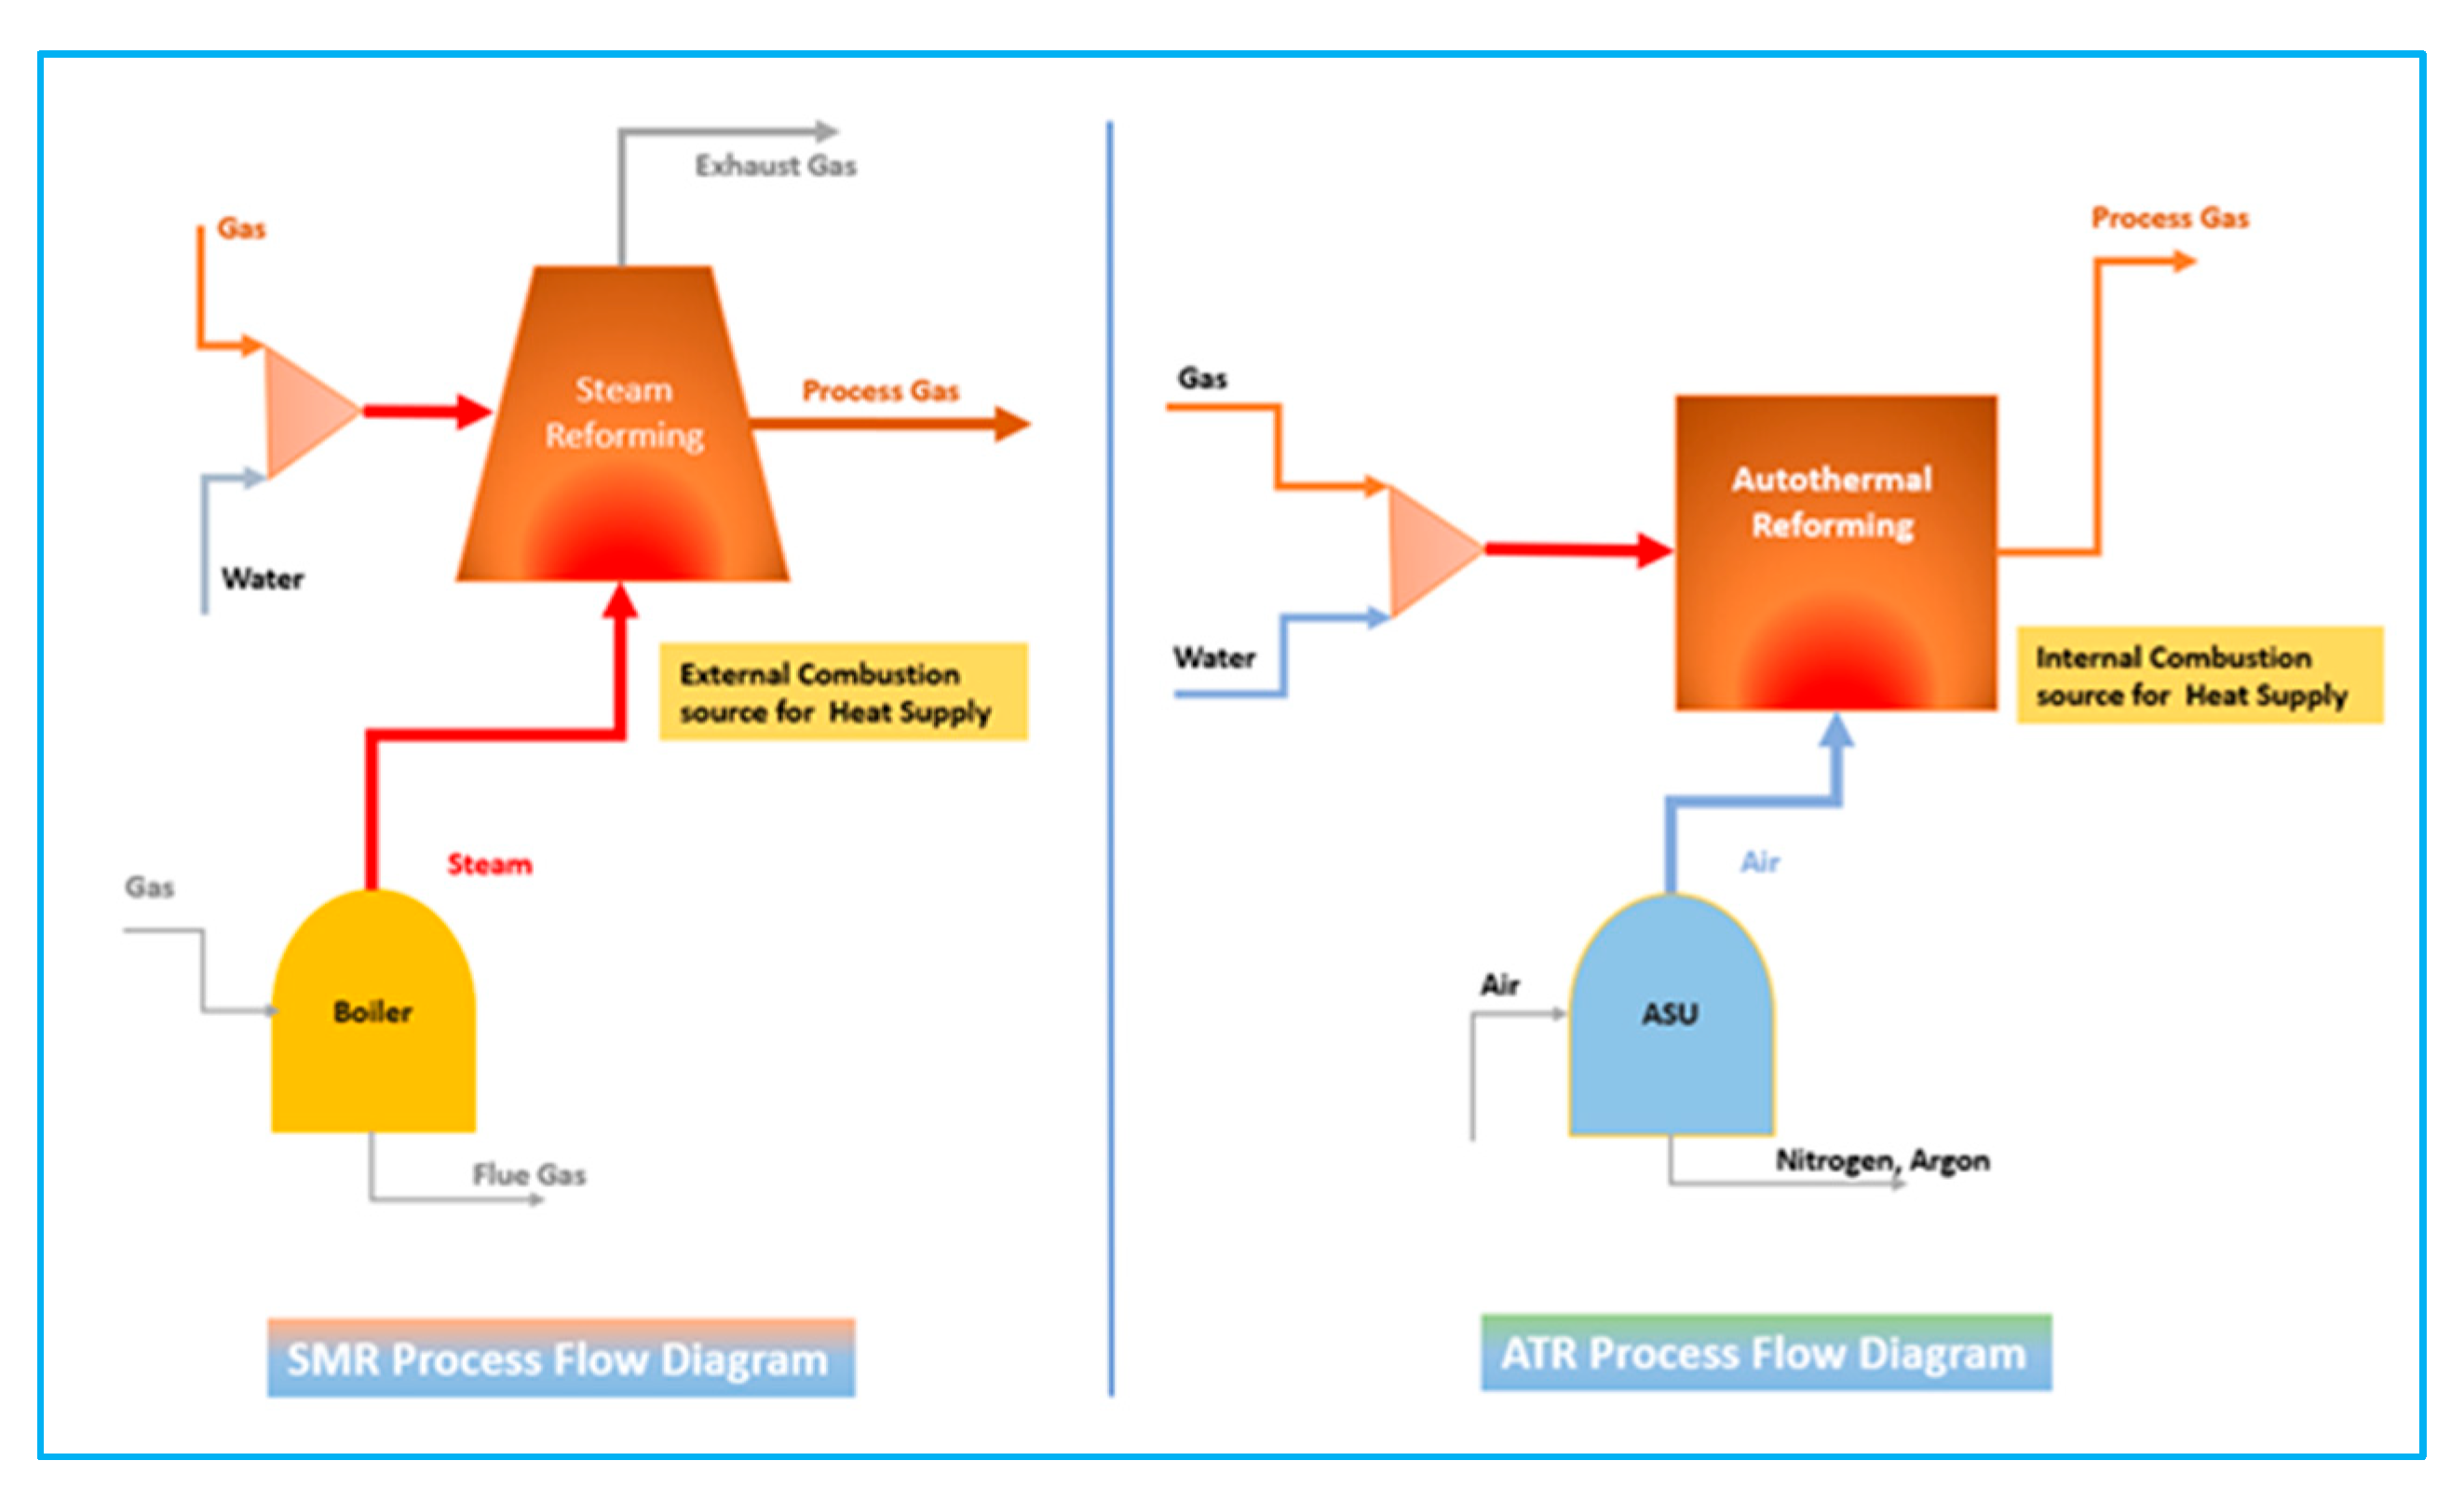
Providing the required thermal energy for steam methane reforming by combustion and oxidation in an ATR reformer is the main difference between an ATR process and an SMR process. According to the illustration in
Figure 3, Autothermal Reforming (ATR) and Steam Methane Reforming (SMR) differ significantly in their handling of carbon dioxide (CO
2) emissions due to their distinct reaction mechanisms. One key advantage of ATR is its reliance on internal combustion, which eliminates the formation of separate CO
2 streams. In ATR, the carbon monoxide (CO) and CO
2 generated during reforming remain within the gas stream process, allowing for efficient internal heat utilisation. As a result, CO
2 emissions are consolidated into a single removal point, simplifying carbon capture and making ATR a more efficient option for blue hydrogen production.
In contrast, SMR produces significant amounts of CO and CO2 at two distinct discharge points:
Primary CO2 generation occurs in the reforming reaction.
Additional CO
2 is released when CO undergoes further conversion in the water-gas shift (WGS) reaction. Furthermore, residual CO and CO
2 can be present in the exhaust gases following fuel combustion. Due to these multiple emission sources, SMR requires two separate CO
2 removal units to achieve blue hydrogen production, increasing process complexity and carbon capture costs. Compared to the heat utilised for the reforming process, the SMR reformer unit is more compact and simpler in design, which is more cost-effective than the ATR reformer process. In addition, the ATR reforming can take place at increased pressure levels compared to the SMR process [
7,
8].
Since ATR consolidates CO2 into a single stream, its carbon capture efficiency is inherently higher compared to SMR, which requires dual capture systems. This makes ATR a preferred choice for FPSO hydrogen production with carbon capture, particularly in scenarios where low-emission hydrogen is prioritised.
However, the ATR process is a very interesting process for hydrogen production, and it is not a focused process in this paper. Future research papers will discuss more immature technologies available for Hydrogen through an ATR process.
4.3. Comparison of Hydrogen Production Cost
The cost of hydrogen production will vary depending on Blue Hydrogen or Green Hydrogen, also depending on the region. However, average costs derived from each hydrogen production method, whether based on renewable or fossil fuel, variables such as energy source, feedstock and capital investment cost, and hydrogen production cost (per kg of hydrogen) have been shown in
Table 3.
5. Theory and Equations
5.1. Steam to Carbon (S/C) Ratio
The steam to carbon (S/C) ratio is often used for evaluating steam reforming in both steam methane reforming (SMR) and autothermal reforming (ATR) processes for enhancing the system. The S/C ratio is calculated by the ratio of the moles of steam to carbon at the system’s inlet to determine the necessary steam supply to the reformer. A decreased S/C ratio will lead to the formation of coke slugs; hence, the addition of steam is essential for preventing the thermal cracking of hydrocarbons.
Generally, an excess of steam will be used beyond the stoichiometric ratio. The quantity of residual methane at a specific reformer outlet temperature decreases as the steam-to-carbon ratio increases. Therefore, reduced fuel energy is required in the furnace. Although it can range from 1.0 to 5.0, the optimum steam-to-carbon ratio frequently falls within 2~3. To prevent the formation of carbon and coke deposits, the ratio must be sustained at 2.5 or above.
5.2. Thermodynamic Properties
Thermodynamic analysis of the hydrogen production process is based on energy and exergy analyses.
5.2.1. Energy Analysis
To assess the operation of the process, heat efficiency calculation is one of the concepts for thermodynamic analysis. Thermal efficiency is the output energy divided by input energy.
where
mx is the mass flow, and
LHVx is the low heat value for a specified input, respectively.
The thermal efficiency is the ratio of the energy in the hydrogen product and feed natural gas. From there can be calculated the energy efficiency of the process as the ratio of product energy to the process energy consumption, which is the sum of feed gas energy and net power consumption
Wnet. The calculation of net power does not include the power consumption of the CCS process.
5.2.2. Exergy Analysis
Exergy measures the greatest possible work obtainable from a process, determined by the stream’s enthalpy and entropy in relation to the environment under steady-state thermodynamic circumstances. In order to determine which system has the best energetic efficiency, the exergy analysis of the steam reforming process for converting natural gas into hydrogen has been carried out for both the SMR and ATR systems as per the exergy equations below.
The exergy of the process calculation can be carried out through the equation of state.
where T
0 and P
0 are in ambient condition, and e is exergy. Here, h and s are the enthalpy and entropy of the stream at the actual temperature T and pressure p, while h
0 and s
0 are the same properties at the environmental conditions T
0 and P
0.
Total exergy is the sum of Physical exergy and Chemical exergy
The total sum of the expression of exergy for the process calculation is the following equation:
where e represents the total molar exergy of a stream,
is the molar physical exergy, which is thermomechanical properties,
is the molar chemical exergy and
is the molar mixture exergy.
5.2.3. Exergy Destruction
The first and second laws of thermodynamics state that irreversibility in the process system that accompanies energy transfer is the cause of exergy destruction.
Exergy destruction is present in an irreversible process and is absent in a reversible process. The variation in the exergy of a system can either be positive, negative, or zero. When the temperature of the heat transfer process is lower than that of the environment, the transmission of heat and exergy occurs in opposite directions.
Furthermore, work and the associated exergy transfer may occur in the same direction or opposing directions. The exergy of an isolated system diminishes continually during an irreversible process and remains constant solely during a reversible process.
In an isolated system, there is no exergy transfer between the system and its surroundings; hence, the changes in exergy are equivalent to the exergy destroyed.
The process is irreversible, and the actual work required exceeds that of an ideal scenario. The second law of thermodynamics defines actual work as the sum of work loss and change in exergy.
In thermodynamic terms, exothermic is a process or reaction that releases energy from the system to its surroundings, usually in the form of heat. The total reaction is exothermic; once more, WGS improves the hydrogen yields.
Exergy efficiency can be calculated as the relation between the exergy change of natural gas to be liquefied and the power consumption [
10,
11,
12].
5.2.4. Carbon Capture System (CCS)
To obtain the blue hydrogen, the CO
2 produced during the reforming process needs to be captured by the amine medium. The SMR process used the MEA (Amine), and the ATR process used the DEPG (Dimethyl Ethers of Polyethylene Glycol) to remove CO
2 from the product stream, as shown in the flow sheet. Hydrogen product enters the bottom of the absorber, contacts with lean amine solvent from the top counter-current direction, and rich amine flows out from the bottom of the absorber. The technology is currently owned and licensed by Dow, with commercial packages available from a variety of companies, including UOP, Udhe, and Coastal [
13].
5.3. Other Variables
5.3.1. Product Yields
The chemical equilibrium analysis of the methane reforming reaction is analysed to predict the product yields during the reaction. The chemical equilibrium of reactions can be calculated by the CEA Program, which calculates the product concentrations from any set of reactants based on the minimisation of Gibbs free energy and the equation as below [
14]
where
i is the product, and
j is the feed gas;
n is the total moles of species.
The product yields of carbon monoxide, carbon dioxide, and hydrogen as per the equation
5.3.2. Sensitivity Analysis
Sensitivity analysis is a useful tool for optimising reforming processes. Sensitivity analysis evaluates how various models respond to alterations in the initial conditions. It provides a thorough rundown on maximising hydrogen production while reducing carbon emissions. It is also challenging to estimate the accurate circumstances for every variable. One variable is evaluated whilst all other variables are held constant to facilitate fair testing.
The sensitivity analysis for the molar flow rate equation is
where
S is sensitivity analysis,
i is product species, and
j will be CH, H
2O, CO, CO
2, O
2.
Hydrogen Purity and Methane Conversion.
The effect of the operating conditions can be analysed with the proportional examination of hydrogen purity and methane conversion efficiency in the steam reformer.
where
n is the total moles of species.
6. Simulation Analysis of Hydrogen Production
6.1. Model and Simulation
The previous conference article addresses the reforming of SMR and ATR for hydrogen production methodologies and modelling, exploring strategies to utilise the reforming process for on-board hydrogen generation from natural gas and boil-off gas (BOG). BOG is vapourised gas generated from the LNG tank. Hydrocarbons are primarily used as fuel for floating liquefied natural gas power generation. Methane can be derived from natural gas and boil-off gas (BOG) in floating liquefied natural gas (FLNG) facilities. Most excess boil-off gas (BOG) is burnt rather than used as an energy source since onboard gas management is crucial. The main explanation for selecting hydrogen is how it functions as an energy carrier. It comprises atoms with a high hydrogen-to-carbon ratio, revealing elevated energy per unit mass [
15].
The chemical process software Aspen HYSYS (version 11) is used for hydrogen production systems. HYSYS software specialises in hydrocarbon processing, and it is a comprehensive tool enabling the design and optimisation of steady-state processes. The fluid package Peng-Robinson (PR) is chosen as the equation of state [
15].
The Boil-off Gas Reforming Systems Research Model will be based on similar chemical and mechanical processes of steam reforming methods. However, the research consideration will be more from the thermodynamic point of view. However, from an economic point of view, steam reforming is still a high cost due to removing carbon dioxide. To overcome this problem, one of the research options will be exergy analyses to obtain better results of thermodynamic efficiency within the steam methane reforming method. Exergy is measured for the environment to develop to improve the energy conversion system.
The key influencing factors in the reforming process are the Steam-to-Carbon ratio (S/C ratio) and the Oxygen-to-Carbon ratio. Excessive oxygen intake in the SMR and ATR processes will result in decreased hydrogen generation and increased heating. The research model will focus on two methods: ATR and SMR reforming processes. This study uses control methodology to investigate two important processes and identify the best controllable variables for optimising hydrogen generation while minimising carbon emissions. The simulation includes multiple steps of heating and cooling to attain certain feed gas temperature ranges, which can be managed by the reforming equipment such as a pre-reformer, heater, absorber, and stabiliser in conjunction with MEAmine and DEPG.
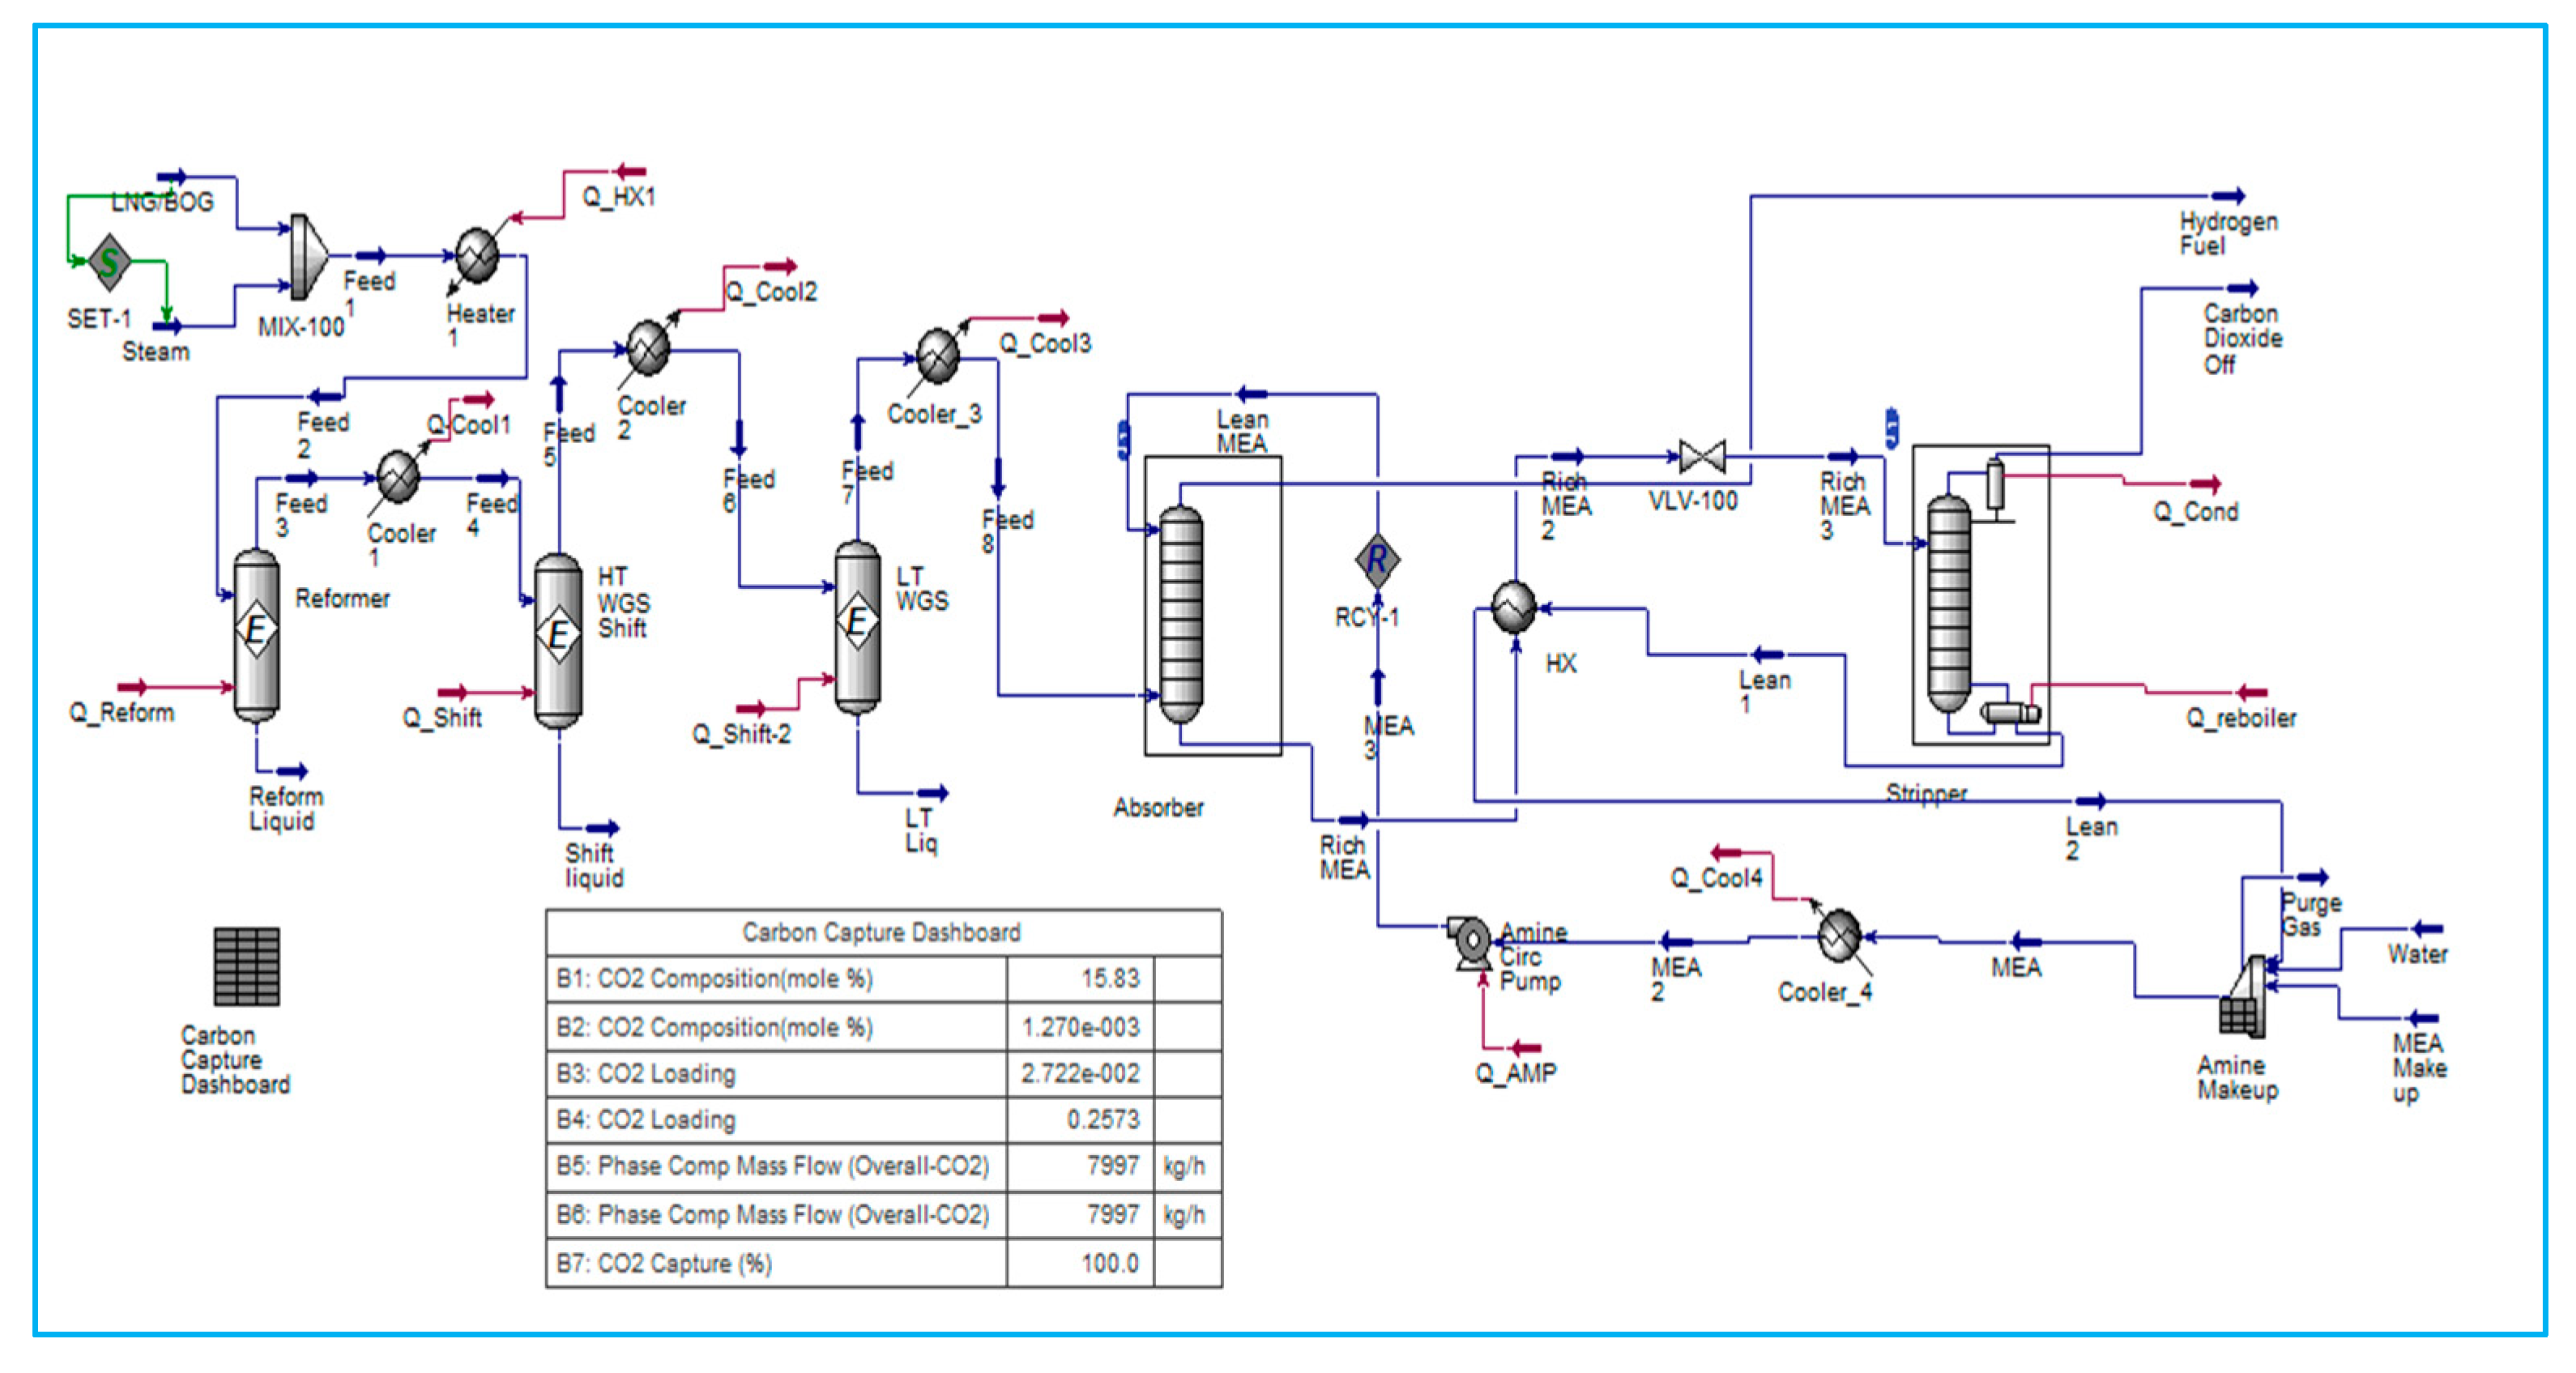
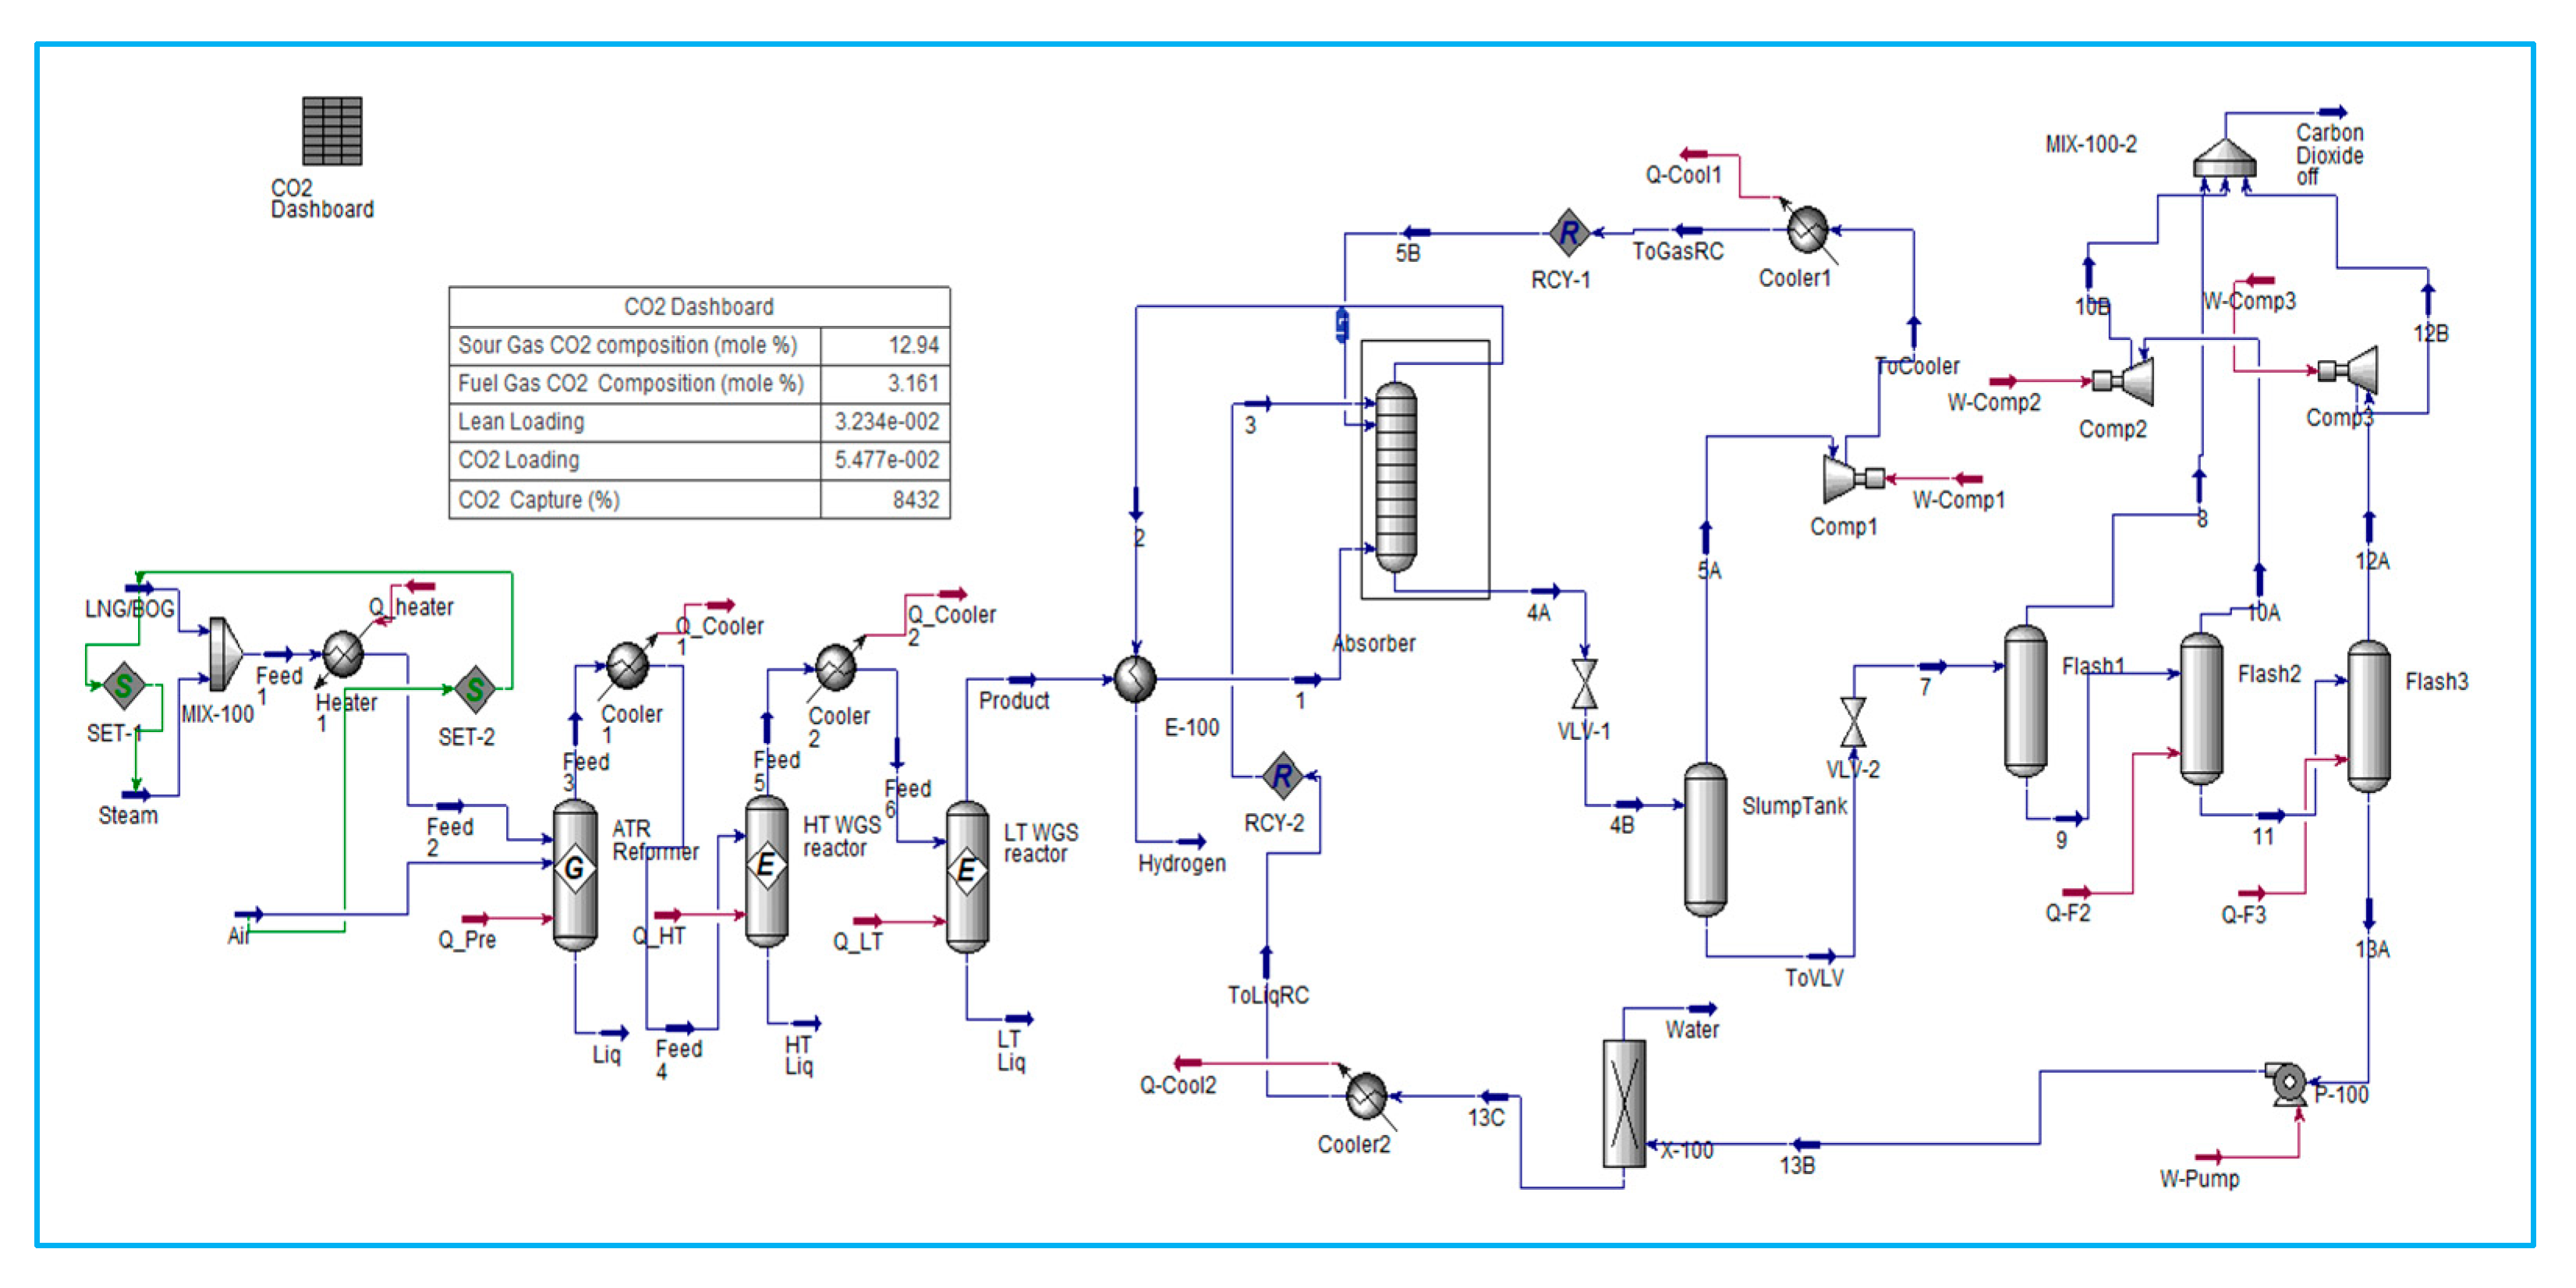
6.2. SMR Process Integrated with Amine Carbon Capture System
The strategies under consideration involve the conversion of natural gas into hydrogen via the SMR process, followed by CO
2 capture following treatment in both HT WGS (High-Temperature Water Gas Shift) and LT WGS (Low-Temperature Water Gas Shift) reactors. The capture of CO
2 is an important step in the production of blue hydrogen from hydrocarbons. Monoethanolamine (MEA) Amine absorption/stripping techniques have been utilised to remove CO
2.
Figure 4 shows a carbon dioxide (CO
2) capture system located downstream of the conversion of fossil fuels to hydrogen.
MEA CCS techniques consist of two columns. Carbon dioxide (CO2) is absorbed in the first column, known as the absorber, by a solution of low-concentration amine solvent via fast chemical reactions. The end-product solution, known as rich amine, is then transferred to the second column, also known as the stripper, which removes the CO2 component. The stripping requires a significant amount of energy, which is supplied by transferring heat from a recuperative heat exchanger via the crossflow of rich and lean amines. This energy conservation accounts for 15–30% of the total electricity produced by the facility. Power challenge is necessary for properly operating this operation on board the FLNG and maximising energy savings.
The power issue is critical for properly running this process on board the FLNG and maximising energy savings in a cost-effective manner. As a result, the primary purpose of this thesis is to develop a basic control system capable of efficiently handling on-board operations and running the process as close to optimal as possible. This study focused on the dynamic modelling of the stripper and tested two different configurations to improve energy efficiency on board FLNG with a high electrical requirement.
The authors created a dynamic model, particularly for the absorber, and investigated the effects of a load change in power generation from 100% to 50%. An integrated system for hydrogen production with carbon capture and storage (CCS) that includes a stripper and recycling process. The paper investigated how adjusting the proportion of CO
2 removal and amine concentration (MEA) affects process efficiency and CO
2 capture efficiency. Furthermore, the repercussions of lowering the capacity for hydrogen production have been explored [
15].
6.3. ATR Process with Carbon Capture System
Compared to SMR, the ATR is a system that diminishes size and complexity. The absence of an external heat source will lower fuel costs for the reformer and lead to a reduction in CO2 emissions. Another advantage is that the ATR necessitates less water than an SMR, resulting in enhanced methane conversion.
Oxygen aids in diminishing soot production. Nevertheless, the temperature is limited by material and construction costs. It is also assumed that there is no heat loss in the system and the compressor’s adiabatic efficiency is 75%. ATR reactors are represented as Gibbs reactors that minimise Gibbs free energy to predict reaction feasibility and design chemical processes in evaluating energy efficiency and irreversibility; refer to
Appendix A. This model, constructed as a component splitter, is additionally employed for modelling water separation and hydrogen generation refinement to illustrate the possibility of diverse separation processes. The CCS method employed DEPG and utilised separators to facilitate the straightforward extraction of CO
2, referring to
Figure 5 [
15].
6.4. Simulation Result Analysis
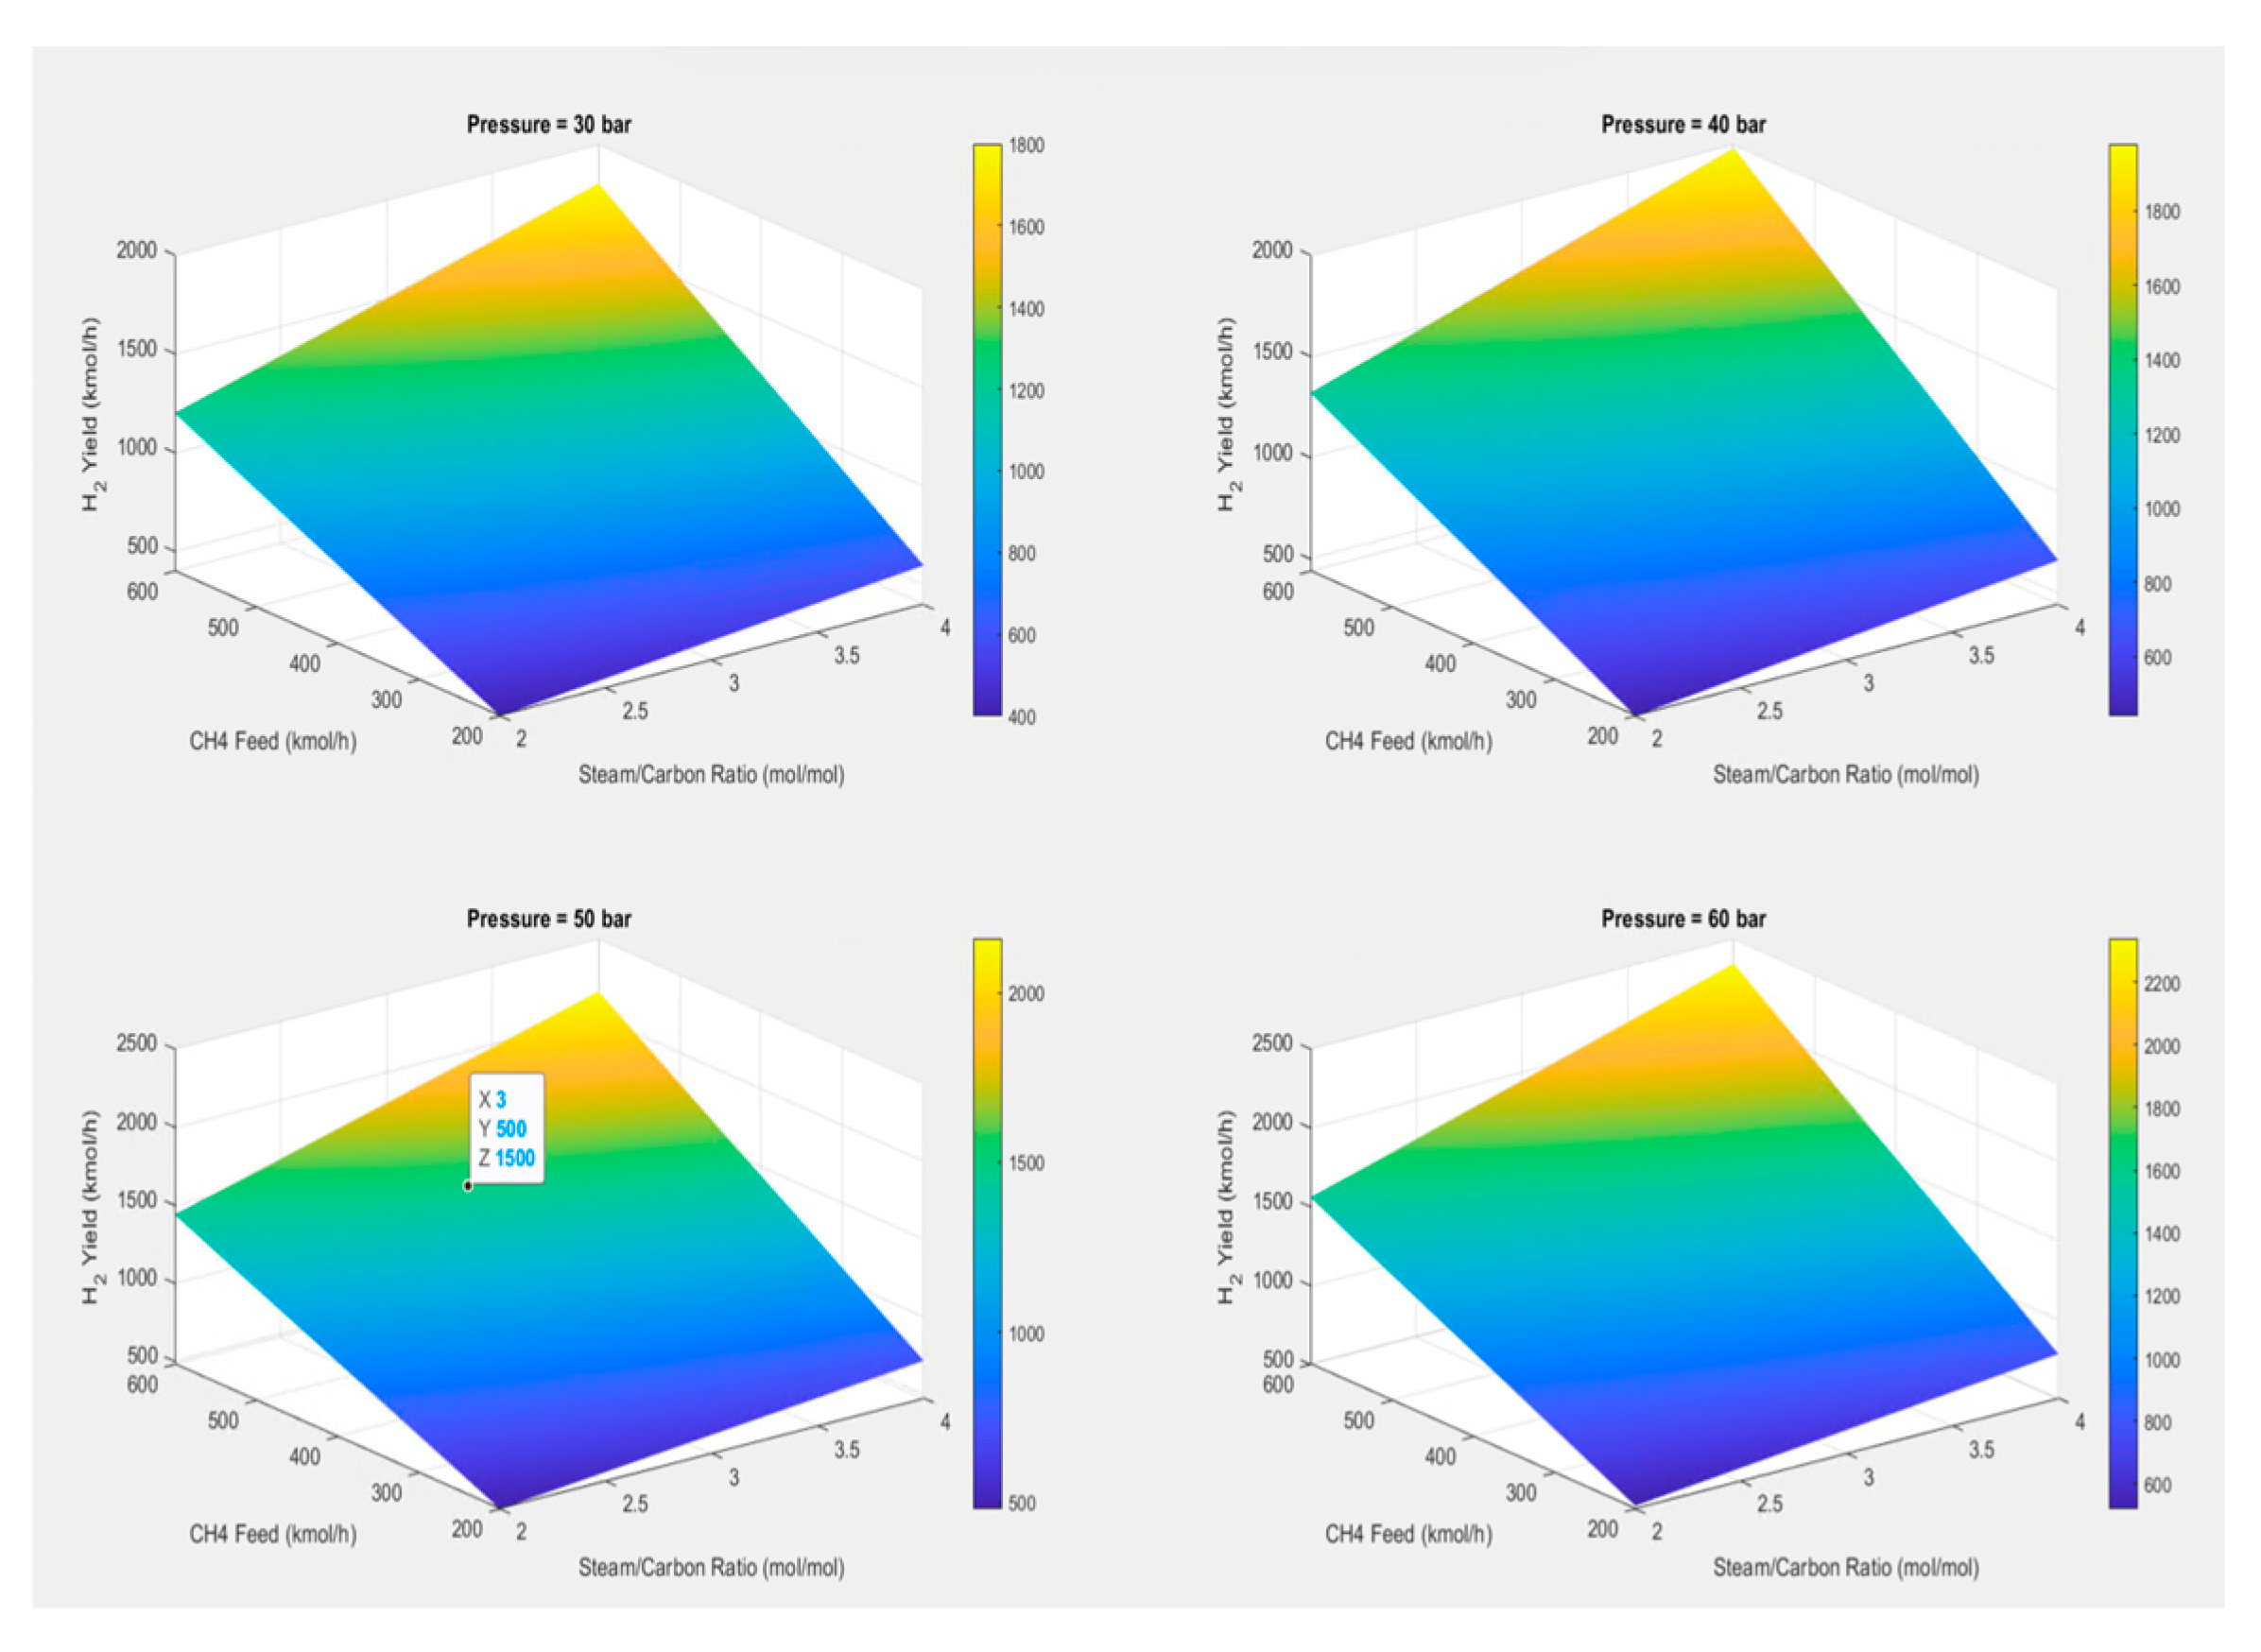
6.4.1. Analysis of Product Yields, Sensitivity, Methane Conversion, Hydrogen Purity
The primary goal is to determine the essential variables S/C ratios, feed temperature and pressure, and flow rates that should be first analysed using MATLAB software version R2024a to plot and tabulate the various pressure ranges and maximise hydrogen production. The multivariable Sensitivity analysis of the 3D plot generated by using MATLAB is shown in
Figure 6. To obtain many equilibrium steps in the reactor, the data must still be adjusted to fit the actual operation limit of the model in Aspen Hysys.
The calculated product yields of the reforming processes are principally indicated by the S/C ratio and Molar Change analysis, which may be graphically represented to explain the optimisation of the reforming process, as shown in
Figure 6. Formulas (11) to (15) can be used to determine the reaction’s product yields, sensitivity, methane conversion, and hydrogen purity, as indicated in
Table 4 [
4,
15,
16].
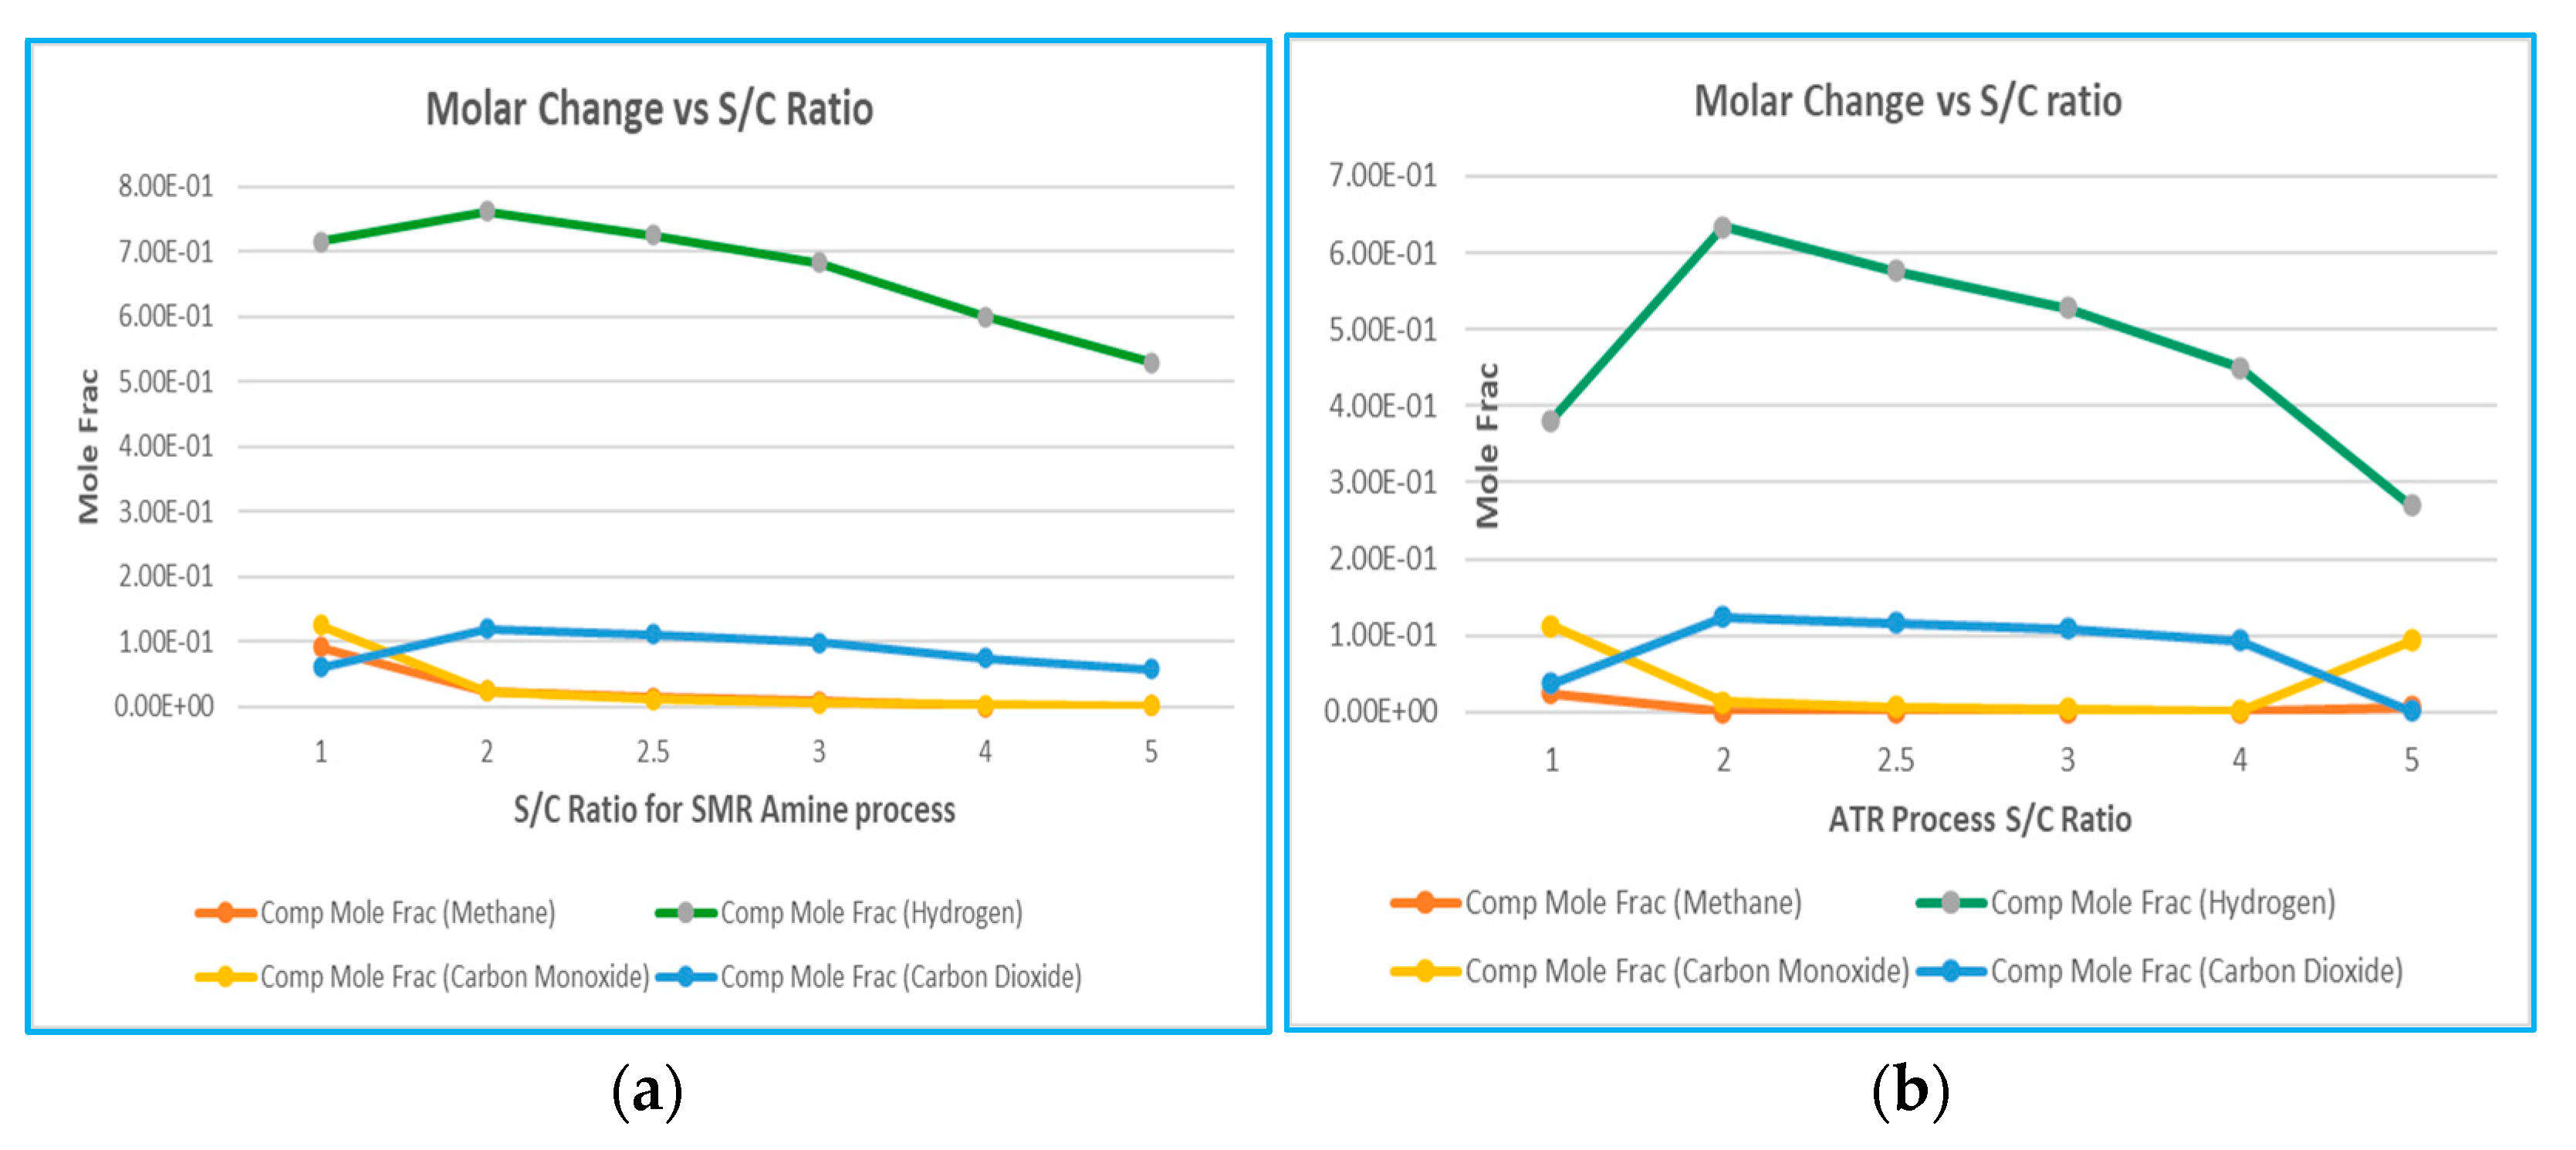
6.4.2. Molar Change of Components vs. S/C Ratio
One of the factors for the reforming process, the S/C ratio (the steam to methane ratio), causes a significant effect on the equilibrium of the process. The balance of the shift and reforming reactions are altered to achieve a higher methane conversion rate and a higher hydrogen output by evaluating the S/C ratio that reacts with the extra amount of steam. The efficiency of hydrogen production and carbon emission for the reforming process is to be evaluated based on the molar change vs. the S/C ratio for SMR and ATR processes. The S/C molar ratio reveals the influences on the reforming process and temperature of oxidation since the SMR and ATR refer to 4.2 comparisons of two different processes of heat energy input. SMR is an endothermic process, and ATR is an exothermic process. The simulation result shown in
Figure 7 shows that the molar change of hydrogen will be highest for an S/C ratio of 2; however, compared with the molar change of carbon, an S/C ratio of 2.5 is the most efficient to use [
15].
6.4.3. ATR Process with Different O/F Ratio
The ATR technique necessitated the examination of the oxygen and feed ratio (O/F) for evaluating the effectiveness of oxidation for improved combustion efficiency. The HYSYS analysis indicates that the ideal O/F ratio is 0.7; nevertheless, additional thermal energy might be required. Furthermore, to achieve the best alignment between S/C ratio and O/F ratio for optimum energy efficiency. The table presents an overview of the reformer’s simulation. Elevated O/F ratio to improve the exothermic reaction. A lower O/F ratio will lead to higher emissions of CO2 due to incomplete combustion of methane. Consequently, the carbon capture equipment may not effectively absorb emissions.
The S/C ratio will have the same effect in ATR as it does in SMR, lowering the reformer temperature. ATR will function with a lower S/C ratio but higher soot production, which causes the operating results to exceed the practical value, and HYSYS may not be able to provide operation results. In addition to lowering the S/C ratio, reformers may require higher power consumption, which will cause the optimisation to diverge from the objective.
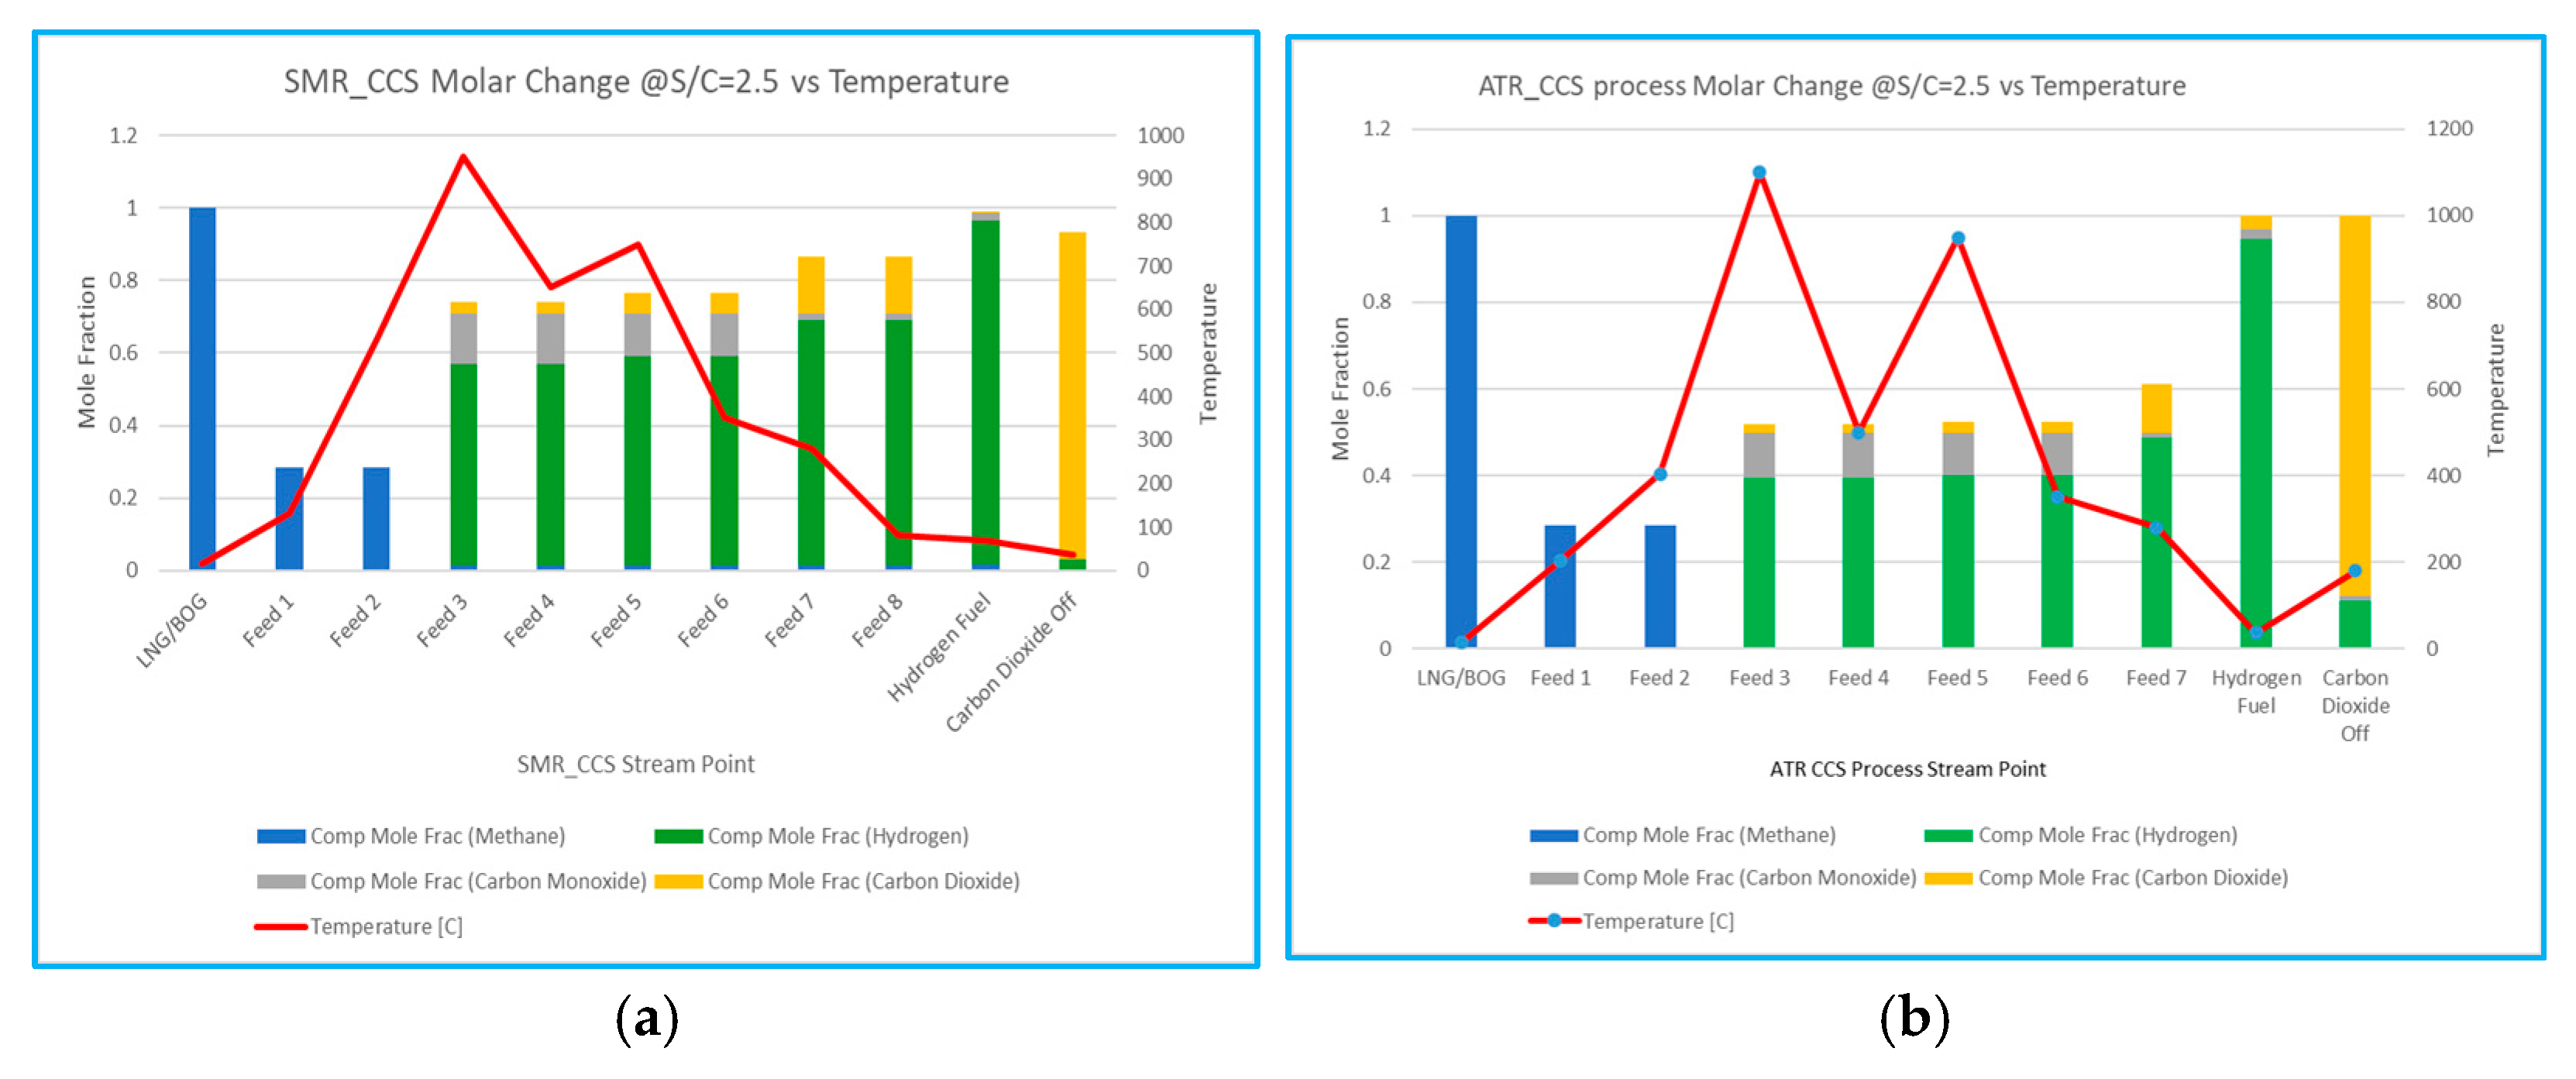
6.4.4. Molar Change of Components vs. Temperature
The results rely on the thermodynamic analysis to compare the SMR and ATR Amine processes; the molar composition change for hydrogen across the outflow stream points is monitored with a graph. Both systems exhibit strong performance; nevertheless, it is important to note that the space limitations for floating FPSOs make ATR more significant than SMR. Additionally, the simplifications and assumptions utilised throughout the simulation will be evaluated across four reforming processes under the optimum circumstances for each process. The influence of temperature on reforming results in process improvements attributable to variations in the mole fraction of the components. Consequently, the S/C ratio of 2.5, temperature variation at the process stream point, and the mole variation of the mixing components are illustrated in the graph shown in
Figure 8.
6.4.5. Exergy Analysis of Simulation Models
Exergy analysis is an advanced approach to thermodynamic evaluation. The first and second laws of thermodynamics indicate that exergy destruction results from irreversibility in the exergy transfer process. Exergy destruction is present in irreversible processes and absent in reversible processes. For floating platforms like FLNG, it is essential to measure the exergy destruction of each piece of equipment to reduce the losses. The variation in the exergy of a system may be positive, negative, or neutral. When the process temperature is inferior to that of the environment, heat and exergy transfer occur in reverse [
17,
18].
Furthermore, work and the associated exergy transfer may occur in the same direction or in opposing directions. The exergy of an isolated system diminishes throughout an irreversible process. It remains constant just for a reversible procedure. In an isolated system, there is no exergy exchange between the system and its environment. Consequently, the alterations in exergy are equivalent to the exergy that has been destroyed [
10].
Exergy analysis is the most effective criterion for system optimisation. Determining the exergy balance of the process within system boundaries is challenging. The loss of exergy is primarily associated with the reformer unit. The simulation reveals several vulnerability factors regarding the steam reformer. These elements lead to the dissipation of exergy. Evaluate the exergy efficiency of each reformer to determine the performance of the process.
Table 5 and
Table 6 below display the findings.
To evaluate the exergy destruction in the process, consider the specific S/C ratio relative to exergy. The S/C ratio is 2.5, as the variation in the S/C ratio influences the process’s overall efficiency. Furthermore, the determination of exergy efficiency is primarily contingent upon the reformer temperature. ATR is an endothermic reaction that requires external heat input. Conversely, SMR is exothermic, with heat generated within the system boundaries.
The negative exergy in the LT WGS reactor results from the combination of high entropy generation due to heat transfer at low temperatures, irreversibilities associated with the exothermic reaction, and energy dissipation close to ambient temperature, reducing the quality of energy. This does not imply the reactor is inefficient in producing hydrogen but highlights losses in the quality of energy during the process. To reduce this issue, systems can recover heat efficiently or optimise operating conditions to minimise entropy generation.
6.4.6. Cost Analysis
From the cost analysis by simulation of Aspen Process Economic Analyser, as referred to in
Table 7, Steam Methane Reforming (SMR) has a lower capital cost (CAPEX) of approximately
$9.3 million, compared to Autothermal Reforming (ATR), which requires
$13.4 million. This makes SMR a more cost-effective choice in terms of initial investment.
However, when considering operating costs (OPEX), the scenario shifts. SMR incurs significantly higher operational costs ($48.5 million/year) compared to ATR ($4.7 million/year), mainly due to the high utility costs of SMR ($43.5 million/year) versus ATRs lower utility costs ($2.3 million/year). This suggests that ATR is much more energy-efficient in the long run, particularly when integrating carbon capture technology.
While SMR remains the dominant technology due to its lower upfront investment and widespread industry adoption, ATR presents a more sustainable solution for large-scale hydrogen production with carbon capture capabilities. With increasing carbon taxation and stricter environmental regulations, ATR could become the preferred choice for FLNG, especially for blue hydrogen production with near-complete CO2 capture.
In future Policy and Carbon Taxation If carbon penalties increase, ATR may become the more economically viable choice.
Technological Innovations for improvements in SMR efficiency and alternative fuel integration (e.g., renewable electricity) may lower its OPEX.
ATR technology becomes more widespread, and CAPEX could decrease, making it more competitive.
In conclusion, SMR is currently the cheaper option for immediate investment, but ATR offers better long-term sustainability and economic efficiency with lower operating costs, especially in a carbon-conscious market with consideration of offshore platforms.
6.4.7. Carbon Emission Analysis
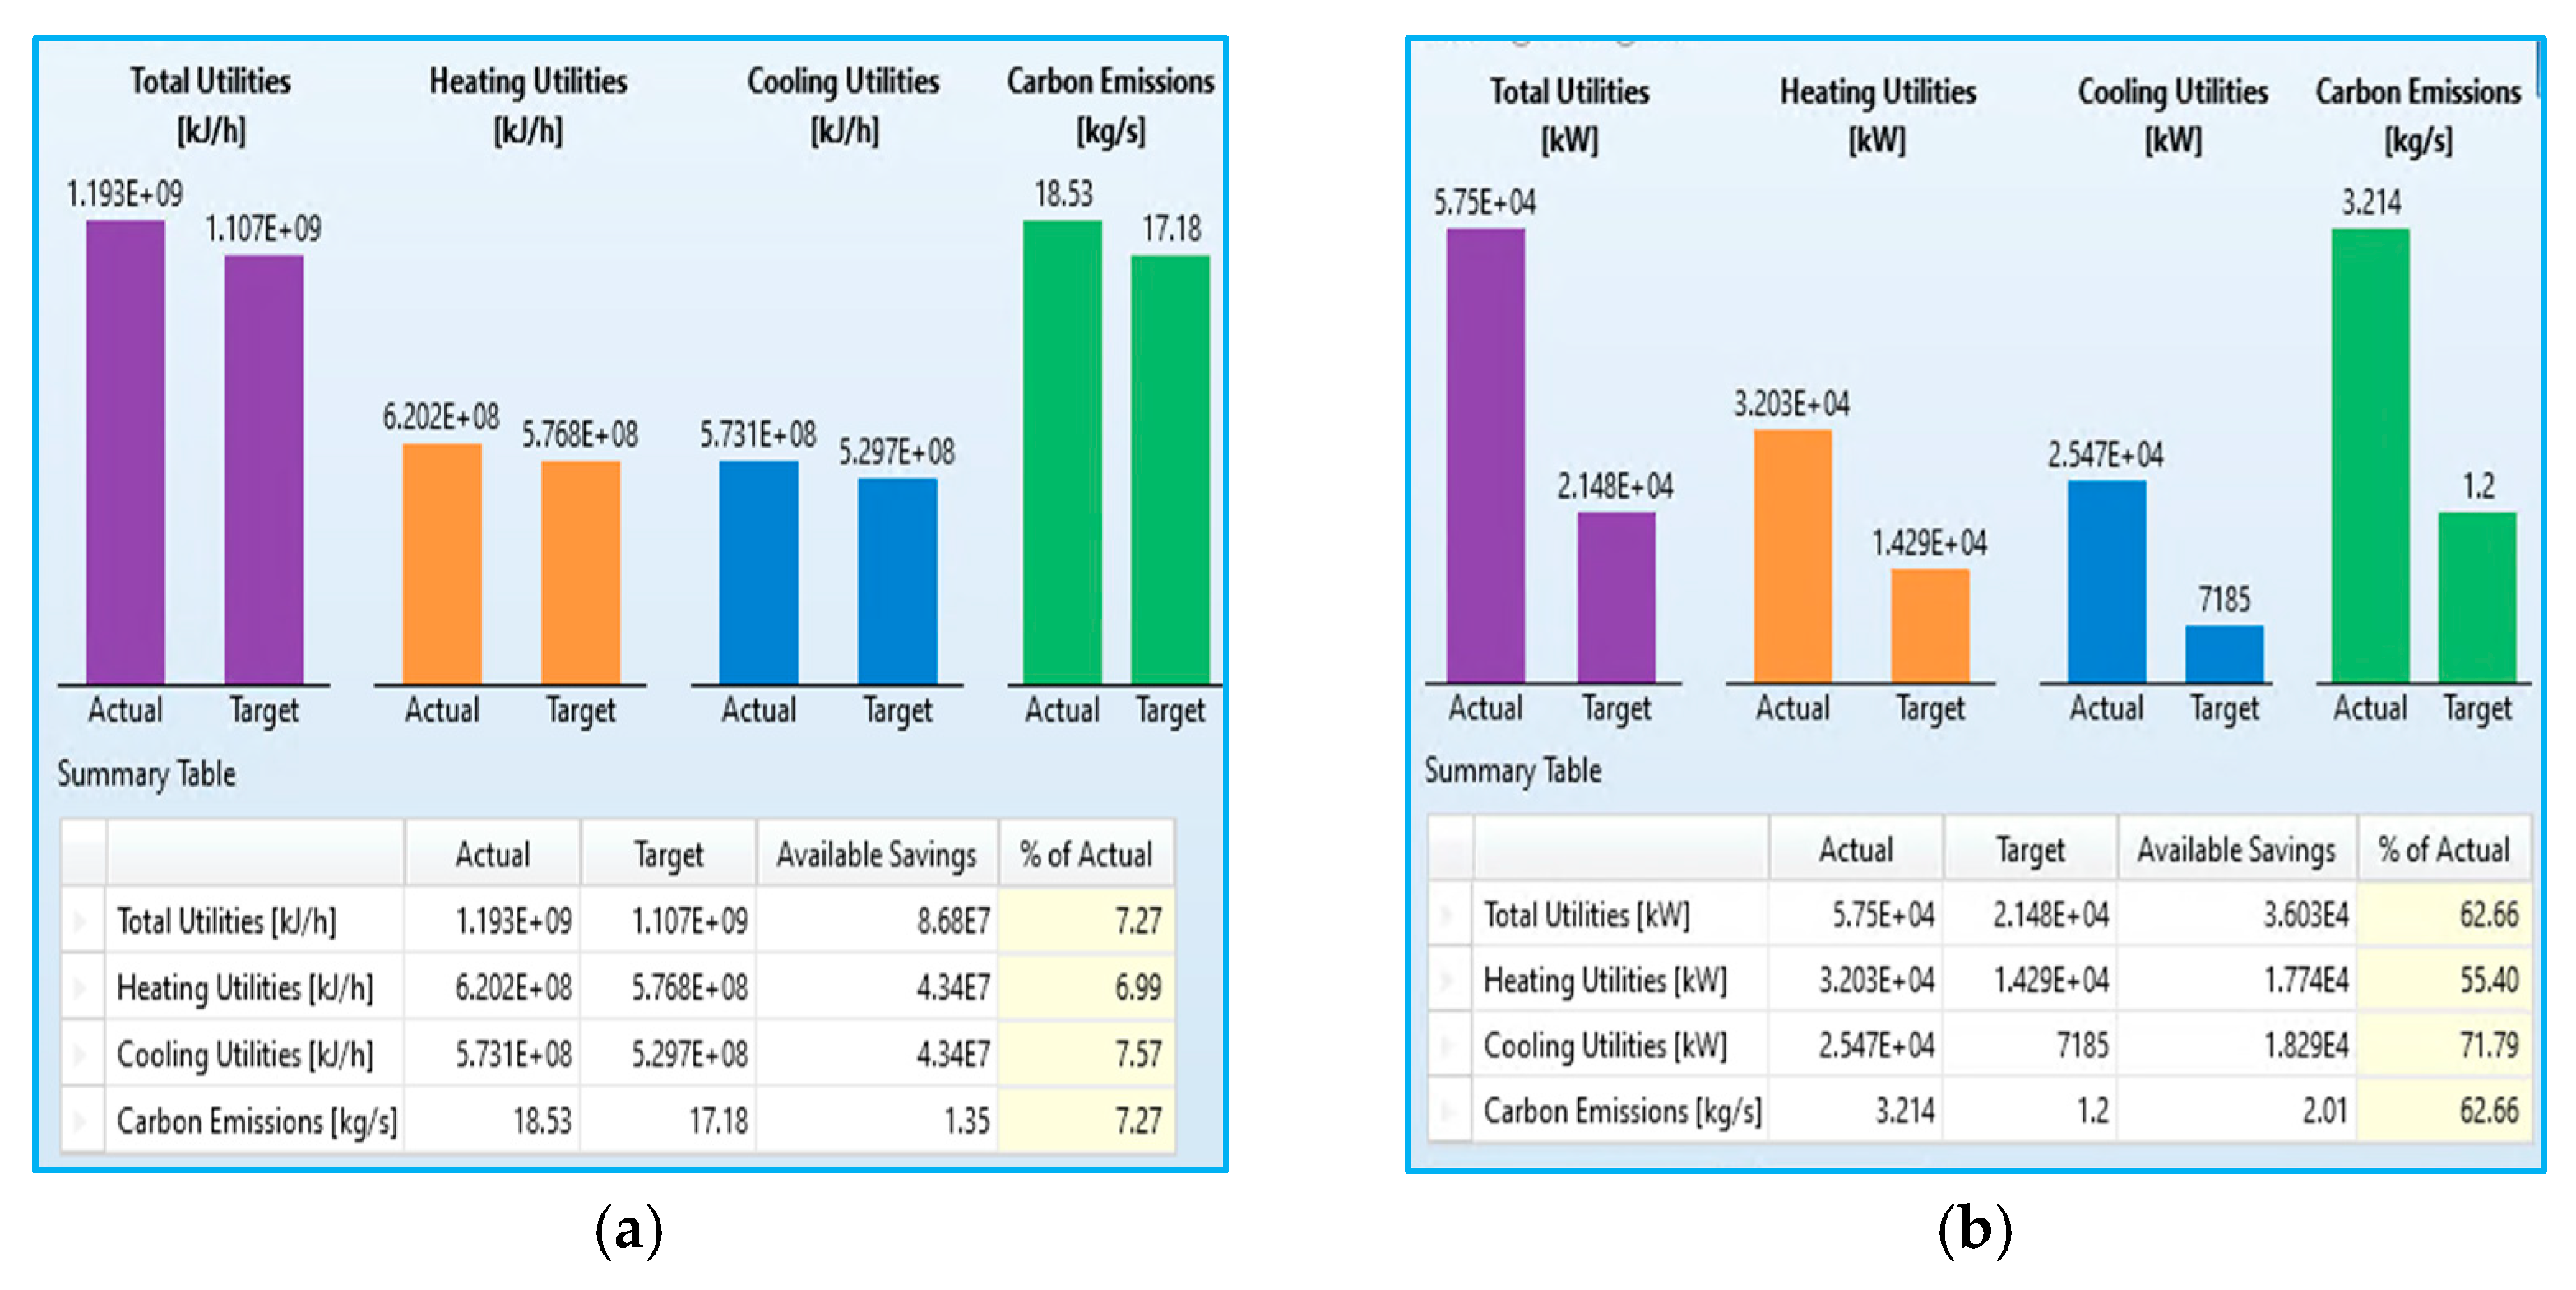
Use Aspen Energy Analyser to simulate the configuration SMR and ART process as shown in
Figure 9, that ATR offers significant energy savings over SMR. The total utility consumption in the current ATR setup is 57,500 kW, whereas the optimised SMR process setup is 331,500 kW, achieving an energy savings of 62.66%. The heating utilities of ATR can reduce energy consumption by up to 55.4%. Cooling utilities show the highest savings potential, at 71.79%. The proposed ATR process can also reduce carbon dioxide emissions by 62.66%, highlighting ATRs environmental benefits compared to the conventional SMR process. For the vision of the future, increasing global focus on energy efficiency and carbon reduction, ATR appears to be the more sustainable choice. The substantial reduction in utility demand and emissions aligns well with net-zero targets and low-carbon hydrogen production strategies.
6.4.8. Carbon Capture Analysis
This should be integrated into the comprehensive assessment of the carbon capture system analysis. The primary process design displays the H
2 and CO
2 molar flow rate variables directly on a carbon capture dashboard, which illustrates the mole percentages composition of sour gas and fuel gas, lean and rich amine loading, inlet and outlet CO
2 loading, CO
2 capture percentage, net GHG emissions, and carbon fees, as presented in
Table 8 below. The primary outcome of both simulations is the CO
2 collection and carbon tax, which influence the overall system performance across all operations. To achieve an effective design, it is necessary to assess the temperature that affects the mole fraction and exergy of the reformer, as well as the separation processes in the absorber and stripper. The flow is minimised to satisfy the hydrogen fuel requirements solely for the power generation turbine. This methodology will provide a more compact and efficient design for FLNG, addressing economic concerns and unit sizing to accommodate the spatial limitations of FLNG. Despite hydrogen production, the challenge is to produce clean blue hydrogen with integrated CO
2 capture. The assessment of the numerous evaluations of hydrogen generation from all simulation models is necessary to ascertain the performance attributes of FLNG applications, including energy and exergy efficiency, spatial limitations, and carbon emissions. The conclusion is derived from the model of the process inside the same context, encompassing all conditions and assumptions. Finding an optimisation might become more feasible if the inquiry is expanded to include additional factors.
Regarding CO
2 capture and SMR with MEA Amine are the best alternatives. SMR Amine is the most efficient process for producing hydrogen based on hydrogen yields, followed by ATR with DEPG amine, as per the simulation result and the comparison graph in
Figure 6. SMR is slightly efficient. However, ATR is one feasible solution for FLNG applications in terms of further research to reduce the equipment. The ATR process is a combination of SMR, which requires control of both oxygen and steam. The oxygen-to-fuel ratio drives carbon emissions. Hence, the oxygen-to-oxygen-to-fuel ratio used in the simulation will reduce the carbon emission. The reformer temperature is substantially greater in the ATR reactor than in the SMR reformer because of the absence of steam and soot or coke formation, which can be controlled by the scrubber after the reformer outlet.
6.4.9. Cost and Energy Analysis Validation
The economic viability of Steam Methane Reforming (SMR) and Autothermal Reforming (ATR) is crucial for selecting the most suitable process for large-scale hydrogen production. To validate the cost using a similar open-source project, Aspen Process Economic Analyser Version 11 is utilised. This validation aims to compare CAPEX, OPEX, and energy efficiency data using open-source references and cost breakdowns extracted from project files. The validation process is to compare with open-source benchmarks and to align capital and operational cost estimates with publicly available industry reports.
For energy efficiency and carbon savings assessment, evaluate the energy consumption and CO
2 emissions for both processes by Aspen Energy Analyser Version 11, which refering to the open-source energy and economic data from agencies such as the International Energy Agency (IEA) and the U.S. Energy Information Administration (EIA) that were used to validate the estimated energy savings and cost implications. Other reputable sources, as per reference, calculate the CAPEX, OPEX, and energy reference data. These sources provide benchmark utility cost figures and emphasise that energy-intensive processes (as in conventional SMR) lead to higher operational expenditures. Furthermore, literature from the National Renewable Energy Laboratory (NREL) supports the finding that process integration and energy recovery as seen in the ATR process can drastically lower utility costs, thereby validating the potential for lower OPEX as shown in
Table 9 [
19,
20,
21,
22,
23,
24].
Economic sensitivity analysis was conducted (refer to
Table 10) to examine cost variations based on key influencing factors to understand the cost variations based on energy prices, carbon taxation, and technological improvements [
16,
25,
26].
Table 9.
Capital and Operating Cost Comparison for SMR and ATR processes [
16,
21,
27,
28,
29].
Table 9.
Capital and Operating Cost Comparison for SMR and ATR processes [
16,
21,
27,
28,
29].
| Cost Category | SMR Cost | ATR Cost | Validation Source |
|---|
| Total Capital Cost [USD] | $9.8 M | $13.9 M | [21,28] |
| Total Operating Cost [USD/Year] | $48.7 M | $4.9 M | [29] |
| Equipment Cost [USD] | $2.1 M | $4.6 M | [27] |
| OPEX (USD per Kg H2) | $1.50 | $1.30 | [16] |
| Energy Consumption (kWh/kg H2) | 44.5 | 41.6 | [24,28] |
| CO2 Emissions (kg CO2/kg H2) | 9.0 | 1.5 | [24,28] |
Table 10.
Economic sensitivity analysis or SMR and ATR processes.
Table 10.
Economic sensitivity analysis or SMR and ATR processes.
| Key Factor | Impact on SMR | Impact on
ATR | Overall Effect |
|---|
| Natural Gas price increase | High increase in OPEX | Lower Impact
due to energy
efficiency | ATR becomes more cost-effective |
| Carbon Tax ($51/Ton CO2) | High-cost increase (due to dual CO2 Streams) | Lower cost
increase (due
to single CO2
Streams) | ATR benefits more from carbon emission |
| Scale Up Effect | Cost Decrease Slightly | Cost reduction
More significant | ATR benefits
More at large scale |
Data from open-source benchmarks reveal that ATRs higher initial investment is offset by long-term savings in energy and carbon capture costs. ATR is validated as the more cost-effective solution in carbon-regulated environments due to higher energy efficiency and a single CO
2 removal unit. SMR remains an attractive short-term option due to lower CAPEX but faces higher operational costs and carbon tax penalties [
20,
22,
23,
24,
25].
7. Conclusions
This study’s main goal is to examine the energy potential of blue hydrogen fuel as a reforming process substitute for traditional fuels, with an emphasis on the energy requirements of floating platforms. A comprehensive investigation of the variations in molar change, efficiency, and carbon capture ratio will determine the superior system. The ATR system provides more carbon fee savings and a reduction in equipment size; however, the most beneficial alternative remains SMR MEA Amine, as determined by the molar change analysis conducted for hydrogen production at each phase. It is recommended to broaden the system boundaries to enable a more thorough assessment. This article evaluates applications and analysis of energy and exergy in the SMR and the ATR process.
The results obtained suggest the potential for enhancing exergy characteristics in SMR and ATR reactors. The overall exergy efficiency of the ATR process is better than SMR, which means the ATR process benefits from the autothermal balance of exothermic and endothermic reactions, leading to efficient hydrogen production. Also, understanding exergy destruction aids in comparing different process designs of ATR and SMR and is based on exergy for selecting with the least irreversibility, ensuring high performance and sustainability. Thus, it is extremely important to include exergy efficiency in the alterations of the system’s thermodynamic parameters.
To increase the volumetric flow rate within the reforming reactor, future system optimisation studies may reconfigure the reformer with an enhanced stream subsequent to the reactor. However, the reformer’s dimensions must be assessed in light of the FLNGs financial and spatial limitations. The cost of hydrogen production will be influenced by many energy-related factors. The SMR method is considered cost-effective due to less equipment. However, the ATR method is more efficient in reducing CO2 emissions. This suggests that, upon evaluation, based on the SMR and ATR techniques, the ATR system will be a better one for hydrogen production and will be more efficient for FLNG.
Regarding future hydrogen production research for offshore FLNG platforms, considering hybrid techniques that combine SMR and ATR could achieve cost and energy reductions. Integration with renewable electricity (for example, electrolysis + ATR) has the potential to improve sustainability even more. Carbon capture improvements will determine whether SMR is still competitive with ATR in a carbon-taxed environment.
As a last thought, if energy efficiency and emissions reduction are priorities, ATR is the clear choice. However, financial concerns (CAPEX and OPEX) must be considered as key contributing factors while determining the appropriate method for a specific application.


