Article

Complete Blood Count-Derived Biomarkers’ Association with Risk of PD-1 or PD-1/CTLA-4 Inhibitor-Induced Hypothyroidism in Patients with Solid Tumors

1
Faculty of Medicine, Department of Immunology, Tbilisi State Medical University, Tbilisi 0186, Georgia
2
Clinical Trials Department, Israel-Georgia Medical Research Clinic Healthycore, Tbilisi 0112, Georgia
*
Author to whom correspondence should be addressed.
Immuno 2025, 5(2), 21; https://doi.org/10.3390/immuno5020021
Submission received: 3 April 2025 / Revised: 29 May 2025 / Accepted: 2 June 2025 / Published: 4 June 2025
(This article belongs to the Section Cancer Immunology and Immunotherapy)

Abstract

Background: A novel and highly effective strategy for tumor immunotherapy involves enhancing host immune responses against tumors through the blockade of checkpoint molecules. The most common toxicities associated with checkpoint blockade therapies include autoimmune damage to various organs. Purpose: This study aims to investigate hematological markers derived from complete blood counts (CBCs)—including the neutrophil-to-lymphocyte ratio (NLR), platelet-to-lymphocyte ratio (PLR), derived neutrophil-to-lymphocyte ratio (dNLR), white blood cell-to-hemoglobin ratio (WHR), neutrophils, lymphocytes, platelets, hemoglobin, red blood cell (RBC) count, neutrophil-to-RBC ratio (NRR), and neutrophil-to-hemoglobin ratio (NHR)—as potential prognostic biomarkers for the early identification of hypothyroidism in patients receiving PD-1 or PD-1/CTLA-4 immune checkpoint inhibitors. Materials and Methods: A prospective observational study was conducted on 44 patients with stage III-IV solid tumors treated with immune checkpoint (PD-1 or PD-1/CTLA-4) inhibitors. Thyroid function tests and CBC-derived biomarkers were collected at baseline, before immunotherapy. In the immunotherapy cohort, 15 of the 44 patients developed immune-related hypothyroidism, defined as overt autoimmune thyroiditis (TSH > 4.0, FT4 < 12, and anti-TPO antibodies > 30 IU/mL and/or anti-TG antibodies > 95 IU/mL) (Group 1). In comparison, 29 patients maintained normal thyroid function (Group 2). The control group comprised 14 age- and sex-matched healthy volunteers (Group 3). Statistical analyses were performed using analysis of variance (ANOVA) to compare blood parameters among the three groups (Group 1, Group 2, and Group 3) before treatment, with statistical significance set at a p-value < 0.05. Receiver operating characteristic (ROC) curve analysis was conducted to evaluate the diagnostic power of the potential prognostic biomarkers areas. The area under the curve (AUC), sensitivity, and specificity were calculated for the 44 immunotherapy patients. Results: The PLR was significantly higher (262.25 ± 162.95), while WBCs-neutrophils, the WHR, the NRR, the NHR, WBCs, neutrophils, and lymphocytes were lower (2.07 ± 0.66, 0.54 ± 0.19, 0.96 ± 0.28, 0.36 ± 0.14, 6.36 ± 2.07, 4.29 ± 1.55, and 1.23 ± 0.41, respectively) at baseline in Group 1 in comparison to Group 2. ROC curve analysis revealed that the areas under the curve (AUC) for WBCs, neutrophils, lymphocytes, WBCs-neutrophils, the PLR, the WHR, the NRR, and the NHR were 0.9, 0.87, 0.83, 0.85, 0.84, 0.92, 0.89, and 0.87, respectively. These values exceeded the threshold, indicating the high prognostic potential of each marker. Conclusions: Lower baseline levels of WBCs-neutrophils, the WHR, the NRR, the NHR, WBCs, neutrophils, and lymphocytes, along with a higher PLR, were associated with an increased risk of hypothyroidism in patients receiving PD-1 or PD-1/CTLA-4 inhibitors. These CBC-derived biomarkers represent simple, accessible, and potentially useful tools for predicting hypothyroidism in cancer patients undergoing immunotherapy. Further studies in bigger cohorts are needed to validate our findings.

1. Introduction

Cancer, a condition caused by the unregulated proliferation of altered cells, is a consequence of natural selection [1]. Besides cancer cells, it is now widely recognized that the microenvironment surrounding these tumorigenic cells, which are made up of various other cell types, such as immune cells, fibroblasts, and neurons, is very important for how tumors develop, change, and respond to the treatment [2].
Immune checkpoint inhibitors (ICIs) represent a revolutionary treatment modality that has significantly advanced the potential for tumor cure. The rationale for utilizing these agents is indirectly stimulating the immune system to target neoplastic cells [3]. However, with the increasing use of ICIs, a novel class of side effects known as immune-related adverse events (irAEs) has emerged [4,5]. ICIs can affect virtually every organ system, though the skin, gastrointestinal, and endocrine systems are most commonly impacted [4,5]. Among the endocrine-related toxicities, thyroid dysfunction, which may manifest as thyrotoxicosis or hypothyroidism, is particularly prevalent [6]. While ICIs are associated with improvements in progression-free survival (PFS) and overall survival in advanced cancers, identifying and managing patients at risk of irAEs is crucial for the continued safe and effective use of these therapies [5].
Immune-related adverse events can arise at any point following the administration of ICIs, with onset occurring from a few days to more than a year after treatment discontinuation [7]. In recent years, the early identification of high-risk individuals has become a key focus in irAE research, given its significant clinical implications [7]. Notably, elevated levels of autoantibodies against thyroid peroxidase (anti-TPO antibodies) and thyroglobulin (anti-Tg antibodies) have been observed at baseline in some patients who develop thyroid dysfunction following ICI treatment [4]. Furthermore, ICIs are found to induce thyroid dysfunction more frequently in women than in men [8,9].
Despite these insights, no biomarkers have been validated for clinical application in predicting immune-related thyroid adverse events.
Recently, research has focused on more accessible and cost-effective biomarkers, specifically those derived from the complete blood count (CBC), as alternatives to specialized or expensive technologies [10,11]. Ratios of cells and proteins calculated from the CBC, serve as indicators of the equilibrium between immune activation and systemic inflammation. An increased neutrophil-to-lymphocyte ratio (NLR) and platelet-to-lymphocyte ratio (PLR) have been associated with chronic pathological conditions and may provide prognostic value in assessing disease severity and clinical outcomes [12]. It is shown that the NLR, PLR, and neutrophil count, may offer valuable prognostic information for predicting thyroid dysfunction following ICI treatment [10,11,13].
CBC-derived biomarkers are increasingly studied as potential predictors for hypothyroidism risk due to several practical and pathophysiological advantages over traditional markers such as TSH (thyroid-stimulating hormone) and thyroid autoantibodies. CBC-derived indices can reflect systemic changes associated with chronic inflammation, immune activation, or anemia, all of which are commonly linked with thyroid dysfunction. These markers may reveal subclinical effects of thyroid hormone imbalances before overt changes in TSH or autoantibody levels are detectable [14].
This prospective, clinical observational study aims to investigate whether CBC-derived biomarkers could serve as potential predictors for the early identification of hypothyroidism in carcinoma and melanoma oncological patients receiving PD-1 or PD-1/CTLA-4 immune checkpoint inhibitors.

2. Material and Methods

2.1. Patients

This prospective observational study was approved by the Biomedical Research Ethics Committee of Tbilisi State Medical University. The study included 44 patients comprised of: 16 females and 28 males with stage III-IV solid tumors (non-small cell lung cancer, melanoma, ovarian cancer, renal cell carcinoma, bladder cancer, liver cancer, and prostate cancer) treated with immune checkpoint inhibitors (ICIs) (PD-1 or PD-1/CTLA-4 inhibitors) (Table 1).
Patients with a history of thyroid dysfunction, autoimmune disorders, or previous iodide contrast-enhanced CT scans before thyroid function tests (TFTs) were excluded from the study. Eligible participants were adults aged ≥18 with an Eastern Cooperative Oncology Group performance status (ECOG PS) of ≤2. Recruitment occurred at the Israeli-Georgia Medical Research Clinic Healthycore and Todua Clinic between 2023 and 2024.
The study was conducted by the principles of the Declaration of Helsinki, and all participants provided written informed consent.

2.2. Treatment and Data Collection

Patients received either PD-1 or PD-1/CTLA-4 inhibitors every 2–3 weeks. The ICIs used were pembrolizumab, nivolumab, and ipilimumab, with dosages of 200 mg, 240 mg, or 1 mg/kg and 3 mg/kg intravenously, respectively. Fasting blood samples were collected at baseline for CBC and TFT. Both CBC and TFTs were conducted on the same days. Samples for TFTs (collected in tubes containing a clot activator and gel for serum separation) were left standing vertically for 30–60 min at room temperature, centrifuged for 15 min at 2000× g, and the supernatants were then analyzed. CBC samples (collected in EDTA tubes) were immediately carefully rocked back and forth and then analyzed. Baseline measurements were taken within 3 days before administering the first dose of immune checkpoint inhibitors.
Data from CBC allowed us to calculate the NLR by dividing the absolute number of neutrophils by the absolute number of lymphocytes, the PLR by the division of platelets and lymphocytes, and the white blood cell-to-hemoglobin ratio (WHR) by the division of white blood cells and hemoglobin. The systemic immune-inflammation index (SII) was calculated as the platelet count × neutrophil count divided by the lymphocyte count;, the white blood cells (WBCs)-neutrophils value was calculated as the difference between the WBC count and the absolute neutrophil count;, the neutrophil-to-hemoglobin ratio (NHR)—as a division of the neutrophil to hemoglobin count;, the platelet-to-hemoglobin ratio (PHR)—as a division of the platelet to hemoglobin count;, the neutrophil-to-red blood cell ratio (NRR)—as a division of the neutrophil count to the red blood cell count;, and the derived neutrophil-to-lymphocyte ratio (dNLR)—as a division of the neutrophil count to the difference between total leukocyte count and neutrophil count.
The TFTs included: the thyroid stimulating hormone (TSH), free thyroxine (FT4), anti-thyroid peroxidase antibody (anti-TPO), and anti-thyroglobulin (anti-Tg) antibody.
The serum TSH and FT4 levels were measured using an Electrochemiluminescence (ECL) immunoassay (Cobas e411, Roche Diagnostics), and the anti-TPO and anti-Tg antibody levels were measured using an ECL immunoassay (HITACHI). The reference ranges for these assays were as follows: TSH 0.4–4.0 mIU/mL, FT4 12–22 pmol/L, anti-Tg- < 95 IU/mL, and anti-TPO antibodies < 30 IU/mL.

2.3. Study Assessments

Immune-related thyroiditis (ir-thyroiditis) was assessed over a 3-month period, as irAEs typically peak within the first 12 weeks of treatment [15]. The assessment and management of ir-thyroid disorders followed the ESMO and ASCO guidelines [16,17]. During the 12-week observation period, patients who developed ir-thyroid disorders were classified as grade 1 or 2 according to established grading criteria.
The immunotherapy cohort was divided into two groups as follows: 15 patients who developed immune hypothyroidism, defined as overt autoimmune thyroiditis (TSH > 4.0 mIU/mL, FT4 < 12 pmol/L, and anti-TPO- > 30 IU/mL and/or anti-Tg antibodies > 95 IU/mL) (Group 1), and 29 patients who maintained normal thyroid function (Group 2). The control group comprised 14 age-matched healthy volunteers (Group 3).

2.4. Statistical Analysis

Statistical analysis was performed using IBM Corp. (Armonk, NY, USA) Released IBM SPSS Statistics for Windows, version 21.0. Analysis of variance (ANOVA) was used to compare the blood parameters among the three groups (Group 1, Group 2, and Group 3) before treatment. Statistical significance was set at a p-value < 0.05.
Variables were tested for normality by using the Kolmogorov-Smirnov Lilliefors test. Continuous variables are expressed as mean ± standard deviation. The Mann-Whitney U test was used to analyze the variables that deviated from the normal distribution for all tests, where p < 0.05 was considered significant.
To evaluate the diagnostic performance of studied predictors, including the WBCs, neutrophils, lymphocytes, WBCs-neutrophils, PLR, WHR, NRR, and NHR, receiver operating characteristic (ROC) curves were constructed. The area under the curve (AUC), sensitivity, and specificity were calculated for all immunotherapy patients (n = 44) using the pROC package in R [18,19]. A 95% confidence interval for the AUC was calculated using the DeLong nonparametric method [20]. The optimal cut-off values for the predictors were determined using the Youden index (J), which maximizes both specificity and sensitivity [21]. The cut-off is often considered optimal for general diagnostic use [21,22].

3. Results

The clinical characteristics of the 44 patients in the immunotherapy cohort were as follows: 27 patients with non-small cell lung cancer (NSCLC), 7 with ovarian cancer, 4 with melanoma, 2 with prostate cancer, 2 with renal cell carcinoma, 1 with liver cancer, and 1 with bladder cancer (Table 1). The median age was 65.5 years (range: 38–75 years), with 16 females (36%) and 28 males (64%). The distribution of disease stages among patients was as follows: stage III (n = 26) and stage IV (n = 18). ICI-induced ir-hypothyroidism was assessed in the 12th week of the treatment. Hypothyroidism was classified as grade 2–3, which did not require the discontinuation of ICIs or the use of high-dose corticosteroids. Possible hyperfunction of the thyroid gland manifested by thyrotoxicosis in the early term of ICI therapy was not detected. The overall incidence of hypothyroidism in patients treated with ICIs was 34%. Hypothyroidism grade 2 developed in 12 patients, and grade 3 in 3 patients.
It was revealed that the patients who developed hypothyroidism after immunotherapy showed lower baseline levels of HGB and lymphocytes but higher levels of anti-Tg antibodies and PLR than healthy controls (Table 2). In comparison to healthy controls, patients who maintained normal thyroid function showed higher levels of WBCs, neutrophils, the WHR, the NHR, the NRR, and anti-TPO antibodies at baseline (Table 2).
Of the biomarkers examined, the PLR (p = 0.031), WBCs-neutrophils, WHR, NRR, NHR, WBC, neutrophils, and lymphocytes all showed statistically significant differences (p-value = 0.007, 0.004, 0.007, 0.012, 0.001, 0.005, and 0.008, respectively) between Groups 1 (hypothyroidism) and 2 (normal thyroid function) at baseline. The PLR was significantly higher (262.25 ± 162.95), while the other indices (2.07 ± 0.66, 0.54 ± 0.19, 0.96 ± 0.28, 0.36 ± 0.14, 6.36 ± 2.07, 4.29 ± 1.55, and 1.23 ± 0.41, respectively) were lower in Group 1 (Table 2) in comparison with Group 2.
  • Multivariable Analysis
To assess the association between sex, cancer type, and disease status (hypothyroidism), we conducted a series of multivariable logistic regression models. Neither sex nor cancer type, showed a statistically significant association with disease status in any model (p > 0.05). (See Supplementary Materials).
  • A Power analysis
A power analysis was conducted to assess whether the available sample size was sufficient to detect a meaningful discriminative performance, as measured by the AUC. An expected AUC of 0.80 was assumed. A power analysis was performed using the pwr. test function in R to determine the required sample size for a one-way ANOVA with three groups, assuming a large effect size (Cohen’s f = 0.5), a significance level of 0.05, and a desired power of 0.80. The analysis indicated that approximately 13.9 participants per group are needed to detect the specified effect with adequate power.
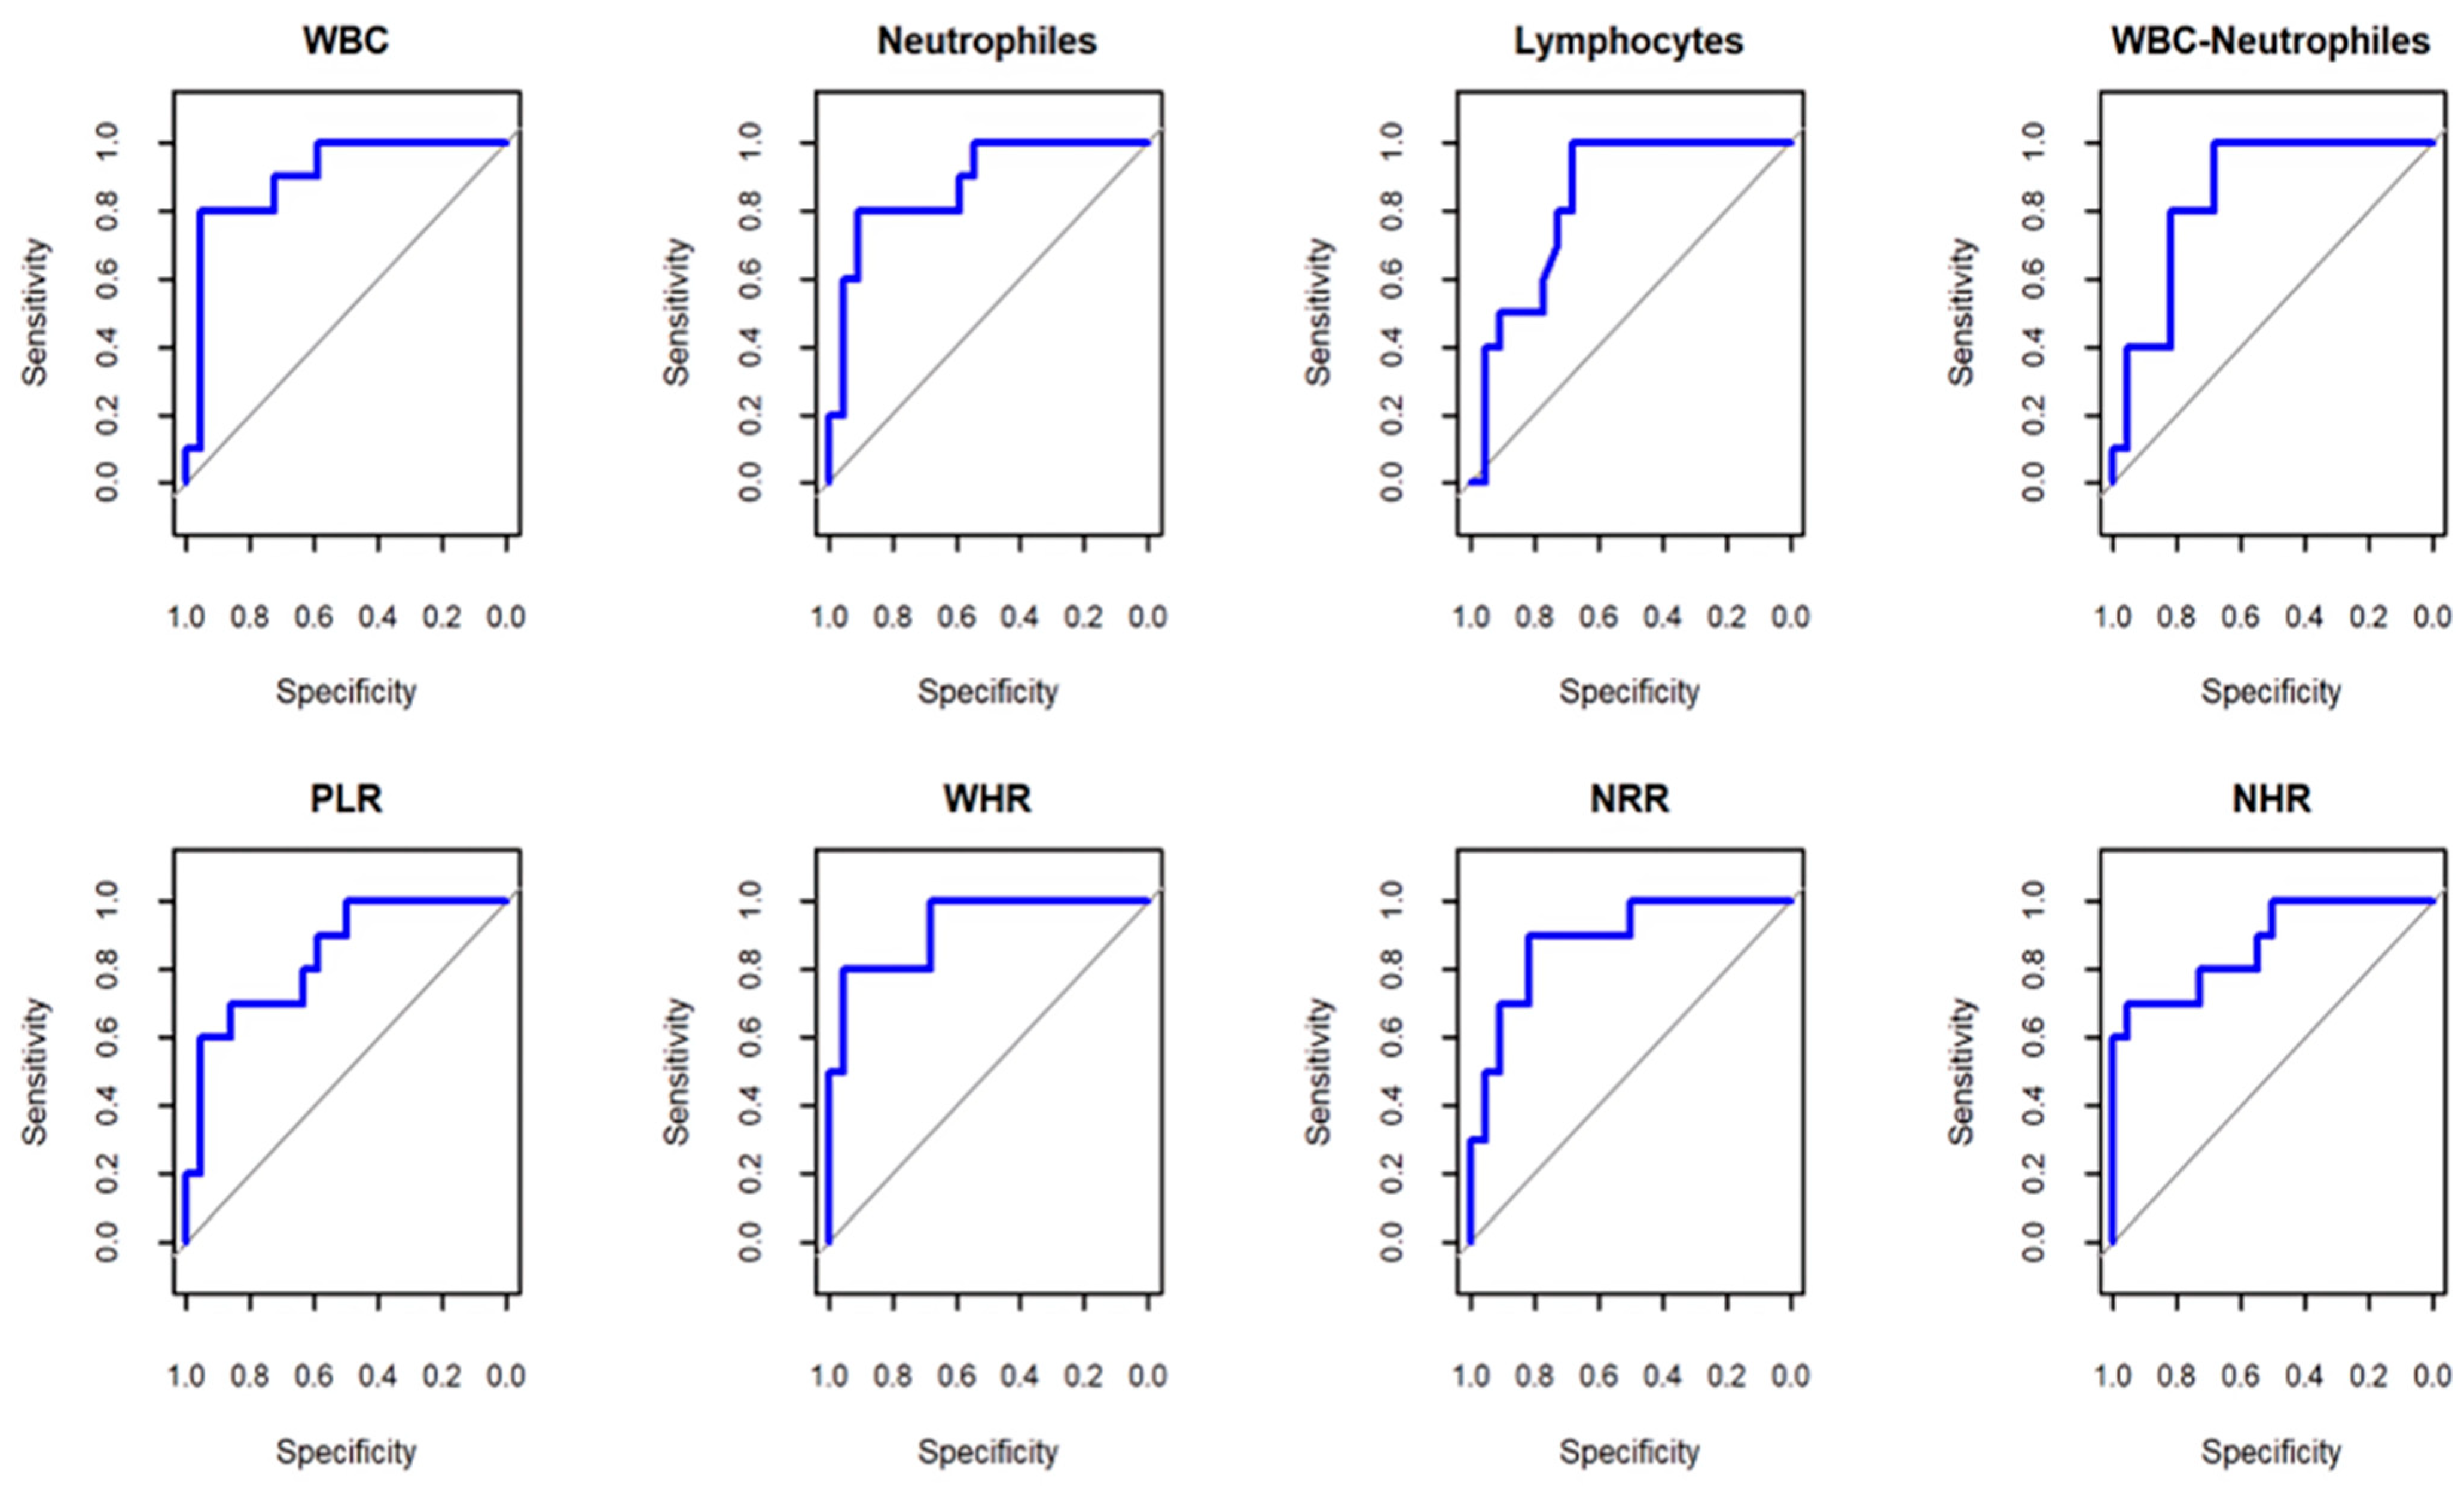
  • Prognostic Evaluation of Hematological Biomarkers
The ROC curve analysis (Figure 1) revealed that the AUC for WBCs, neutrophils, lymphocytes, WBCs-neutrophils, the PLR, the WHR, the NRR, and the NHR were as follows: 0.90, 0.87, 0.83, 0.85, 0.84, 0.92, 0.89, and 0.87, respectively (Table 3). All values exceeded the threshold, indicating high prognostic potential for each biomarker. The baseline cut-off values of WBCs, neutrophils, lymphocytes, WBCs-neutrophils, the PLR, the WHR, the NRR, and the NHR for predicting hypothyroidism development were as follows: ≤6.6, ≤4.5, ≤1.85, ≤2.59, ≥222.97, ≤0.52, ≤1.06, and ≤0.34, respectively.

4. Discussion

The incidence of immune-related hypothyroidism (34%) in our cohort was consistent with findings from previous studies [15,23,24].
Thyroid toxicity varies significantly between ICI regimens. While PD-1 inhibitors typically cause thyroid side effects, their combination with CTLA-4 inhibitors leads to more serious and complex hormone-related issues [25,26]. Despite both Nivolumab and Pembrolizumab being anti-PD-1 agents, individuals receiving Nivolumab had a higher tendency to develop hypothyroidism compared to those treated with Pembrolizumab [27]. Similar results were replicated in our study (Table 1).
In contrast to earlier studies which identified higher baseline (>1.67) TSH levels and elevated autoantibodies against TPO and Tg as predictors of hypothyroidism in cancer patients treated with ICIs [8,15], we did not observe significant differences in TSH, FT4, or anti-TPO/anti-Tg antibodies between patients who developed hypothyroidism and those who maintained normal thyroid function. These discrepancies may be attributed to differences in the study design.
A high PLR is a known marker of systemic inflammation that leads to an increased risk of hypothyroidism [11]. In our study, the risk of grade 2 and 3 hypothyroidism was associated with an increased baseline PLR in patients. Interestingly, when Liu W. et al. stratified patients into severe (grade 3–4) and mild (grade 1–2) forms of immune-related adverse events (ir-AEs), only severe ir-AEs, not mild ones, were associated with a decreased baseline PLR [11].
Additionally, we studied the associations between the development of hypothyroidism in cancer patients treated with ICIs and other baseline hematological indices—such as WBCs, neutrophils, lymphocytes, WBCs-neutrophils, the WHR, the NRR, and the NHR. Our results indicate that lower baseline levels of WBCs, neutrophils, lymphocytes, WBCs-neutrophils, the WHR, the NRR, and the NHR, were associated with an increased risk of hypothyroidism in ICI-treated patients. A lower baseline level of lymphocytes is likely the result of their exhaustion in cancer patients. We suppose that ICI treatment is exclusively effective against exhausted lymphocytes, which express high levels of PD-1 and CTLA-4. Unleashed lymphocytes vigorously attack thyroids, triggering hypothyroidism.
Recent studies demonstrate the potential clinical value of hemoglobin levels as a novel biomarker of immunotherapy responses [28]. The NHR, WHR, and NRR, the predictor potentials of which have not been evaluated in previous studies, capture both the inflammatory burden (neutrophils and white blood cells) and host reserve function (hemoglobin). Therefore, they can reflect the immune status of patients well and be used for the prognosis of hypothyroidism as an ICI treatment side effect.
Recent literature sources suggest cut-off values of >2 or >2.6, <6.5, and <534 for hematological markers associated with ir-AEs, namely the: lymphocyte count, neutrophil count, and PLR, respectively [24,29], vs. the respective values of ≤1.85, ≤4.57, and ≥222.97 in our study. These discrepancies with other studies [10,11,24,29] may be explained by variations in the study design, diverse cancer patient populations, sample size, or treatment protocols. For example, our study focused specifically on the risk of thyroid dysfunction- in contrast to others who have studied a broader spectrum of rheumatologic and non-rheumatologic ir-AEs and their association with hematological biomarkers [10,24].
CBCs provide a comprehensive profile of blood cells, which can reflect the patient’s immune status and systemic inflammation. The clinical significance of CBC biomarkers lies in the fact that they are simple to use and inexpensive. They will provide more stringent surveillance in high-risk patients, encourage early intervention, and adopt a personalized approach to their management. Our findings may help guide the early detection and monitoring of immune-related adverse events, such as hypothyroidism, in patients undergoing treatment with PD-1 or PD-1/CTLA-4 inhibitors. Highlighting the clinical relevance of these parameters could enhance their utility in personalized patient management.
We acknowledge the limitations of our study. First, this was a prospective study with manual data extraction from only two centers; the relatively small sample size may have introduced selection bias. The cohort encompassed certain cancer types with only a few cases represented, and the study was conducted with a genetically relatively homogeneous population.

5. Conclusions

Low baseline levels of lymphocytes, WBCs, WBCs-neutrophils, the WHR, the NRR, the NHR, and neutrophils and a high baseline PLR are associated with the risk of hypothyroidism in cancer patients treated with ICIs. These biomarkers may indicate early signs of the onset of autoimmune thyroiditis, helping physicians to more effectively monitor patients for initial signs of hypothyroidism and adopt a personalized approach to their management. Large-scale replicative studies are still needed to validate our results due to the limitations of this study.

Supplementary Materials

The following supporting information can be downloaded at: https://www.mdpi.com/article/10.3390/immuno5020021/s1.

Author Contributions

Conceptualization, M.G. and T.C.; methodology, N.K. and T.C.; software, N.K.; validation, N.K., T.C. and M.G.; formal analysis, K.L.; investigation, K.L.; resources, N.K.; data curation, K.L. and N.C.; writing—original draft preparation, K.L.; writing—review and editing, N.K. and T.C.; visualization, N.K.; supervision, N.K. and M.G.; project administration, K.L.; funding acquisition, K.L. All authors have read and agreed to the published version of the manuscript.

Funding

This work was supported by Shota Rustaveli National Science Foundation of Georgia (SRNSF) [Grant #PHDF-23-3839, Project Title: Study of predictive biomarkers of immune thyroiditis caused by immune check-point inhibitors treatment of malignancies].

Institutional Review Board Statement

The study was conducted in accordance with the Declaration of Helsinki and approved by the Biomedical Research Ethics Committee of Tbilisi State Medical University on 14 December 2020 (N6-2020/83).

Informed Consent Statement

Informed consent was obtained from all subjects involved in the study.

Data Availability Statement

The data is unavailable due to privacy.

Conflicts of Interest

The authors declare no conflicts of interest.

References

  1. Brown, J.S.; Amend, S.R.; Austin, R.H.; Gatenby, R.A.; Hammarlund, E.U.; Pienta, K.J. Updating the definition of cancer. Mol. Cancer Res. 2023, 21, 1142–1147. [Google Scholar] [CrossRef] [PubMed]
  2. Elhanani, O.; Ben-Uri, R.; Keren, L. Spatial profiling technologies illuminate the tumor microenvironment. Cancer Cell 2023, 41, 404–420. [Google Scholar] [CrossRef] [PubMed]
  3. Iwai, Y.; Hamanishi, J.; Chamoto, K.; Honjo, T. Cancer immunotherapies targeting the PD-1 signaling pathway. J. Biomed. Sci. 2017, 24, 26. [Google Scholar] [CrossRef] [PubMed]
  4. Shalit, A.; Sarantis, P.; Koustas, E.; Trifylli, E.M.; Matthaios, D.; Karamouzis, M.V. Predictive Biomarkers for Immune-Related Endocrinopathies following Immune Checkpoint Inhibitors Treatment. Cancers 2023, 15, 375. [Google Scholar] [CrossRef] [PubMed] [PubMed Central]
  5. Kurimoto, C.; Inaba, H.; Ariyasu, H.; Iwakura, H.; Ueda, Y.; Uraki, S.; Takeshima, K.; Furukawa, Y.; Morita, S.; Yamamoto, Y.; et al. Predictive and sensitive biomarkers for thyroid dysfunctions during treatment with immune-checkpoint inhibitors. Cancer Sci. 2020, 111, 1468–1477. [Google Scholar] [CrossRef] [PubMed] [PubMed Central]
  6. Wu, L.; Xu, Y.; Wang, X.; Cheng, X.; Zhang, Y.; Wang, Y.; Fan, X.; Zhao, H.; Liu, H.; Chai, X.; et al. Thyroid dysfunction after immune checkpoint inhibitor treatment in a single-center Chinese cohort: A retrospective study. Endocrine 2023, 81, 123–133. [Google Scholar] [CrossRef]
  7. Zhang, Y.; Zhang, X.; Li, W.; Du, Y.; Hu, W.; Zhao, J. Biomarkers and risk factors for the early prediction of immune-related adverse events: A review. Hum. Vaccines Immunother. 2022, 18, 2018894. [Google Scholar] [CrossRef] [PubMed] [PubMed Central]
  8. Maekura, T.; Naito, M.; Tahara, M.; Ikegami, N.; Kimura, Y.; Sonobe, S.; Kobayashi, T.; Tsuji, T.; Minomo, S.; Tamiya, A.; et al. Predictive factors of nivolumab-induced hypothyroidism in patients with non-small cell lung cancer. Vivo 2017, 31, 1035–1039. [Google Scholar] [CrossRef]
  9. Goyal, I.; Pandey, M.R.; Sharma, R.; Chaudhuri, A.; Dandona, P. The side effects of immune checkpoint inhibitor therapy on the endocrine system. Indian J. Med. Res. 2021, 154, 559–570. [Google Scholar] [CrossRef] [PubMed] [PubMed Central]
  10. Peng, L.; Wang, Y.; Liu, F.; Qiu, X.; Zhang, X.; Fang, C.; Qian, X.; Li, Y. Peripheral blood markers predictive of outcome and immune-related adverse events in advanced non-small cell lung cancer treated with PD-1 inhibitors. Cancer Immunol. Immunother. 2020, 69, 1813–1822. [Google Scholar] [CrossRef] [PubMed] [PubMed Central]
  11. Liu, W.; Liu, Y.; Ma, F.; Sun, B.; Wang, Y.; Luo, J.; Liu, M.; Luo, Z. Peripheral Blood Markers Associated with Immune-Related Adverse Effects in Patients Who Had Advanced Non-Small Cell Lung Cancer Treated with PD-1 Inhibitors. Cancer Manag. Res. 2021, 13, 765–771. [Google Scholar] [CrossRef] [PubMed]
  12. Seo, I.-H.; Lee, Y.-J. Usefulness of Complete Blood Count (CBC) to Assess Cardiovascular and Metabolic Diseases in Clinical Settings: A Comprehensive Literature Review. Biomedicines 2022, 10, 2697. [Google Scholar] [CrossRef] [PubMed]
  13. Zhou, J.; Du, Z.; Fu, J.; Yi, X. Blood cell counts can predict adverse events of immune checkpoint inhibitors: A systematic review and meta-analysis. Front. Immunol. 2023, 14, 1117447. [Google Scholar] [CrossRef] [PubMed]
  14. Bozdag, A.; Gundogan Bozdag, P. Evaluation of systemic inflammation markers in patients with Hashimoto’s thyroiditis. J. Int. Med. Res. 2024, 52, 9. [Google Scholar] [CrossRef]
  15. CLuongo, R.; Morra, C.; Gambale, T.; Porcelli, F.; Sessa, E.; Matano, V.; Damiano, M.; Klain, M.; Schlumberger, D. Salvatore Higher baseline TSH levels predict early hypothyroidism during cancer immunotherapy. J. Endocrinol. Investig. 2021, 44, 1927–1933. [Google Scholar] [CrossRef]
  16. Haanen, J.; Obeid, M.; Spain, L.; Carbonnel, F.; Wang, Y.; Robert, C.; Lyon, A.; Wick, W.; Kostine, M.; Peters, S.; et al. Management of toxicities from immunotherapy: ESMO Clinical Practice Guideline for diagnosis, treatment and follow-up. Ann. Oncol. 2022, 33, 1217–1238. [Google Scholar] [CrossRef]
  17. Schneider, B.J.; Naidoo, J.; Santomasso, B.D.; Lacchetti, C.; Adkins, S.; Anadkat, M.; Atkins, M.B.; Brassil, K.J.; Caterino, J.M.; Chau, I. Management of Immune-Related Adverse Events in patients treated with immune checkpoint inhibitor therapy: ASCO Guideline update. J. Clin. Oncol. 2021, 39, 4073–4126. [Google Scholar] [CrossRef]
  18. Robin, X.; Turck, N.; Hainard, A.; Tiberti, N.; Lisacek, F.; Sanchez, J.-C.; Müller, M. pROC: An open-source package for R and S+ to analyze and compare ROC curves. BMC Bioinform. 2011, 12, 77. [Google Scholar] [CrossRef]
  19. Posit Team. RStudio: Integrated Development Environment for R. Posit Software; PBC: Boston, MA, USA, 2025; Available online: http://www.posit.co/ (accessed on 2 April 2025).
  20. DeLong, E.R.; DeLong, D.M.; Clarke-Pearson, D.L. Comparing the Areas under Two or More Correlated Receiver Operating Characteristic Curves: A Nonparametric Approach. Biometrics 1988, 44, 837. [Google Scholar] [CrossRef]
  21. Youden, W.J. Index for rating diagnostic tests. Cancer 1950, 3, 32–35. [Google Scholar] [CrossRef]
  22. Perkins, N.J.; Schisterman, E.F. The inconsistency of “optimal” cut-points obtained using two criteria based on the receiver operating characteristic curve. Am. J. Epidemiol. 2006, 163, 670–675. [Google Scholar] [CrossRef] [PubMed]
  23. Michot, J.M.; Bigenwald, C.; Champiat, S.; Collins, M.; Carbonnel, F.; Postel-Vinay, S.; Berdelou, A.; Varga, A.; Bahleda, R.; Hollebecque, A.; et al. Immune-related adverse events with immune checkpoint blockade: A comprehensive review. Eur. J. Cancer 2016, 54, 139–148. [Google Scholar] [CrossRef] [PubMed]
  24. Michailidou, D.; Khaki, A.R.; Morelli, M.P.; Diamantopoulos, L.; Singh, N.; Grivas, P. Association of blood biomarkers and autoimmunity with immune related adverse events in patients with cancer treated with immune checkpoint inhibitors. Sci. Rep. 2021, 11, 9029. [Google Scholar] [CrossRef] [PubMed]
  25. Zhao, W.; Yang, Z.; Fei, Q.; Hu, X.; Ouyang, Y.; Yi, X.; Xie, S.; Wang, L.; Huang, X.; He, Y.; et al. Treatment-related adverse events, immune-related adverse events and discontinuation in patients with solid tumors adding adjuvant immune checkpoint blockade: A meta-analysis of 38 randomized controlled trials. Int. J. Surg. 2025; Epub ahead of print. [Google Scholar] [CrossRef] [PubMed]
  26. Klein-Brill, A.; Amar-Farkash, S.; Rosenberg-Katz, K.; Brenner, R.; Becker, J.C.; Aran, D. Comparative efficacy of combined CTLA-4 and PD-1 blockade vs. PD-1 monotherapy in metastatic melanoma: A real-world study. BJC Rep. 2024, 2, 14. [Google Scholar] [CrossRef]
  27. Zhan, L.; Feng, H.F.; Liu, H.Q.; Guo, L.T.; Chen, C.; Yao, X.L.; Sun, S.R. Immune Checkpoint Inhibitors-Related Thyroid Dysfunction: Epidemiology, Clinical Presentation, Possible Pathogenesis, and Management. Front. Endocrinol. 2021, 12, 649863. [Google Scholar] [CrossRef] [PubMed] [PubMed Central]
  28. He, Y.; Ren, T.; Ji, C.; Zhao, L.; Wang, X. The baseline hemoglobin level is a positive biomarker for immunotherapy response and can improve the predictability of tumor mutation burden for immunotherapy response in cancer. Front. Pharmacol. 2024, 15, 1456833. [Google Scholar] [CrossRef] [PubMed] [PubMed Central]
  29. Adam Diehl, A.; Yarchoan, M.; Hopkins, A.; Jaffee, E.; Stuart, A.; Grossman, S.A. Relationships between lymphocyte counts and treatment-related toxicities and clinical responses in patients with solid tumors treated with PD-1 checkpoint inhibitors. Oncotarget 2017, 8, 114268–114280. [Google Scholar] [CrossRef]
Figure 1. The ROC curve analyzes the prognostic role of complete blood count biomarkers in patients with hypothyroidism after ICIs therapy. ROC: the receiver operating characteristic.
Immuno 05 00021 g001
Table 1. Description of patients involved in the study.
Cancer TypePatient NumberFemale/MaleICI TherapyPretreatment
PD-1PD1/CTLA4
NSCLC27 (3)3/2 (0/3)Pembrolizumab 24 (1) Nivolumab 3 (2)0No
Ovarian Cancer7 (6)7/0 (6/0)0Nivolumab 1 (1)Ipilimumab + Nivolumab 6 (5)Paclitaxel/Carboplatine
Melanoma4 (3)4/0 (3/0)Pembrolizumab 2 (1) Nivolumab 2 (2)0No
Renal Cell Carcinoma2 (1)1/1 (1/0)0Nivolumab 2 (1)0No
Prostate Cancer2 (1)0/1 (0/1)Pembrolizumab 2 (1) 00Bicalutamide
Liver Cancer1 (1)0/1 (0/1)Pembrolizumab 1 (1) 00Sorafenib
Bladder Cancer1 (0)0/1 (0/0)Pembrolizumab 1 (0) 00No
In brackets, the number of patients who developed hypothyroidism are shown. All patients receive symptomatic treatment if needed.
Table 2. Comparison between the study groups’ baseline clinical and serological characteristics.
Group 1
(n = 15)
Group 2
(n = 29)
Group 3
(n = 14)
P1P2P3
Mean ± SDMean ± SDMean ± SD
Age (years) 63.6 ± 10.8462.23 ± 6.9657.5 ± 10.6NSNS0.34
F/M (%)66.67/33.3320.69/79.3180/20NSNSNS
TSH (N:0.4–4.0 µIU/mL)2.09 ± 1.191.68 ± 0.721.92 ± 0.720.8600.6680.303
HGB (N:12/13–15/17 g/dl)11.88 ± 1.1112.55 ± 1.9813.85 ± 1.490.007 *0.0540.428
RBC (N:3.9/4.1–5.2/5.7 × 106 cells/µL) 4.41 ± 0.764.49 ± 0.624.63 ± 0.550.6200.7730.919
WBC (N:4–9 × 10³ cells/µL) 6.36 ± 2.0711.07 ± 5.357.31 ± 1.260.8010.0150.001 *
Neutrophils
(N: 2–7 × 10³cells/µL)
4.29 ± 1.557.87 ± 4.594.50 ± 1.050.9850.0100.005 *
Lymphocytes
(N: 0.8–4 × 10³cells/µL)
1.23 ± 0.412.06 ± 1.062.10 ± 0.530.0190.9880.008 *
Platelets
(N: 150–350 × 109 cells/L)
269.60 ± 78.46294.79 ± 102.49264.57 ± 55.460.9870.5410.639
WBC-Neutrophils
(103 cells/µL)
2.07 ± 0.663.20 ± 1.432.81 ± 0.640.1910.5290.007 *
dNLR 2.13 ± 0.662.72 ± 1.791.69 ± 0.690.6620.0610.370
SII 1073.26 ± 667.461268.07 ± 1082.27656.93 ± 462.330.4100.0880.763
NLR 3.80 ± 1.734.70 ± 4.042.33 ± 1.160.4080.0550.630
PLR 262.25 ± 162.95172.00 ± 88.73138.58 ± 67.510.009 *0.6150.031
WHR 0.54 ± 0.190.88 ± 0.430.53 ± 0.110.9980.004 *0.004 *
NRR 0.96 ± 0.281.77 ± 1.090.97 ± 0.240.9990.0100.007 *
NHR 0.36 ± 0.140.62 ± 0.370.32 ± 0.080.9310.005 *0.012
PHR 22.92 ± 7.2124.53 ± 10.8319.21 ± 4.150.4950.1590.833
FT4 (N: 12–22 pmol/L) 16.16 ± 2.0016.76 ± 2.7016.04 ± 2.300.9920.6650.797
Anti–TPO antibodies (N: <30 IU/mL)16.87 ± 7.8819.31 ± 11.398.39 ± 3.860.0700.003 *0.757
Anti–Tg antibodies (N: <95IU/mL)34.69 ± 17.4540.09 ± 21.6018.06 ± 5.270.002 *0.0640.694
Group 1—patients who developed hypothyroidism after ICI therapy; Group 2—patients who maintained normal TFTs after ICI therapy; Group 3—control group of healthy subjects. F: female; M: male; NS: nonsignificant; NLR: neutrophils-to-lymphocytes ratio; PLR: platelets-to-lymphocytes ratio; dNLR: derived neutrophils-to-lymphocytes ratio; WHR: white blood cells-to-hemoglobin ratio; HGB: hemoglobin; WBCs: whole blood cells; NHR: neutrophils-to-hemoglobin ratio; PHR: platelet-to-hemoglobin ratio; NRR: neutrophils-to-red blood cell ratio; RBC: red blood cell; TSH: thyroid stimulating hormone; FT4: free thyroxine; anti-TPO antibodies: anti-thyroid peroxidase antibodies; anti-Tg antibodies: anti-thyroidglobulin antibodies. P1: Group 1 vs. Group 3; P2: Group 2 vs. Group 3; P3: Group 1 vs. Group 2. * The mean difference is significant at the 0.05 level.
Table 3. The results of ROC curve analysis of whole blood cell count-derived biomarkers.
Test Result VariablesAUCSensitivity with 95% CISpecificity with 95% CICut-Off Value
WBC0.90.8 (0.5–1)0.95 (0.86–1)≤6.6
Neutrophils0.880.8 (0.5–1)0.91 (0.77–1)≤4.57
Lymphocytes0.841 (1–1)0.68 (0.45–0.86)≤1.85
WBCs-neutrophils0.851 (1–1)0.68 (0.45–0.86)≤2.59
PLR0.840.7 (0.4–0.9)0.86 (0.73–1)≤222.97
WHR0.920.8 (0.5–1)0.95 (0.86–1)≤0.52
NRR0.890.9 (0.7–1)0.82 (0.64–0.95)≤1.06
NHR0.870.7 (0.4–1)0.95 (0.86–1)≤0.34
ROC: receiver operating characteristic; AUC: area under curve; CI: confidence interval WBC: whole blood cells; PLR: platelets-to-lymphocytes ratio; WHR: whole blood cells-to-hemoglobin ratio; NRR: neutrophils-to-red blood cells ratio; NHR: neutrophils-to-hemoglobin ratio.
Disclaimer/Publisher’s Note: The statements, opinions and data contained in all publications are solely those of the individual author(s) and contributor(s) and not of MDPI and/or the editor(s). MDPI and/or the editor(s) disclaim responsibility for any injury to people or property resulting from any ideas, methods, instructions or products referred to in the content.

