Article

Dynamics of Peripheral Lymphocyte Subsets from Birth until Old Age

by
Nawal A. B. Taher
1,2,
Johana M. Isaza-Correa
2,3,
Ashanty M. Melo
1,2,3,
Lynne A. Kelly
2,3,4,
Alhanouf I. Al-Harbi
1,2,†,
Mary I. O’Dea
2,3,4,5,6,7,
Zunera Zareen
2,3,4,
Emer Ryan
2,3,4,5,8,
Murwan Omer
2,3,4,5,6,7,
Liam Townsend
2,9,10,
Eleanor J. Molloy
2,3,4,5,6,7 and
Derek G. Doherty
1,2,*
1
Discipline of Immunology, School of Medicine, Trinity College Dublin, D08 W9RT Dublin, Ireland
2
Trinity Translational Medicine Institute, Trinity College Dublin, D08 W9RT Dublin, Ireland
3
Discipline of Paediatrics, School of Medicine, Trinity College Dublin, D08 W9RT Dublin, Ireland
4
Trinity Research in Childhood Centre (TRiCC), Trinity College Dublin, D08 W9RT Dublin, Ireland
5
Paediatrics, Children’s Hospital Ireland at Tallaght & Crumlin, D24 TN3C Dublin, Ireland
6
Paediatrics, Coombe Women and Infants University Hospital, D08 XW7X Dublin, Ireland
7
Neonatology, National Children’s Research Centre, Crumlin, D12 N512 Dublin, Ireland
8
Children’s Health Ireland at Temple Street, D01 XD99 Dublin, Ireland
9
Department of Infectious Diseases, St. James’s Hospital, D08 NHY1 Dublin, Ireland
10
Discipline of Clinical Medicine, School of Medicine, Trinity College Dublin, D08 W9RT Dublin, Ireland
*
Author to whom correspondence should be addressed.
Current address: Department of Medical Laboratory Technology, College of Applied Medical Sciences, Taibah University, Yanbu 46411, Saudi Arabia.
Immuno 2024, 4(4), 358-373; https://doi.org/10.3390/immuno4040023
Submission received: 9 August 2024 / Revised: 27 September 2024 / Accepted: 8 October 2024 / Published: 10 October 2024
(This article belongs to the Section Acquired Immunity)

Abstract

The immune system is inexperienced before birth and tends to be tolerogenic, rather than immunogenic. After birth, the adaptive immune system develops while facing microbial challenges, but it can become impaired as old age progresses and persistent inflammation can lead to chronic morbidity, disability and frailty. To investigate the potential contributions of lymphocyte subsets to immunity from birth until old age, we enumerated circulating innate and conventional lymphocytes and measured serum cytokine levels in 10 cord blood samples and in peripheral blood from 10 healthy term neonates, 23 healthy school-age children, 25 young adults and 11 older subjects. Flow cytometric analysis revealed that B cell frequencies increase during childhood and gradually decrease into adulthood, whereas natural killer cell frequencies increase throughout life. T cell frequencies remained relatively constant throughout life, as did their expression of CD4 and CD8. However, all four innate T cell populations studied—invariant natural killer T cells, mucosa-associated invariant T cells and the Vδ1 and the Vδ2 subsets of γδ T cells—were extremely rare in cord blood and in peripheral blood of neonates, but they expanded after birth reaching highest levels in adulthood. Analysis of serum cytokine levels revealed that proinflammatory and T helper type 1 (Th1) cytokine levels increase in adulthood, whereas Th2 and Th17 cytokine levels remain relatively constant. These changes in lymphocyte numbers and cytokine levels across the lifetime are likely to affect immunocompetence, leaving newborn and elderly people susceptible to infection, cancer and immune-mediated disease.

1. Introduction

Many factors affect the functionality of the innate and adaptive immune systems. Environmental conditions, exposure to infectious diseases, nutrition, pharmacologic interventions, psychological stress, quality of sleep and chronological age are some of the most studied [1,2,3,4,5,6]. The latter has been extensively investigated and usually describes differences in the immune response in the main three phases of life—infancy, adulthood and old age [1,7,8,9,10]. The immune system is inexperienced before birth, with a tendency to be tolerogenic rather than immunogenic in healthy term pregnancies. It is driven by innate responses, while maturation of the adaptive immune system awaits completion of T and B cell maturation. The adaptive immune system develops throughout childhood and adulthood while facing microbial challenges; however, the immune system frequently undergoes significant changes at the later stages of life, characterised by increased activation and release of proinflammatory mediators, T cell senescence and reductions in T and B cell diversity [11,12,13,14].
Adaptive immune responses are controlled by T and B lymphocytes, which express a diverse array of clonotypic antigen receptors. Antigenic exposure to fetal and neonatal T cells is mainly limited to self and maternal antigens, leading naive T cells to die by negative selection in the thymus or to develop into Foxp3+ CD25+ regulatory T (Treg) cells, which suppress effector T cell responses [15,16]. B cells also function at reduced capacity in neonates, in part due to low expression of stimulatory receptors, lack of somatic hypermutation, impaired plasmablast differentiation and survival and predominance of low-affinity IgM-producing cells [17,18,19]. Other subpopulations of lymphocytes, such as innate lymphocytes—natural killer (NK) cells, γδ T cells, invariant natural killer T (iNKT) cells and mucosa-associated invariant T (MAIT) cells—have distinct distributions in neonates compared to adults [20,21,22,23,24].
After birth, mature CD4+ and CD8+ T cells populate the circulation and clonally expand in response to environmental antigens [25,26]. Microbiome colonization of the gut, respiratory tract and skin has been linked to activation, regulation and epigenetic reprogramming of T and B cells [1,27]. Treg cell numbers decline, while naive T cell and memory T helper type 1 (Th1), Th2 and Th17 cells increase in number. Immunoglobulin class switching and somatic hypermutation in B cells favour the production of high-affinity antibodies, which are more effective at neutralising potential pathogens. Throughout childhood and adulthood, the individual will develop a repertoire of memory T and B cells, which will reflect previous infections, vaccination history and their own genetic variability. Maintenance of memory cells during the lifetime appears to be boosted by asymptomatic viral infections, such as influenza, cytomegalovirus, Epstein–Barr virus and others [1,27,28].
At older ages, the immune response deteriorates progressively. Increased gut permeability, changes to microbiota and chronic infections lead to changes in antigenic exposure, while cellular senescence, oxidative stress and alterations in inflammasome and NF-κB signalling lead to immune cell dysregulation [11,13]. Furthermore, persistent inflammation, known as inflammageing, is associated with chronic morbidity, disability and frailty [11,13,29,30]. The thymus undergoes a progressive reduction in size leading to decreased production of naïve T cells, a reduction in T cell diversity, and accumulation of senescent T cells [14,31]. The peripheral B cell pool also accumulates antigen-experienced memory cells and reduced numbers of naïve B cells, resulting in a limited diversity and increased production of non-specific antibodies [12]. Compared to younger individuals, T cells, NK cells, NKT cells and γδ T cells from older individuals exhibit altered interferon-γ (IFN-γ) production and cytotoxicity [32,33].
In the present study, we explore how the repertoires of human lymphocytes behave in healthy humans across ages by comparing cohorts of healthy donors from different age groups. Cord blood and peripheral blood from neonates, school-age children, young adults and elderly subjects were evaluated to determine numerical changes in B cells, NK cells and different subpopulations of T cells, and serum samples were analysed for levels of cytokines that are typically released by lymphoid cells.

2. Materials and Methods

2.1. Ethical Approval

Ethical committee approval for the study of blood samples from neonates and children was granted from the Coombe Women & Infants University Hospital and the National Children’s Hospital, Tallaght. Informed written consent was obtained from all parents of the children who took part in the study. Ethical approval for the use of blood samples from healthy adults was obtained from the Research Ethics Committee of St. James’s and Tallaght Hospitals and informed consent was obtained from all donors.

2.2. Study Participants

Cord blood was obtained from 10 healthy term neonates and venous blood and serum samples were obtained in the first day of life from 17 healthy neonates. All neonates had normal neurological examination at birth and normal Apgar scores, used to summarise the health of newborn children. Neonates with congenital anomalies or evidence of maternal substance abuse were excluded. Blood and serum samples were also obtained from 23 healthy school-age children (aged 1–16 years) coming for day case surgeries or undergoing phlebotomy, from 25 young adults (aged 23–45 years) working at St. James’s Hospital, and from 11 older subjects (aged 71–92) attending St. James’s Hospital following a fall (n = 4), intracranial haemorrhage (n = 1), heart failure (n = 1), abdominal pain (n = 1) or cognitive issues (n = 4). All subjects had no history of chronic infection or immune-mediated illnesses.

2.3. Blood Sampling

Whole blood samples were collected in sodium citrate blood tubes and processed within 2 h of acquisition. Serum samples were collected and centrifugated at 450× g for 5 min and the supernatants were stored at −80 °C until batch cytokine analysis was carried out.

2.4. Lymphocyte Subset Enumeration and Phenotyping

Whole blood (50–100 µL) was stained for 15 min in the dark at room temperature with a live/dead cell stain (Fixable Viability Dye eFlour 506, Invitrogen, Renfrew, UK) diluted 1/1000 with phosphate-buffered saline (PBS). Cells were then washed with PBS and incubated with a human FcR blocking reagent (Miltenyi Biotec, Bergisch Gladbach, Germany) followed by staining them for 15 min at room temperature with monoclonal antibodies (mAbs) specific for CD3 (clones UCHT1 or BW264/56), CD4 (OKT4), CD8 (SK1), CD19 (HIB19), CD56 (HCD56), CD69 [FN50], CD161 (HP-3G10), and the Vα7.2 (clone REA179), Vα24Jα18 (6B11), Vδ1 [REA173] and Vδ2 [B6] T cell receptors (TCRs) found on MAIT cells, invariant NKT (iNKT) cells and the two most common subsets of human γδ cells, respectively. mAbs were purchased from BioLegend (Amsterdam, Netherlands) and Miltenyi Biotec and were diluted to pre-determined concentrations in PBA buffer (PBS containing 2% fetal calf serum and 0.02% sodium azide). After staining, cells were washed twice in PBA buffer and erythrocytes were lysed in 1 mL FACS lysis buffer (BD Biosciences, Wokingham, UK). Finally, the cells were washed with PBA buffer, fixed with 1% paraformaldehyde and analysed on a Becton Dickinson FACSCanto II flow cytometer. Unstained and fluorescence-minus-one controls were included to define gate limits. Data were analysed using FlowJo v10.8.1 software (BD Biosciences). T cells were defined as CD3+ cells. NK cells were defined as CD3- CD56+ cells, and B cells were defined as CD3- CD19+ cells. MAIT cells were defined as CD3+ Vα7.2+ CD161+ cells, and iNKT cells were defined as CD3+ Vα24Jα18+ cells. Vδ1 and Vδ2 T cells were defined as cells expressing CD3 and Vδ1 or Vδ2 TCRs, respectively. The gating strategy used for enumeration of the different cell populations is shown in Figure 1.

2.5. Measurement of Serum Cytokine Levels

Serum cytokine levels of IFN-γ, tumour necrosis factor-α (TNF-α), interleukin-2 (IL-2), IL-4, IL-5, IL-6, IL-8, IL-9, IL-10, IL-15, IL-17A, IL-21, IL-22 and IL-23 were analysed using the U Plex biomarker group 1 (human) multiplex assay purchased from Mesoscale Discovery, according to the manufacturers’ instructions. This method employs a 96-well sandwich immunoassay which can quantify up to 10 analytes in 25 µL samples. The limits of detection for the individual cytokines were within expected ranges (<1 pg/mL; www.meso-scale.com (accessed on 30 July 2024).

2.6. Statistical Methods

Statistical analysis was performed using GraphPad Prism Version 9.0 (GraphPad Prism, San Diego, CA, USA). Kruskal–Wallis testing (non-parametric 1-way ANOVA) with Dunn’s multiple comparison testing analysis was used to compare multiple groups. p values of <0.05 were considered statistically significant.

3. Results

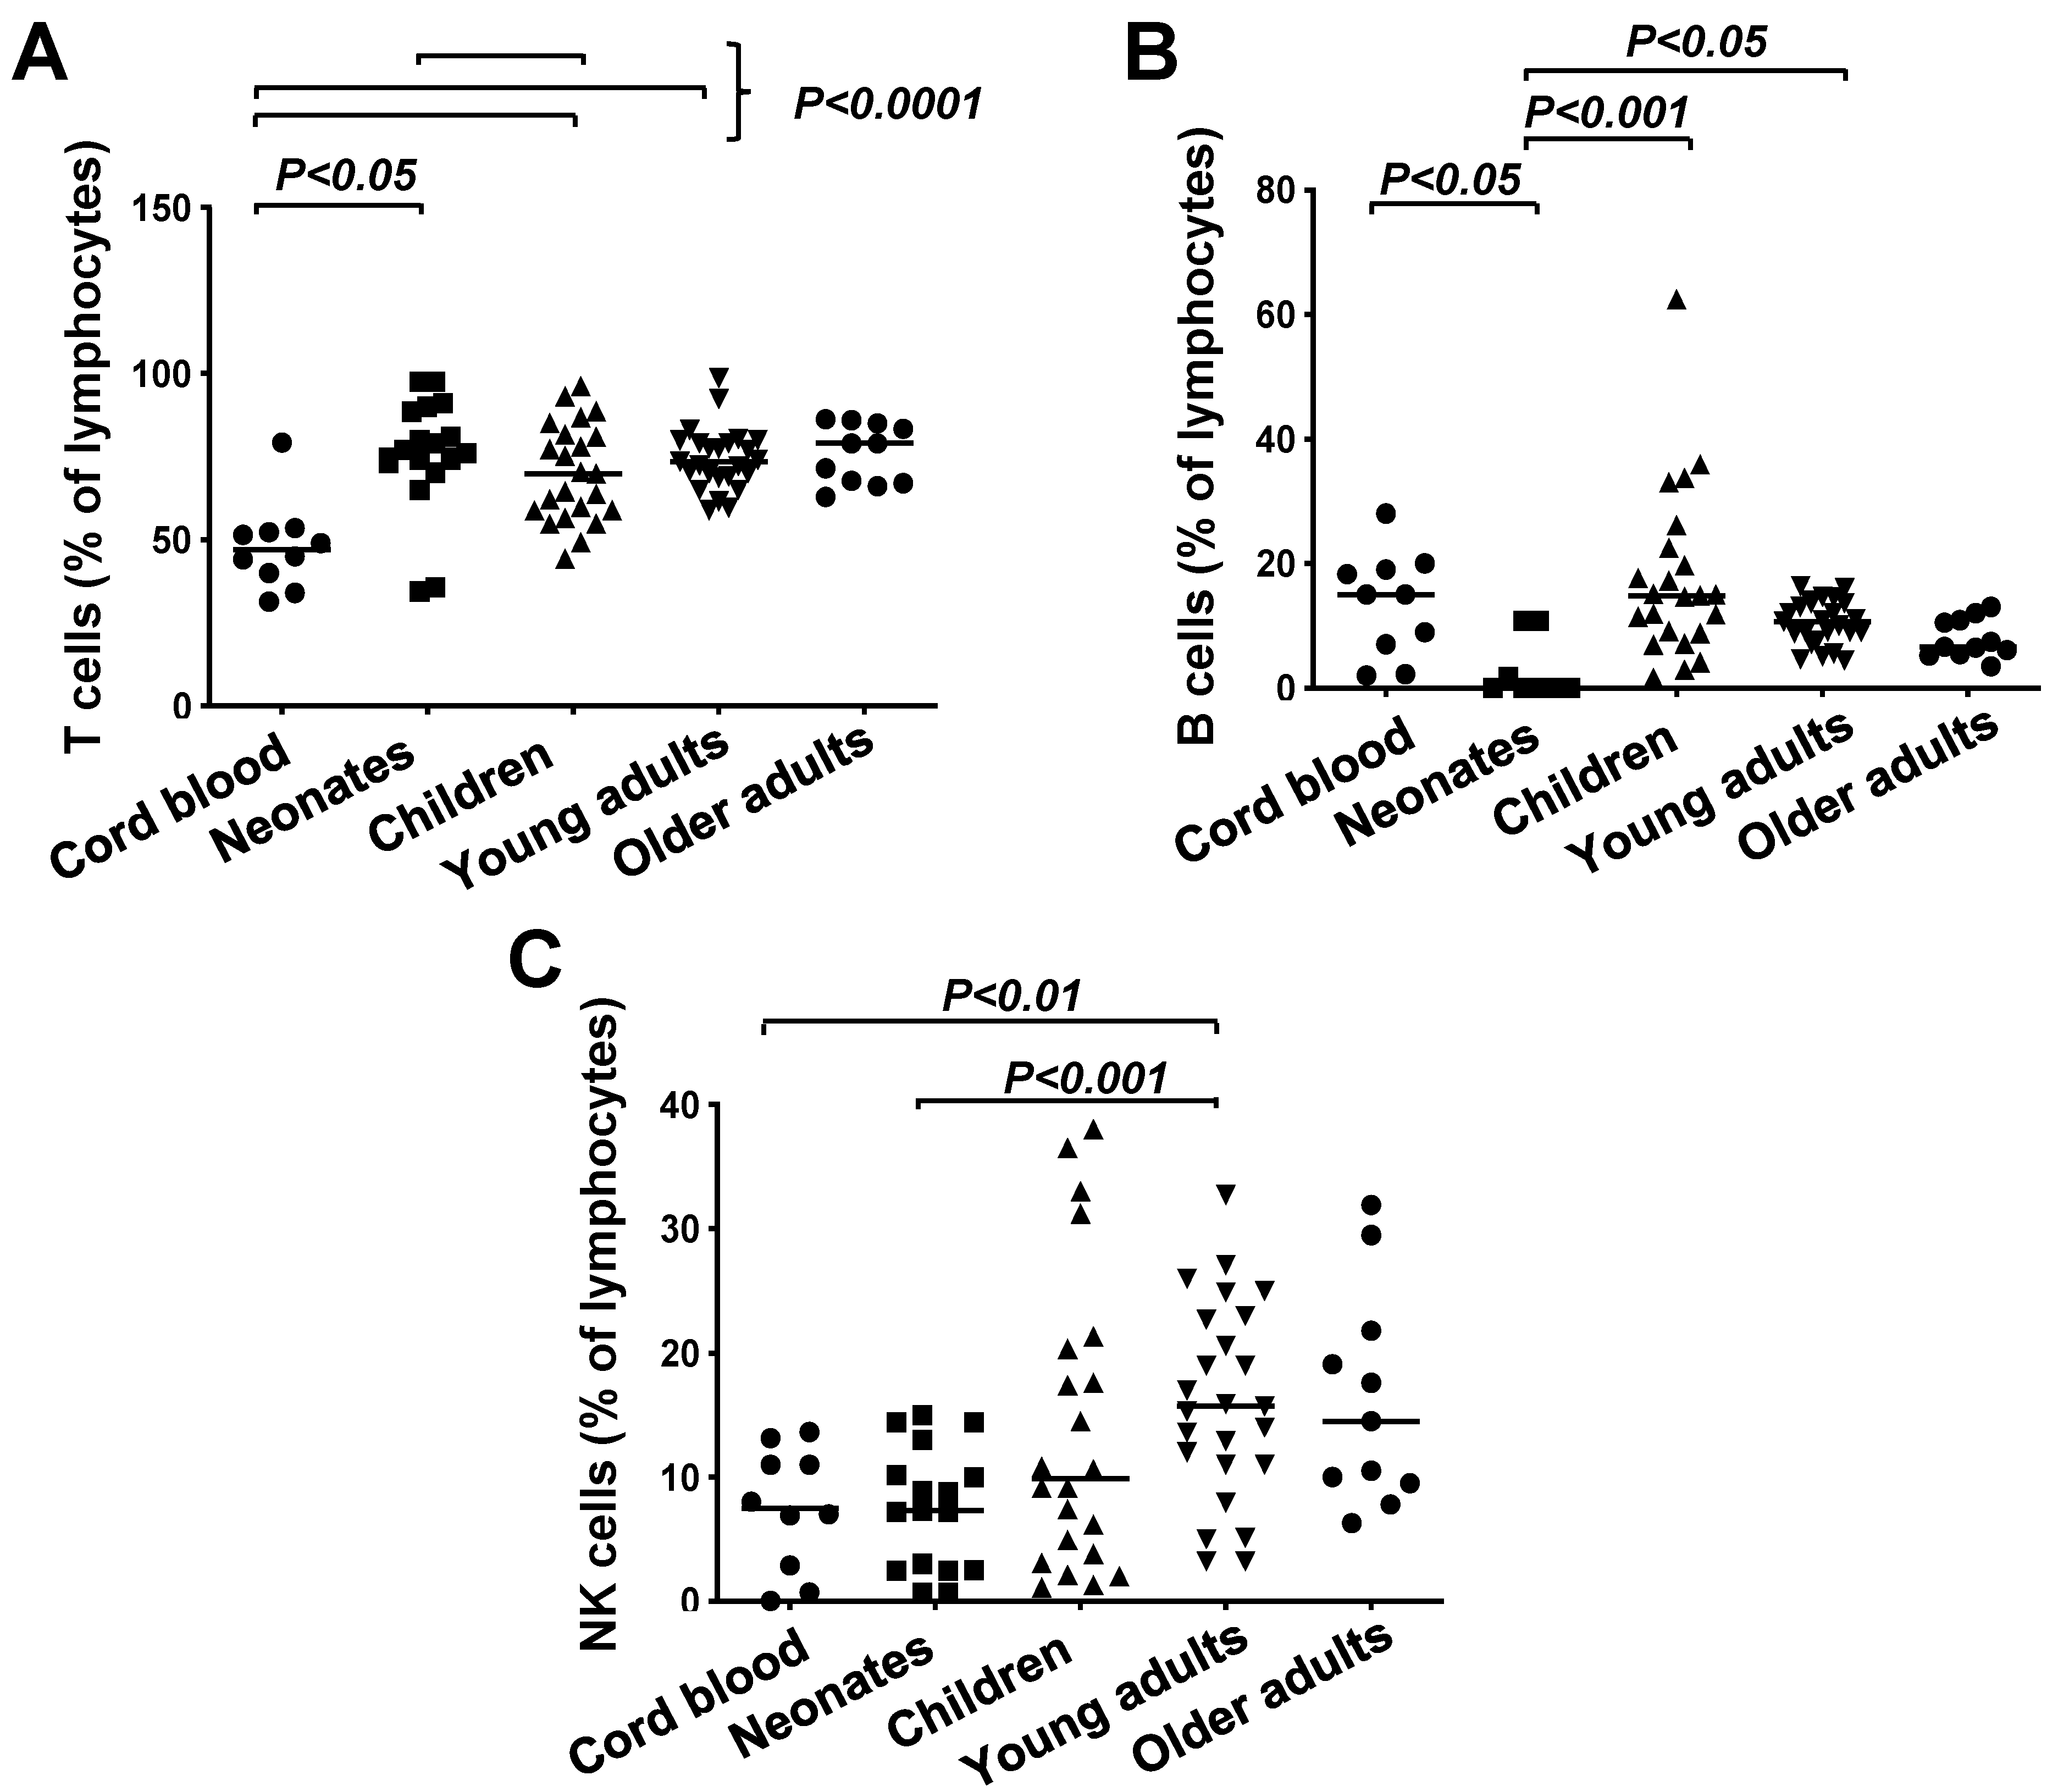
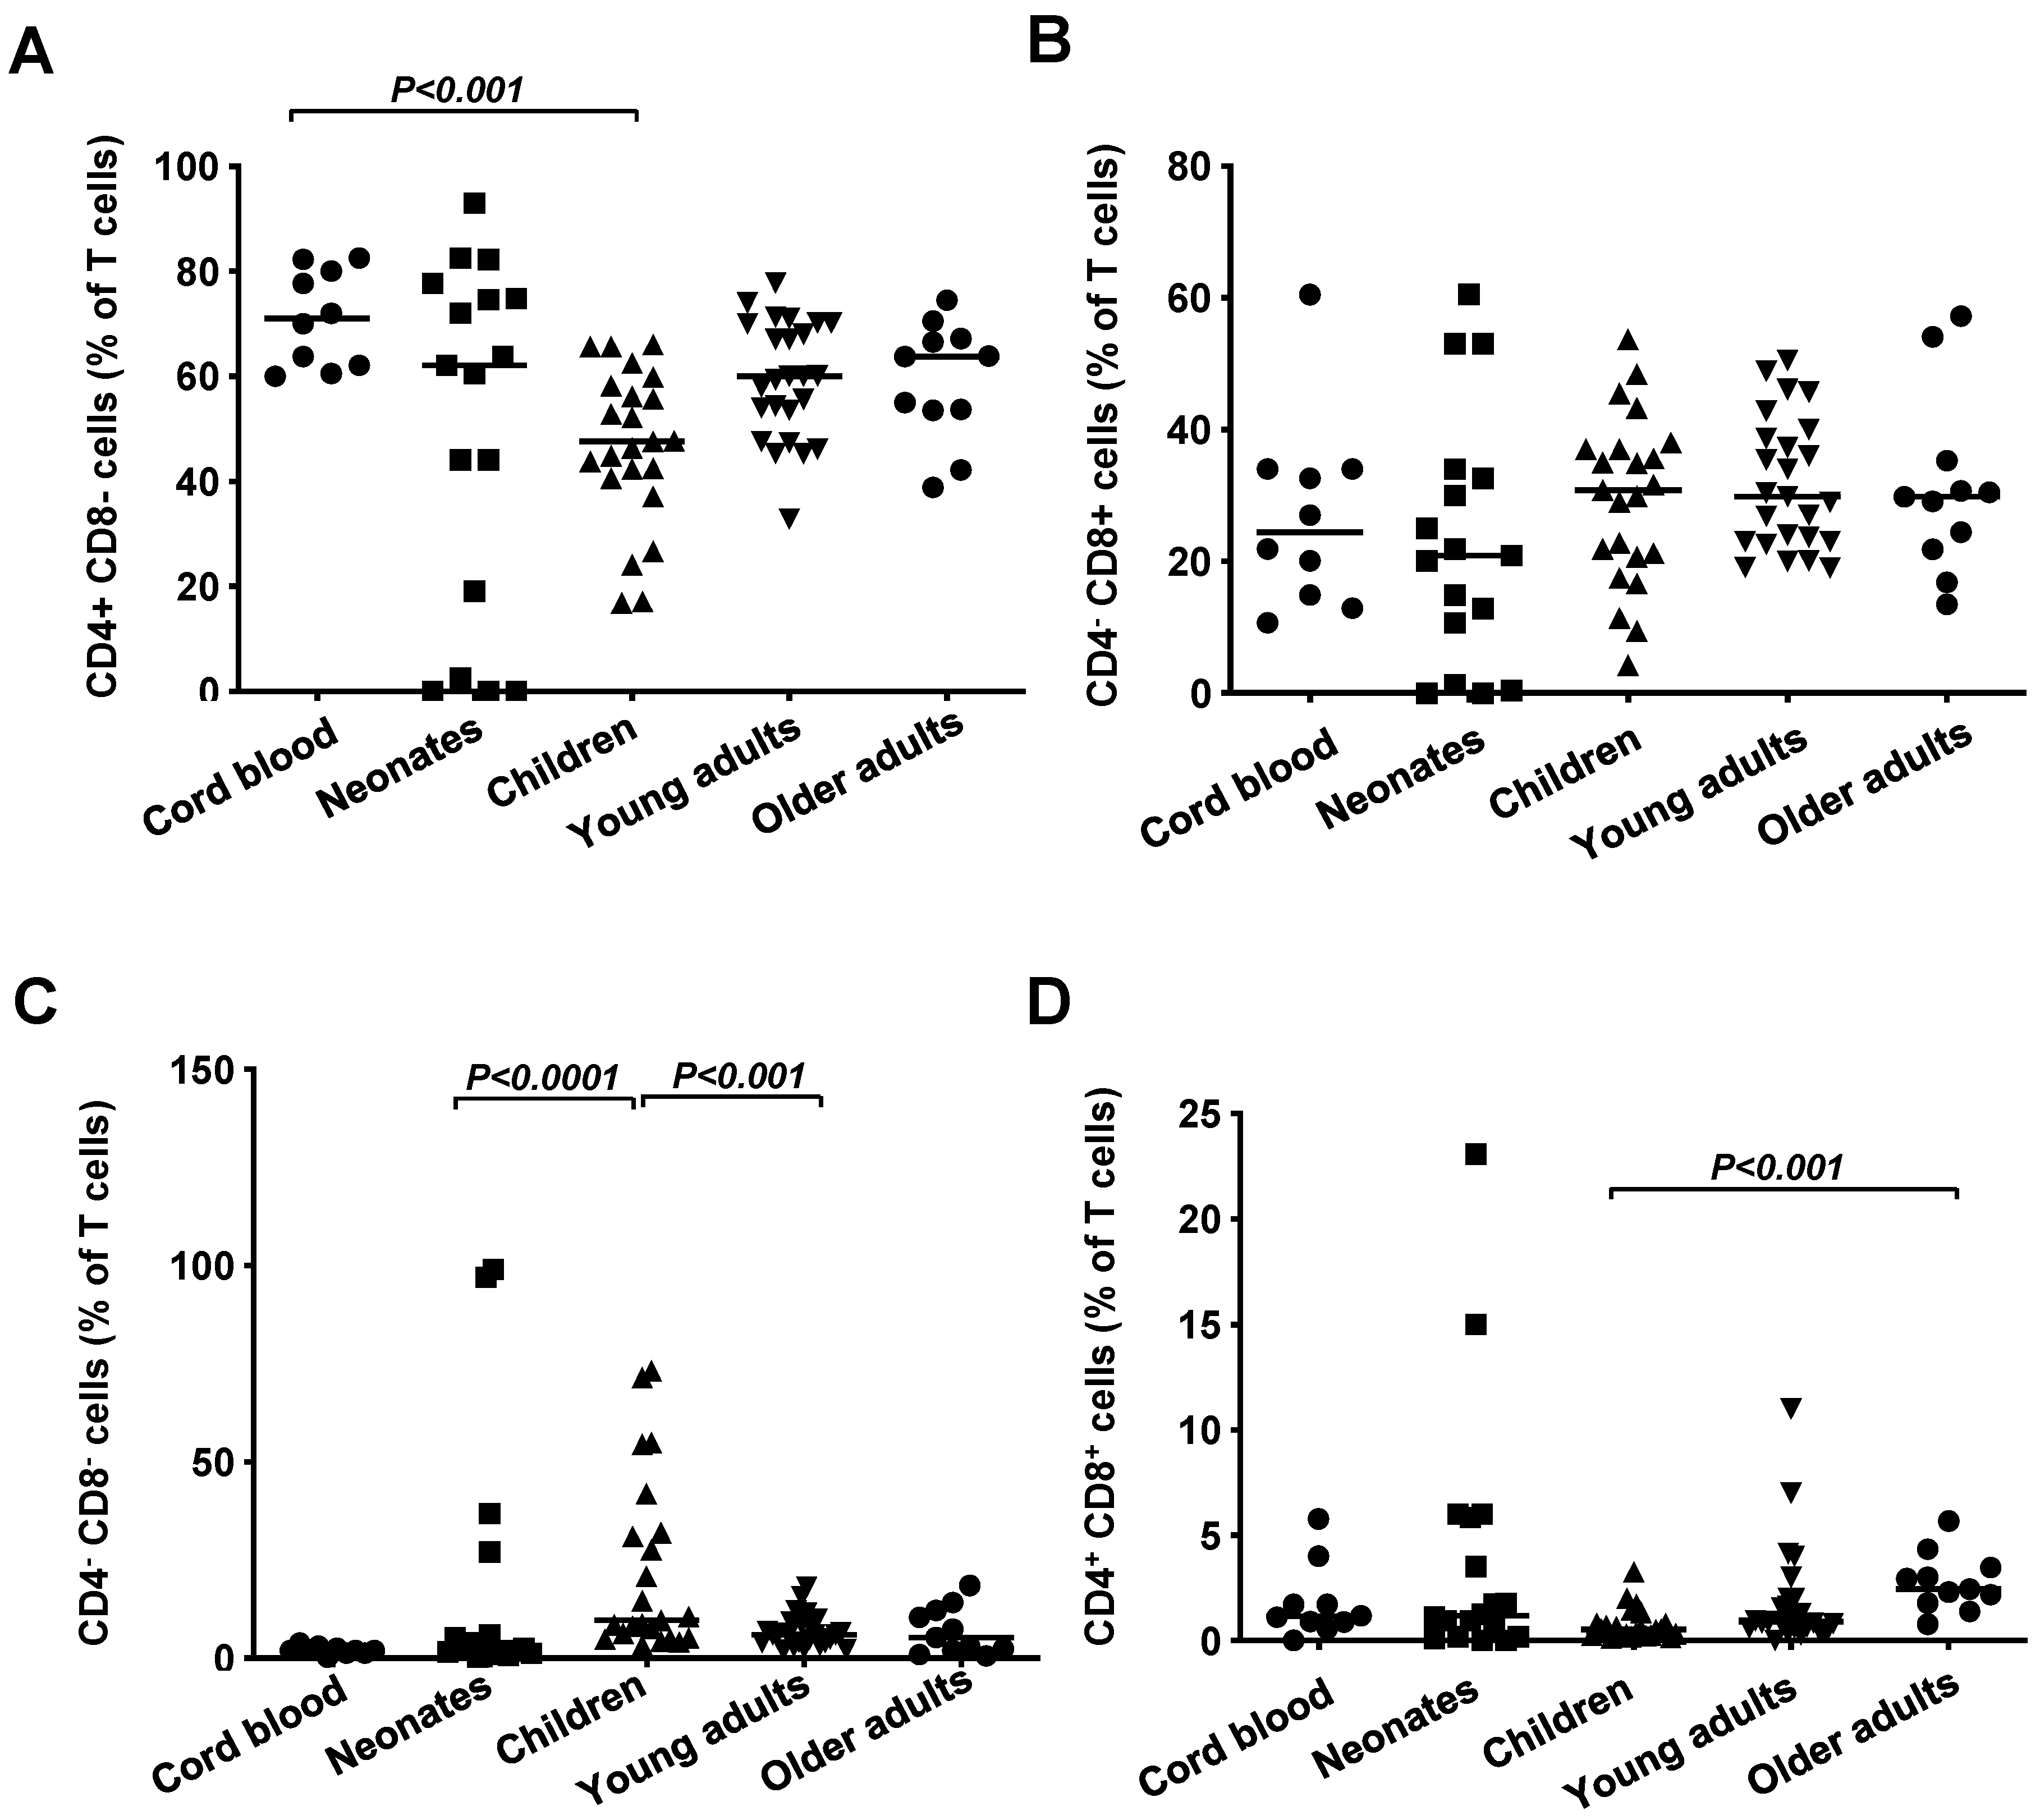
3.1. Frequencies of T Cells, B Cells and NK Cells in Healthy Subjects Grouped According to Age

Whole blood was stained with mAbs specific for CD3, CD4, CD8, CD19 and CD56 and analysed by flow cytometry. After excluding dead cells and doublets, T cells, B cells and NK cells were enumerated as percentages of total lymphocytes. Figure 2A,B show that the frequencies of T cells were lower and the frequencies of B cells were higher in cord blood compared with those in peripheral blood of neonates. T cell frequencies remained relatively constant throughout life, whereas B cell frequencies increased after birth, peaking at school age (p < 0.01) and then declining gradually throughout adulthood. NK cell frequencies were similar in cord blood and in neonatal peripheral blood, accounting for up to 15% of lymphocytes, and they increased throughout life with up to 40% of lymphocytes bearing NK cell phenotypes in young adults (p < 0.001; Figure 2C). When the frequencies of T cells, B cells and NK cells were compered between males and females in each age group, no significant differences were observed. These results show that T cell, B cell and NK cell frequencies fluctuate with age, and are likely to lead to age-related changes in immunocompetence.
T cells were further examined for CD4 and CD8 positivity to assess whether there were variations in helper (CD4+), cytotoxic (CD8+) and unconventional (CD4+ CD8+ and CD4- CD8-) T cells in the different age groups. Whole blood was stained with mAbs specific for CD3, CD4 and CD8 and analysed by flow cytometry. After gating on live singlet CD3+ lymphocytes, the frequencies of CD4+, CD8+, CD4+ CD8+ and CD4- CD8-, as percentages of total CD3+ cells, were determined. Figure 3 shows that the frequencies of all populations of T cells were similar at all stages of life, except with a significant decrease in CD4+ T cell frequencies (p < 0.001) and increase in CD4- CD8- T cell frequencies (p < 0.0001) seen in school-age children, and an increase in CD4+ CD8+ T cells (p < 0.001) observed in older adults. Therefore, while conventional T cell repertoires are known to change throughout life, this is not reflected in overall frequencies of helper and cytotoxic T cells. In contrast, the frequencies of unconventional T cells, defined as T cells that are negative for CD4 and CD8 or positive for both co-receptors, appear to change with age. Comparisons of the cell frequencies between males and females in each age group did not reveal any significant differences.

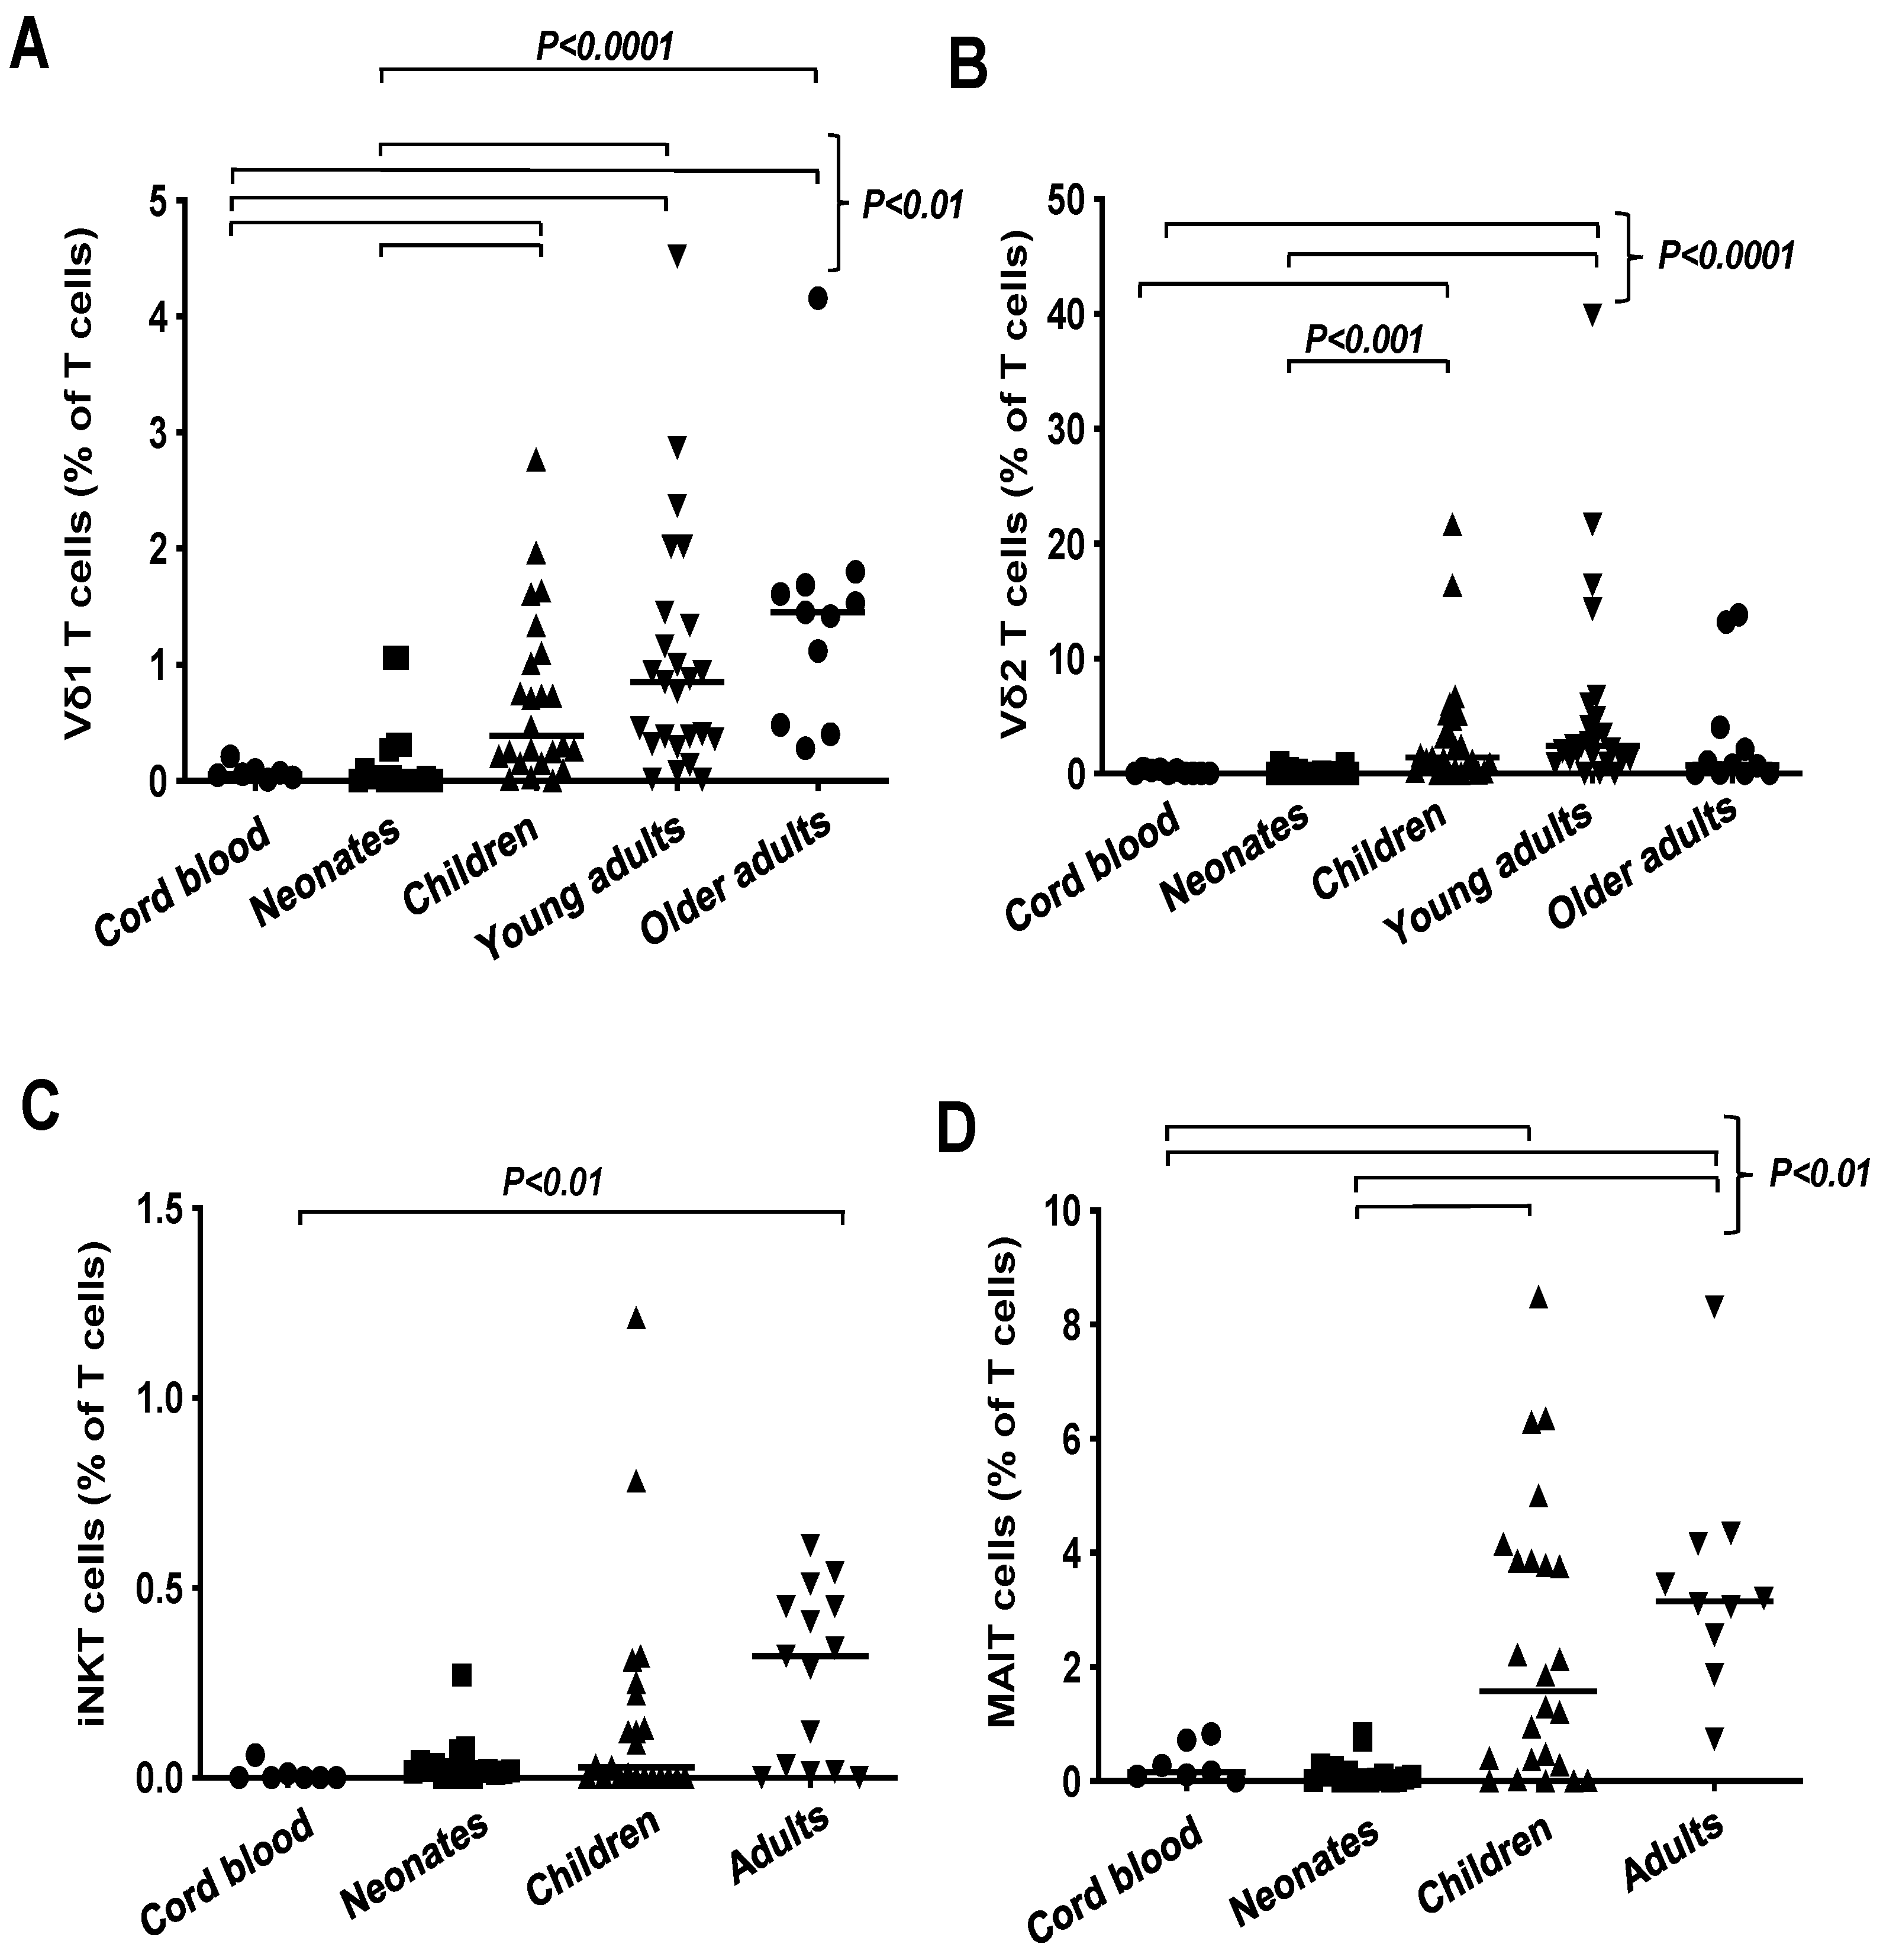
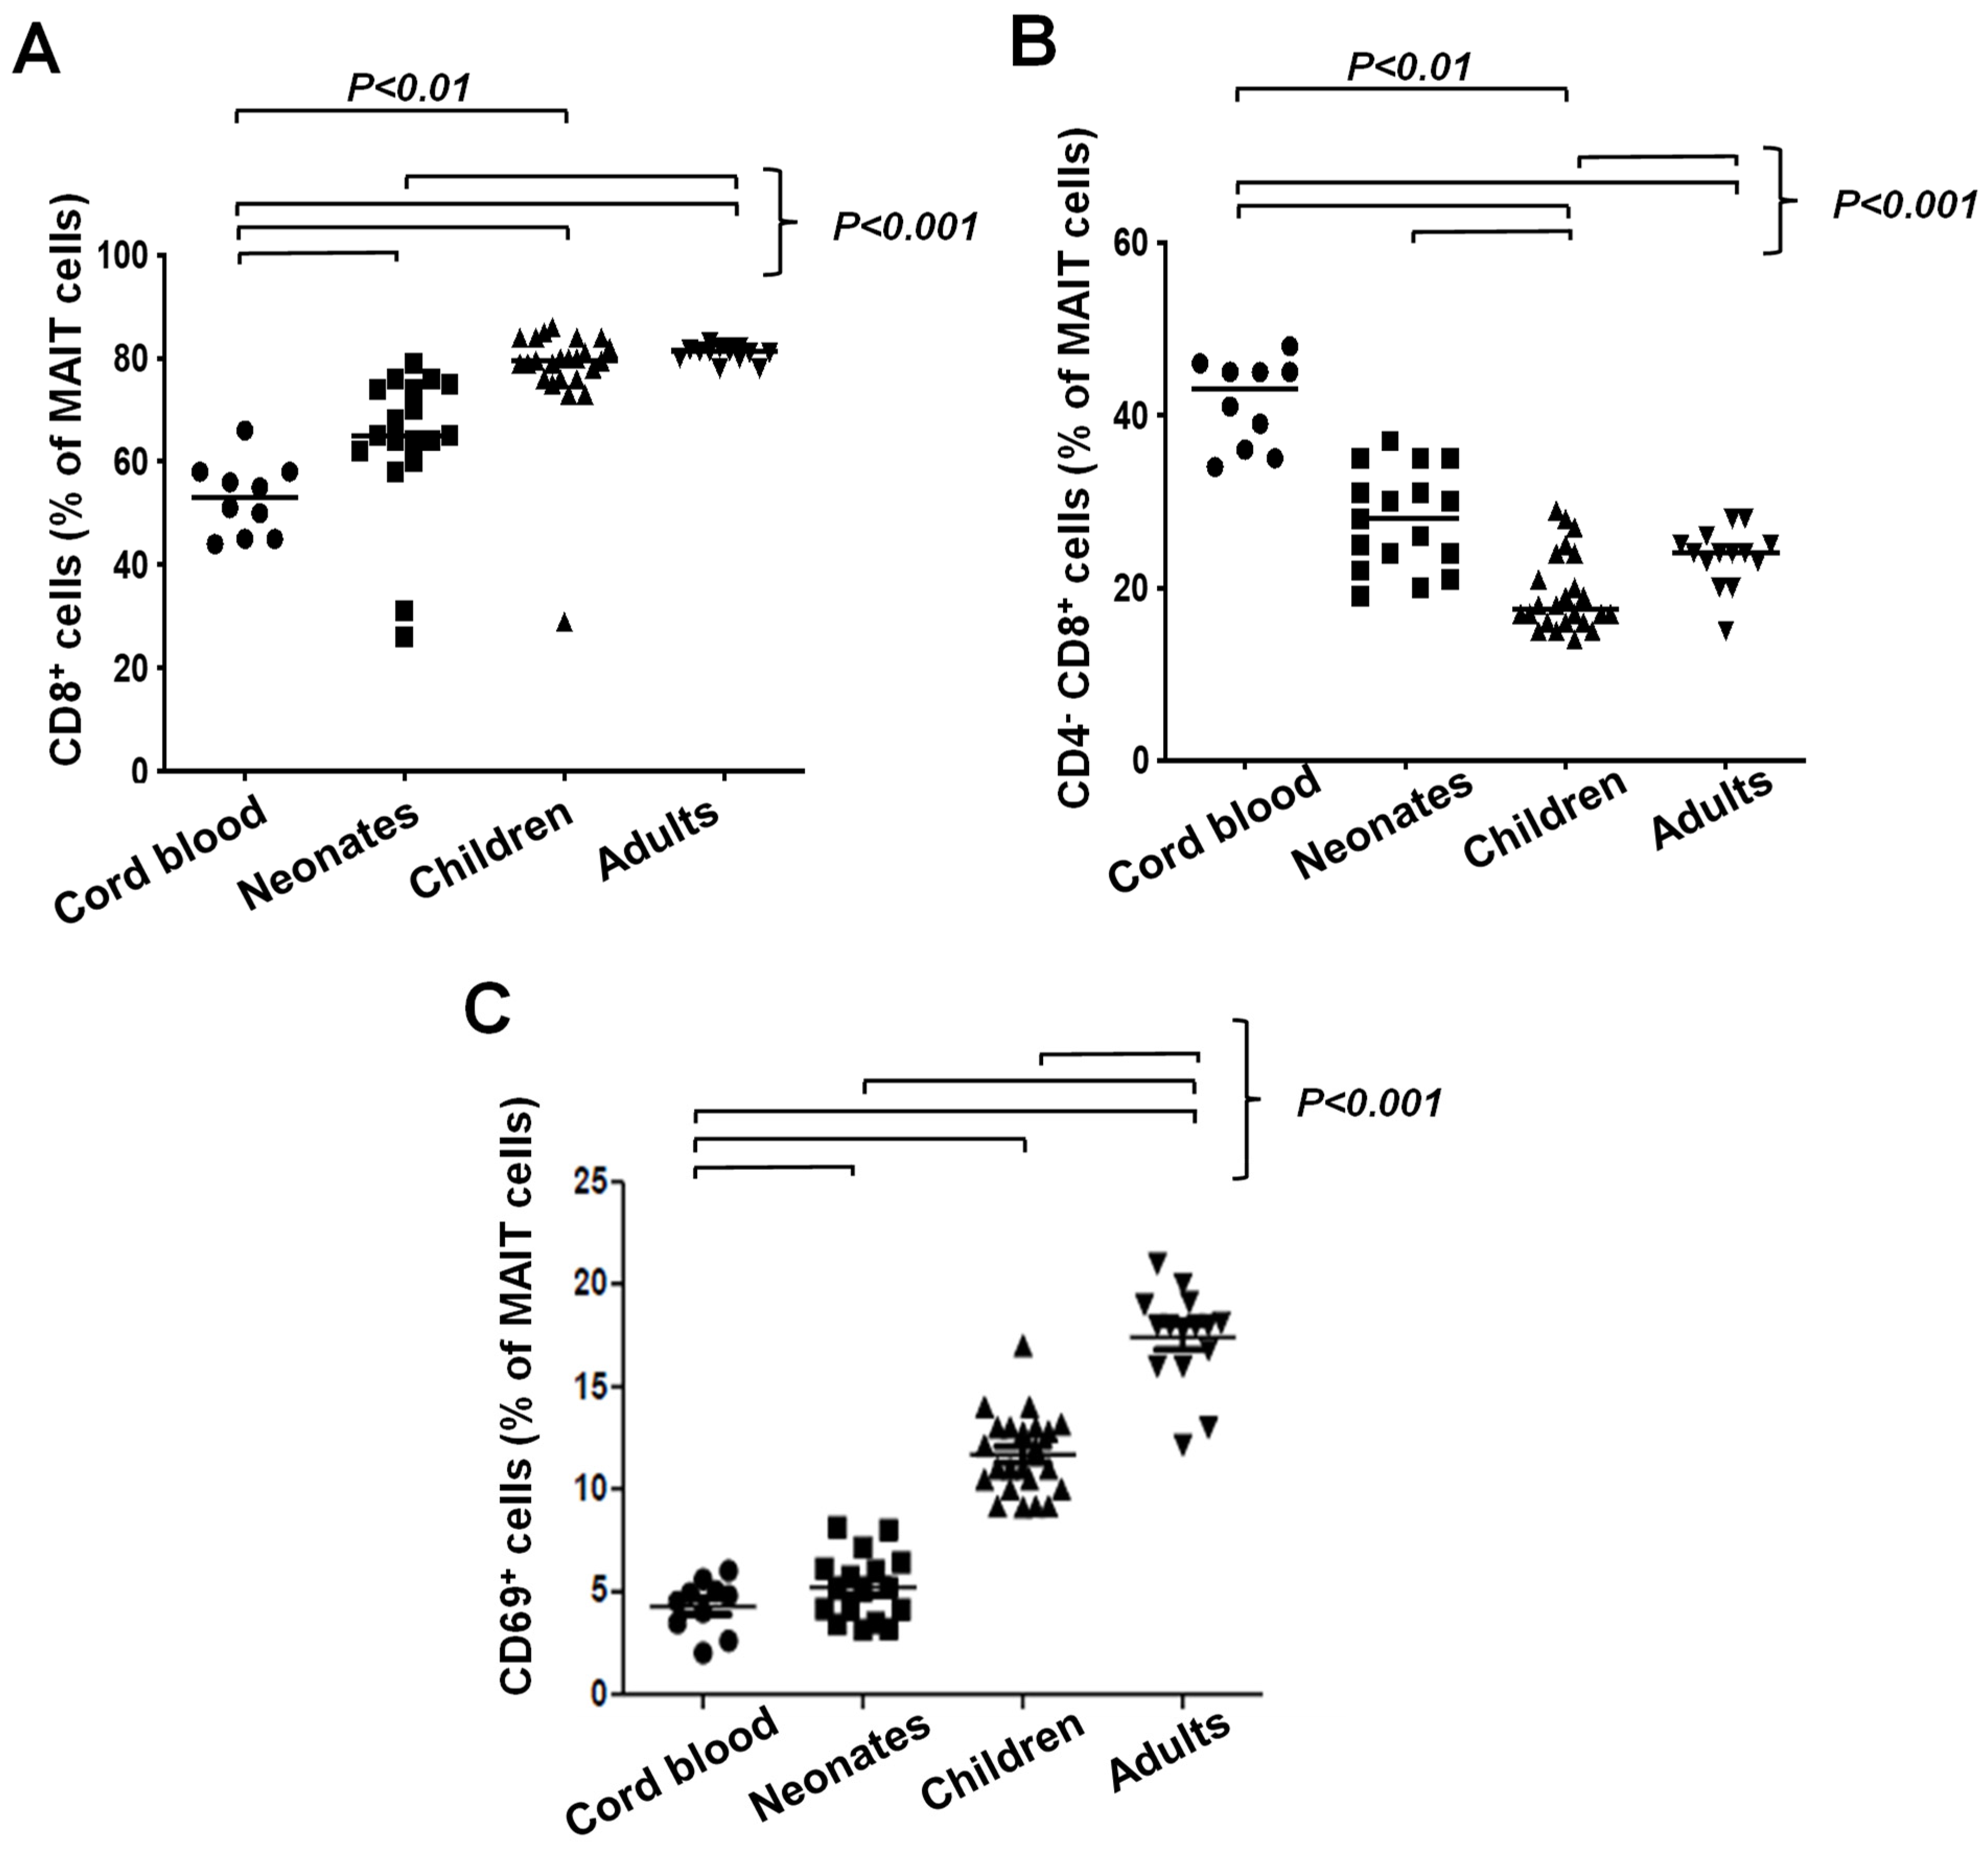
3.2. Unconventional T Cell Frequencies in Healthy Donors Grouped According to Age

Figure 3 shows that CD4+ CD8+ and CD4- CD8- T cell frequencies increased with age. Since iNKT cells, MAIT cells and γδ T cells frequently express these unconventional phenotypes, we next enumerated these innate T cell subsets in the subjects grouped by age. Whole blood was stained with a dead cell stain followed by mAbs specific for CD3, CD161 and the Vα24Jα18, Vα7.2, Vδ1 and Vδ2 TCRs and the cells were analysed by flow cytometry. Figure 4A shows that Vδ1 T cells were present at very low frequencies (typically <0.1% of T cells) in cord blood and in peripheral blood from neonates, but their numbers increased throughout life, accounting for up to 3% of T cells at school age (p < 0.01) and reaching the highest levels in the elderly subjects (p < 0.0001). A similar pattern was seen for Vδ2 T cells, except that their frequencies were highest in young adults (p < 0.0001) and then they declined slightly into old age (Figure 4B). iNKT cells also exhibited a similar dynamic, being undetectable or present at very low frequencies (<0.1% of T cells) in cord blood and in peripheral blood from neonates, but they expanded to a mean of 0.3% of T cells in young adults (p < 0.01; Figure 4C). iNKT cell frequencies were not determined in the elderly subjects. Similar to iNKT cells, MAIT cells were undetectable or present at very low frequencies in cord blood and in peripheral blood from neonates, but they expanded to up to 8% of total T cells in school-age children and young adults (p < 0.01; Figure 4D). MAIT cells were not studied in the elderly subjects. Thus, all of the unconventional T cells enumerated in the present investigation are extremely rare in cord blood and in neonates, but they expand after birth, presumably in response to environmental antigens. Comparison of the frequencies of γδ T cells, iNKT cells and MAIT cells in males and females from each age group did not reveal any significant differences.
We also investigated CD4 and CD8 expression by MAIT cells in the different subject groups. CD4+ MAIT cells were extremely rare, whereas most MAIT cells were expressed CD8+ or CD4- CD8- phenotypes. Interestingly, the frequencies of CD8+ MAIT cells as percentages of total MAIT cells were higher in the circulation of neonates compared to cord blood (p < 0.001) and they increased significantly into school age and adulthood (p < 0.001; Figure 5A). A corresponding decrease in the frequencies of CD4- CD8- MAIT cells with age was observed (p < 0.001; Figure 5B). Analysis of the activation status of MAIT cells, by measurement of CD69 expression, revealed that <8% of MAIT cells from cord or neonatal blood exhibited activated phenotypes, but these frequencies rose to means of 12% in school-age children and 18% of young adults (p < 0.001; Figure 5C). These data suggest that CD8+ MAIT cells are selected and activated immediately after birth and continue to expand over the lifespan in response to environmental antigens.

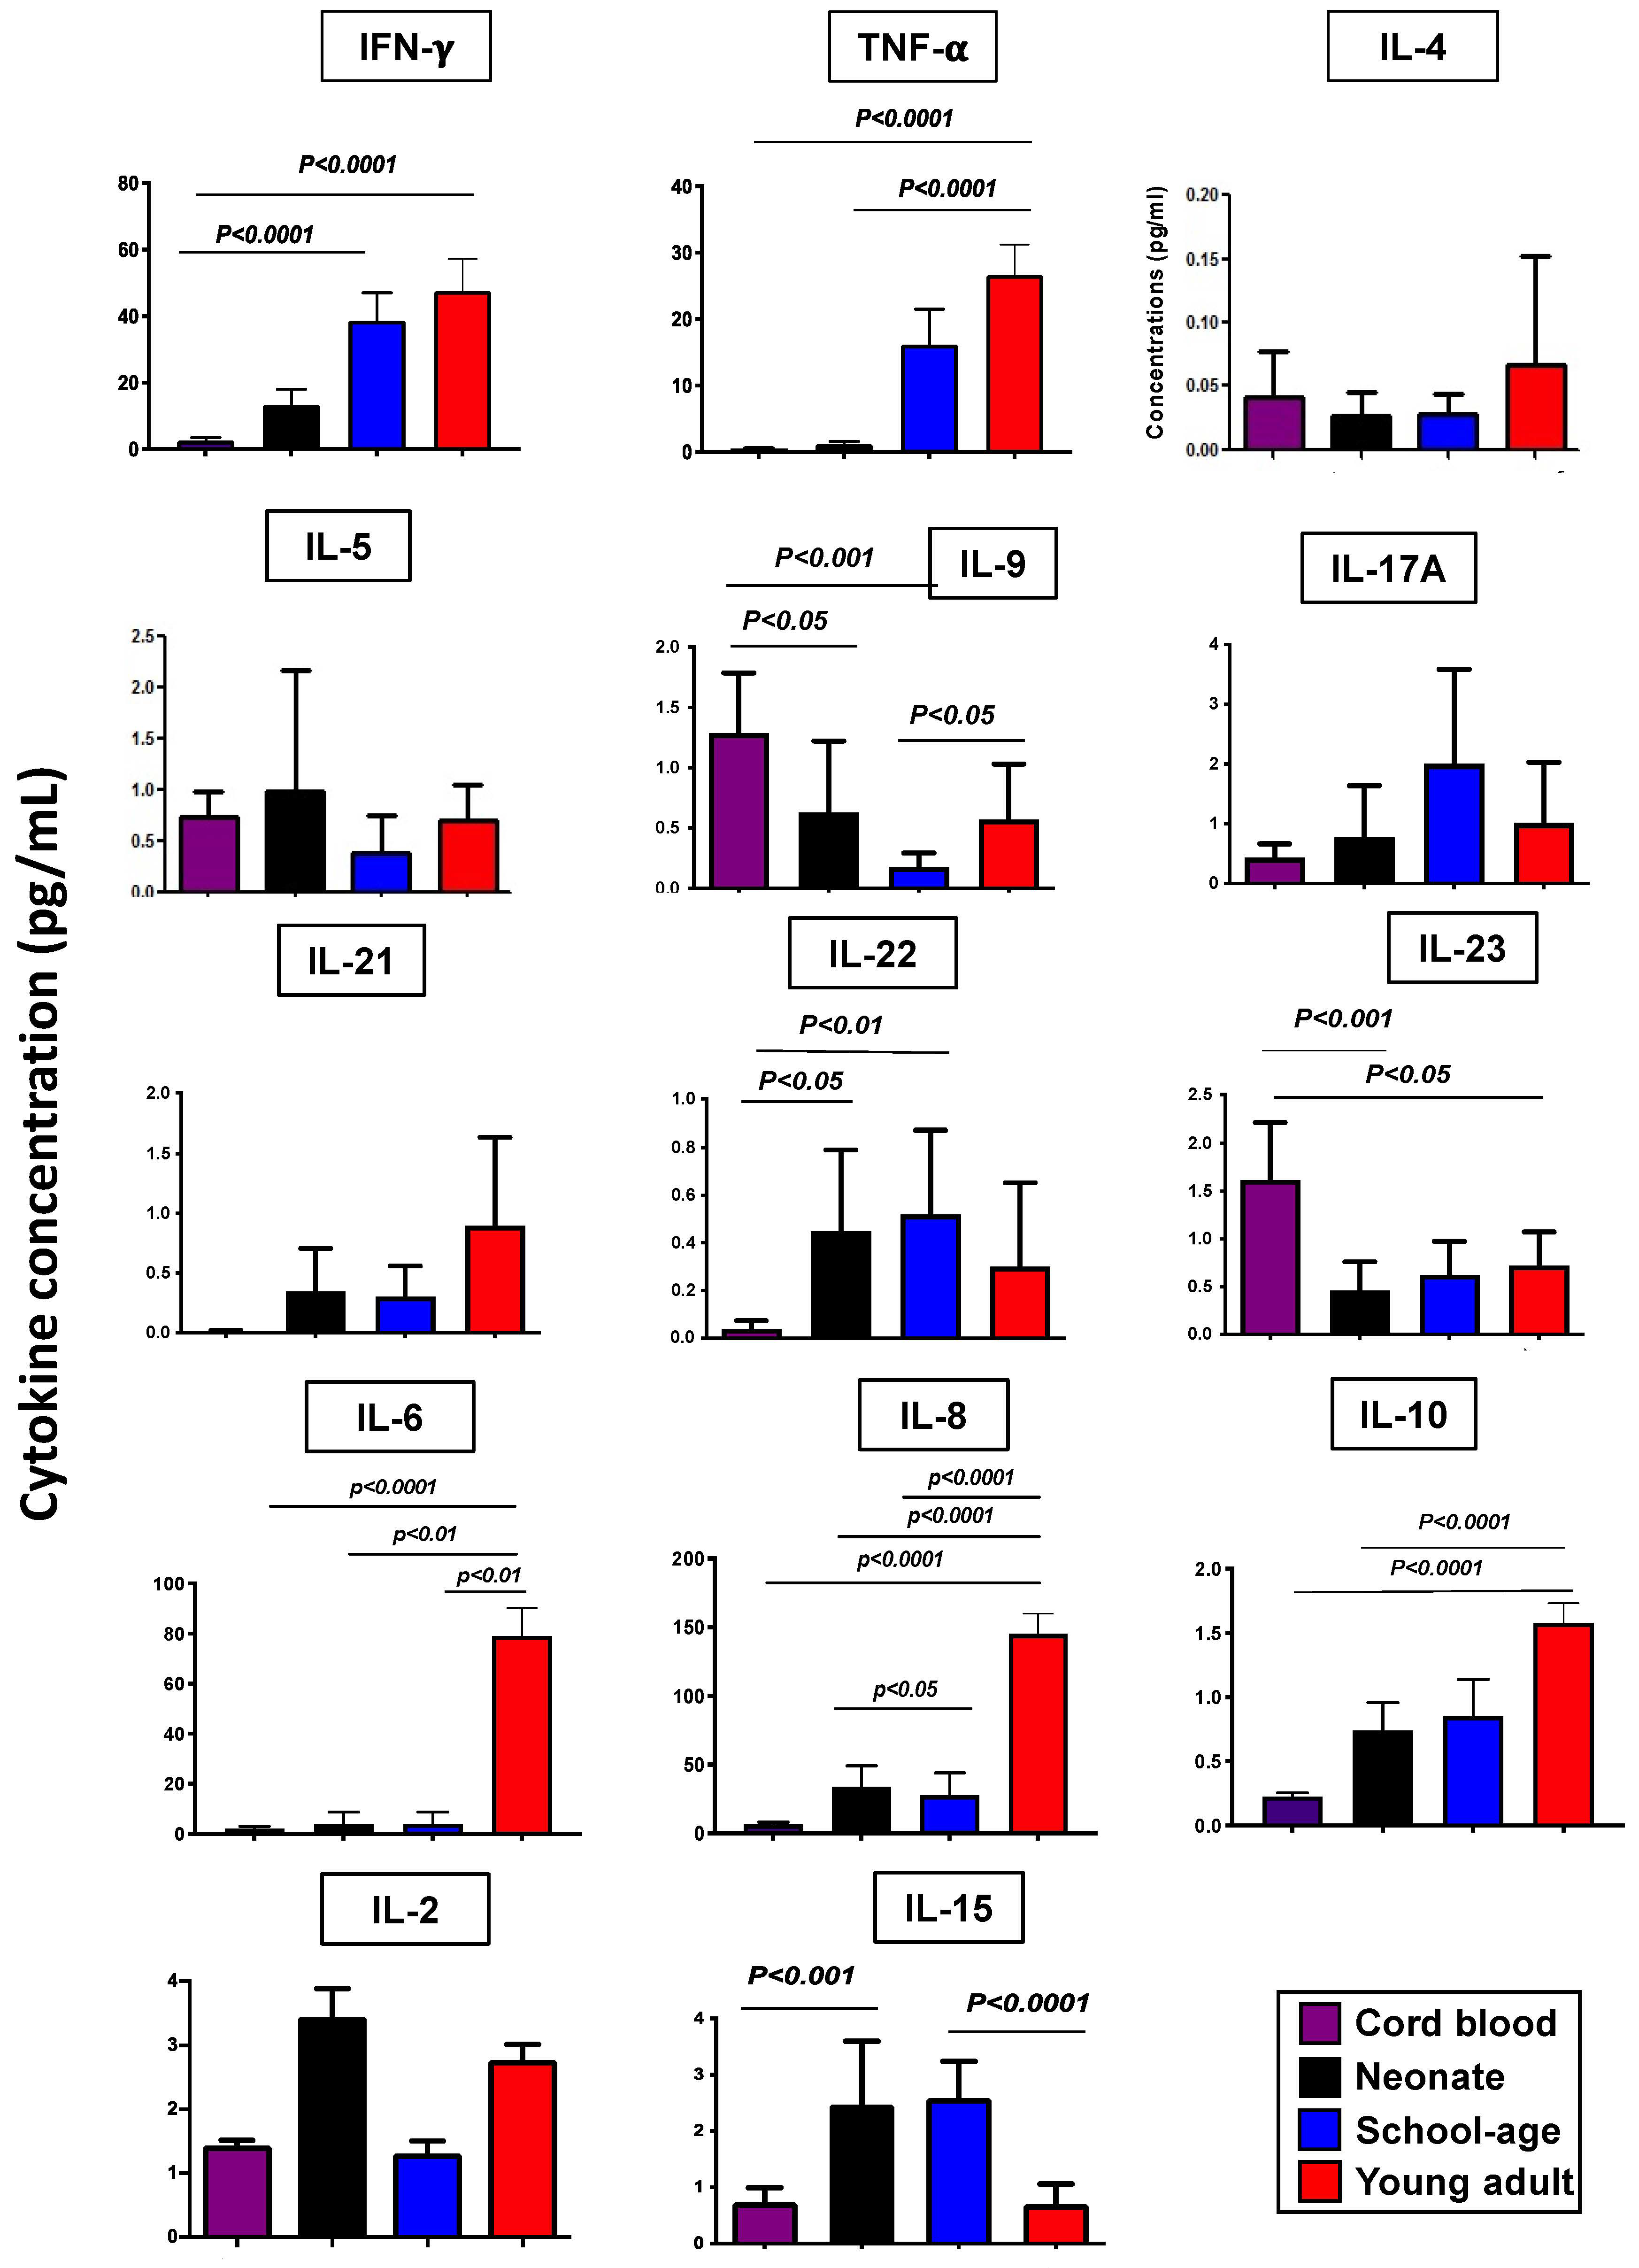
3.3. Serum Cytokine Levels in Healthy Subjects Grouped According to Age

The levels of 14 cytokines (IFN-γ, TNF-α, IL-2, IL-4, IL-5, IL-6, IL-8, IL-9, IL-10, IL-15, IL-17A, IL-21, IL-22 and IL-23), which are typically produced during lymphocyte responses, were next measured in serum samples from cord blood and peripheral blood from neonates, school-age children and young adults using a multiplex immunoassay. Older adults were not included in this investigation. Figure 6 shows that the levels of the Th1-associated cytokines IFN-γ and TNF-α were significantly higher in school-age children and adults compared to cord blood samples (p < 0.001), consistent with a gradual exposure to infectious microorganisms. The levels of the Th2 cytokines IL-4 and IL-5 were similar in all subject groups, but the levels of IL-9 were significantly lower in neonatal blood compared to cord blood (p < 0.05), and they dropped significantly into school age (p < 0.001) and increased in adult life (p < 0.05). No differences in the serum levels of the Th17-associated cytokines IL-17A and IL-21 were found in the different age groups. Serum levels of IL-22 were significantly lower in cord blood compared to neonates (p < 0.05) and children (p < 0.01), while IL-23 levels were significantly higher in cord blood compared to peripheral blood from all the cohorts (p < 0.001 and p < 0.05).
Serum levels of the proinflammatory cytokine IL-6 were considerably higher in adults compared to cord blood (p < 0.0001), neonates (p < 0.01) and children (p < 0.01). The same pattern was observed with IL-8 (p < 0.001). Similarly, IL-10 showed a rising trend with significantly higher levels in adults compared to cord blood samples and neonates respectively (p < 0.001).
The levels of the growth factor for T cells and NK cells, IL-2, were similar in all age groups studied. Finally, IL-15 levels were significantly higher in neonates compared to cord blood (p < 001) and higher in school-age children compared to adults (p < 0.0001).

4. Discussion

Development of the adaptive immune system begins early in fetal life. B cells are present in the blood and spleen by 12 weeks of gestation and T cells start to depart from the thymus from about 14 weeks. Although the B cell and T cell repertoires are generated early in life, responsiveness to infection is low and fetal exposure to infection frequently leads to spontaneous abortion [34,35]. Consequently, the immune system at birth has a tendency to be tolerogenic, rather than immunogenic. However, immunogenic responses are detectable in preterm neonates [36] and in neonates with neonatal encephalopathy [37]. During the neonatal period, the infection response is skewed towards a proinflammatory response and the immune system acquires adaptive features as a result of exposure to microbes [36,38]. As old age progresses, major components of the immune system are impaired and persistent inflammation can lead to chronic morbidity, disability and frailty [7,11,12,13,14,31,32].
We compared lymphocyte numbers and phenotypes and serum cytokine levels in cord blood samples from healthy term neonates and in peripheral blood samples from neonates, children, young adults and elderly people. Confirming a previous report [36], we found that cord blood is not representative of postnatal immunity. We found that the frequencies of T cells were lower in cord blood compared to peripheral blood at all age groups. T cell frequencies remained relatively constant throughout life, and we did not observe any significant changes in their expression of CD4 and CD8 from the neonatal to elderly stages. A similar finding was reported by Sansoni and co-workers [39], who found that T cell frequencies, as percentages of lymphocytes, were unchanged throughout the lifespan; however, the same group and others reported reductions in the absolute numbers of total, CD4+ and CD8+ T cells with age [39,40]. While our study did not determine absolute cell numbers, it is likely that T cell numbers also declined with age, as a general lymphopenia, which similarly affected CD4+ T cells, CD8+ T cells and B cells, resulting in unchanged percentage frequencies.
Similar to previous reports [41,42], we found that B cell frequencies increased after birth, reaching their highest levels at school age and then declining gradually throughout adulthood. On the other hand, NK cell numbers were low in cord blood and in neonatal blood, but they gradually increased throughout adulthood. This increase in NK cells with age has also been reported by others [40,43,44] and suggests that NK cells may compensate for the immunosenescence associated with T cells and B cells. The expansions in the frequencies of NK cells seen in elderly patients are mostly attributable to expansions of the CD56dim subset and reductions of the CD56bright subset [44,45,46]. Whereas CD56dim NK cells mediate potent natural cytotoxicity, CD56bright NK cells exhibit weaker cytotoxicity but contribute to adaptive immunity by releasing IFN-γ in response to IL-2 released by T cells [47]. Borrego and co-workers [44] reported that cytotoxicity by CD56dim NK cells is impaired in elderly subjects, suggesting that contributions of NK cells to both innate and adaptive immunity may be compromised in older people.
The four innate T cell populations investigated in the present study—Vδ1 T cells, Vδ2 T cells, iNKT cells and MAIT cells—all showed similar dynamics across the age groups. All four T cell populations were undetectable or present at very low numbers in cord blood and in peripheral blood of neonates, but they expanded after birth reaching their highest levels in adulthood. Using next-generation sequencing of γδ TCRs in cord blood and in infants, Davey and co-workers [48] and Ravens et al. [49] demonstrated that Vδ1 T cells express naïve phenotypes at birth and differentiate into memory cells in response to antigenic exposure, typically becoming strongly focused on a few high-frequency clonotypes by adulthood. In contrast, most Vδ2 T cells in the fetus and in adults express Vγ9Vδ2 TCRs and these cells are poised for rapid Th1-like effector responses and play key roles in defense against pathogens in early life [50]. The Vγ9Vδ2 TCR recognises the phosphoantigen (E)-4-hydroxy-3-methyl-but-2-enyl pyrophosphate, found in some bacteria and protists, and postnatal expansion of Vγ9Vδ2 T cells is thought to reflect exposure to phosphoantigen-containing bacteria [50,51,52]. Shortly after birth, Vδ2 T cells acquire more potent proliferative and cytotoxic activity, which is associated with downregulation of programmed death-1 (PD-1) and upregulation of NKG2A [53].
Confirming a previous report by Prabhu and co-workers [54], we found that iNKT numbers are very low in cord blood and in neonates, but they expand after birth, reaching their highest levels in adulthood. iNKT cells have important influences on adaptive immune responses via their ability to rapidly release Th1, Th2, Th17 and Treg cytokines and to mediate contact-dependent maturation and activation of dendritic cells, macrophages and B cells [55,56]. Consequently, iNKT cells contribute to the pathology of and protection against multiple diseases [57] and are activated and expanded in neonates with neonatal encephalopathy [37].
Another innate T cell subset that expanded from very low numbers after birth is MAIT cells. Similar to the findings of Walker and co-workers [58] and Chen et al. [59], we found that MAIT cell frequencies increase from birth to adulthood and other studies have demonstrated that their numbers decline in elderly subjects, in part due to an increased susceptibility to apoptosis [59,60]. Interestingly, we found that the proportions of MAIT cells that expressed CD8 increased from the neonatal stage up to adulthood and CD8+ MAIT cells constituted the majority of MAIT cells in adults. Conversely, the proportions of MAIT cells that expressed double negative CD4- CD8- phenotypes decreased with age. CD4+ MAIT cells were found to be very rare at all stages of development. Consistent with previous reports [59], we found that the expression of the T cell activation marker CD69 on MAIT cells increased progressively from cord blood to elderly populations, suggesting that they are selected and activated by exposure to microorganisms during development. Circulating MAIT cells can produce multiple cytokines that are differentially regulated with age, showing the lowest expression of IFN-γ in the young, compared with older individuals [59]. Thus, both the numbers, phenotypes and functions of MAIT cells appear to depend on age and vary in different clinical settings.
In addition to lymphocyte subset frequencies, we measured the levels of cytokines produced by these and other cells in serum derived from cord blood and peripheral blood from neonates, children and young adults but not elderly subjects. Using a multiplex ELISA assay, we found that levels of Th1-associated cytokines, including IFN-γ and TNF-α, were high in adults and schoolchildren but low in cord blood and in neonates. These findings support previous observations that CD4+ and CD8+ T cells from neonates produce IFN-γ and TNF-α less frequently and at lower levels upon ex vivo stimulation [61,62,63] and may explain why neonates have greater susceptibility to intracellular infections.
Similar levels of the Th2 cytokines IL-4 and IL-5 were observed at all ages, but the levels of IL-9 were high in cord blood but low in serum from neonates and decreased in schoolchildren before increasing in adults. Future studies are required to explain these unusual dynamics of IL-9, which promotes allergic inflammation by activating, eosinophils, B cells and epithelial cells [64].
In the present study, levels of the Th17-associated cytokines IL-17A and IL-21 did not change significantly from the neonatal stage to adulthood, but levels of IL-22 were found to be lower and levels of IL-23 were higher in cord blood compared to peripheral blood of neonates, school-age children and adults. This is interesting because IL-23 normally promotes the release of IL-22 by T cells and suggests that this does not occur with immature T cells present in cord blood. Lu and co-workers found that low levels of IL-22 in cord blood are associated with the development of infant eczema [65]. IL-23 also promotes the release of IL-17. Kleiner and co-workers [66] reported that IL-17 levels rise with age, and we found a non-significant increase in IL-17 levels in adults compared to children.
Finally, the levels of the proinflammatory cytokines IL-6 and IL-8 were found to be high in adults compared to other cohorts. These data are in line with other publications reporting an enhancement of Th1 and proinflammatory cytokine activity with age [67]. These elevated cytokine levels are likely to underly the pathological consequences of inflammaging, whereby dysregulated cytokine production can lead to persistent inflammation in elderly subjects, leading to increased susceptibility to type 2 diabetes, atherosclerosis and cancer. However, future studies are required to determine if these elevations persist into old age, since this group was not studied in the present investigation.
A limitation to the present study is the small subject size, which did not allow meaningful comparisons of data from subgroups within the age groups. Although we report no differences between males and females in any age groups, the subject numbers are too low for reliable comparison. Another limitation is that our data show percentage frequencies rather than absolute numbers of cells, because full blood counts were not available for some of the subject cohorts. Thus, the differences reported indicate changes in the relative numbers of cell types, which might not correspond to numerical changes. A further limitation is that the functionality of the cells was not investigated. Future studies should examine lymphocyte phenotypic markers of activation, differentiation and exhaustion and functional outcomes of activation ex vivo, such as cytotoxicity and cytokine secretion.
Our data show that individual lymphocyte population frequencies and cytokine levels vary according to age from the newborn stage to adulthood and into the elderly stages of life. These changes in early life are thought to occur in response to infection and the microbiota and are likely to affect immunocompetence. Additionally, the low-grade inflammatory state found in older people makes them more prone to cancers, autoimmune diseases and poor outcomes from infectious diseases [11,12,14]. An understanding of the dynamics of lymphocyte expansion, contraction and function is key for the generation of novel immunotherapies, which are currently being developed for infectious and immune-mediated disease and cancer.

Author Contributions

Conceptualization, E.J.M. and D.G.D.; Methodology, N.A.B.T., J.M.I.-C., A.M.M., L.A.K. and D.G.D.; Investigation, N.A.B.T., J.M.I.-C., A.M.M., L.A.K. and A.I.A.-H.; Resources, M.I.O., Z.Z., E.R., M.O., L.T. and E.J.M.; Writing—original draft, J.M.I.-C. and D.G.D.; Project administration, D.G.D. All authors have read and agreed to the published version of the manuscript.

Funding

This work was supported by a scholarship from the Libyan Embassy London Academic Attaché to N.A.B.T.

Institutional Review Board Statement

Ethical committee approval for the study was granted from the Coombe Women & Infants University Hospital, the National Children’s Hospital, Tallaght and St. James’s Hospitals, Dublin.

Informed Consent Statement

Informed written consent was obtained from all adults and parents of the children who took part in the study.

Data Availability Statement

The raw data supporting the conclusions of this article will be made available by the authors on request.

Acknowledgments

The authors are grateful to the donors who participated in this study and their parents. We thank Gráinne Jameson, Dearbhla Murphy, Nollaig Bourke and Margaret Dunne for helpful discussions.

Conflicts of Interest

The authors have declared that no commercial or financial conflicts of interest exist.

Abbreviations

DNdouble negative
DPdouble positive
FcRFc receptor
FSCforward scatter
γδ T cellgamma delta T cell
IFN-γinterferon-gammaq
Igimmunoglobulin
ILinterleukin
iNKT cellinvariant natural killer T cell
mAbmonoclonal antibody
MAIT cellmucosa-associated invariant T cell
NFκBnuclear factor kappa B
NKnatural killer
PBSphosphate-buffered saline
SSCside scatter
Th cellhelper T cell
TNF-αtumor necrosis factor-α
Treg cellregulatory T cell

References

  1. Simon, A.K.; Hollander, G.A.; McMichael, A. Evolution of the immune system in humans from infancy to old age. Proc. Biol. Sci. 2015, 282, 20143085. [Google Scholar] [CrossRef] [PubMed]
  2. Besedovsky, L.; Lange, T.; Haack, M. The sleep-immune crosstalk in health and disease. Physiol. Rev. 2019, 99, 1325–1380. [Google Scholar] [CrossRef] [PubMed]
  3. Graham, J.; Christian, L.; Kiecolt-Glaser, J. Stress, age, and immune function: Toward a lifespan approach. J. Behav. Med. 2006, 29, 389–400. [Google Scholar] [CrossRef] [PubMed]
  4. Alpert, A.; Pickman, Y.; Leipold, M.; Rosenberg-Hasson, Y.; Ji, X.; Gaujoux, R.; Rabani, H.; Starosvetsky, E.; Kveler, K.; Schaffert, S.; et al. A clinically meaningful metric of immune age derived from high-dimensional longitudinal monitoring. Nat. Med. 2019, 25, 487–495. [Google Scholar] [CrossRef] [PubMed]
  5. Tourkochristou, E.; Triantos, C.; Mouzaki, A. The influence of nutritional factors on immunological outcomes. Front. Immunol. 2021, 12, 665968. [Google Scholar] [CrossRef]
  6. Jain, N. The early life education of the immune system: Moms, microbes and (missed) opportunities. Gut Microbes 2020, 12, 1824564. [Google Scholar] [CrossRef]
  7. Montecino-Rodriguez, E.; Berent-Maoz, B.; Dorshkind, K. Causes, consequences, and reversal of immune system aging. J. Clin. Investig. 2013, 123, 958–965. [Google Scholar] [CrossRef]
  8. Pawelec, G. Age and immunity: What is “immunosenescence”? Exp. Gerontol. 2018, 105, 4–9. [Google Scholar] [CrossRef]
  9. Zhang, H.; Weyand, C.; Goronzy, J. Hallmarks of the aging T-cell system. FEBS J. 2021, 288, 7123–7142. [Google Scholar] [CrossRef]
  10. Georgountzou, A.; Papadopoulos, N. Postnatal innate immune development: From birth to adulthood. Front. Immunol. 2017, 8, 957. [Google Scholar] [CrossRef]
  11. Ferrucci, L.; Fabbri, E. Inflammageing: Chronic inflammation in ageing, cardiovascular disease, and frailty. Nat. Rev. Cardiol. 2018, 15, 505–522. [Google Scholar] [CrossRef] [PubMed]
  12. Gibson, K.; Wu, Y.; Barnett, Y.; Duggan, O.; Vaughan, R.; Kondeatis, E.; Nilsson, B.; Wikby, A.; Kipling, D.; Dunn-Walters, D. B-cell diversity decreases in old age and is correlated with poor health status. Aging Cell 2009, 8, 18–25. [Google Scholar] [CrossRef] [PubMed]
  13. López-Otín, C.; Blasco, M.A.; Partridge, L.; Serrano, M.; Kroemer, G. The hallmarks of aging. Cell 2013, 153, 1194–1217. [Google Scholar] [CrossRef]
  14. Pangrazzi, L.; Weinberger, B. T cells, aging and senescence. Exp. Gerontol. 2020, 134, 110887. [Google Scholar] [CrossRef] [PubMed]
  15. Takahata, Y.; Nomura, A.; Takada, H.; Ohga, S.; Furuno, K.; Hikino, S.; Nakayama, H.; Sakaguchi, S.; Hara, T. CD25+CD4+ T cells in human cord blood: An immunoregulatory subset with naive phenotype and specific expression of forkhead box p3 (Foxp3) gene. Exp. Hematol. 2004, 32, 622–629. [Google Scholar] [CrossRef]
  16. Mold, J.; Venkatasubrahmanyam, S.; Burt, T.; Michaëlsson, J.; Rivera, J.; Galkina, S.; Weinberg, K.; Stoddart, C.; McCune, J. Fetal and adult hematopoietic stem cells give rise to distinct T cell lineages in humans. Science 2010, 330, 1695–1699. [Google Scholar] [CrossRef]
  17. Ridings, J.; Dinan, L.; Williams, R.; Roberton, D.; Zola, H. Somatic mutation of immunoglobulin VH6 genes in human infants. Clin. Exp. Immunol. 1998, 114, 33–39. [Google Scholar] [CrossRef]
  18. Kaur, K.; Chowdhury, S.; Greenspan, N.; Schreiber, J. Decreased expression of tumor necrosis factor family receptors involved in humoral immune responses in preterm neonates. Blood 2007, 110, 2948–2954. [Google Scholar] [CrossRef]
  19. Pihlgren, M.; Friedli, M.; Tougne, C.; Rochat, A.; Lambert, P.; Siegrist, C. Reduced ability of neonatal and early-life bone marrow stromal cells to support plasmablast survival. J. Immunol. 2006, 176, 165–172. [Google Scholar] [CrossRef]
  20. Gibbons; Haque, S.; Silberzahn, T.; Hamilton, K.; Langford, C.; Ellis, P.; Carr, R.; Hayday, A. Neonates harbour highly active γδ T cells with selective impairments in preterm infants. Eur. J. Immunol. 2009, 39, 1794–1806. [Google Scholar] [CrossRef]
  21. Leeansyah, E.; Loh, L.; Nixon, D.F.; Sandberg, J.K. Acquisition of innate-like microbial reactivity in mucosal tissues during human fetal MAIT-cell development. Nat. Commun. 2014, 5, 3143. [Google Scholar] [CrossRef] [PubMed]
  22. Youssef, G.B.; Tourret, M.; Salou, M.; Ghazarian, L.; Houdouin, V.; Mondot, S.; Mburu, Y.; Lambert, M.; Azarnoush, S.; Diana, J.S.; et al. Ontogeny of human mucosal-associated invariant T cells and related T cell subsets. J. Exp. Med. 2018, 215, 459–479. [Google Scholar] [CrossRef]
  23. Clark, B.; Thomas, P. A Cell for the Ages: Human γδ T cells across the lifespan. Int. J. Mol. Sci. 2020, 21, 8903. [Google Scholar] [CrossRef]
  24. Tan, L.; Fichtner, A.S.; Bruni, E.; Odak, I.; Sandrock, I.; Bubke, A.; Borchers, A.; Schultze-Florey, C.; Koenecke, C.; Förster, R.; et al. A fetal wave of human type 3 effector γδ cells with restricted TCR diversity persists into adulthood. Sci. Immunol. 2021, 6, eabf0125. [Google Scholar] [CrossRef]
  25. Haddad, R.; Guimiot, F.; Six, E.; Jourquin, F.; Setterblad, N.; Kahn, E.; Yagello, M.; Schiffer, C.; Andre-Schmutz, I.; Cavazzana-Calvo, M.; et al. Dynamics of thymus-colonizing cells during human development. Immunity 2006, 24, 217–230. [Google Scholar] [CrossRef]
  26. Zlotoff, D.A.; Schwarz, B.A.; Bhandoola, A. The long road to the thymus: The generation, mobilization, and circulation of T-cell progenitors in mouse and man. Semin. Immunopathol. 2008, 30, 371–382. [Google Scholar] [CrossRef]
  27. Booth, J.; Toapanta, F. B and T cell immunity in tissues and across the ages. Vaccines 2021, 9, 24. [Google Scholar] [CrossRef] [PubMed]
  28. Virgin, H.; Wherry, E.; Ahmed, R. Redefining chronic viral infection. Cell 2009, 138, 30–50. [Google Scholar] [CrossRef] [PubMed]
  29. Bektas, A.; Schurman, S.H.; Sen, R.; Ferrucci, L. Human T cell immunosenescence and inflammation in aging. J. Leukoc. Biol. 2017, 102, 977–988. [Google Scholar] [CrossRef]
  30. Serrano-López, J.; Martín-Antonio, B. Inflammaging, an imbalanced immune response that needs to be restored for cancer prevention and treatment in the elderly. Cells 2021, 10, 2562. [Google Scholar] [CrossRef]
  31. Naylor, K.; Li, G.; Vallejo, A.; Lee, W.; Koetz, K.; Bryl, E.; Witkowski, J.; Fulbright, J.; Weyand, C.; Goronzy, J. The influence of age on T cell generation and TCR diversity. J. Immunol. 2005, 174, 7446–7452. [Google Scholar] [CrossRef] [PubMed]
  32. Bektas, A.; Zhang, Y.; Lehmann, E.; Wood, W.; Becker, K.; Madara, K.; Ferrucci, L.; Sen, R. Age-associated changes in basal NF-κB function in human CD4+ T lymphocytes via dysregulation of PI3 kinase. Aging 2014, 6, 957–974. [Google Scholar] [CrossRef] [PubMed]
  33. Mocchegiani, E.; Malavolta, M. NK and NKT cell functions in immunosenescence. Aging Cell 2004, 3, 177–184. [Google Scholar] [CrossRef] [PubMed]
  34. Krishnan, L.; Guilbert, L.J.; Wegmann, T.G.; Belosevic, M.; Mosmann, T.R. T helper 1 response against Leishmania major in pregnant C57BL/6 mice increases implantation failure and fetal resorptions. Correlation with increased IFN-gamma and TNF and reduced IL-10 production by placental cells. J. Immunol. 1996, 156, 653–662. [Google Scholar] [CrossRef]
  35. Raghupathy, R. Th1-type immunity is incompatible with successful pregnancy. Immunol. Today 1997, 18, 478–482. [Google Scholar] [CrossRef]
  36. Olin, A.; Henckel, E.; Chen, Y.; Lakshmikanth, T.; Pou, C.; Mikes, J.; Gustafsson, A.; Bernhardsson, A.K.; Zhang, C.; Bohlin, K.; et al. Stereotypic immune system development in newborn children. Cell 2018, 174, 1277–1292. [Google Scholar] [CrossRef]
  37. Taher, N.A.; Kelly, L.A.; Al-Harbi, A.I.; O’Dea, M.I.; Zareen, Z.; Ryan, E.; Molloy, E.J.; Doherty, D.G. Altered distributions and functions of natural killer T cells and γδ T cells in neonates with neonatal encephalopathy, in school-age children at follow-up, and in children with cerebral palsy. J. Neuroimmunol. 2021, 356, 577597. [Google Scholar] [CrossRef] [PubMed]
  38. Ygberg, S.; Nilsson, A. The developing immune system—From foetus to toddler. Acta Paediatr. 2012, 101, 120–127. [Google Scholar] [CrossRef]
  39. Sansoni, P.; Cossarizza, A.; Brianti, V.; Fagnoni, F.; Snelli, G.; Monti, D.; Marcato, A.; Passeri, G.; Ortolani, C.; Forti, E.; et al. Lymphocyte subsets and natural killer cell activity in healthy old people and centenarians. Blood 1993, 82, 2767–2773. [Google Scholar] [CrossRef]
  40. Jentsch-Ullrich, K.; Koenigsmann, M.; Mohren, M.; Franke, A. Lymphocyte subsets’ reference ranges in an age- and gender-balanced population of 100 healthy adults—A monocentric German study. Clin. Immunol. 2005, 116, 192–197. [Google Scholar] [CrossRef]
  41. Ademokun, A.; Wu, Y.C.; Dunn-Walters, D. The ageing B cell population: Composition and function. Biogerontology 2010, 11, 125–137. [Google Scholar] [CrossRef] [PubMed]
  42. Frasca, D.; Diaz, A.; Romero, M.; Landin, A.M.; Blomberg, B.B. Age effects on B cells and humoral immunity in humans. Ageing Res. Rev. 2011, 10, 330–335. [Google Scholar] [CrossRef] [PubMed]
  43. Vitale, M.; Zamai, L.; Neri, L.M.; Galanzi, A.; Facchini, A.; Rana, R.; Cataldi, A.; Papa, S. The impairment of natural killer function in the healthy aged is due to a postbinding deficient mechanism. Cell Immunol. 1992, 145, 1–10. [Google Scholar] [CrossRef] [PubMed]
  44. Borrego, F.; Alonso, M.; Galiani, M.D.; Carracedo, J.; Ramirez, R.; Ostos, B.; Peña, J.; Solana, R. NK phenotypic markers and IL2 response in NK cells from elderly people. Exp. Gerontol. 1999, 34, 253–265. [Google Scholar] [CrossRef] [PubMed]
  45. Chidrawar, S.M.; Khan, N.; Chan, Y.L.; Nayak, L.; Moss, P.A. Ageing is associated with a decline in peripheral blood CD56bright NK cells. Immun. Ageing 2006, 3, 10. [Google Scholar] [CrossRef]
  46. Le Garff-Tavernier, M.; Béziat, V.; Decocq, J.; Siguret, V.; Gandjbakhch, F.; Pautas, E.; Debré, P.; Merle-Beral, H.; Vieillard, V. Human NK cells display major phenotypic and functional changes over the life span. Aging Cell 2010, 9, 527–535. [Google Scholar] [CrossRef]
  47. Fehniger, T.A.; Cooper, M.A.; Nuovo, G.J.; Cella, M.; Faccetti, F.; Colonna, M.; Caligiuri, M.A. CD56bright natural killer cells are present in human lymph nodes and are activated by T cell derived IL-2: A potential new link between adaptive and innate immunity. Blood 2003, 101, 3052–3057. [Google Scholar] [CrossRef]
  48. Davey, M.S.; Willcox, C.R.; Joyce, S.P.; Ladell, K.; Kasatskaya, S.A.; McLaren, J.E.; Hunter, S.; Salim, M.; Mohammed, F.; Price, D.A.; et al. Clonal selection in the human Vδ1 T cell repertoire indicates γδ TCR-dependent adaptive immune surveillance. Nat. Commun. 2017, 8, 14760. [Google Scholar] [CrossRef]
  49. Ravens, S.; Fichtner, A.S.; Willers, M.; Torkornoo, D.; Pirr, S.; Schöning, J.; Deseke, M.; Sandrock, I.; Bubke, A.; Wilharm, A.; et al. Microbial exposure drives polyclonal expansion of innate γδ T cells immediately after birth. Proc. Natl. Acad. Sci. USA 2020, 117, 18649–18660. [Google Scholar] [CrossRef]
  50. Dimova, T.; Brouwer, M.; Gosselin, F.; Tassignon, J.; Leo, O.; Donner, C.; Marchant, A.; Vermijlen, D. Effector Vγ9Vδ2 T cells dominate the human fetal γδ T-cell repertoire. Proc. Natl. Acad. Sci. USA 2015, 112, E556–E565. [Google Scholar] [CrossRef]
  51. Papadopoulou, M.; Tieppo, P.; McGovern, N.; Gosselin, F.; Chan, J.K.Y.; Goetgeluk, G.; Dauby, N.; Cogan, A.; Donner, C.; Ginhoux, F.; et al. TCR Sequencing Reveals the Distinct Development of Fetal and Adult Human Vγ9Vδ2 T Cells. J. Immunol. 2019, 203, 1468–1479. [Google Scholar] [CrossRef] [PubMed]
  52. Moens, E.; Brouwer, M.; Dimova, T.; Goldman, M.; Willems, F.; Vermijlen, D. IL-23R and TCR signaling drives the generation of neonatal Vγ9Vδ2 T cells expressing high levels of cytotoxic mediators and producing IFN-gamma and IL-17. J. Leukoc. Biol. 2011, 89, 743–752. [Google Scholar] [CrossRef]
  53. Hsu, H.; Boudova, S.; Mvula, G.; Divala, T.H.; Rach, D.; Mungwira, R.G.; Boldrin, F.; Degiacomi, G.; Manganelli, R.; Laufer, M.K.; et al. Age-related changes in PD-1 expression coincide with increased cytotoxic potential in Vδ2 T cells during infancy. Cell Immunol. 2021, 359, 104244. [Google Scholar] [CrossRef] [PubMed]
  54. Prabhu, S.B.; Rathore, D.K.; Nair, D.; Chaudhary, A.; Raza, S.; Kanodia, P.; Sopory, S.; George, A.; Rath, S.; Bal, V.; et al. Comparison of human neonatal and adult blood leukocyte subset composition phenotypes. PLoS ONE 2016, 11, e0162242. [Google Scholar] [CrossRef] [PubMed]
  55. Salio, M.; Silk, J.D.; Jones, E.Y.; Cerundolo, V. Biology of CD1- and MR1-restricted T cells. Annu. Rev. Immunol. 2014, 32, 323–366. [Google Scholar] [CrossRef]
  56. Godfrey, D.I.; Uldrich, A.P.; McCluskey, J.; Rossjohn, J.; Moody, D.B. The burgeoning family of unconventional T cells. Nat. Immunol. 2015, 16, 1114–1123. [Google Scholar] [CrossRef]
  57. Olszak, T.; An, D.; Zeissig, S.; Vera, M.P.; Richter, J.; Franke, A.; Glickman, J.N.; Siebert, R.; Baron, R.M.; Kasper, D.L.; et al. Microbial exposure during early life has persistent effects on natural killer T cell function. Science 2012, 336, 489–493. [Google Scholar] [CrossRef] [PubMed]
  58. Walker, L.J.; Kang, Y.H.; Smith, M.O.; Tharmalingham, H.; Ramamurthy, N.; Fleming, V.M.; Sahgal, N.; Leslie, A.; Oo, Y.; Geremia, A.; et al. Human MAIT and CD8αα cells develop from a pool of type-17 precommitted CD8+ T cells. Blood 2012, 119, 422–433. [Google Scholar] [CrossRef]
  59. Chen, P.; Deng, W.; Li, D.; Zeng, T.; Huang, L.; Wang, Q.; Wang, J.; Zhang, W.; Yu, X.; Duan, D.; et al. Circulating mucosal-associated invariant T cells in a large cohort of healthy Chinese Individuals from rewborn to elderly. Front. Immunol. 2019, 10, 260. [Google Scholar] [CrossRef]
  60. Lee, O.-J.; Cho, Y.-N.; Kee, S.-J.; Kim, M.-J.; Jin, H.-M.; Lee, S.-J.; Park, K.-J.; Kim, T.-J.; Lee, S.-S.; Kwon, Y.-S.; et al. Circulating mucosal-associated invariant T cell levels and their cytokine levels in healthy adults. Exp. Gerontol. 2014, 49, 47–54. [Google Scholar] [CrossRef]
  61. Buck, R.H.; Cordle, C.T.; Thomas, D.J.; Winship, T.R.; Schaller, J.P.; Dugle, J.E. Longitudinal study of intracellular T cell cytokine production in infants compared to adults. Clin. Exp. Immunol. 2002, 128, 490–497. [Google Scholar] [CrossRef] [PubMed]
  62. Gasparoni, A.; Ciardelli, L.; Avanzini, A.; Castellazzi, A.M.; Carini, R.; Rondini, G.; Chirico, G. Age-related changes in intracellular TH1/TH2 cytokine production, immunoproliferative T lymphocyte response and natural killer cell activity in newborns, children and adults. Biol. Neonate 2003, 84, 297–303. [Google Scholar] [CrossRef] [PubMed]
  63. Jeljeli, M.; Khourouj, V.G.-E.; Pédron, B.; Gressens, P.; Sibony, O.; Sterkers, G. Ontogeny of cytokine responses to PHA from birth to adulthood. Pediatr. Res. 2019, 86, 63–70. [Google Scholar] [CrossRef] [PubMed]
  64. Angkasekwinai, P.; Dong, C. IL-9-producing T cells: Potential players in allergy and cancer. Nat. Rev. Immunol. 2021, 21, 37–48. [Google Scholar] [CrossRef]
  65. Lu, X.; Wang, W.; Wang, Y.; Huan, C.; Yang, Y. The relationship between umbilical cord blood IL-22 level and infantile eczema at 42 days. Front. Pediatr. 2024, 12, 1376706. [Google Scholar] [CrossRef]
  66. Kleiner, G.; Marcuzzi, A.; Zanin, V.; Monasta, L.; Zauli, G. Cytokine levels in the serum of healthy subjects. Mediat. Inflamm. 2013, 2013, 1–6. [Google Scholar] [CrossRef]
  67. Decker, M.L.; Grobusch, M.P.; Ritz, N. Influence of age and other factors on cytokine expression profiles in healthy children-A systematic review. Front. Pediatr. 2017, 5, 255. [Google Scholar] [CrossRef]
Figure 1. Gating strategy for the detection of T cells, B cells, NK cells, CD4+ T cells, CD8+ T cells, CD4-CD8- T cells, CD4+CD8+ T cells, iNKT cells, MAIT cells, Vδ1 T cells and Vδ2 T cells by flow cytometry. Whole blood was stained with a dead cell stain (DCS) and monoclonal antibodies specific for glycophorin A, CD3, CD4, CD8, CD19, CD56, CD161 and the Vα7.2, Vα24Jα18, Vδ1 and Vδ2 T cell receptors and analysed by flow cytometry. Upper panels, left to right: flow cytometry dot plots showing forward scatter area (FSC-A) plotted against side scatter area (SSC-A) with an electronic gate drawn around the lymphocytes; dot plot showing CD3 plotted against glycophorin A with a gate drawn around the glycophorin-negative cells to exclude erythrocytes; dot plot showing FSC-A plotted against FSC-height (FSC-H) for gated lymphocytes with a gate drawn around the single cells; dot plot showing FSC-A plotted against the dead cell stain for gated single cells with a gate drawn around the live cells. Centre panels: five dot plots showing expression of CD3 and either CD19, CD56, Vα24Jα18, Vδ1 or Vδ2 by gated live singlet lymphocytes with gates drawn around the B cells, T cells, NK cells, iNKT cells, Vδ1 and Vδ2 T cells. Lower panels, left and right: dot plot showing expression of CD4 and CD8 by gated T cells with gates drawn around the CD4+ T cells, CD8+ T cells, double negative (DN) CD4-CD8- T cells and double positive (DP) CD4+CD8+ T cells; dot plot showing expression of CD161 and Vα7.2 by gated T cells with a gate drawn around the MAIT cells.
Immuno 04 00023 g001
Figure 2. T cell (A), B cell (B) and NK cell (C) frequencies in cord blood (n = 10) and in peripheral blood of neonates (n = 17), school-age children (n = 23), young adults (n = 25) and elderly adults (n = 11). Cell frequencies in the different groups were compared using the Kruskal–Wallis test with Dunn’s multiple comparison analysis.
Immuno 04 00023 g002
Figure 3. Frequencies of CD4+ (A), CD8+ (B), CD4+CD8+ (double positive or DP; (C)) and CD4-CD8- (double negative or DN; (D)) T cells in cord blood (n = 10) and in peripheral blood of neonates (n = 17), school-age children (n = 23), young adults (n = 25) and elderly adults (n = 11). Cell frequencies in the different groups were compared using the Kruskal–Wallis test with Dunn’s multiple comparison analysis.
Immuno 04 00023 g003
Figure 4. Frequencies of the innate T cells—Vδ1 T cells (A), Vδ2 T cells (B), invariant natural killer T (iNKT) cells (C) and mucosal-associated invariant T (MAIT) cells (D)—in cord blood (n = 10) and in peripheral blood of neonates (n = 17), school-age children (n = 23), young adults (n = 25) and elderly adults (n = 11). Cell frequencies in the different groups were compared using the Kruskal–Wallis test with Dunn’s multiple comparison analysis.
Immuno 04 00023 g004
Figure 5. Frequencies of CD8+ (A), CD4- CD8- (B) and activated (CD69+; (C)) MAIT cells in cord blood (n = 10) and in peripheral blood of neonates (n = 17), school-age children (n = 23), young adults (n = 25) and elderly adults (n = 11). Cell frequencies in the different groups were compared using the Kruskal–Wallis test with Dunn’s multiple comparison analysis.
Immuno 04 00023 g005
Figure 6. Cytokine levels in 10 cord blood samples and in peripheral blood from 10 healthy neonates, 10 school-age children and 15 adults. Cytokine levels in the different groups were compared using the Kruskal–Wallis test with Dunn’s multiple comparison analysis.
Immuno 04 00023 g006
Disclaimer/Publisher’s Note: The statements, opinions and data contained in all publications are solely those of the individual author(s) and contributor(s) and not of MDPI and/or the editor(s). MDPI and/or the editor(s) disclaim responsibility for any injury to people or property resulting from any ideas, methods, instructions or products referred to in the content.

