Article

Bi-Directional Associations of Affective States and Diet among Low-Income Hispanic Pregnant Women Using Ecological Momentary Assessment

1
Department of Population and Public Health Science, University of Southern California, Los Angeles, CA 90028, USA
2
Health Behaviors Research Branch, Behavioral Research Program, Division of Cancer Control and Population Sciences, National Cancer Institute, National Institutes of Health, Bethesda, MD 20892, USA
3
Department of Psychology, University of Southern California, Los Angeles, CA 90089, USA
*
Author to whom correspondence should be addressed.
Psychiatry Int. 2022, 3(4), 273-285; https://doi.org/10.3390/psychiatryint3040022
Submission received: 22 August 2022 / Revised: 27 September 2022 / Accepted: 29 September 2022 / Published: 8 October 2022

Abstract

:
Affective states play a role in dietary behaviors. Yet, little research has studied within-subjects associations between affect and diet during pregnancy. We examined the acute bidirectional relationships between affect and food intake and moderation by pre-pregnancy body mass index (BMI) in low-income, Hispanic pregnant women using ecological momentary assessment (EMA). Women (N = 57) completed four days of EMA during their first trimester. Women responded to five random prompts per day about their current affect and past two-hour food intake. Higher positive affect (PA) or lower negative affect (NA) predicted greater likelihood of fruit/vegetable consumption in the next two hours in women with lower pre-pregnancy BMI and lower likelihood in women with higher pre-pregnancy BMI. Higher PA predicted less likelihood of fast food consumption in the next two hours in women with lower pre-pregnancy BMI and slightly higher likelihood in women with higher pre-pregnancy BMI. Women with lower pre-pregnancy BMI had higher PA when they reported consuming chips/fries in the past two hours, and women with higher pre-pregnancy BMI had lower PA when they reported consumption of chips/fries in the past two hours. Results showed differential relationships between affect and food intake as a function of pre-pregnancy BMI.

1. Introduction

Excessive gestational weight gain (GWG) is associated with adverse short- and long-term maternal and child outcomes such as hypertensive disorders of pregnancy and obstetric interventions [1] and maternal and child obesity, cardiovascular disease risk, and diabetes [2,3,4]. Low income, Hispanic women are at particular risk for excessive GWG during pregnancy [5,6], which underscores the need for prevention efforts targeting unhealthy GWG in this population. A promising approach to reducing excessive GWG in pregnancy includes improving diet [7]. However, psychoeducational interventions that seek to modify dietary behaviors to prevent excessive GWG have produced mixed results [8], and they do not specifically target low income, Hispanic women [9]. Therefore, greater understanding of determinants of low income, Hispanic women’s dietary intake choices during pregnancy is needed to develop tailored prevention and interventions.
A growing body of research suggests that emotional factors may play a role in dietary intake behaviors. Specifically, in a qualitative study of Hispanic women, negative emotions were identified as a barrier to eating healthy [10]. It is possible that negative emotions impair ability to prepare healthy meals or may increase desire to consume comfort foods. In general, research suggests that positive affect promotes healthy food intake (e.g., consumption of fruits and vegetables) because it may bolster individuals’ ability to make healthier decisions [11]. Additionally, individuals may choose healthy foods to maintain positive affective states, as consumption of healthy foods may lead to feelings of joy or pride [12]. Furthermore, the consumption of healthy foods may predict more positive affect, as individuals may feel good about engaging in healthy behaviors [13]. There is also evidence that both positive and negative affect can predict unhealthy dietary intake. The affect regulation model suggests that individuals consume unhealthy foods, often in large quantities, to cope with feelings of negative affect, such as anger or sadness [14]. Although, other research has shown positive affect to be a predictor of increased unhealthy eating behaviors, particularly in subgroups at-risk for unhealthy eating (e.g., individuals high in emotional eating or with low self-control) [15,16]. Because pregnancy is a unique time where emotions may shift more than usual due to hormones, stress, and body changes [17] and women experience more hunger and cravings [18], it may be particularly relevant to study emotions as antecedents and consequences of dietary behaviors in pregnant women. However, research in this area is scant.
It has been recognized that dietary intake varies both between and within individuals. A burgeoning array of studies have used ecological momentary assessment (EMA) methods to examine positive and negative affective states as antecedents and consequences of dietary behaviors. EMA collects repeated measurements of experiences and behaviors across the day for a short duration (e.g., a week) in individuals’ natural environment [19]. Thereby EMA methods allow for the examination of how behaviors at one moment in time predict subsequent states. Additional strengths of EMA include minimizing recall biases and maximizing ecological validity. EMA studies have found positive bi-directional within-subject associations between positive affect and fruit/vegetable intake [20,21]. In addition, college students with greater positive affect across EMA reported more fruit consumption [22]. Also, among college students, reporting of at least one positive affective state was concurrently related to greater likelihood intake of sweets and less likelihood of intake of fast food, but there were no relations with negative affect [23]. In a separate study, within-subject differences in affective states did not predict subsequent sugary food intake, yet sugary food intake was associated with increased negative affect during the same 2-hr window [22]. Further, between-subjects differences in negative affect were related to sugary food and sweet consumption, such that those with greater negative affect consumed more sugary foods and sweets (21,22]. The existence of bidirectional associations between affective states and food intake behaviors, such that affect predicts subsequent food intake and food intake predicts subsequent affect, could lead to dysfunctional conditioned patterns of food intake [24]. The extent to which these study findings on affect and food intake extend to low-income, Hispanic pregnant women has not been tested.
While differences in the type of study sample may to some degree explain mixed findings, it is also possible that associations between affect and diet may differ based on previously unexplored moderators such as weight status [25,26]. Body mass index (BMI) has been shown to be positively associated with the tendency to eat in response to negative emotions and inversely associated with the tendency to eat in response to positive emotions [27]. Further, longitudinal research has found that emotional eating is associated with increases in BMI [28]. In addition, studies have found positive associations between BMI and reward responsivity to food suggesting that higher weight individuals may derive more pleasure from food [29,30]; this could manifest as increased positive affect and lower negative affect following eating unhealthy food. Finally, BMI is positively associated with body dissatisfaction [31], and thus, women with higher weights may feel more negative affect after eating unhealthy foods or more positive affect after healthy foods given their possible effect on weight gain.
The current analyses examined acute within-subject bidirectional relationships between affective states and dietary intake in low-income Hispanic pregnant women using EMA. It was hypothesized that greater than usual positive affect would be associated with increased likelihood of fruit/vegetable intake in the next two hours, and some fruit/vegetable intake in the previous two hours would predict greater positive affect at the end of that time interval. Additionally, it was hypothesized that greater than usual negative affect would be associated with increased likelihood of no sweets, fried foods, and fast food intake in the next two hours, and intake of these foods in the past two hours would predict greater negative affect at the end of that time interval. Pre-pregnancy BMI was explored as a moderator of these associations. Fruits/vegetables, sweets, chips/fries, and fast food were selected at the target dietary intake behaviors given their contributions to weight gain and caloric intake [32,33,34,35].

2. Methods

2.1. Participants and Procedure

A subsample of low income, Hispanic pregnant women from the Maternal and Developmental Risks from Environmental and Social Stressors (MADRES) cohort completed four days of EMA during their first trimester. A detailed description of the study as well as power analyses are available elsewhere [36]. They responded to five random EMA prompts per day about their current affective states and past two-hour food intake. Women were recruited from designated healthcare facilities (e.g., community clinics, county hospital) in urban Los Angeles that serve low-income women who primarily are on MediCAL. Inclusion criteria for the larger cohort were: <30 weeks since the date of mother’s last menstrual period at the time of enrollment; 18 years of age or older; and singleton pregnancy. Exclusion criteria were HIV positive status; physical, mental, or cognitive disabilities that prevent participation; and current incarceration. For the EMA study, women had to be Hispanic and <20 weeks gestation at enrollment. The analytical sample size was 57 (see Figure 1 for participant flow diagram).
Participants were provided an Android smartphone loaded with the MovisensXS application for each four-day EMA burst, which always included two weekend days. EMA surveys were prompted five times per day at a random time within during pre-set sampling windows (i.e., wake-up–10am; 11am–1pm; 2pm–4pm; 5pm–7pm, and 8pm–bedtime). Sleep and wake times were customized for each participant. Each EMA survey took approximately 2–3 min to complete. Participants had the option to delay surveys if they were prompted during incompatible times. There were up to two reminder prompts sent within 10 min of the initial prompt, after which time the EMA survey was closed. Each survey question was presented on a separate screen. EMA data from smartphones was wirelessly uploaded after each entry and stored on a cloud server or pushed to the server by staff after data collection, where it was viewed by research staff to monitor compliance.

2.2. Measures

Demographic and participant characteristics. Recruitment site, maternal acculturation (foreign-born versus not), participant age at study entry, highest attained education level were self-reported.
Pre-pregnancy BMI. Women self-reported their pre-pregnancy weight and height, which was used to calculate pre-pregnancy BMI (kg/m2). Continuous BMI was used.
Affect. Negative affect was measured with three items: “Right before the phone went off, how (1) angry, (2) sad/depressed, and (3) stressed were you feeling?”, and positive affect was measured with two items: “Right before the phone went off, how (1) happy and (2) calm/relaxed were you feeling?” Response options consisted of a scale ranging from 1 (not at all) to 4 (extremely). Items were combined to create a negative affect and positive affect summary score, which was created by averaging the responses together. In addition, Responses to the two EMA negative affect and positive affect items were internally consistent (Coefficient Omega (ωs) > 0.85). This affect measure has been used in previous EMA research [21].
Food intake. Women reported their recent dietary intake through the following EMA question: “Over the last 2 h, which of these things have you done?” They indicated whether they had consumed the following: (a) pastries, sweets, or pan dulce, (b) chips or fries, (c) fast food, and (d) fruits or vegetables. Participants were instructed to select all that applied. This dietary intake checklist has been used in previous EMA research [21] and has shown concordance with 24hr recalls of dietary intake [37].
Nausea. Participants were asked “Right before the phone went off, how NAUSEOUS were you feeling?” on a 4-point scale from 1 (not at all) to 4 (extremely); these scores were averaged for each day to create a daily nausea score
Day of week. The EMA program recorded whether each day was a weekday or a weekend day.

2.3. Statistical Analysis

Multilevel models (MLMs) tested the bi-directional associations of affect and food intake in two sets of models. The first set of models examined within- and between-subjects associations of affective states and next two-hour dietary intake. The second set of models examined associations between affective states and past two-hour dietary intake. MLMs estimate models that are nested within-persons and can handle time-varying data (e.g., within-subjects variance at prompt) [38].
The first set of MLMs used binary logistic regression to test affective states as predictors of dietary intake. Affect variables were disaggregated into between-subjects (i.e., aggregate level of positive or negative affect across EMA) and within-subjects (i.e., deviation from one’s own average positive or negative affect level at an individual prompt) effects, and within-subjects effects were time-lagged (prompt-1). Models also included pre-pregnancy BMI, and the cross-level interaction between within-subjects time-lagged affect and pre-pregnancy BMI were included as predictors of intake of each dietary outcome within the past two hours.
The second set of MLMs examined past two-hour dietary intake as predictors of current affect. Models included within-subjects dietary intake, between-subjects dietary intake, BMI, and the cross-level interaction between within-subjects dietary intake and pre-pregnancy BMI as predictors of positive and negative affect. Due to non-normality, a zero-truncated Poisson function was applied to the negative affect model. For both sets of models, positive and negative affect and each dietary behavior were tested in different models. All models included the following covariates: maternal age, education level, language preference, recruitment site, EMA nausea (disaggregated into between- and within-subject nausea scores), and weekday vs. weekend day.

3. Results

Participant demographic characteristics are displayed in Table 1. Across all participants, there were 1086 EMA prompts received, of which 914 were responded to for an overall compliance rate of 84% (range from 33% to 100%). Women reported consuming fruit or vegetables in 22.9% of prompts; chips or fries in 4.7% of prompts; pastries or sweets in 8.3% of prompts; and fast food in 6.4% of prompts. EMA affect items had within-subjects internal consistency reliabilities (ωs) of 0.90 (positive affect) and 0.86 (negative affect), and between-subjects ωs were 0.97 (positive affect) and 0.89 (negative affect). Mean level of negative affect across prompts was 1.24 (SD = 0.40) and positive affect was 2.71 (SD = 0.74). The mean level of daily nausea was 1.51 (SD = 0.79).

3.1. Affect Predicting Dietary Intake

Results of models testing affect as a predictor of dietary intake are presented in Table 2. Mothers with higher education or who were foreign born reported greater fruit/vegetable intake, and chips/fries were more likely to be consumed on weekends. There were interactions between pre-pregnancy BMI and positive and negative affect predicting fruit/vegetable intake. When women with lower pre-pregnancy BMI had higher positive affect or lower negative affect than their average, they were subsequently more likely to consume fruits/vegetables in the next two hours. Oppositely, when women with higher pre-pregnancy BMI had higher positive affect or lower negative affect than their average, they were subsequently less likely to consume fruits/vegetables in the next two hours (see Figure 2 and Figure 3). For fast food, there was an interaction between pre-pregnancy BMI and within-subject positive affect (Figure 4). When women with lower pre-pregnancy BMI had higher positive affect than their average, they were subsequently less likely to consume fast food in the next two hours. Higher positive affect slightly increased the likelihood of fast food consumption in the next two hours for women with higher pre-pregnancy BMI, but in general, women with higher pre-pregnancy BMI had lower levels of fast food consumption. There were no associations between affect and consumption of sweets/pastries or chips/fries.

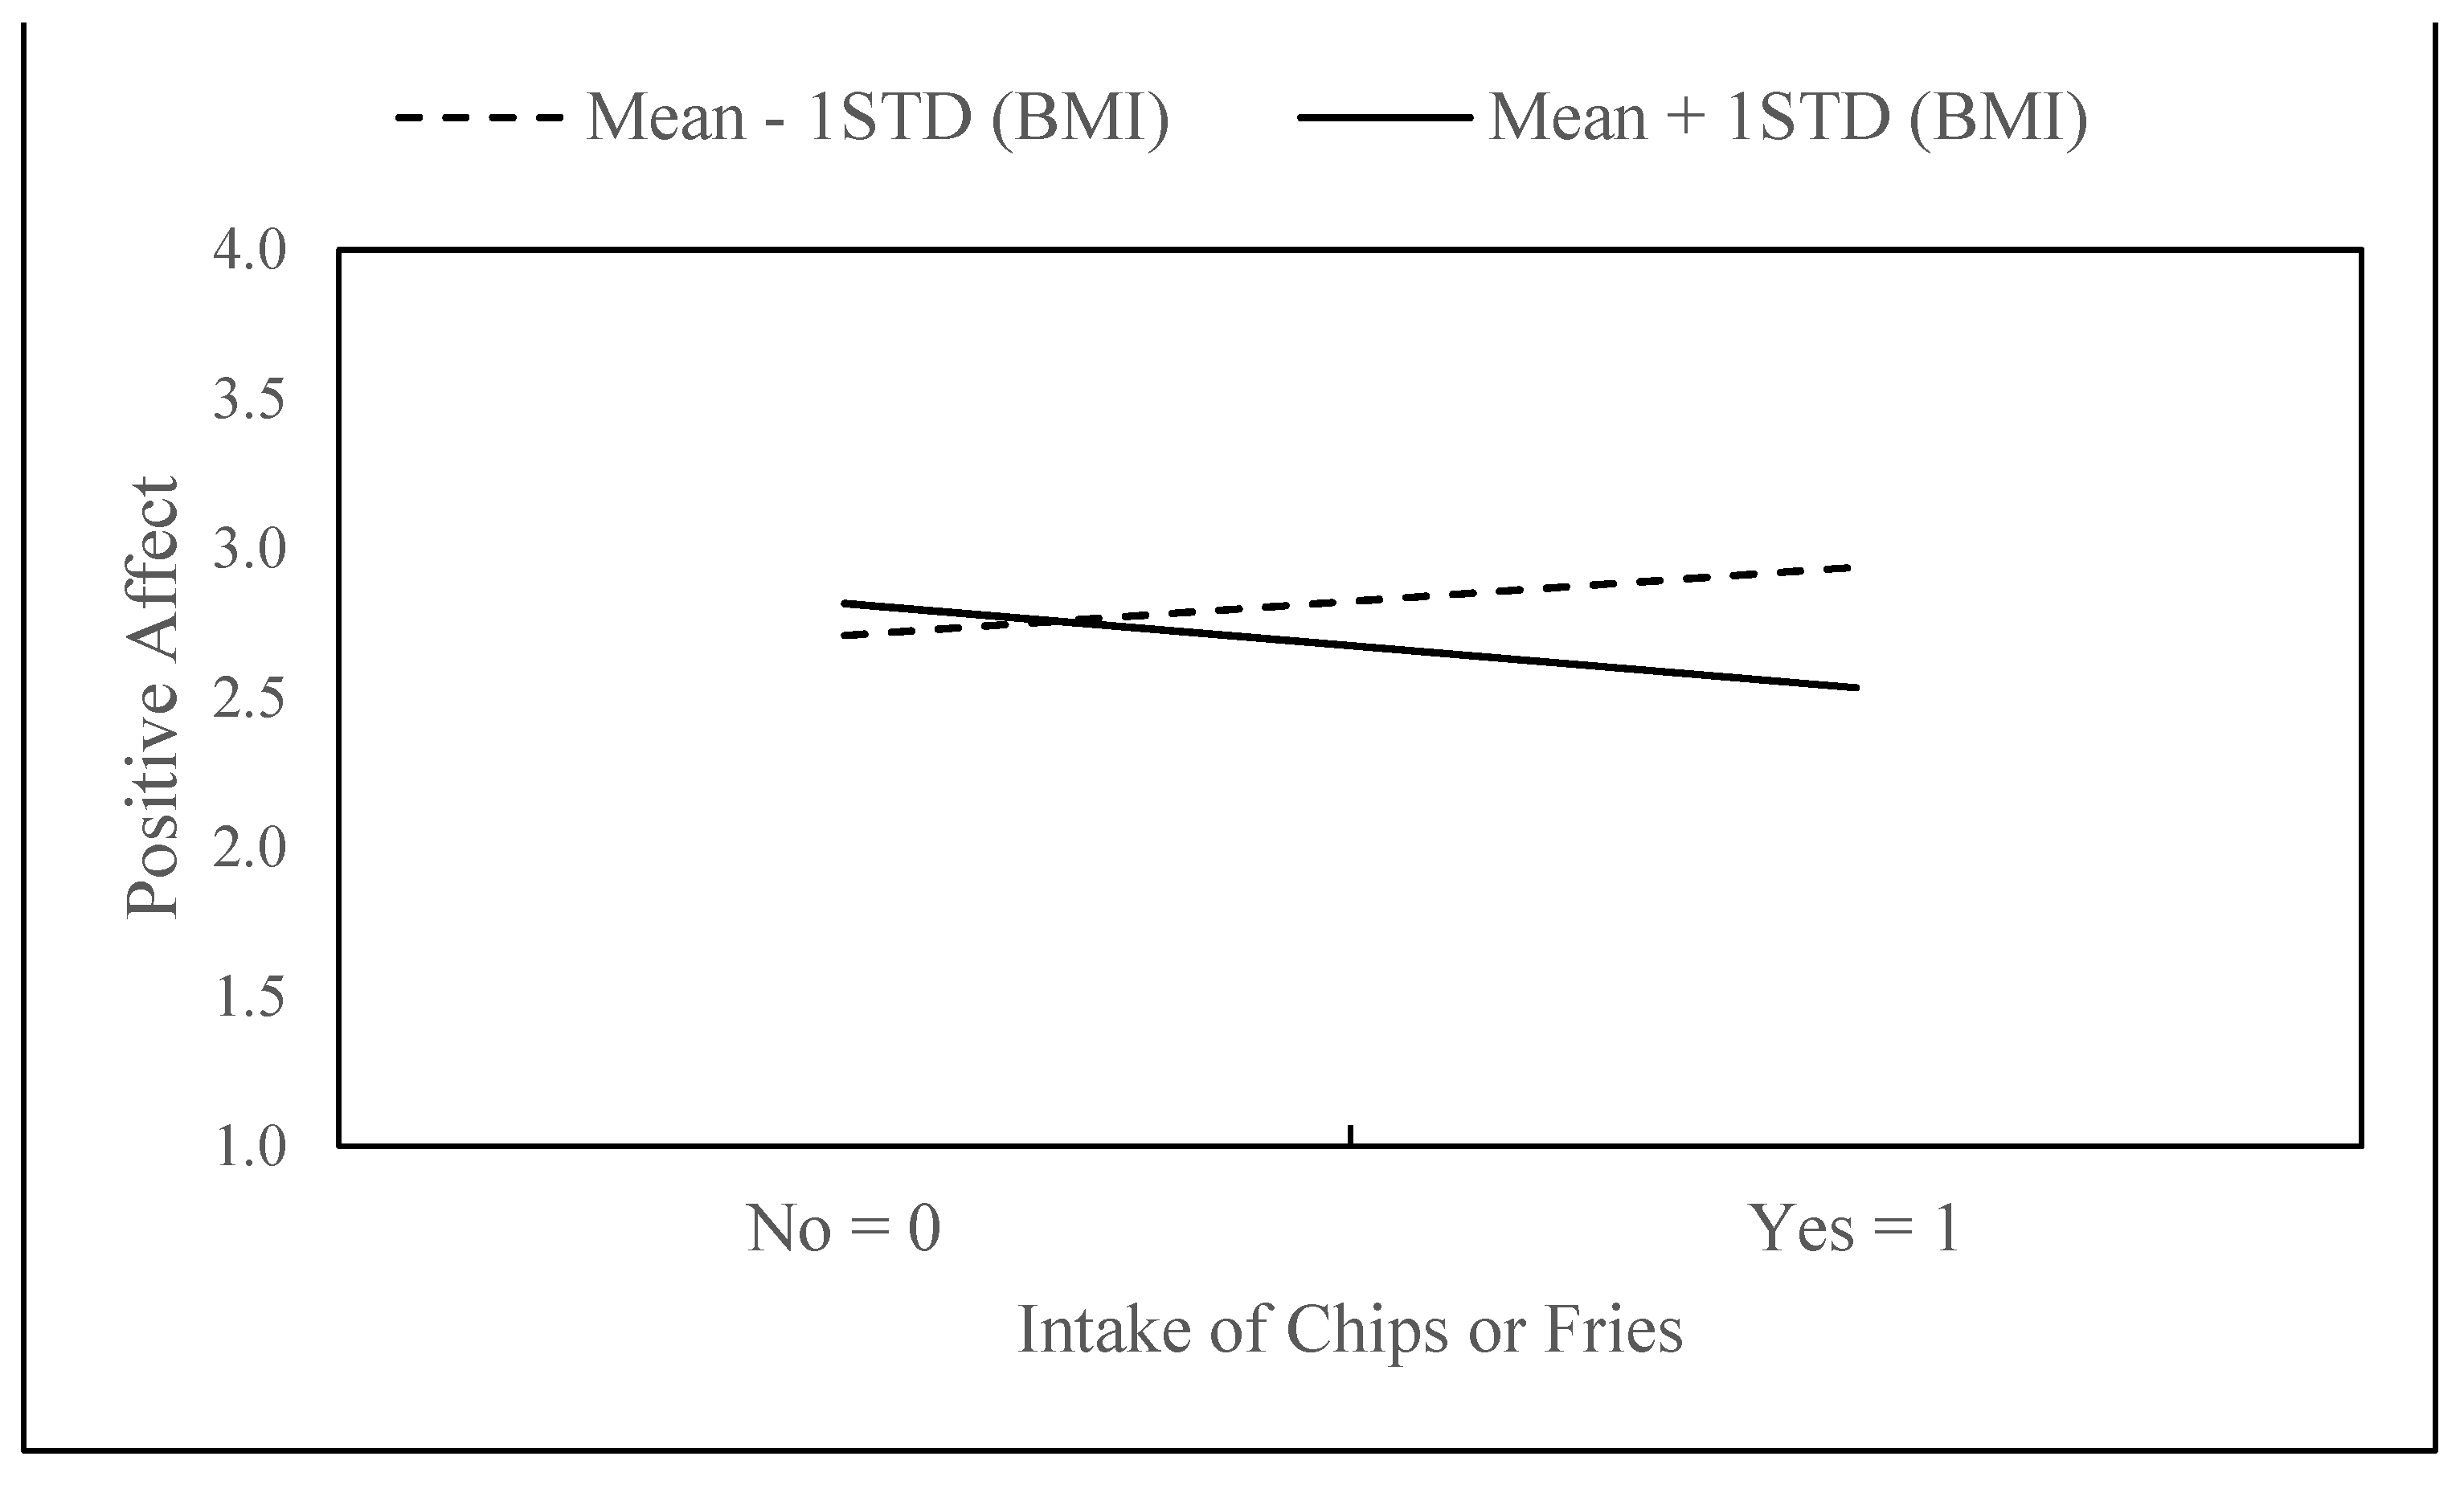
3.2. Dietary Intake Predicting Affect

Results of models of dietary intake predicting affect are displayed in Table 3. Mothers reporting more nausea (both WS and BS nausea effects) had lower positive affect and higher negative affect. Mothers with higher education reported lower negative affect, and positive affect was lower on weekend days. There was a main affect for the association of within-subjects sweets/pastry intake and subsequent negative affect, such that intake of sweets/pastries during a two-hour interval was associated with lower negative affect reported at the end of that interval. Pre-pregnancy BMI interacted with within-subjects chips/fries intake in predicting positive affect. As shown in Figure 5, women with lower pre-pregnancy BMI had higher positive affect when they reported consuming chips or fries in the past two hours compared to when they did not. Conversely, women with higher pre-pregnancy BMI had lower positive affect when they reported consumption of chips or fries in the past two hours.

4. Discussion

This study investigated bi-directional momentary associations between affective states and dietary intake in low-income Hispanic pregnant women, and whether associations differed by pre-pregnancy BMI. To our knowledge, this is the first study to examine affect and food intake using EMA during pregnancy. Hypotheses for main effects were generally not supported as there were no within-subjects effects of affect predicting subsequent dietary intake and only one main effect for intake predicting affect. However, exploratory moderation analyses revealed several interactions with pre-pregnancy BMI.
For fruit and vegetable intake, women with lower pre-pregnancy BMI followed patterns consistent with theory and empirical research [11,20] such that higher positive affect was associated with greater fruit and vegetable intake. It is possible that for women with low pre-pregnancy BMI, positive affect enhances self-regulation, which leads to healthy food choices [39]. In addition, higher negative affect was associated with a lower likelihood of fruit and vegetable intake in the next two hours. Most research has found no relation between negative affect and fruit and vegetable intake [21,22], but it appears during pregnancy negative affect may have a more relevant role. Oppositely, when women with higher pre-pregnancy BMI had lower positive affect and higher negative affect than their average, they were subsequently more likely to consume fruits/vegetables in the next two hours. It is possible that women with higher pre-pregnancy BMI consume food for comfort or affect regulation but choose fruit and vegetables given the importance of eating healthy during pregnancy. For instance, a previous systematic review showed that women tend to increase fruit and vegetable intake and decrease fried and fast food intake during pregnancy [40].
For fast food, when women with lower pre-pregnancy BMI had higher positive affect than their average, they were subsequently less likely to consume fast food in the next two hours. In non-pregnant populations, EMA research found no associations between positive affect and unhealthy food intake behaviors [21,22]. However, theory suggests that positive affect helps promote healthy habits and goal-directed behaviors and may enhance self-regulation [11,39]. Therefore, it is possible that when pregnant women with lower pre-pregnancy BMI have higher than average positive affect, they are more motivated to put in the effort required to cook at home.
With regard to the associations between dietary intake and subsequent affect, there was a main effect of sweet food intake on greater negative affect and an interaction between chips/fries intake by weight status on positive affect. Consumption of sugary foods or pastries may be associated with greater negative affect due to guilt about eating [41], particularly during pregnancy when women may have body image issues and/or are told to eat healthier [42,43]. Consumption of chips/fries was associated with higher positive affect among women with lower pre-pregnancy BMI and lower positive affect among women with higher pre-pregnancy BMI. It is possible that chips/fries are differentially rewarding for pregnant women depending on pre-pregnancy BMI, but this pattern requires further investigation. We did not find any evidence for bidirectional associations between affective states and specific food intake behaviors. Instead, most associations were unidirectional (e.g., affect predicted fruit/vegetable and fast food intake, but fruit/vegetable and fast food intake did not predict affect).
Strengths of the current study include use of EMA in an understudied population of pregnant women and assessment of intake of a range of food categories. There are several limitations to note. This study only examined positive and negative affective states, which was done to reduce the burden on participants during EMA. However, there are other self-conscious emotions that may be relevant to examine in future research on affect and eating during pregnancy (e.g., shame, guilt, anxiety). Furthermore, dietary intake was recalled across a two-hour interval, but relationships between affect and food intake may occur across shorter time scales, which would be missed with the current sampling schedule. Future studies may benefit from having women initiate eating event recordings when they occur (i.e., event-contingent recording). This study also did not assess food portion size, which could be related to affective states. For example, studies have shown affect and binge eating to be highly linked [44]. Future studies examining the effect of portion size and caloric intake may reveal different associations between affect and behavior. Further, while this study uncovered associations between affect and food intake that differed based on pre-pregnancy BMI, we can only speculate on the mechanisms that drive these associations. Future research should study other trait variables related to eating behavior and BMI that may be more salient moderators of affect-behavior relationships. Such factors include emotional eating, hedonic hunger, or dietary restraint, which have all been shown to be positively correlated with BMI.
Overall, this study elucidated bi-directional associations between affect and food intake in low income, Hispanic pregnant women. Results showed that associations differed depending on BMI status. Therefore, future EMA research on momentary determinants of health behaviors in pregnant women should include large samples of various weight groups. Further, future EMA research should examine other factors influencing food availability and choice (e.g., poverty, lack of time, difficulty with accessing and purchasing fresh fruits and vegetables) and how these may influence the association between affective states and food intake in low-income populations. Finally, prevention, intervention, and clinical implications may differ by weight status during pregnancy.

Author Contributions

Conceptualization: T.B.M. and G.F.D.; Methodology: T.B.M., C.V.B. and G.F.D.; Formal Analysis: T.B.M., W.-L.W. and D.C.; Data Curation: W.-L.W. and D.C.; Writing—Original Draft Preparation: T.B.M.; Writing—Review and Editing: T.B., S.G.O., J.C., C.H.N., S.P.E., R.H., C.V.B. and G.F.D.; Funding Acquisition: C.V.B. and G.F.D. All authors have read and agreed to the published version of the manuscript.

Funding

This work was supported by the National Institute of Environmental Health Sciences award number 5P50ES026086 (Gilliland, Breton) and the National Institute of Diabetes and Digestive and Kidney Diseases Award Number K01DK124435 (Mason).

Institutional Review Board Statement

The study was conducted according to the guidelines of the Declaration of Helsinki and approved by the University of Southern California Health Sciences Institutional Review Board (HS-15-00507).

Informed Consent Statement

Informed consent was obtained from all subjects involved in the study.

Data Availability Statement

The data presented in this study are available on request from the corresponding author.

Conflicts of Interest

The authors declare no conflict of interest.

References

  1. Truong, Y.N.; Yee, L.M.; Caughey, A.B.; Cheng, Y.W. Weight gain in pregnancy: Does the Institute of Medicine have it right? Am. J. Obstet. Gynecol. 2015, 212, 362.e1. [Google Scholar] [CrossRef] [PubMed]
  2. Fraser, A.; Tilling, K.; Macdonald-Wallis, C.; Sattar, N.; Brion, M.-J.; Benfield, L.; Ness, A.; Deanfield, J.; Hingorani, A.; Nelson, S.M.; et al. Association of Maternal Weight Gain in Pregnancy With Offspring Obesity and Metabolic and Vascular Traits in Childhood. Circulation 2010, 121, 2557–2564. [Google Scholar] [CrossRef] [Green Version]
  3. Hedderson, M.M.; Gunderson, E.P.; Ferrara, A. Gestational Weight Gain and Risk of Gestational Diabetes Mellitus. Obstet. Gynecol. 2010, 115, 597–604. [Google Scholar] [CrossRef] [Green Version]
  4. Houghton, L.; Ester, W.; Lumey, L.; Michels, K.; Wei, Y.; Cohn, B.; Susser, E.; Terry, M. Maternal weight gain in excess of pregnancy guidelines is related to daughters being overweight 40 years later. Am. J. Obstet. Gynecol. 2016, 215, 246.e1–246.e8. [Google Scholar] [CrossRef] [Green Version]
  5. Headen, I.E.; Davis, E.M.; Mujahid, M.S.; Abrams, B. Racial-Ethnic Differences in Pregnancy-Related Weight. Adv. Nutr. Int. Rev. J. 2012, 3, 83–94. [Google Scholar] [CrossRef] [PubMed] [Green Version]
  6. Rosal, M.C.; Wang, M.L.; Simas, T.A.M.; Bodenlos, J.S.; Crawford, S.L.; Leung, K.; Sankey, H.Z. Predictors of Gestational Weight Gain among White and Latina Women and Associations with Birth Weight. J. Pregnancy 2016, 2016, 8984928. [Google Scholar] [CrossRef] [Green Version]
  7. Rogozinska, E.; Marlin, N.; Dodds, J.P.; Kerry, S.; Khan, K.; Thangaratinam, S.; Zamora, J. Effect of diet and physical activity based interventions in pregnancy on gestational weight gain and pregnancy outcomes: Individual participant data (IPD) meta-analysis of randomised trials. BMJ 2017, 358, j3119. [Google Scholar] [CrossRef] [Green Version]
  8. Gardner, B.; Wardle, J.; Poston, L.; Croker, H. Changing diet and physical activity to reduce gestational weight gain: A meta-analysis. Obes. Rev. 2011, 12, e602–e620. [Google Scholar] [CrossRef] [PubMed]
  9. Chasan-Taber, L. Physical Activity and Dietary Behaviors Associated With Weight Gain and Impaired Glucose Tolerance Among Pregnant Latinas. Adv. Nutr. Int. Rev. J. 2012, 3, 108–118. [Google Scholar] [CrossRef] [Green Version]
  10. Fletcher, G.E.; Teeters, L.; Schlundt, D.; Bonnet, K.; Heerman, W.J. Maternal conception of gestational weight gain among Latinas: A qualitative study. Health Psychol. 2018, 37, 132–138. [Google Scholar] [CrossRef]
  11. Isen, A.M. An Influence of Positive Affect on Decision Making in Complex Situations: Theoretical Issues with Practical Implications. J. Consum. Psychol. 2001, 11, 75–85. [Google Scholar] [CrossRef] [Green Version]
  12. Wansink, B.; Cheney, M.M.; Chan, N. Exploring comfort food preferences across age and gender1. Physiol. Behav. 2003, 79, 739–747. [Google Scholar] [CrossRef]
  13. Wahl, D.R.; Villinger, K.; König, L.M.; Ziesemer, K.; Schupp, H.T.; Renner, B. Healthy food choices are happy food choices: Evidence from a real life sample using smartphone based assessments. Sci. Rep. 2017, 7, 11644. [Google Scholar] [CrossRef] [PubMed] [Green Version]
  14. Polivy, J.; Herman, C.P. Etiology of binge eating: Psychological mechanisms. In Binge eating: Nature, Assessment, and Treatment; Fairburn, C.G., Wilson, G.T., Eds.; Guilford Press: New York, NY, USA, 1993; pp. 173–205. [Google Scholar]
  15. Bongers, P.; Jansen, A.; Havermans, R.; Roefs, A.; Nederkoorn, C. Happy eating. The underestimated role of overeating in a positive mood. Appetite 2013, 67, 74–80. [Google Scholar] [CrossRef] [PubMed]
  16. Smith, K.E.; Mason, T.B.; Crosby, R.D.; Engel, S.G.; Wonderlich, S.A. A multimodal, naturalistic investigation of relationships between behavioral impulsivity, affect, and binge eating. Appetite 2019, 136, 50–57. [Google Scholar] [CrossRef] [PubMed]
  17. Bjelica, A.; Cetkovic, N.; Trninic-Pjevic, A.; Mladenović-Segedi, L. The phenomenon of pregnancy—A psychological view. Ginekol. Polska 2018, 89, 102–106. [Google Scholar] [CrossRef] [PubMed] [Green Version]
  18. Groth, S.W.; Meng, Y.; Yeh, K.-L.; Fernandez, I.D. Influence of Appetite and Perceived Ability to Control Cravings on Excessive Gestational Weight Gain. J. Obstet. Gynecol. Neonatal Nurs. 2021, 50, 669–678. [Google Scholar] [CrossRef] [PubMed]
  19. Shiffman, S.; Stone, A.A.; Hufford, M.R. Ecological momentary assessment. Annu. Rev. Clin. Psychol. 2008, 4, 1–32. [Google Scholar] [CrossRef] [PubMed]
  20. Liao, Y.; Schembre, S.; O’Connor, S.; Belcher, B.R.; Maher, J.P.; Dzubur, E.; Dunton, G.F. An Electronic Ecological Momentary Assessment Study to Examine the Consumption of High-Fat/High-Sugar Foods, Fruits/Vegetables, and Affective States among Women. J. Nutr. Educ. Behav. 2018, 50, 626–631. [Google Scholar] [CrossRef]
  21. Mason, T.B.; O’Connor, S.G.; Schembre, S.M.; Huh, J.; Chu, D.; Dunton, G.F. Momentary affect, stress coping, and food intake in mother–child dyads. Health Psychol. 2019, 38, 238–247. [Google Scholar] [CrossRef]
  22. Jeffers, A.J.; Mason, T.B.; Benotsch, E.G. Psychological eating factors, affect, and ecological momentary assessed diet quality. Eat. Weight Disord.-Stud. Anorexia, Bulim. Obes. 2020, 25, 1151–1159. [Google Scholar] [CrossRef] [PubMed]
  23. Ashurst, J.; van Woerden, I.; Dunton, G.; Todd, M.; Ohri-Vachaspati, P.; Swan, P.; Bruening, M. The Association among Emotions and Food Choices in First-Year College Students Using mobile-Ecological Momentary Assessments. BMC Public Health 2018, 18, 573. [Google Scholar] [CrossRef] [PubMed] [Green Version]
  24. Macht, M. How emotions affect eating: A five-way model. Appetite 2008, 50, 1–11. [Google Scholar] [CrossRef] [PubMed]
  25. Geliebter, A.; Aversa, A. Emotional eating in overweight, normal weight, and underweight individuals. Eat. Behav. 2002, 3, 341–347. [Google Scholar] [CrossRef]
  26. Reichenberger, J.; Kuppens, P.; Liedlgruber, M.; Wilhelm, F.H.; Tiefengrabner, M.; Ginzinger, S.; Blechert, J. No haste, more taste: An EMA study of the effects of stress, negative and positive emotions on eating behavior. Biol. Psychol. 2018, 131, 54–62. [Google Scholar] [CrossRef] [Green Version]
  27. Nolan, L.J.; Halperin, L.B.; Geliebter, A. Emotional Appetite Questionnaire. Construct validity and relationship with BMI. Appetite 2010, 54, 314–319. [Google Scholar] [CrossRef] [Green Version]
  28. Shriver, L.H.; Dollar, J.M.; Lawless, M.; Calkins, S.D.; Keane, S.P.; Shanahan, L.; Wideman, L. Longitudinal Associations between Emotion Regulation and Adiposity in Late Adolescence: Indirect Effects through Eating Behaviors. Nutrients 2019, 11, 517. [Google Scholar] [CrossRef] [Green Version]
  29. Luo, S.; Romero, A.; Adam, T.C.; Hu, H.H.; Monterosso, J.; Page, K.A. Abdominal fat is associated with a greater brain reward response to high-calorie food cues in hispanic women. Obesity 2013, 21, 2029–2036. [Google Scholar] [CrossRef] [Green Version]
  30. Price, M.; Higgs, S.; Lee, M. Self-reported eating traits: Underlying components of food responsivity and dietary restriction are positively related to BMI. Appetite 2015, 95, 203–210. [Google Scholar] [CrossRef] [Green Version]
  31. Mason, T.B.; Lewis, R.J. Assessing the roles of impulsivity, food-related cognitions, BMI, and demographics in the dual pathway model of binge eating among men and women. Eat. Behav. 2015, 18, 151–155. [Google Scholar] [CrossRef]
  32. Guallar-Castillón, P.; Rodríguez-Artalejo, F.; Fornés, N.S.; Banegas, J.R.; Etxezarreta, P.A.; Ardanaz, E.; Barricarte, A.; Chirlaque, M.-D.; Iraeta, M.D.; Larrañaga, N.; et al. Intake of fried foods is associated with obesity in the cohort of Spanish adults from the European Prospective Investigation into Cancer and Nutrition. Am. J. Clin. Nutr. 2007, 86, 198–205. [Google Scholar] [CrossRef] [Green Version]
  33. Nour, M.; Lutze, S.A.; Grech, A.; Allman-Farinelli, M. The Relationship between Vegetable Intake and Weight Outcomes: A Systematic Review of Cohort Studies. Nutrients 2018, 10, 1626. [Google Scholar] [CrossRef] [PubMed] [Green Version]
  34. Rosenheck, R. Fast food consumption and increased caloric intake: A systematic review of a trajectory towards weight gain and obesity risk. Obes. Rev. 2008, 9, 535–547. [Google Scholar] [CrossRef] [PubMed]
  35. Te Morenga, L.; Mallard, S.; Mann, J. Dietary sugars and body weight: Systematic review and meta-analyses of randomised controlled trials and cohort studies. BMJ 2013, 345, e7492. [Google Scholar] [CrossRef] [PubMed] [Green Version]
  36. O’Connor, S.; Habre, R.; Bastain, T.M.; Toledo-Corral, C.; Gilliland, F.D.; Eckel, S.P.; Cabison, J.; Naya, C.H.; Farzan, S.F.; Chu, D.; et al. Within-subject effects of environmental and social stressors on pre- and post-partum obesity-related biobehavioral responses in low-income Hispanic women: Protocol of an intensive longitudinal study. BMC Public Health 2019, 19, 253. [Google Scholar] [CrossRef]
  37. O’Connor, S.G.; Ke, W.; Dzubur, E.; Schembre, S.; Dunton, G.F. Concordance and predictors of concordance of children’s dietary intake as reported via ecological momentary assessment and 24 h recall. Public Health Nutr. 2018, 21, 1019–1027. [Google Scholar] [CrossRef] [Green Version]
  38. Garson, G. Hierarchical Linear Modeling: Guide and Applications; Sage: Thousand Oaks, CA, USA, 2013. [Google Scholar] [CrossRef]
  39. Tice, D.M.; Baumeister, R.F.; Shmueli, D.; Muraven, M. Restoring the self: Positive affect helps improve self-regulation following ego depletion. J. Exp. Soc. Psychol. 2007, 43, 379–384. [Google Scholar] [CrossRef]
  40. Hillier, S.E.; Olander, E.K. Women’s dietary changes before and during pregnancy: A systematic review. Midwifery 2017, 49, 19–31. [Google Scholar] [CrossRef] [Green Version]
  41. Kuijer, R.G.; Boyce, J.A. Chocolate cake. Guilt or celebration? Associations with healthy eating attitudes, perceived behavioural control, intentions and weight-loss. Appetite 2014, 74, 48–54. [Google Scholar] [CrossRef]
  42. Hodgkinson, E.L.; Smith, D.M.; Wittkowski, A. Women’s experiences of their pregnancy and postpartum body image: A systematic review and meta-synthesis. BMC Pregnancy Childbirth 2014, 14, 330. [Google Scholar] [CrossRef] [Green Version]
  43. Institute of Medicine (US); National Research Council (US). Committee to Reexamine IOM Pregnancy Weight Guidelines. Weight Gain during Pregnancy: Reexamining the Guidelines; Rasmussen, K.M., Yaktine, A.L., Eds.; National Academies Press (US): Washington, DC, USA, 2009. [Google Scholar]
  44. Engel, S.G.; Crosby, R.D.; Thomas, G.; Bond, D.; Lavender, J.M.; Mason, T.; Steffen, K.J.; Green, D.D.; Wonderlich, S.A. Ecological Momentary Assessment in Eating Disorder and Obesity Research: A Review of the Recent Literature. Curr. Psychiatry Rep. 2016, 18, 37. [Google Scholar] [CrossRef] [PubMed]
Figure 1. Diagram of flow of study participants.
Psychiatryint 03 00022 g001
Figure 2. Two-way interactions of lagged within-subjects positive affect and pre-pregnancy BMI predicting intake of fruits and vegetables. The x-axis shows values of within-subjects positive affect with 0 representing one’s own average level of positive affect, positive values representing greater than one’s own average level of positive affect, and negative values representing lower than one’s own average level of positive affect. The y-axis represents the probability of fruit and vegetable intake.
Psychiatryint 03 00022 g002
Figure 3. Two-way interactions of lagged within-subjects negative affect and pre-pregnancy BMI predicting intake of fruits and vegetables. The x-axis shows values of within-subjects negative affect with 0 representing one’s own average level of negative affect, positive values representing greater than one’s own average level of negative affect, and negative values representing lower than one’s own average level of negative affect. The y-axis represents the probability of fruit and vegetable intake.
Psychiatryint 03 00022 g003
Figure 4. Two-way interaction of lagged within-subjects positive affect and pre-pregnancy BMI predicting fast food intake. The x-axis shows values of within-subjects positive affect with 0 representing one’s own average level of positive affect, positive values representing greater than one’s own average level of positive affect, and negative values representing lower than one’s own average level of positive affect. The y-axis represents the probability of fast food intake.
Psychiatryint 03 00022 g004
Figure 5. Two-way interaction of within-subjects chips or fries intake and pre-pregnancy BMI predicting positive affect. The x-axis includes times when women indicated not consuming chips/fries or consuming chips/fries. The y-axis represents the mean level of positive affect.
Psychiatryint 03 00022 g005
Table 1. Demographic Descriptive Statistics.
PercentMeanStdMinMax
Pregnancy BMI (kg/m2) 29.576.7319.0751.97
Age (years) 28.776.0918.3145.42
Education
Less than 12th grade (did not finish high school)35.6%
Completed grade 12 (high school)28.8%
Some college or technical school23.7%
Completed four years of college8.5%
Some graduate training after college3.4%
Language Preference
English54.2%
Spanish45.8%
Citizenship
US-Born44.1%
Foreign-Born55.9%
Table 2. Results of Multilevel Logistic Models Testing Affect Predicting Subsequent Food intake.
Regressor/OutcomeFruits/VegetablesSweets/PastriesChips/Fried FoodsFast Food
ORpORpORpORp
Positive affect (PA)
Intercept0.140.1240.640.7340.190.3010.720.831
Level 1 (n = 589)
Weekend vs. weekday0.990.9581.460.1972.100.0411.160.613
Lagged within-subjects PA10.940.0108.050.1210.910.9500.060.020
Lagged within-subjects nauseous1.190.3300.780.3271.130.6821.000.995
Level 2 (n = 57)
Between-subjects PA0.810.5230.520.0731.330.5261.350.486
Between-subjects nauseous0.860.6311.710.0721.180.6851.120.774
BMI0.980.3630.940.0500.960.3480.980.614
Maternal baseline age1.190.5531.010.9660.770.5850.790.571
Maternal education level1.580.0160.960.8481.080.7650.710.177
Site of data collection1.090.8370.500.0951.710.3670.960.937
Foreign-born vs. US-born2.360.0291.490.3080.480.1580.530.206
Interaction
BMI × Lagged within-subjects PA0.920.0100.950.2081.020.7371.090.037
Negative affect
Intercept0.140.1331.020.9880.140.2290.760.860
Level 1 (n = 589)
Weekend vs. weekday1.010.9561.410.2342.060.0451.150.643
Lagged within-subjects NA0.070.0320.080.26810.150.29117.520.172
Lagged within-subjects nauseous1.200.2970.700.1571.080.8001.030.923
Level 2 (n = 57)
Between-subjects NA0.960.9650.560.5481.590.7170.590.642
Between-subjects nauseous0.910.7632.180.0111.020.9661.070.851
BMI0.980.4120.940.0470.970.3810.980.567
Maternal baseline age1.170.5931.000.9970.790.6050.810.602
Maternal education level1.550.0230.890.5791.110.6650.720.178
Site of data collection1.060.8850.440.0651.890.2910.930.896
Foreign-Born vs. US-born2.370.0271.400.4000.480.1480.510.169
Interaction
BMI × lagged within-subjects NA1.090.0331.060.4980.930.3420.910.192
Note. Outcomes are measured as intake of the food item (no = 0, yes = 1); OR = Odds Ratio; PA = positive affect; BMI = body mass index; NA = negative affect.
Table 3. Results of Multilevel Models of Food Intake Predicting Affect.
OutcomeOutcome
Positive AffectNegative Affect
BetapBetap
Fruits/vegetables
Intercept2.282<0.00011.9900.106
Level 1 (n = 589)
Weekend vs. weekday−0.1170.0100.2830.140
Intake vs. no intake0.2000.461−1.0020.378
Within-subjects nauseous−0.234<0.00010.6320.001
Level 2 (n = 57)
Between-subjects nauseous−0.2690.0310.6860.015
BMI0.0080.508−0.0460.094
Maternal baseline age0.0490.6930.2780.341
Maternal education level0.0620.435−0.4530.014
Site of data collection0.0640.710−1.2210.003
Foreign-Born vs. US-born−0.1380.407−0.3740.326
Interaction
BMI × Intake vs. no intake−0.0050.5930.0280.478
Sweets/pastries
Intercept2.286<0.00012.2230.067
Level 1 (n = 589)
Weekend vs. weekday−0.1160.0110.2680.166
Intake vs. no intake0.2270.606−3.6970.045
Within-subjects nauseous−0.230<0.00010.6070.001
Level 2 (n = 57)
Between-subjects nauseous−0.2750.0280.7370.009
BMI0.0070.547−0.0470.070
Maternal baseline age0.0560.6510.2230.439
Maternal education level0.0660.405−0.4640.010
Site of data collection0.0650.707−1.2500.002
Foreign-Born vs. US-born−0.1320.428−0.3840.306
Interaction
BMI × Intake vs. no intake−0.0070.6680.1150.078
Chips/fried foods
Intercept2.209<0.00011.8550.123
Level 1 (n = 589)
Weekend vs. weekday−0.1080.0170.2770.150
Intake vs. no intake1.1520.007−0.2980.865
Within-subjects nauseous−0.232<0.00010.6210.001
Level 2 (n = 57)
Between-subjects nauseous−0.2650.0340.6950.012
BMI0.0080.452−0.0390.129
Maternal baseline age0.0580.6400.2480.385
Maternal education level0.0730.359−0.4650.010
Site of data collection0.0670.700−1.2080.002
Foreign-Born vs. US-born−0.1220.463−0.4100.272
Interaction
BMI × Intake no intake−0.0400.0070.0080.895
Fast food
Intercept2.303<0.00011.7980.135
Level 1 (n = 589)
Weekend vs. weekday−0.1160.0110.2740.153
Intake vs. no intake−0.1010.7840.3730.814
Within-subjects nauseous−0.233<0.00010.6210.001
Level 2 (n = 57)
Between-subjects nauseous−0.2720.0300.6970.012
BMI0.0060.604−0.0370.148
Maternal baseline age0.0550.6530.2500.382
Maternal education level0.0690.388−0.4640.010
Site of data collection0.0640.710−1.2120.002
Foreign-Born vs. US-born−0.1280.442−0.4020.283
Interaction
BMI × Intake vs. no intake0.0070.542−0.0150.776
Note. Outcome is mean level of positive or negative affect (range = 1–4); PA = positive affect; BMI = body mass index; NA = negative affect.
Publisher’s Note: MDPI stays neutral with regard to jurisdictional claims in published maps and institutional affiliations.

