Article

Nomogram Based on the Most Relevant Clinical, CT, and Radiomic Features, and a Machine Learning Model to Predict EGFR Mutation Status in Non-Small Cell Lung Cancer

by
Anass Benfares
1,2,*,
Abdelali yahya Mourabiti
1,2,
Badreddine Alami
1,2,
Sara Boukansa
1,2,
Ikram Benomar
1,2,3,
Nizar El Bouardi
1,2,
Moulay Youssef Alaoui Lamrani
1,2,
Hind El Fatimi
1,2,
Bouchra Amara
1,2,
Mounia Serraj
1,2,
Mohammed Smahi
1,2,
Abdeljabbar Cherkaoui
4,
Mamoun Qjidaa
4,
Ahmed Lakhssassi
5,
Mohammed Ouazzani Jamil
3,
Mustapha Maaroufi
1 and
Hassan Qjidaa
1,3,*
1
Faculty of Sciences, Department of Computer Science, Sidi Mohammed Ben Abdellah University, Fez 30000, Morocco
2
Faculty of Medicine, Department of Radiology, Sidi Mohammed Ben Abdellah University, Fez 30000, Morocco
3
Faculty of Engineering Sciences, Private University of Fez, Fez 30000, Morocco
4
National School of Applied Sciences, Abdelmalek Essaadi University, Tetouan 93030, Morocco
5
Department of Computer Science and Engineering, Université du Québec en Outaouais, Gatineau, QC J8X 3X7, Canada
*
Authors to whom correspondence should be addressed.
J. Respir. 2025, 5(3), 11; https://doi.org/10.3390/jor5030011
Submission received: 4 May 2025 / Revised: 3 July 2025 / Accepted: 16 July 2025 / Published: 23 July 2025

Abstract

Background: This study aimed to develop a nomogram based on the most relevant clinical, CT, and radiomic features comprising 11 key signatures (2 clinical, 2 CT-based, and 7 radiomic) for the non-invasive prediction of the EGFR mutation status and to support the timely initiation of tyrosine kinase inhibitor (TKI) therapy in patients with non-small cell lung cancer (NSCLC) adenocarcinoma. Methods: Retrospective real-world data were collected from 521 patients with histologically confirmed NSCLC adenocarcinoma who underwent CT imaging and either surgical resection or pathological biopsy for EGFR mutation testing. Five Random Forest classification models were developed and trained on various datasets constructed by combining clinical, CT, and radiomic features extracted from CT image regions of interest (ROIs), with and without feature preselection. Results: The model trained exclusively on the most relevant clinical, CT, and radiomic features demonstrated superior predictive performance compared to the other models, with strong discrimination between EGFR-mutant and wild-type cases (AUC = 0.88; macro-average = 0.90; micro-average = 0.89; precision = 0.90; recall = 0.94; F1-score = 0.91; and accuracy = 0.87). Conclusions: A nomogram constructed using a Random Forest model trained solely on the most informative clinical, CT, and radiomic features outperformed alternative approaches in the non-invasive prediction of the EGFR mutation status, offering a promising decision-support tool for precision treatment planning in NSCLC.

1. Introduction

Lung cancer is one of the deadliest cancers in the world. Adenocarcinoma accounts for 80% of lung cancers [1,2]. At diagnosis, approximately 70% of patients have locally advanced and/or metastatic disease and are inoperable. Non-small cell lung cancer (NSCLC) accounts for 85% of all lung cancers [3].
NSCLC can be affected by specific genetic mutations. Epidermal growth factor receptor (EGFR) mutations are one of the most common mutations. Other mutations, such as KRAS, ALK, ROS1, BRAF, and NTRK, can also be present [4,5,6]. The treatment of NSCLC has evolved over the past decade. Cytotoxic chemotherapy has given way to targeted therapy based on molecular mutations [7,8,9,10]. Among the first targeted treatments for NSCLC are small-molecule tyrosine kinase inhibitors (TKIs) that specifically target EGFR mutations. TKIs targeting EGFR mutations are particularly effective in patients harboring these mutations. The response to EGFR TKIs is significantly higher in patients with EGFR mutations [11]. Clinical studies have shown that treatments based on erlotinib, gefitinib, or afatinib are effective in EGFR-mutated NSCLC. These treatments result in longer survival and higher response rates compared to standard chemotherapy [12]. However, patients with non-mutated EGFR lung cancer should not benefit from these treatments. Indeed, survival is significantly shorter in patients treated with targeted therapies without EGFR mutations [9,10]. Therefore, it is crucial to precisely identify a patient’s genetic mutation status to guide treatment.
To overcome the limitations of conventional chemotherapy [13], targeted therapies based on epidermal growth factor receptor (EGFR) tyrosine kinase inhibitors (TKIs) have been developed [14,15,16,17,18,19]. However, these therapies are only effective in a subset of patients with lung cancer. Patient eligibility for these therapies typically requires histopathological analysis of tumor tissue obtained via surgical resection or biopsy. However, these procedures have several limitations:
  • These procedures are often invasive;
  • They may require repeated sampling due to the dynamic nature of tumor genetic mutations during treatment;
  • Biopsy procedures often target only a limited tumor region, which may not reflect the tumor’s intratumoral heterogeneity [20,21];
  • Elderly patients and those with high-risk ground-glass opacity patterns often decline surgery or biopsy;
  • Concordance between circulating tumor DNA (ctDNA) in plasma and tumor tissue demonstrates substantial variability [22,23];
  • Low ctDNA concentrations in NSCLC are associated with reduced assay sensitivity and increased false-negative rates [24,25].
To address these limitations, the scientific community has increasingly adopted artificial intelligence (AI) techniques to develop non-invasive methods for lung cancer prediction [26,27,28,29,30,31]. To overcome these limitations, researchers have increasingly used approaches that leverage high-dimensional tumor characteristics embedded in clinical and radiomic features, enabling the non-invasive prediction of EGFR mutation status. Yang et al. [32] developed an explainable machine learning model based solely on clinical features to predict EGFR mutations in lung cancer. However, its predictive accuracy did not exceed 0.771. Chun Sheng Yang et al. [33] employed Least Absolute Shrinkage and Selection Operator (LASSO) regression with five-fold cross-validation to select radiomic features predictive of the EGFR mutation status and TKI response. However, the model’s performance reached only 0.6713 in the area under the curve (AUC) for unenhanced CT phases in the EGFR–mutant training cohort. Other studies have explored integrated models combining clinical and radiomic features to predict the EGFR mutation status.
This research aims to develop a machine learning-based predictive model for identifying EGFR gene mutations in patients with non-small cell lung cancer (NSCLC). The clinical backdrop highlights the necessity for non-invasive diagnostic methods, as existing approaches (invasive biopsies) are limited by their accuracy, safety, and patient comfort. Detecting EGFR-TK mutations is vital for NSCLC patient management, as it informs on the optimal therapeutic strategy and enables personalized treatment. The study’s objectives are to design and validate a machine learning-based predictive model that can forecast EGFR gene mutations from computed tomography (CT) scans and assess its performance to ascertain its accuracy and reliability. The clinical relevance of this study stems from the potential of the predictive method to enhance NSCLC patient care by facilitating the more precise and expedient detection of EGFR gene mutations, while mitigating the risks associated with the current diagnostic approaches.
In this study, we propose a machine learning model trained on preselected clinical, CT, and radiomic features to predict the EGFR mutation status in NSCLC patients. To evaluate the effectiveness of feature preselection, we compared the performance of multiple models trained with and without feature filtering. The model trained on the most informative preselected clinical, CT, and radiomic features achieved the highest predictive performance. The integration of these selected features enabled the construction of a nomogram comprising 11 signatures (2 clinical, 2 CT-based, and 7 radiomic), offering strong potential for bridging the gap toward clinical validation.
The integration of a machine learning-based EGFR gene mutation prediction model into clinical practice could be achieved as follows. First, patients would need to be evaluated to determine if predicting EGFR gene mutations is relevant to their care. Next, clinical, computed tomography (CT), and radiomic features would be used to train and validate the prediction model. The prediction model would then analyze the CT images to predict EGFR gene mutations. The results would then be interpreted by clinicians to determine the best therapeutic approach for each patient. This approach has several potential benefits, including improving the accuracy of EGFR gene mutation detection, reducing invasive procedures such as biopsies, and personalizing treatment for each patient based on their individual clinical, CT, and radiomic characteristics.

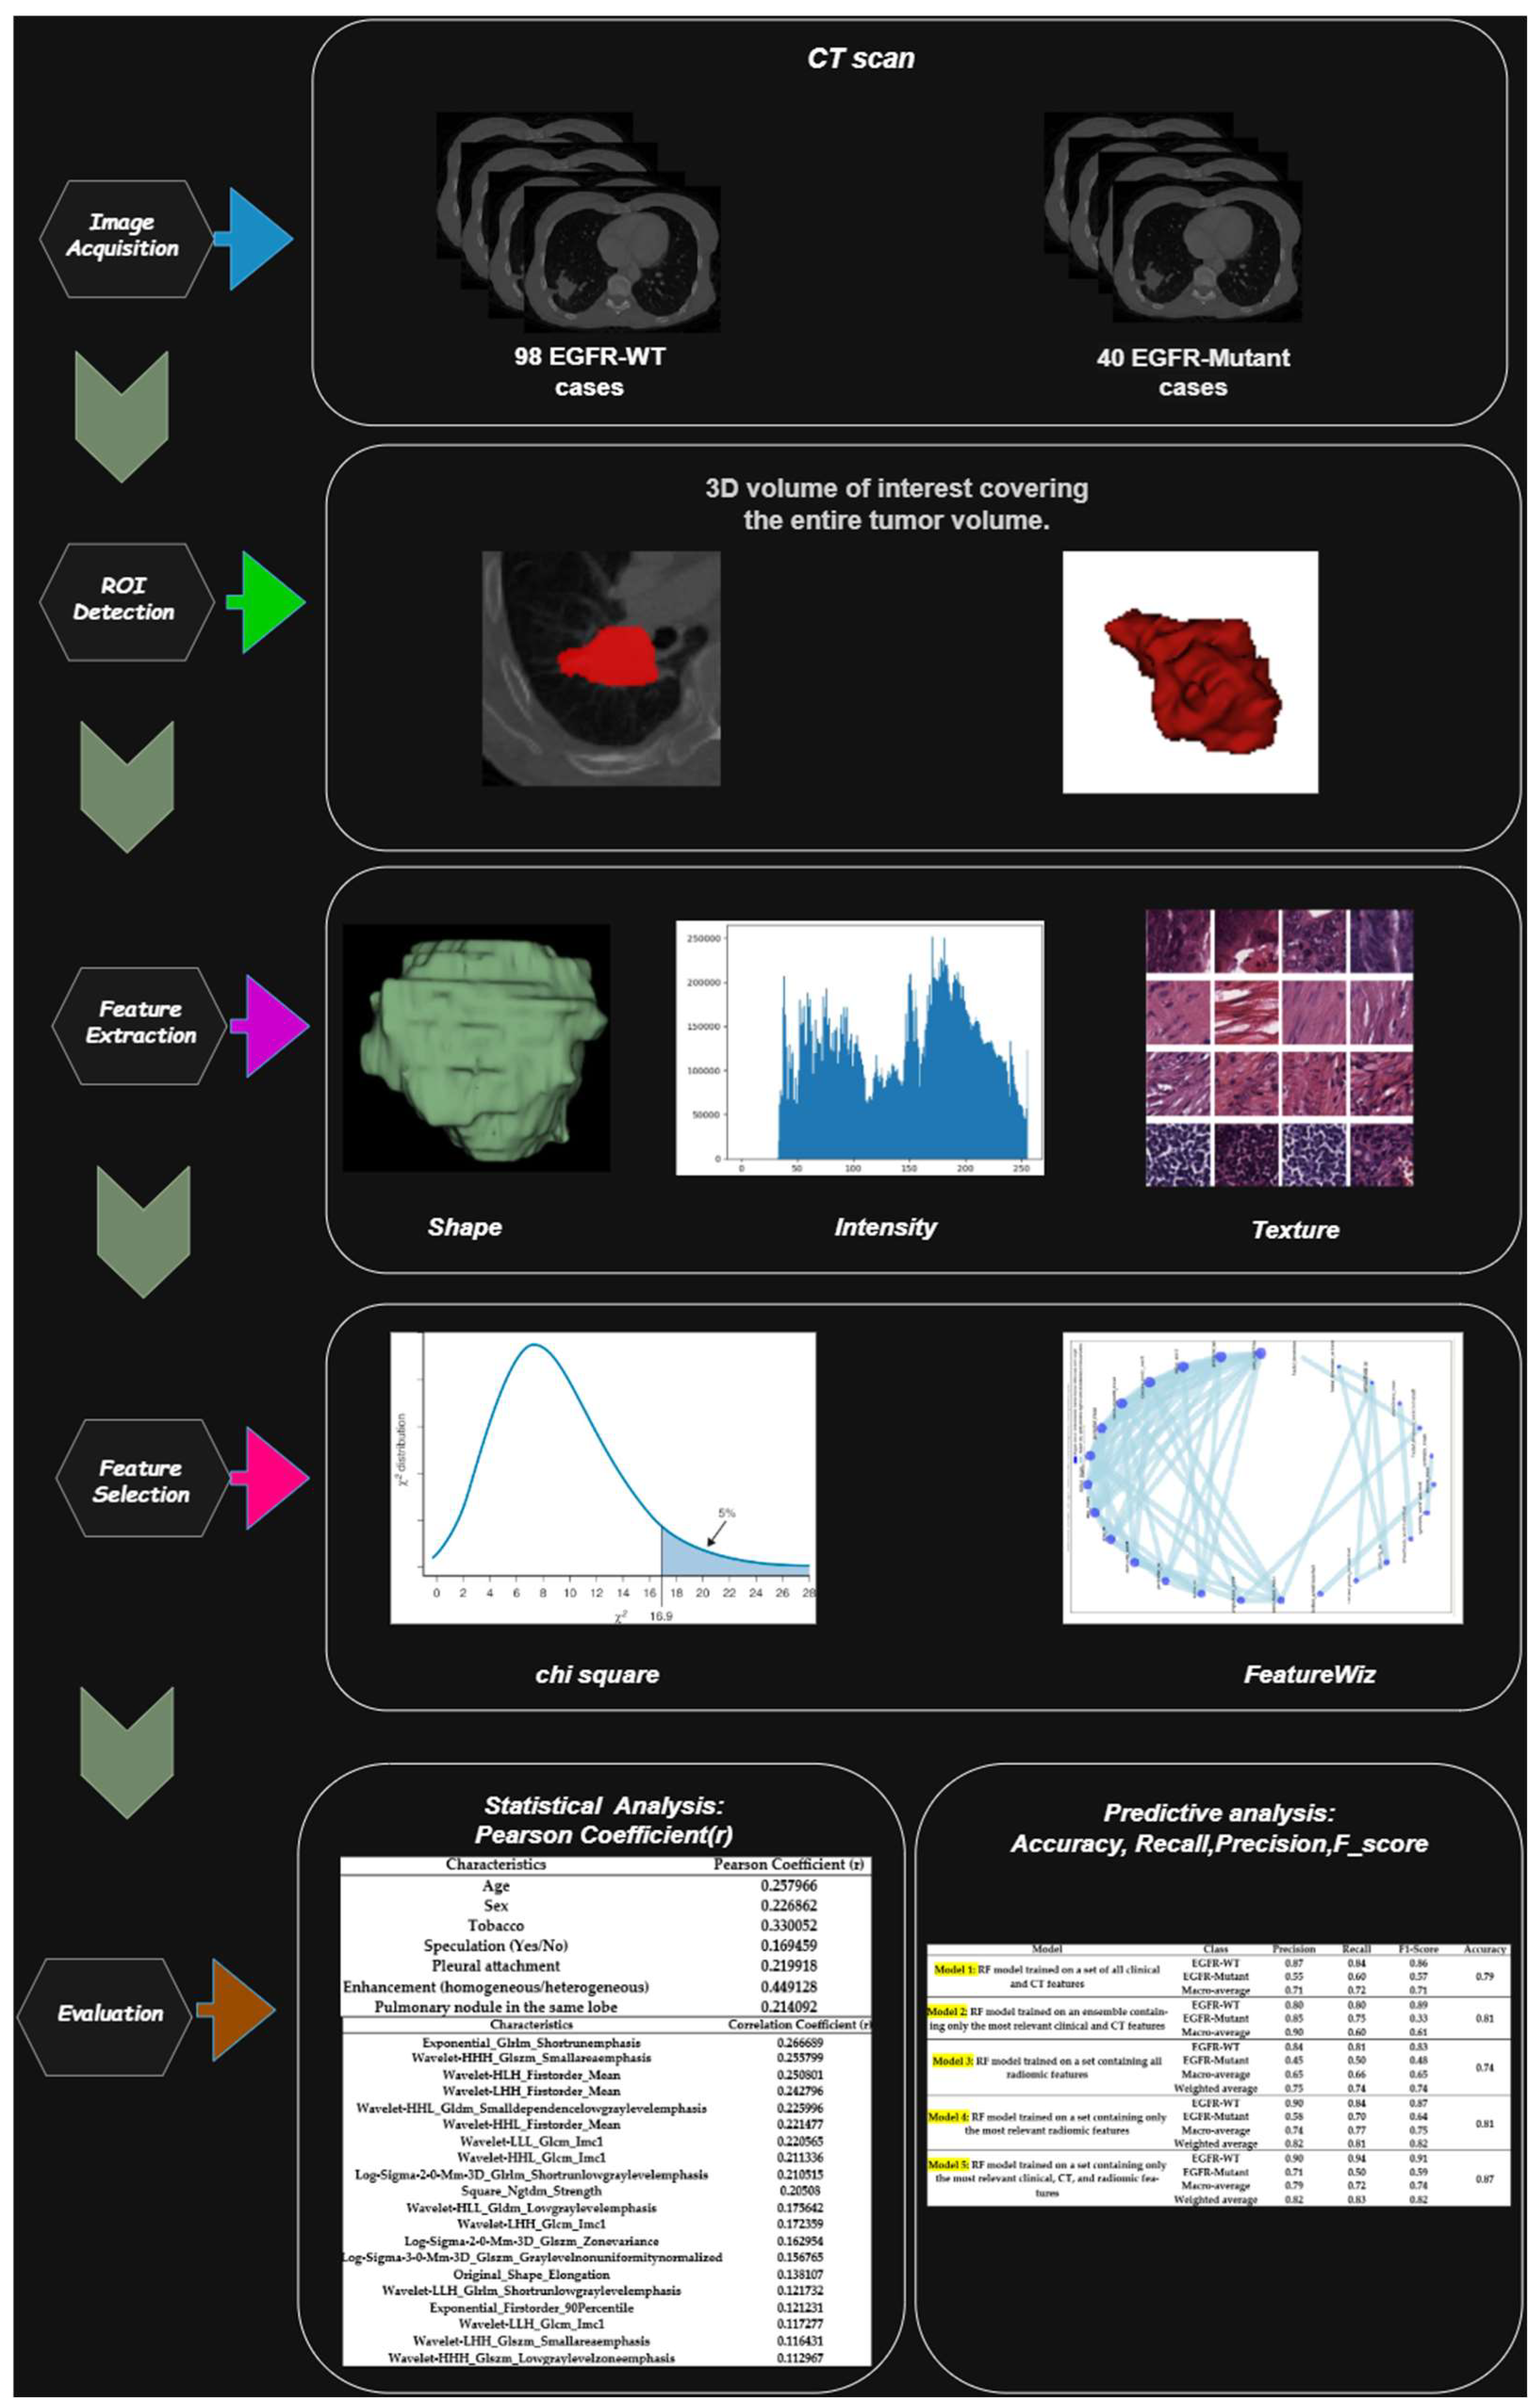
2. Materials and Methods

2.1. Study Design

The overall workflow of this study is illustrated in Figure 1 and consists of five sequential stages: (1) CT image acquisition, (2) image segmentation for volumetric region of interest (ROI) identification, (3) high-throughput feature extraction, (4) feature selection, and (5) machine learning model development and evaluation.

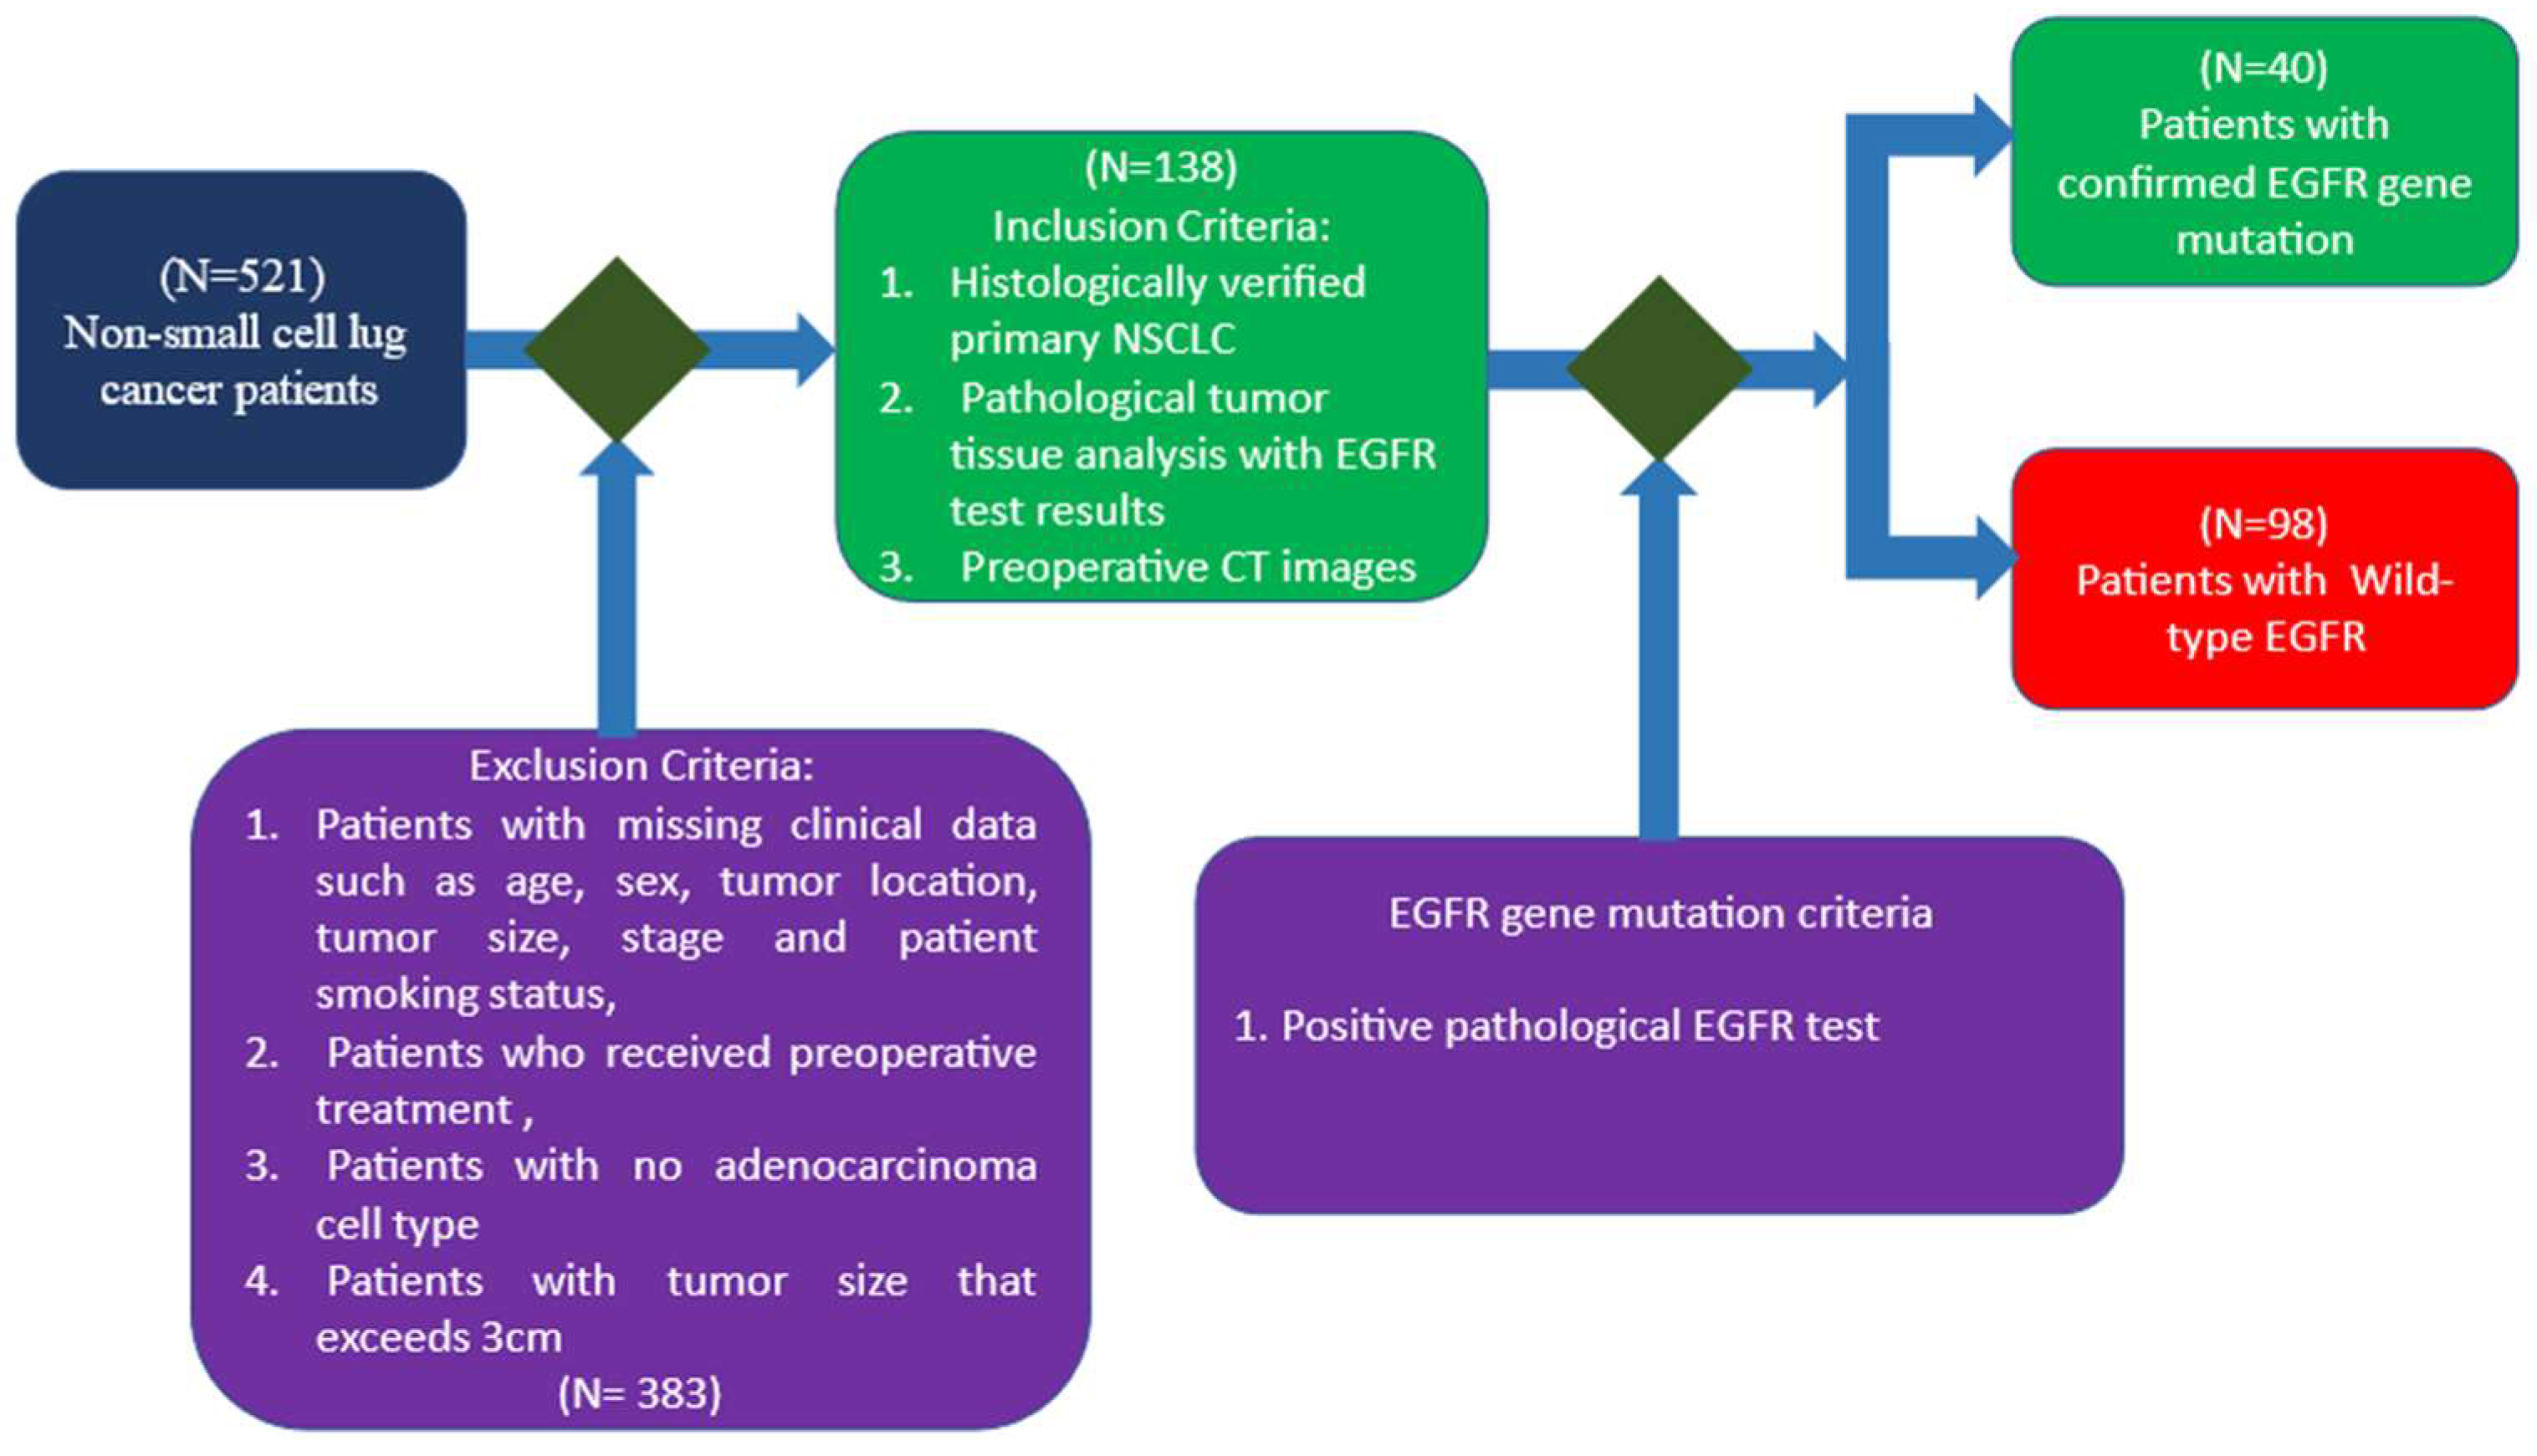
2.2. Patient Cohort and Data Collection

A multidisciplinary team comprising three medical specialists and two computer scientists retrospectively collected preoperative unenhanced CT scans and clinical data from patients with NSCLC who had undergone surgical resection or pathological biopsy for status.

2.2.1. Inclusion and Exclusion Criteria

As shown in Figure 2, the inclusion criteria were as follows: histologically confirmed primary NSCLC; available EGFR mutation results from tumor pathology; and preoperative CT scans performed within three months of biopsy. The exclusion criteria included missing clinical variables (e.g., age, sex, tumor location, size, stage, smoking status); receipt of preoperative treatment or neoadjuvant chemotherapy; non-adenocarcinoma histology; tumor diameter > 3 cm; poor-quality CT scans or those with significant artifacts; and the absence of EGFR mutation test results.
Among the 521 cases analyzed, 138 met the inclusion criteria: 98 with wild-type EGFR and 40 with EGFR mutations. These 138 cases were randomly divided into a training set (n = 96; 70%) and a test set (n = 42; 30%), which was excluded from model training.

2.2.2. EGFR Mutation Evaluation Methods

To identify genetic alterations in lung tumors, researchers analyzed primary tumor tissue samples that had been preserved using formalin fixation and paraffin embedding. A thorough pathological examination was conducted to estimate the proportion of cancerous cells within each sample. Subsequently, DNA was carefully extracted from the tumor-rich areas. The extraction process utilized a specialized kit (the QIAamp DNA FFPE Tissue Kit, Qiagen, Hilden, Germany) that was designed for this specific purpose. This study included a cohort of 138 lung cancer patients, and two distinct methodologies were applied to detect EGFR mutations. The approach used for each sample depended on the tumor cell content, with PCR-based analysis employed for samples with limited tumor cells and next-generation sequencing techniques (BigDye Terminator V3.1 kit; Applied Biosystems, Foster City, CA, USA) used for samples with a higher tumor cell percentage exceeding 30%.
EGFR mutations were systematically classified into several categories, including “Wild Type” for samples lacking EGFR mutations, “ Mutation” encompassing exon 19 in-frame deletions or exon 21 L858R substitutions, and all variations distinct from these common mutations, such as G719X mutations in exon 18, S768I mutations, De Novo T790M mutations, insertions in exon 20, L861Q mutations in exon 21, and insertions in exon 19, or complex mutations.

2.3. Acquisition, Processing, and Segmentation of the CT Images

2.3.1. CT Image Acquisition

CT scans in the DICOM format were extracted using the Python library pydicom (version 2.3.0). All scans, acquired using a SOMATOM Definition scanner (Siemens Healthcare GmbH, Erlangen, Germany), were normalized, corrected for inhomogeneity [34], and spatially aligned prior to feature extraction using the Elastix module (v5.0.1, Linux Foundation, San Francisco, CA, USA, https://elastix.lumc.nl, accessed 20 July 2021) within the 3D Slicer platform. Subsequently, the images were processed and resized using the scipy.ndimage module, which offers general purpose image processing functions designed to operate on 226 × 226 pixel arrays.

2.3.2. CT Image Processing

Furthermore, medical image processing is essential for generating clear and high-quality images that support doctors in making accurate diagnoses and advancing medical studies. To improve the sharpness, resolution, invariance, and acceptability of CT images, several studies have already been published in the literature. Thus, a new deep learning method [35] integrating multimodal feature fusion and edge enhancement was developed to achieve high-quality metal artifact reduction in CT images. Another method [36] was also developed in the form of a new method, based on the adaptive augmentation of higher-order neighborhood similarity calculations, first using a general framework and then applying other learning methods.

2.3.3. ROI Segmentation

To ensure accurate ROI segmentation, experts applied three methods: a manual approach, a semi-automatic method using ITK-SNAP [37], and another semi-automatic method based on 3D Slicer [38,39]. Only ROIs validated across all three methods were retained as the final tumor segmentations for downstream analysis.

2.4. Clinical, CT, and Radiomic Features

2.4.1. Clinical Characteristics

Clinical and demographic data including age, sex, smoking status, and tumor mutation status were extracted from patients’ medical records.

2.4.2. CT Characteristics

Chest CT data, archived in accordance with the guidelines of the Fleischner Society [40] and Rubin et al. [41], were also retrieved from the medical records.

2.4.3. Radiomic Characteristics

Radiomics is a new field that aims to extract quantitative information from medical images and discover biomarkers capable of refining patient categorization and improving their care. Indeed, radiomics has been widely used to improve diagnosis. Indeed, Viviana Benfante et al. [42] proposed a standardized computational statistical analysis model based on an MRI radiomics model to facilitate medical decision-making, and more specifically, to distinguish low-grade from high-grade bladder lesions and non-invasive bladder cancers from muscle-invasive bladder cancers. Ilaria Canfora et al. [43] proposed a CT-based radiomics model to stratify rectal cancer patients into low-risk and high-risk patients based on disease-free survival and overall survival, using postoperative histopathological features.

2.4.4. Radiomic Feature Extraction

In this work, radiomic features were extracted using the PyRadiomics library, a scripted module integrated into the SlicerRadiomics™ platform (version 2.10; http://github.com/Radiomics/SlicerRadiomics, accessed on 25 May 2023). This module enables the extraction of quantitative radiomic descriptors in matrix form, capturing texture, shape, and intensity histogram features.

2.5. Development and Interpretability of Machine Learning Models

To evaluate whether training the model on a dataset limited to the most relevant features enhances predictive performance, we constructed five datasets by combining clinical, CT, and radiomic features, with or without relevance-based filtering. Five Random Forest (RF) machine learning classification models [44,45,46] were developed to predict the EGFR mutation status. Each model was trained on a different dataset, as summarized in Table 1.

3. Results

3.1. Training and Testing Dataset

Patients were randomly assigned to the training and test sets based on their EGFR mutation status. In the training set, 30 patients were randomly assigned from a total of 40 carriers of a mutated EGFR gene, and 66 patients from a total of 98 patients with a wild-type EGFR gene were randomly assigned. The remaining 42 patients were assigned to the test set, including 10 patients with a mutated EGFR gene and 32 with a wild-type EGFR gene. The training set consists of two classes: one class of patients with a mutated EGFR gene and one class with a wild-type gene. The number of patients in the two classes is not balanced. To overcome this problem, we used the SMOT application from the Python library during the data preprocessing stage. This application creates new data points between two samples of the minority class.
To mitigate dataset size limitations, we employed a 2D model utilizing individual CT image slices as input, effectively expanding our dataset to approximately 8000 slices (given up to 200 slices per CT image patient). Furthermore, we augmented the data during training through techniques such as horizontal flipping, rotation (up to 25°), horizontal and vertical shifting, random occlusion, and Gaussian noise addition. Finally, our dataset presented a class imbalance issue, which we addressed using the Synthetic Minority Over-sampling Technique (SMOTE). By creating synthetic samples of the minority class through interpolation, SMOTE boosts the performance and robustness of supervised learning models. Introduced by Chawla et al. [47], SMOTE is a widely adopted technique for mitigating class imbalance.
The 138 patients in the benchmark dataset were randomly divided into two subsets: a training (internal) set comprising 96 patients (30 with EGFR mutations and 66 with wild-type EGFR) and a test (external) set comprising the remaining 42 patients (10 with EGFR mutations and 32 with wild-type EGFR), which was withheld for model evaluation.

3.2. Statistical Analysis

The study cohort of 138 patients is characterized in Table S1, which outlines their clinical and CT scan features, as well as their EGFR mutation status. Notably, 28.98% of patients (40 individuals) had EGFR mutations, while 71.01% (98 individuals) had wild-type EGFR.

3.3. Selection of the Most Relevant Clinical, CT, and Radiomic Features

To identify the most relevant clinical and CT features, the Chi-square test [48] was applied. The Pearson correlation coefficient was computed to identify highly correlated features, which were then removed using a greedy recursive elimination strategy, as summarized in Table 2. Features with statistically significant associations (p-value < 0.05) were retained, and the corresponding p-values are reported in Table 3.
Among the 27 clinical and CT features, only seven showed statistically significant associations (p < 0.05). Among these seven significant features, ‘tobacco use’ and ‘enhancement pattern (homogeneous vs. heterogeneous)’ exhibited moderate correlations with EGFR mutation status, with Pearson coefficients of 0.33 and 0.44, respectively.

3.4. Selection of Relevant Radiomic Characteristics

Radiomic characteristics were analyzed using FeatureWiz [49], a useful tool for feature selection in building prediction models. It uses a variety of algorithms to assess the contribution of features to model performance and can help eliminate uninformative or redundant features that may be detrimental to performance. All statistical analyses were performed using Python 3.7.6 software.
Thus, among the 1034 radiomic characteristics, only 124 were selected as relevant. Among these 124 relevant characteristics, 20 showed a strong correlation with the ‘EGFR mutation’ variable, with a Pearson coefficient between 0.27 and 0.11, given in Table 4. The variable ‘Exponential Glrlm Shortrunemphasis’, which has the highest correlation rate, can be considered the most relevant feature, with a Pearson correlation rate of 0.27.

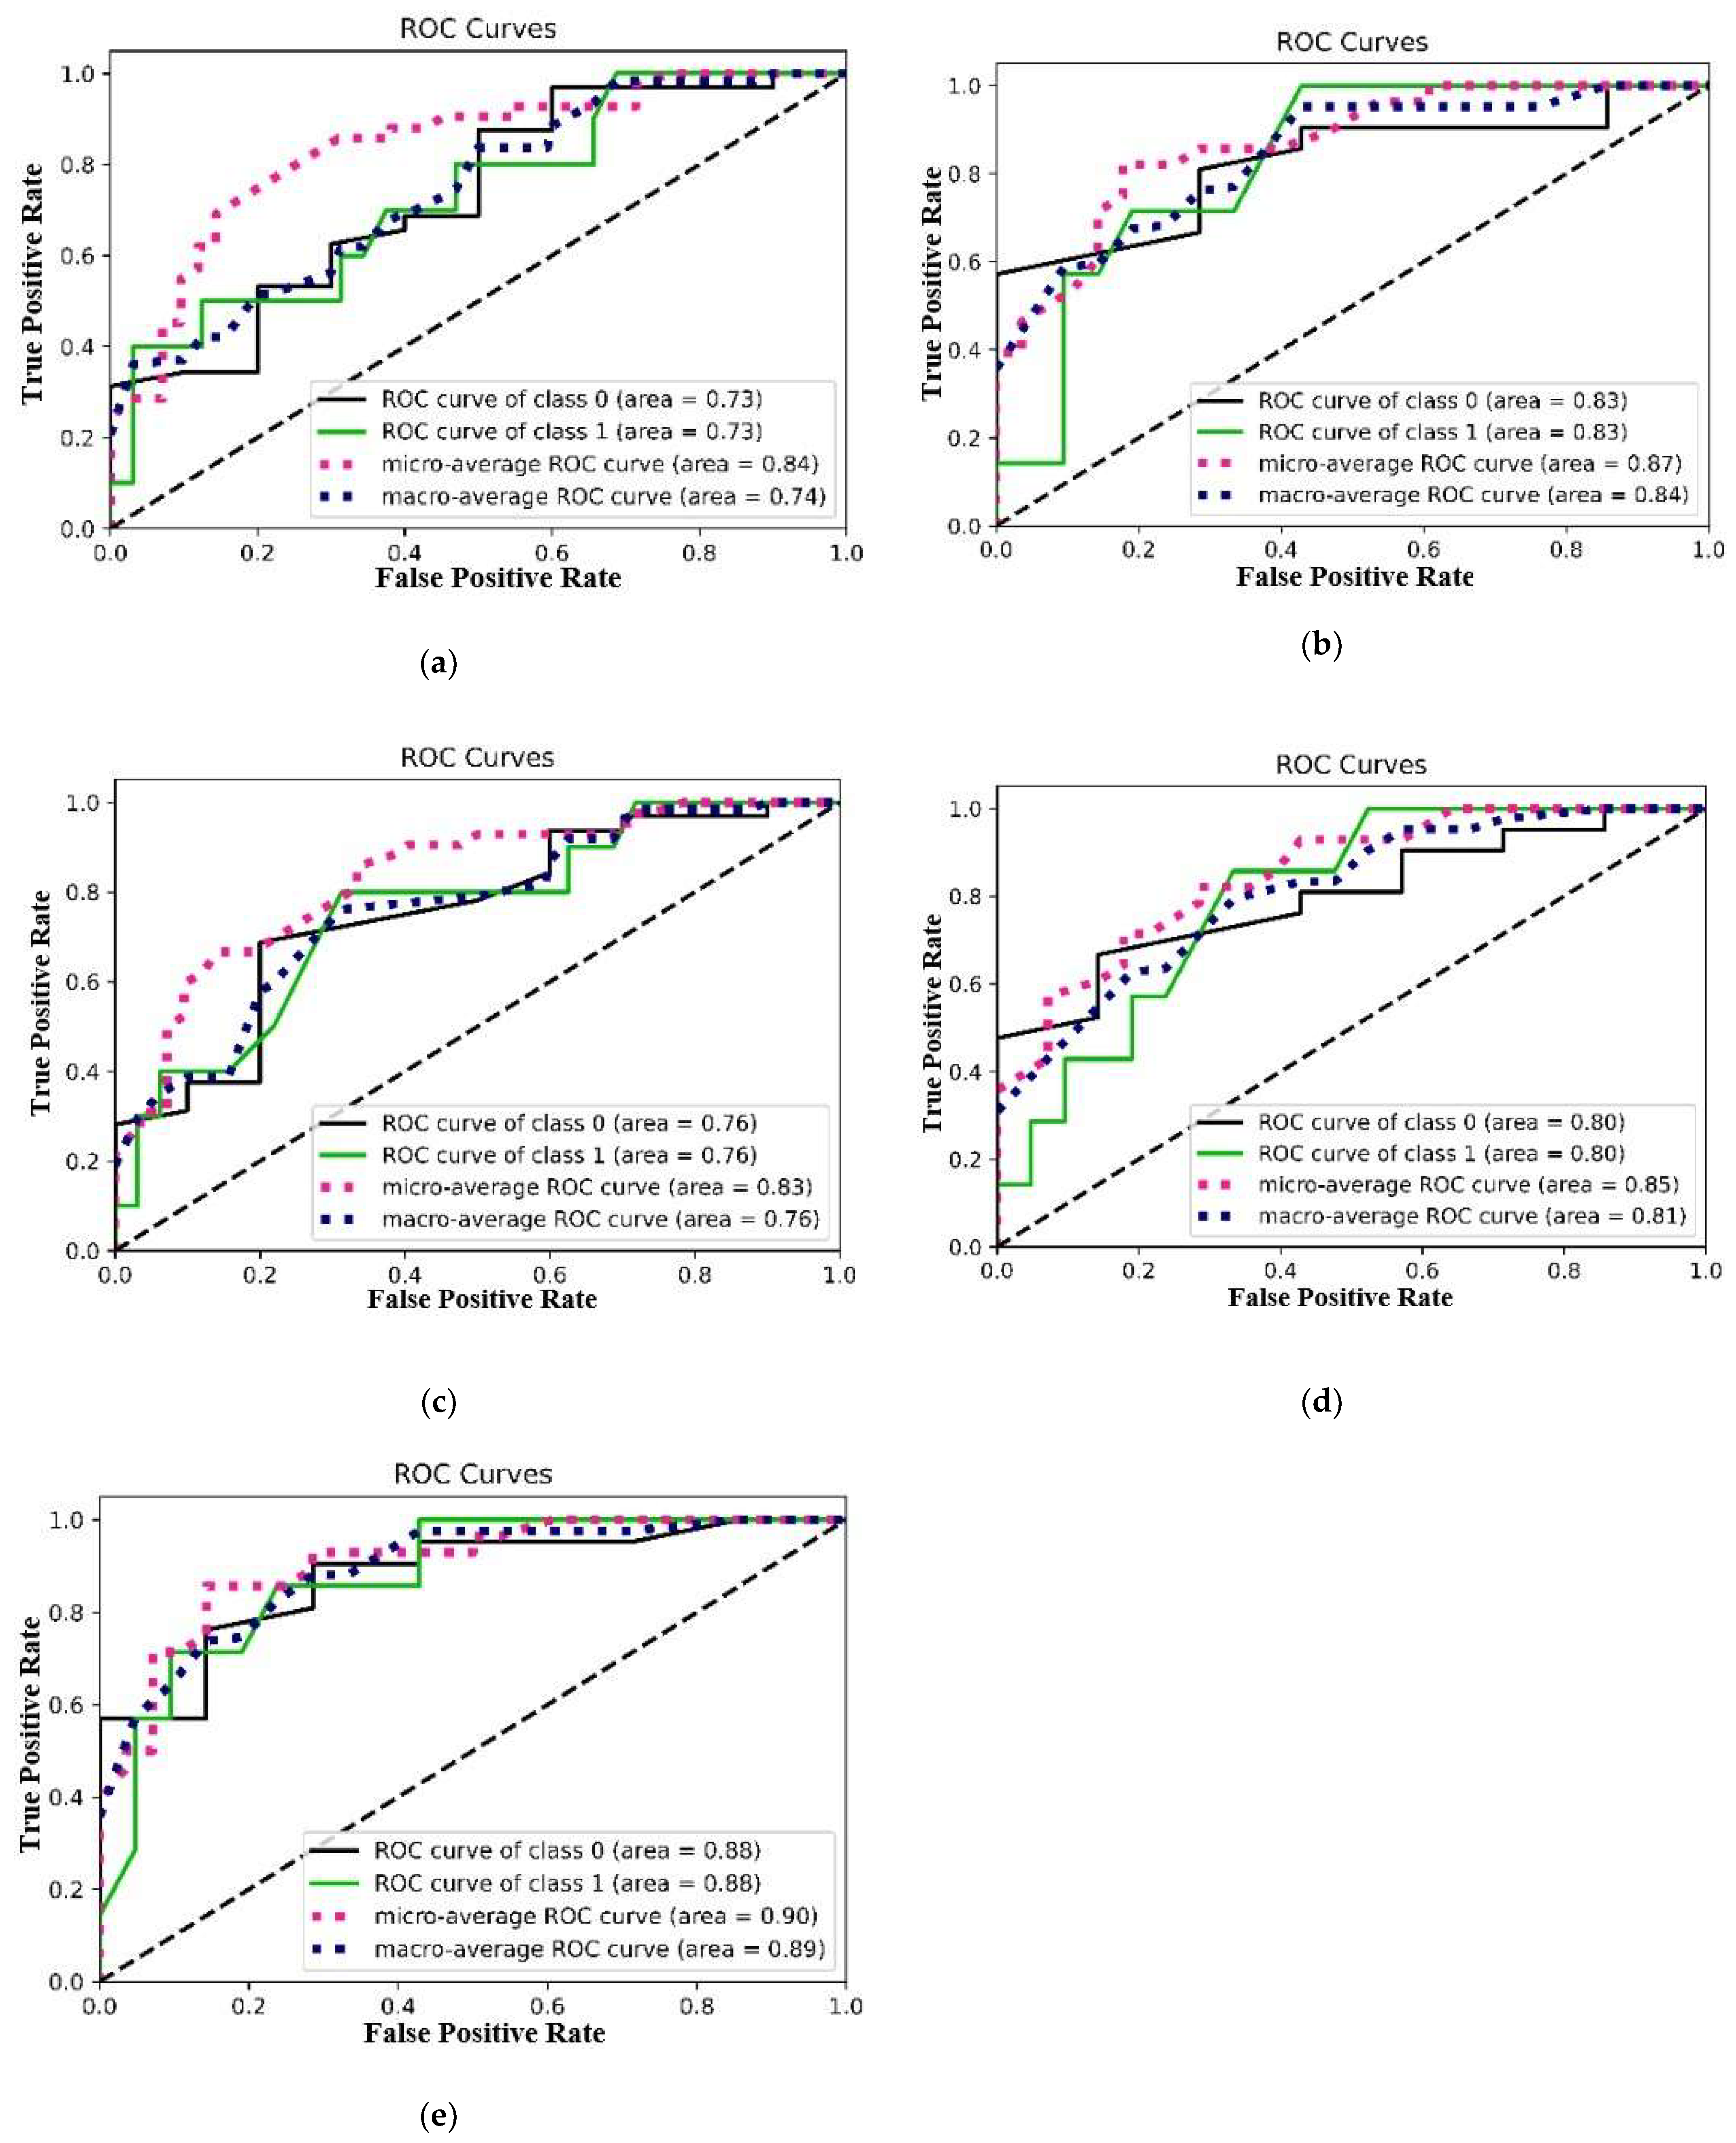
3.5. Measured Performances in the Testing Process

3.5.1. AUC/ROC Curve, Micro-Average, and Macro-Average ROC Curves

The AUC, micro-average, and macro-average ROC curves for the EGFR-mutant class (class 1) and wild-type class (class 0) are presented in Figure 3 for all five models. Precision, recall, F1-score, and accuracy metrics are reported in Table 5. Model 5, trained exclusively on the most relevant preselected features, achieved the best performance in predicting the EGFR mutation status (AUC = 0.88; macro-average = 0.90; micro-average = 0.89; precision = 0.90; recall = 0.94; F1-score = 0.91; and accuracy = 0.87) compared to the other models.

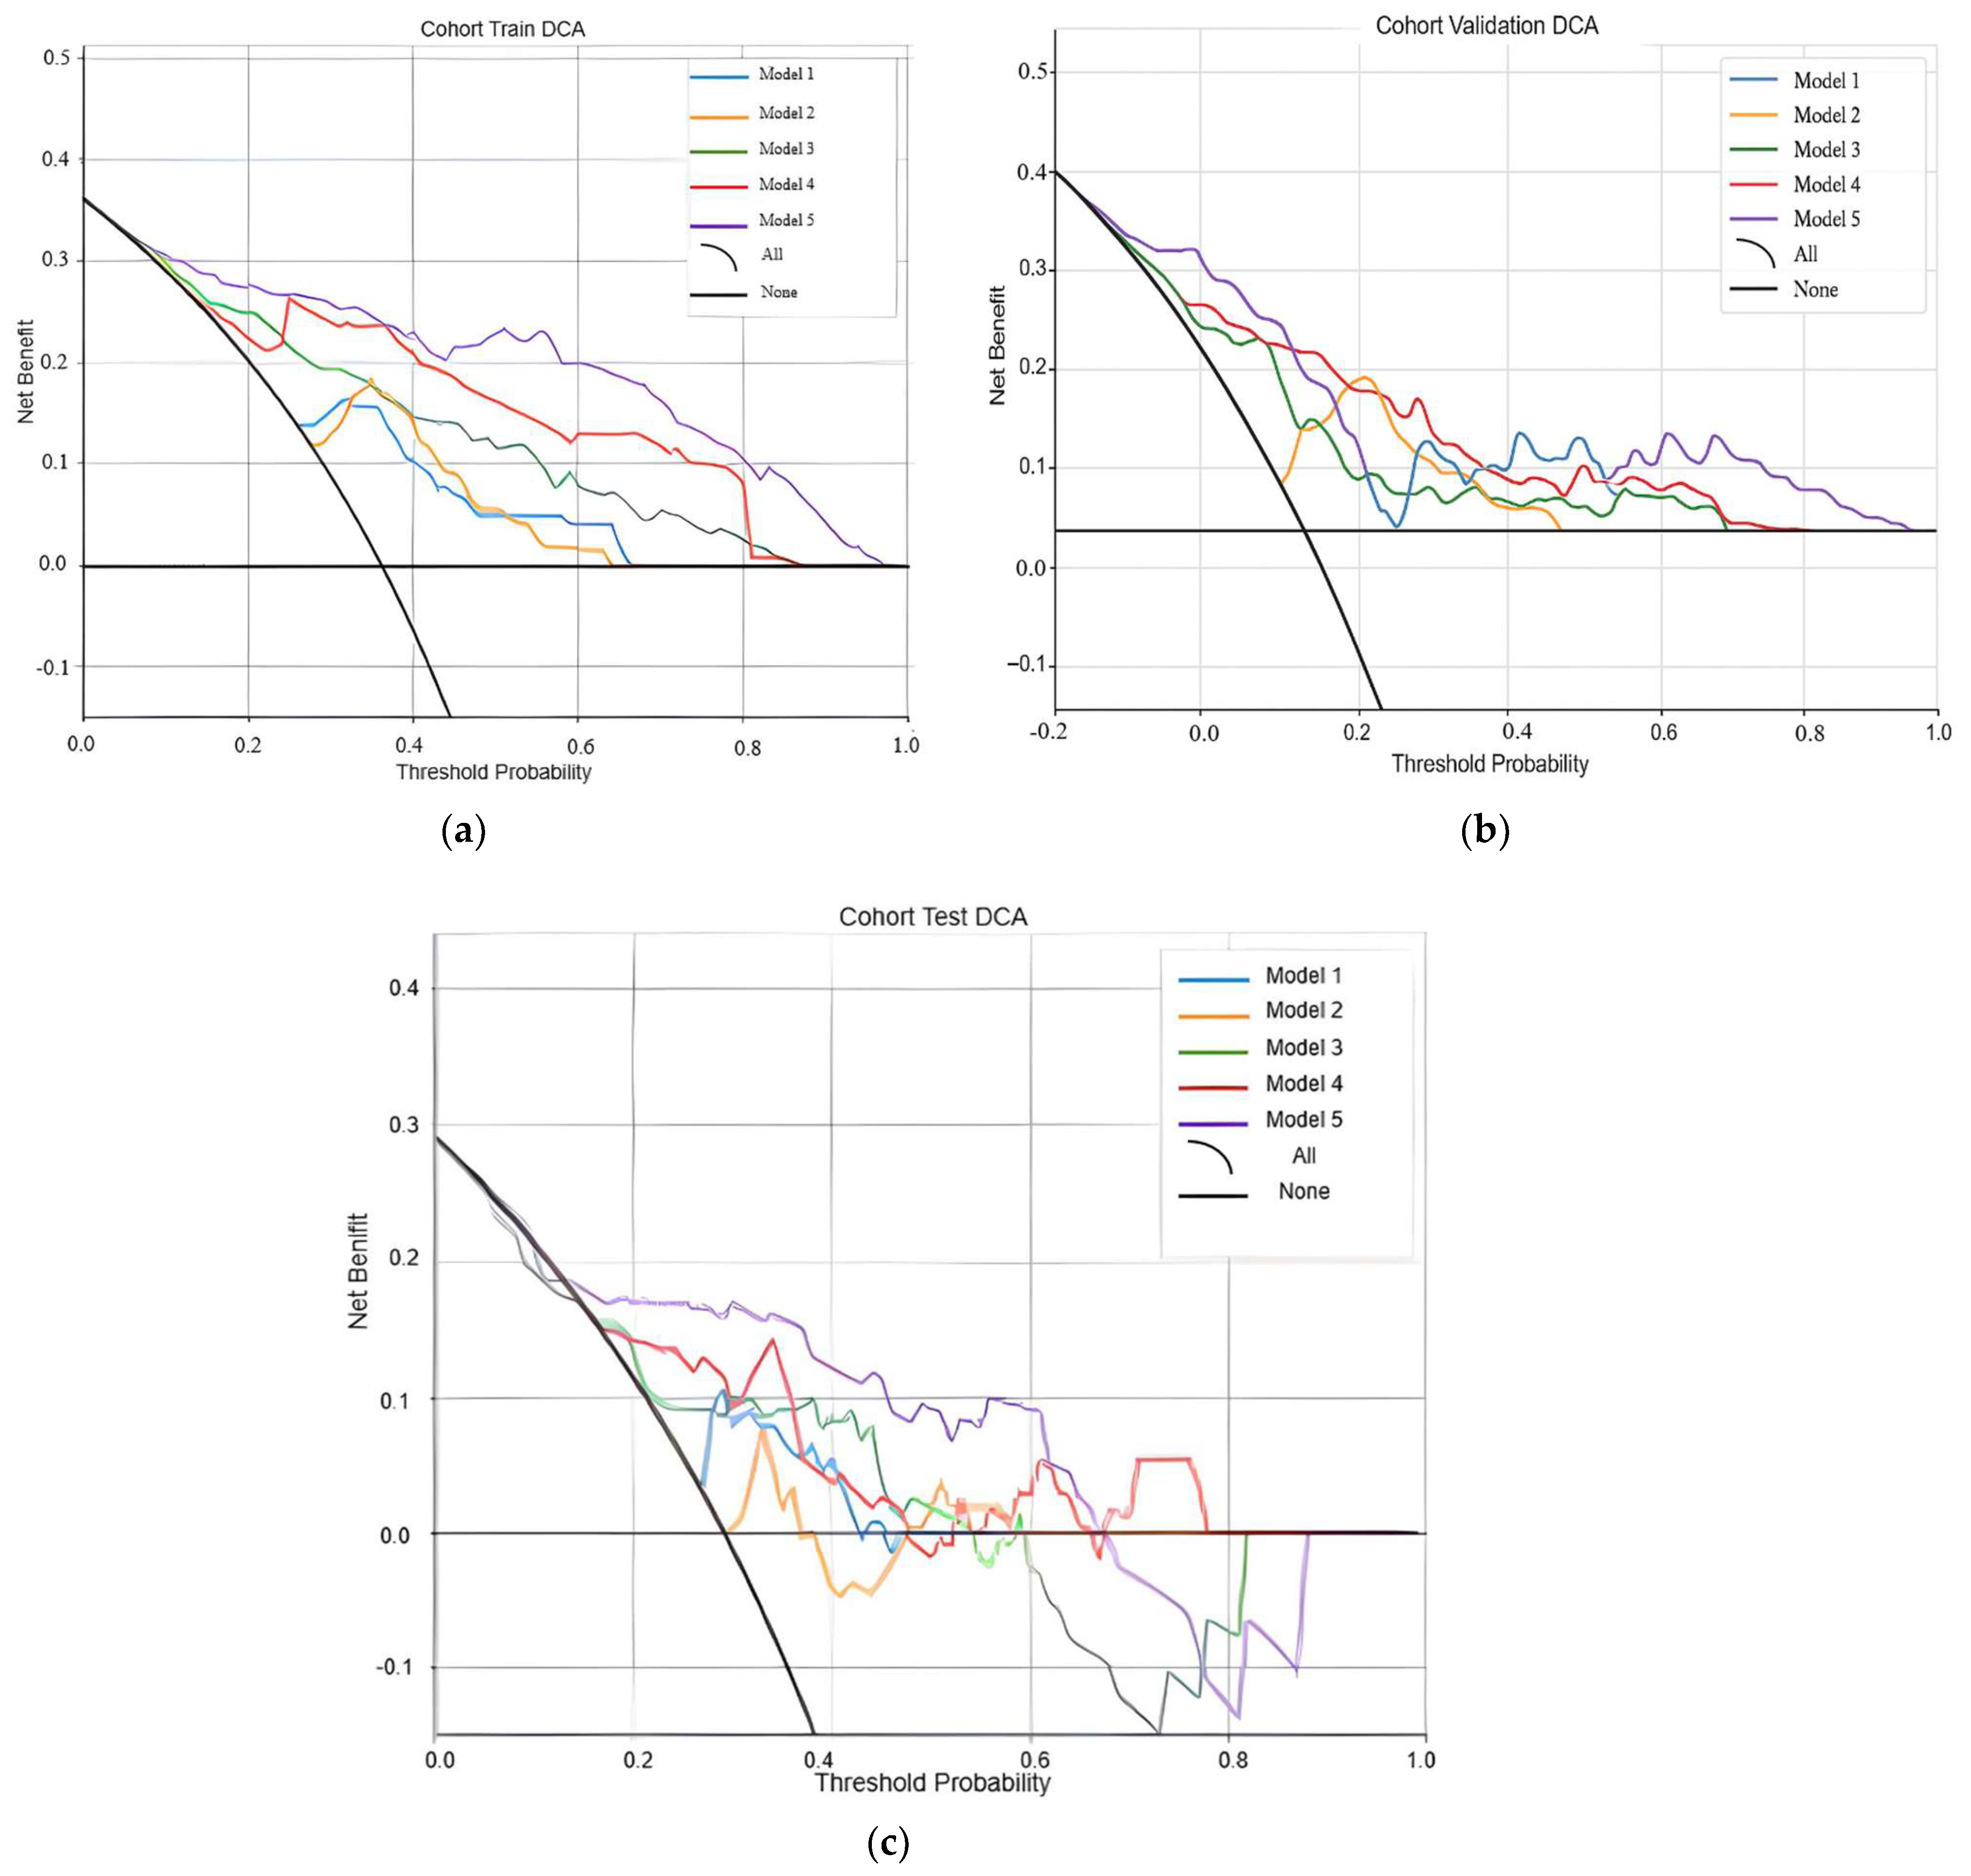
3.5.2. Decision Curves

Decision curve analyses (DCAs), as shown in Figure 4, were conducted to compare the five models across the training, validation, and test sets. Model 5 (the nomogram), integrating the 11 most relevant features (2 clinical, 2 CT, and 7 radiomic), demonstrated superior net benefit across thresholds of predicted probability, indicating the highest clinical utility.

3.5.3. DeLong Test

The DeLong test was employed to evaluate the performance of five prediction models in distinguishing between two mutation status classes. The results in Table 6 show that Model 5 exhibits statistically significant differences (p-value < 0.05) from Models 1, 3, and 4, and its highest AUC indicates that it is the best-performing model for this prediction task.

3.6. Interpretability

The SHapley Additive exPlanations (SHAP) algorithm [50] is employed to assess the significance of the global relevance, individual relevance, and interaction contributions of each feature with each other in predicting the EGFR mutation status at the model’s output.

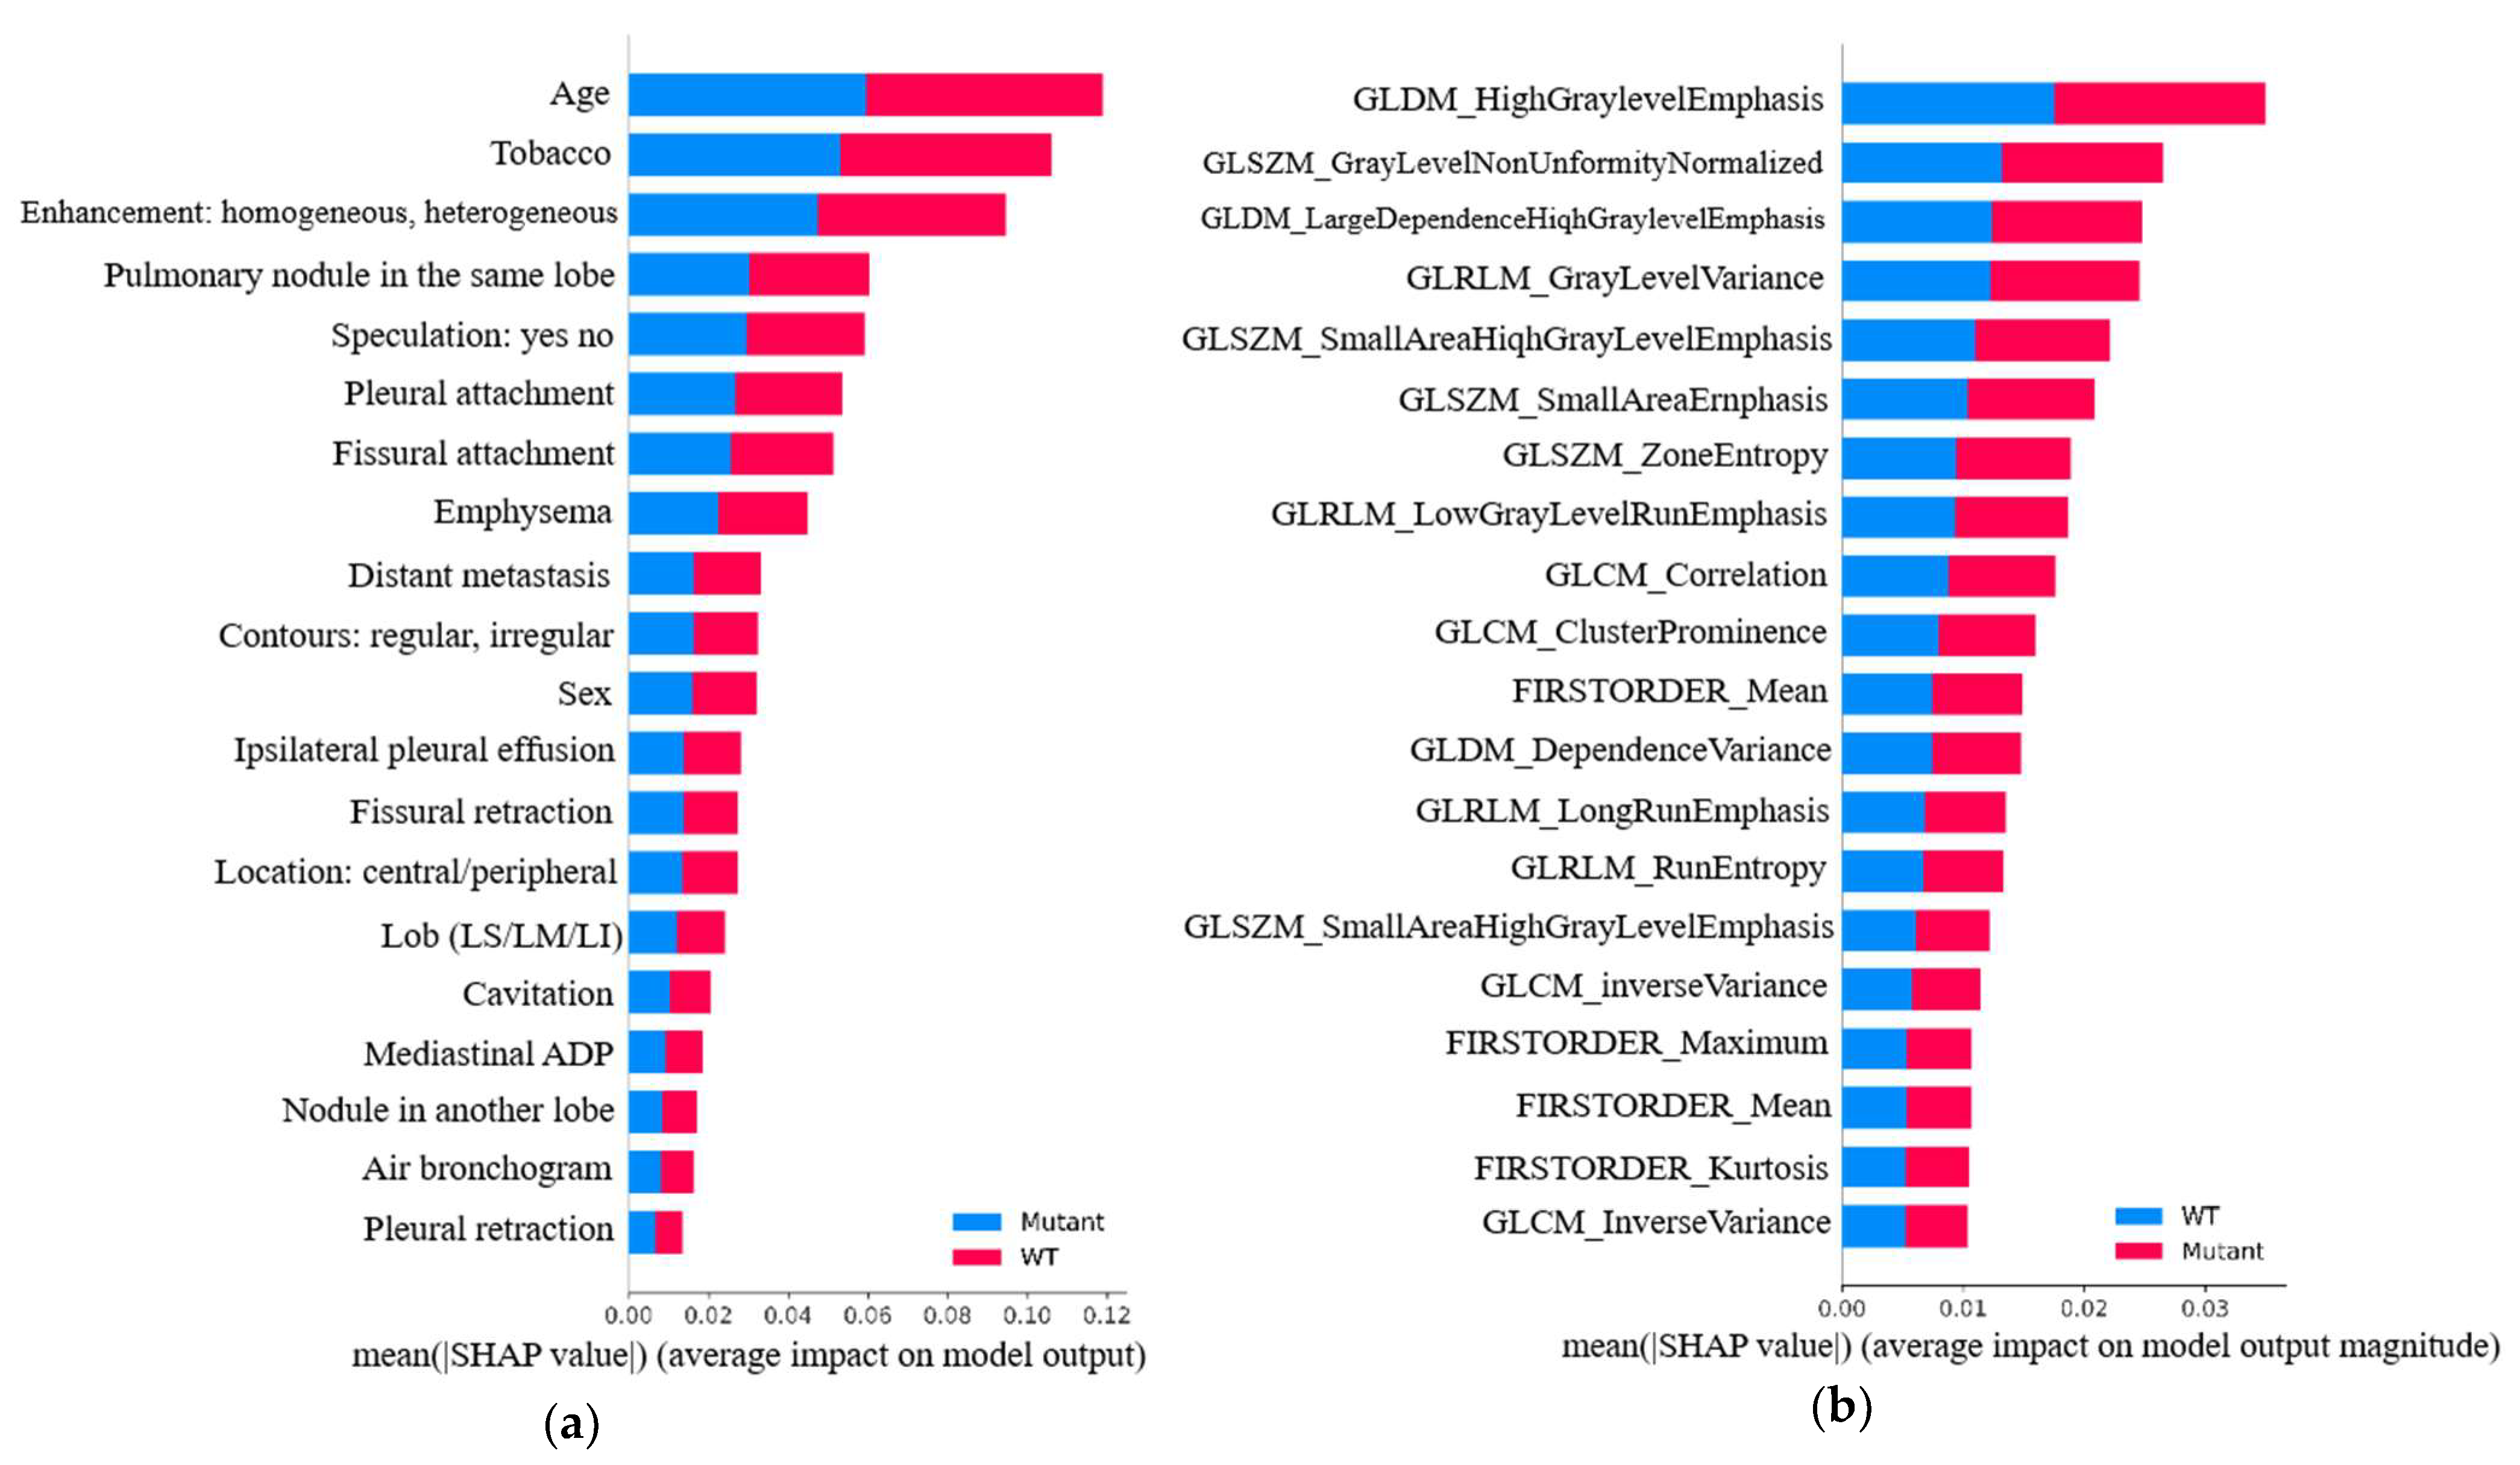
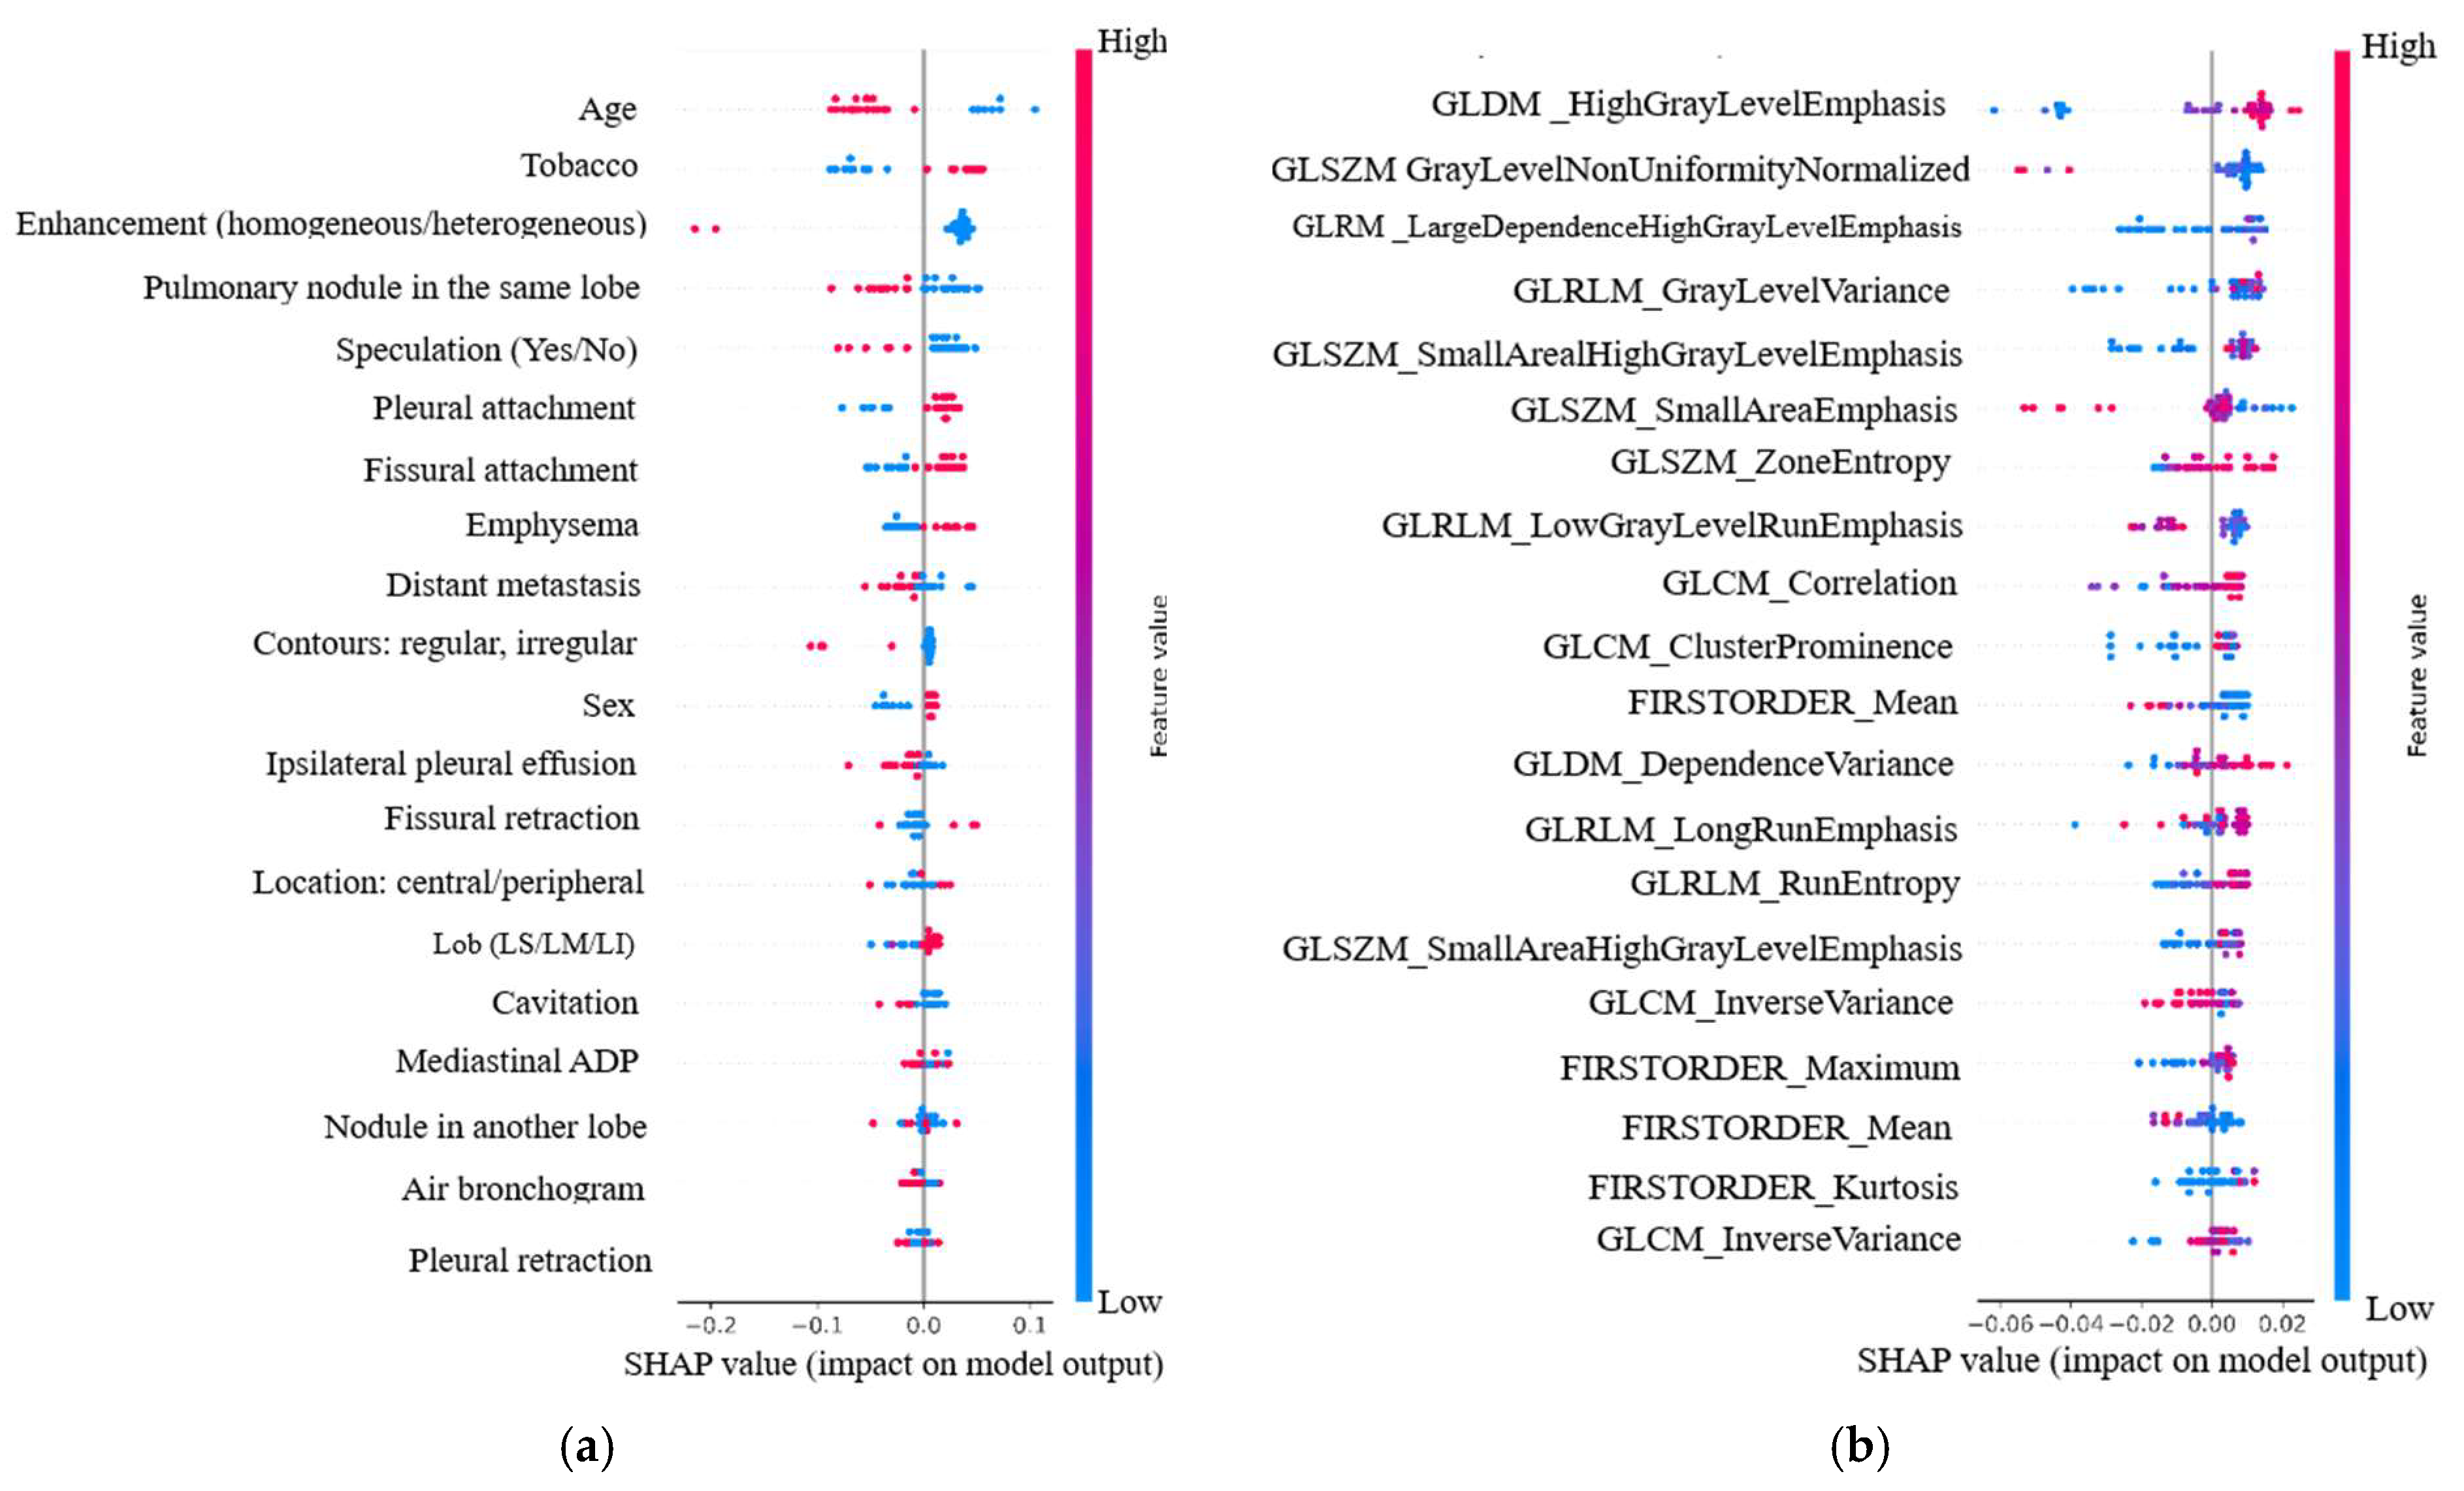
3.6.1. Global Relevance

The global relevance of clinical and CT features in predicting EGFR mutation using Model 5 is presented in Figure 5a, calculated using the average SHAP values. Notably, four features showed high relevance: two clinical features (“Age” and “Tobacco Use”) and two CT features (“Enhancement” and “presence of nodules in the same lobe”). Additionally, Figure 5b highlights the relevance of radiomic features, with seven features demonstrating strong contributions, particularly “the high gray-level emphasis function of the GLDM matrix” and “the gray-level size zone matrix (GLSZM) zone entropy”. These findings support our selection of a nomogram, comprising the 11 most relevant signatures, consisting of 2 clinical, 2 CT, and 7 radiomic signatures.

3.6.2. Individual Relevance

The SHAP algorithm provides valuable insights into the individual contribution of each feature in predicting the EGFR mutation status, as is shown in Figure 6. Indeed, Figure 6a presents the individual contributions of clinical and CT features in predicting EGFR mutation. The analysis reveals distinct patterns in the individual contributions of various features to the prediction of EGFR mutation. The characteristic ‘Tobacco’ exhibits a strong positive correlation, implying that increased tobacco use is linked to a higher likelihood of EGFR mutation. Conversely, the characteristic ‘Age’ demonstrates a strong negative contribution, indicating that younger individuals are more likely to have an EGFR mutation. The CT feature ‘Enhancement’ also shows a strong negative association, suggesting that higher ‘Enhancement’ values correspond to a lower probability of EGFR mutation. Furthermore, the presence of nodules in the same lobe is a significant predictor of EGFR mutation, with a notable inverse relationship between nodule count and mutation probability, where a higher number of nodules in the same lobe is associated with a decreased probability of EGFR mutation. In contrast, the clinical characteristic ‘Sex’ and the CT characteristic “pleural retraction” exhibit SHAP values near zero, suggesting that they have minimal impact on predicting EGFR mutation. This observation aligns with the insights derived from Figure 6a.
Figure 6b highlights the individual contributions of radiomic features in predicting EGFR mutation, revealing two notable patterns. The “high gray-level enhancement function of the GLDM matrix” feature has a strong positive impact, meaning that increased gray-level enhancement values are associated with a higher likelihood of EGFR mutation. Conversely, the “zone entropy function of the GLSZM” feature contributes significantly to the prediction, but with a negative correlation, indicating that higher entropy values correspond to a lower probability of EGFR mutation.

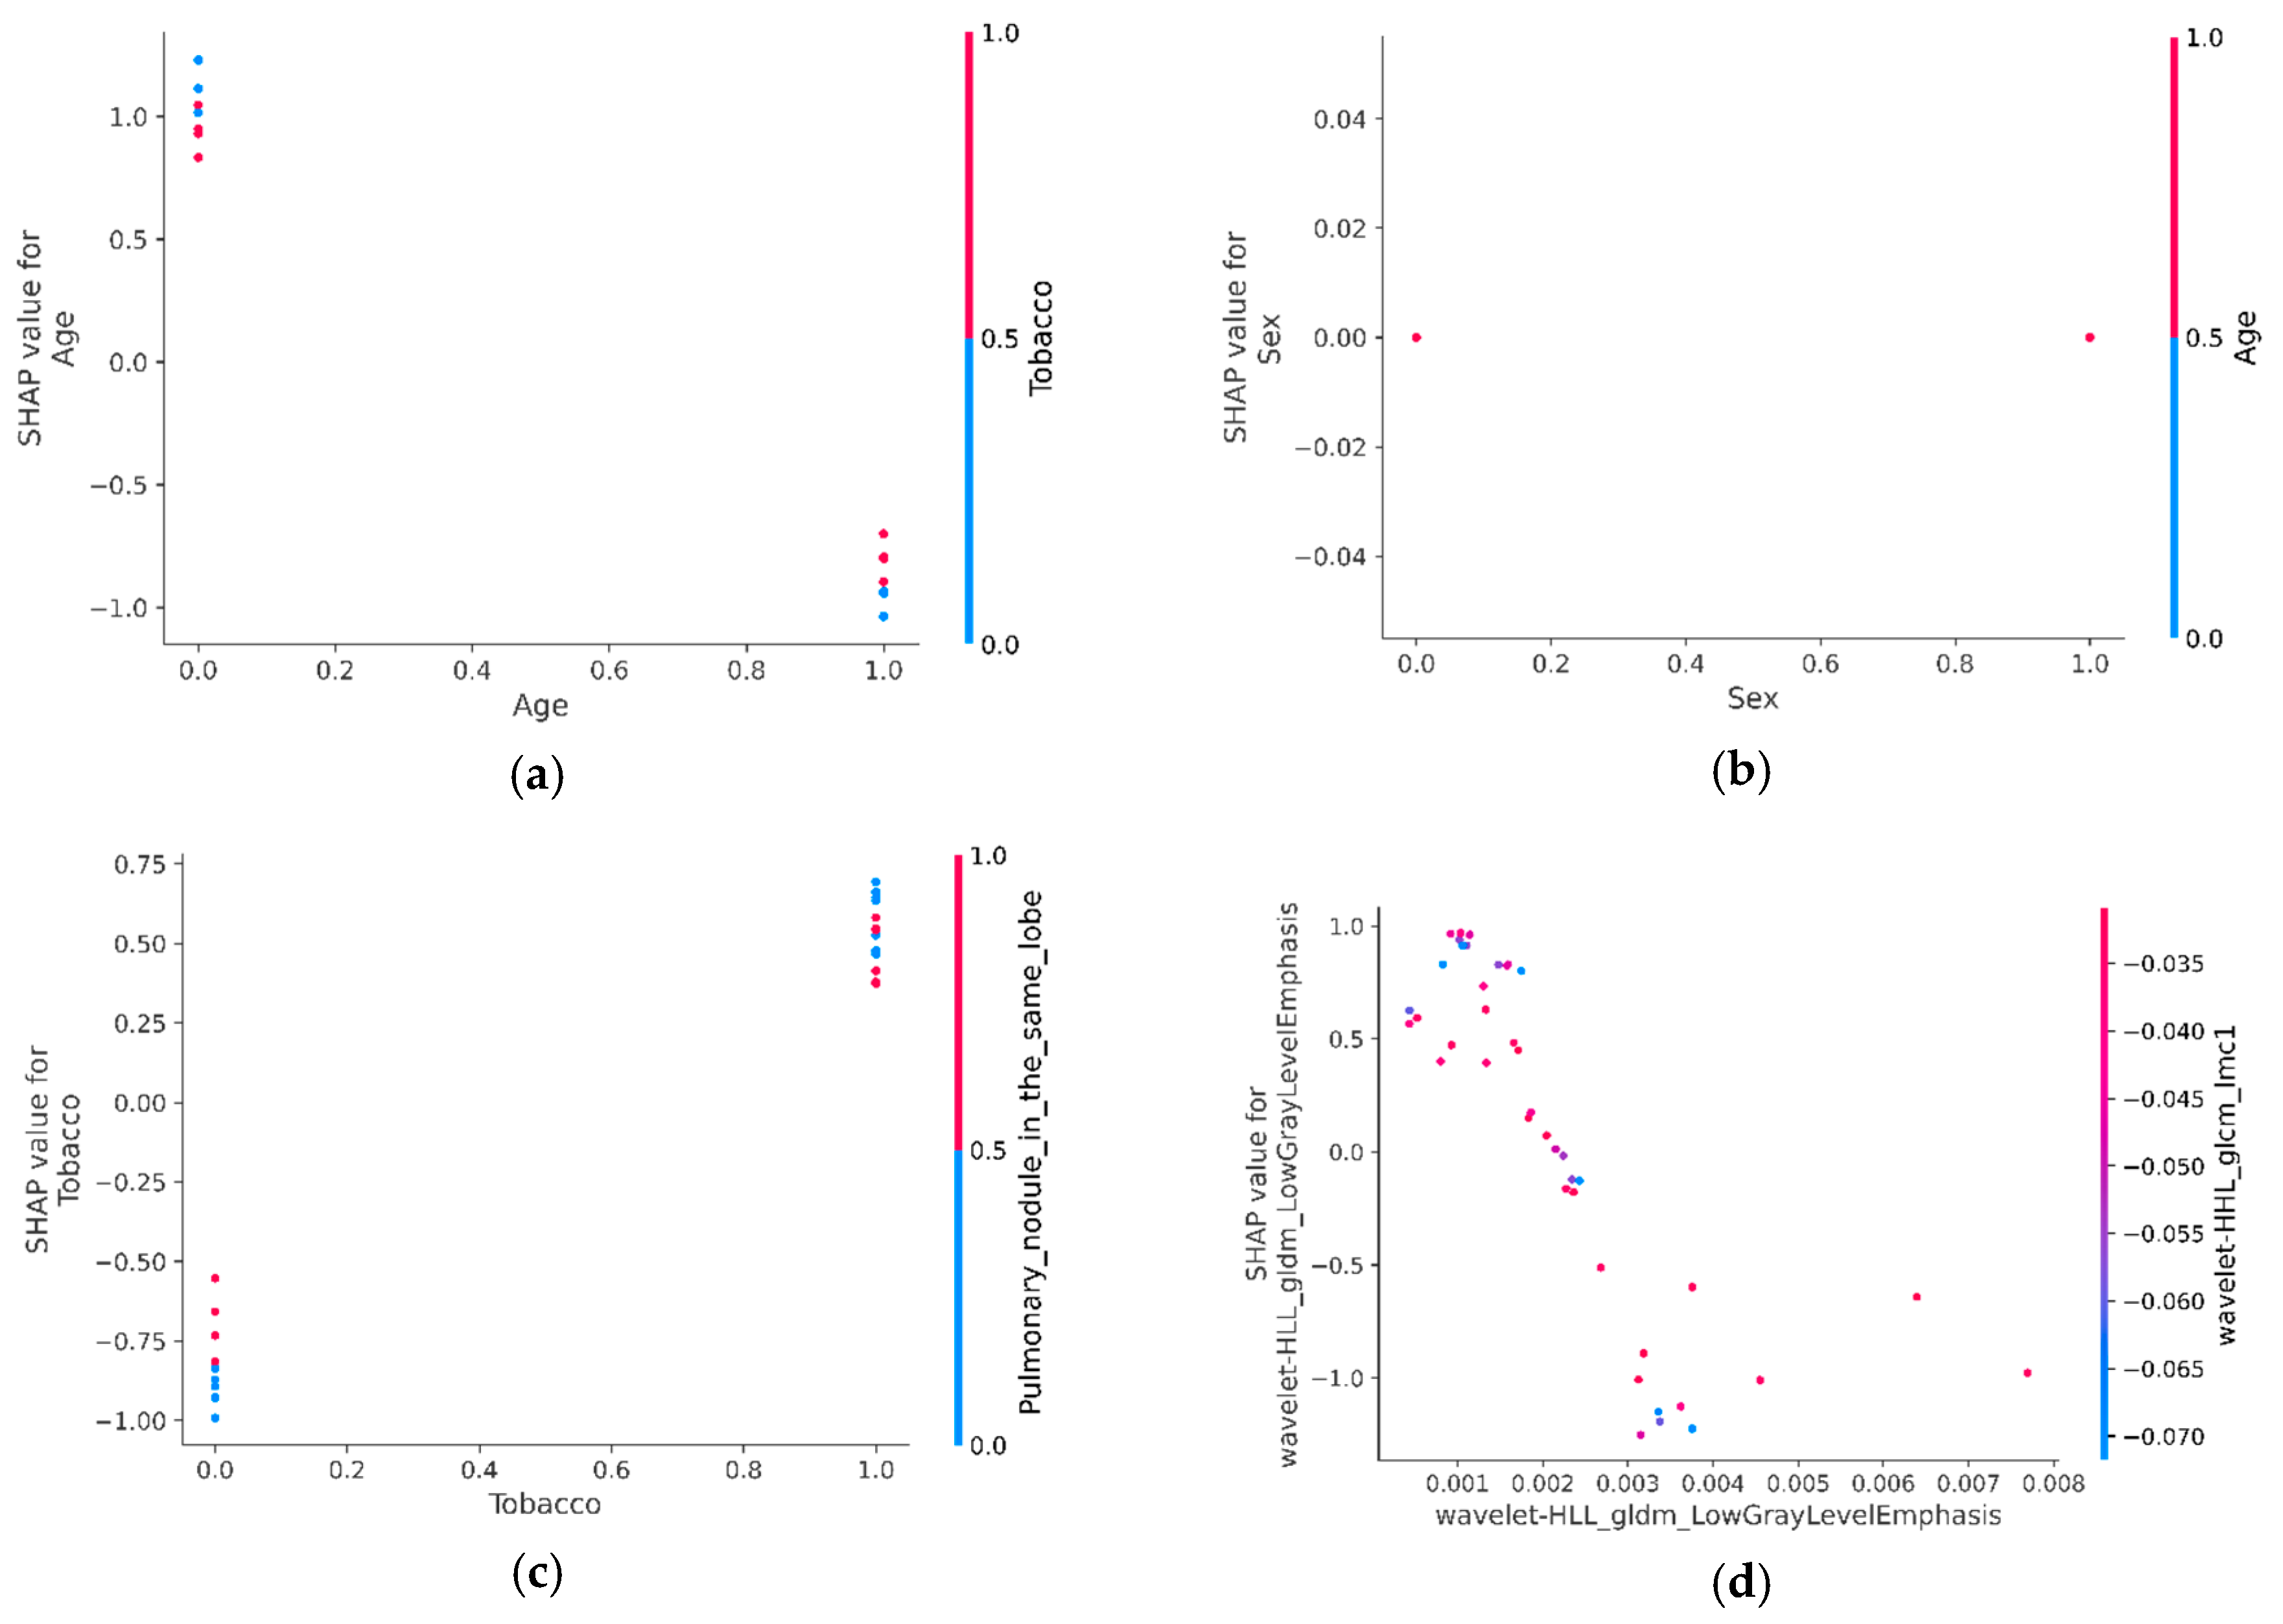
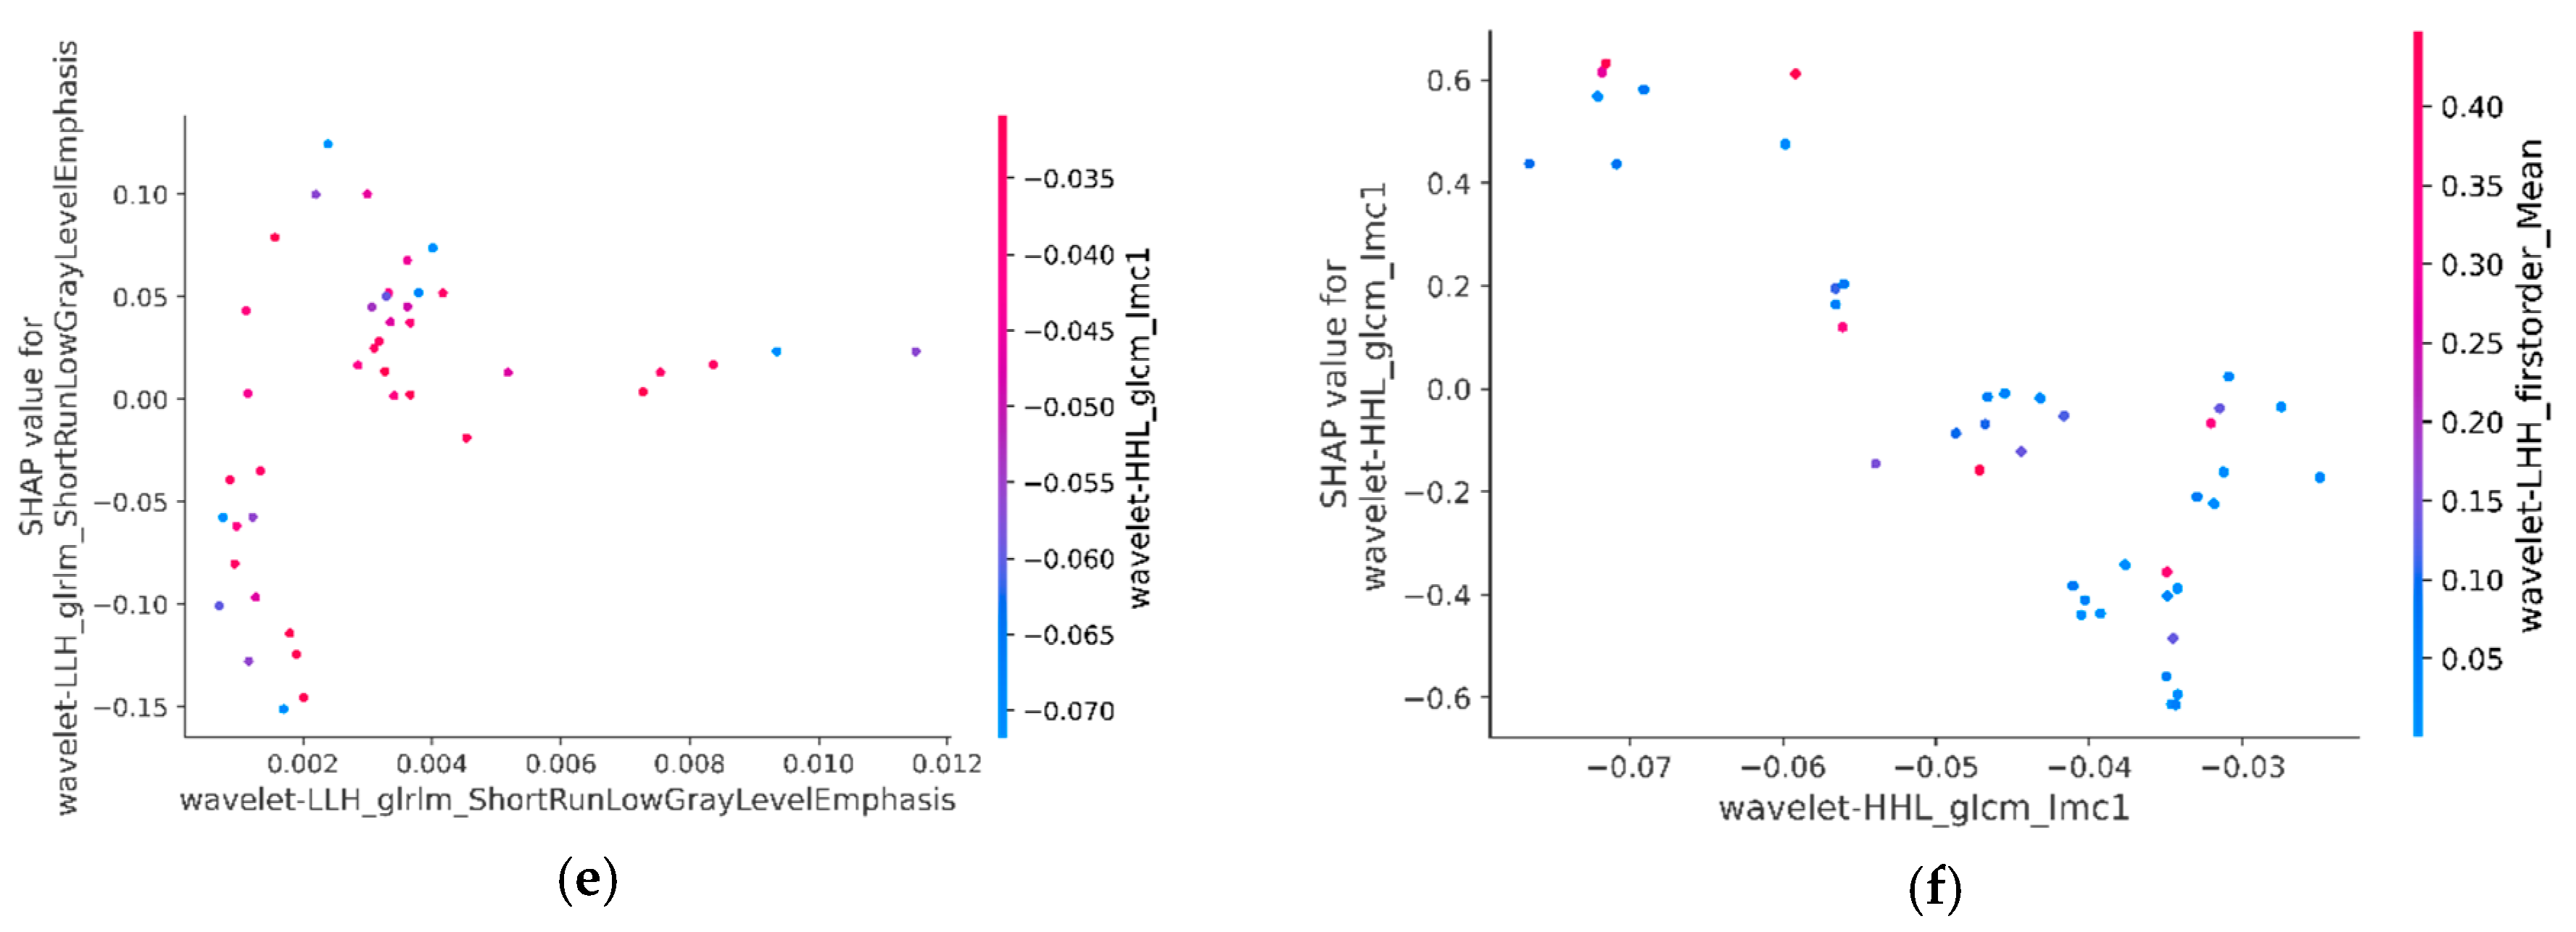
3.6.3. SHAP Interaction Values of Most Relevant Characteristics with Each Other

The influence of clinical characteristics on predicting EGFR mutation is illustrated through several interactions. Notably, the impact of tobacco consumption on prediction varies with age, with a strong influence observed in younger patients but a weak influence in older patients, as is shown in Figure 7a. In contrast, sex does not influence the impact of age on prediction, confirming previous findings on the limited relevance of sex as a contributing factor, as is shown in Figure 7b. Furthermore, interactions between clinical and CT characteristics reveal that the presence of a nodule in the same lobe significantly contributes to prediction in smoking patients, as is shown in Figure 7c. Additionally, interactions between radiomic characteristics show that wavelet-HLL_Glcm_lmcl makes a strong contribution to prediction when wavelet-HLL_Glmd_low_greylevelemphasis has low values (Figure 7d). Other interactions between the radiomic feature wavelet-HLL_Glmd_ShortRunLongLowGreyLevelEmphasis and wavelet-HLL_GLCM_Lmcl are shown in Figure 7e, while the interaction between wavelet-HLL_GLCM_Lmcl and wavelet-HLL_Firstorder_Mean is presented in Figure 7f.

4. Discussion

4.1. Key Findings and Implications

This study presents a comprehensive approach that integrates clinical, CT, and radiomic features to predict the EGFR mutation status in patients with non-small cell lung cancer (NSCLC). The development of a nomogram based on the most relevant features constitutes an innovative contribution to the field of non-invasive molecular characterization. Our findings emphasize the critical role of feature selection in improving the performance of Random Forest (RF) models for molecular prediction. The proposed nomogram, integrating optimal features, stands out as a promising decision-support tool for the early application of tyrosine kinase inhibitors (TKIs) in NSCLC patients [51,52,53].

4.2. Challenges and Future Directions

Despite the promising results, our approach faces several challenges, including the need for prospective validation in clinical studies to confirm its effectiveness and accuracy in real-world settings. Ensuring the model’s generalizability across diverse populations and clinical contexts is crucial. Integrating the model into existing healthcare systems also poses significant challenges, requiring complex modifications to workflows and information systems. Furthermore, the lack of standardized radiomic methods and clinical characteristics limits the comparability and generalizability of the results [54].

4.3. Significance and Originality

This research represents the first study in Morocco focused on the non-invasive prediction of the EGFR mutation status using CT-based clinical, tomographic, and radiomic features and machine learning techniques. Our cohort’s EGFR mutation rates differ slightly from those reported in Asian populations but remain consistent with findings in broader global datasets [55]. The study’s findings have significant implications for patients with tumors that are difficult to access or pose high risks, offering a promising approach for the early application of TKIs in NSCLC patients.

5. Conclusions

In this study, we present a non-invasive, intelligent, automated, and robust method for predicting the EGFR mutation status in patients with non-small cell lung cancer (NSCLC). A comprehensive evaluation of CT-based models confirmed the superiority of the model trained exclusively on the most relevant selected features. The proposed nomogram, integrating 11 key features (2 clinical, 2 CT, and 7 radiomic), demonstrated both feasibility and high predictive performance, supporting its potential as a rapid decision-support tool for initiating tyrosine kinase inhibitor (TKI) therapy in NSCLC patients.

Supplementary Materials

The following supporting information can be downloaded at: https://www.mdpi.com/article/10.3390/jor5030011/s1. Table S1: Statistical analysis of clinical characteristics, CT scan features, and EGFR mutation status.

Author Contributions

B.A. (Badreddine Alami) contributed to conceptualization, methodology, investigation, data curation, resources, and validation. M.M. was responsible for project administration, supervision, and resources. H.Q. contributed to methodology, investigation, writing—original draft, and writing—review and editing. A.B. worked on formal analysis and software. M.Q. contributed to formal analysis, software, visualization, and writing—original draft. A.C. participated in formal analysis, software, and visualization. A.L. and M.O.J. were involved in writing—original draft and writing—review and editing. I.B. contributed to formal analysis and writing—original draft. A.y.M., S.B., N.E.B., M.Y.A.L., H.E.F., B.A. (Bouchra Amara), M.S. (Mohammed Smahi), and M.S. (Mounia Serraj) contributed to data curation, resources, and validation. All authors have read and agreed to the published version of the manuscript.

Funding

This research received no external funding.

Institutional Review Board Statement

The study was conducted in accordance with the Declaration of Helsinki and approved by the Institutional Review Board of the faculty of Medicine and Pharmacy Ethics Committee of Casablanca, Morocco, according to the Helsinki Declaration under reference 17/15.

Informed Consent Statement

Informed consent was obtained from all subjects involved in the study.

Data Availability Statement

Data available upon reasonable request from the corresponding author.

Acknowledgments

The authors thank all the members of the Radiology, Pulmonology, and Oncology departments of the Hassan II University Hospital Center who participated directly or indirectly in the collection of the patient data used in this study.

Conflicts of Interest

The authors declare no conflicts of interest.

Abbreviations

The following abbreviations are used in this manuscript:
EGFREpithelial Growth Factor Receptor
TKITyrosine Kinase Inhibitor
NSCLCNon-small cell lung cancer
AUCArea under the curve
WTWild type
DICOMDigital imaging and communications in medicine
SHAPSHapley Additive exPlanations algorithm
ROCReceiver Operating Characteristic
CTComputed Tomography

References

  1. Santos, D.C.; Saieg, M.A.; Geddie, W.; Leighl, N. EGFR gene status in cytological samples of non small cell lung carcinoma: Controversies and opportunities. Cancer Cytopathol. 2011, 119, 80–91. [Google Scholar] [CrossRef] [PubMed]
  2. Ladanyi, M.; Pao, W. Lung adenocarcinoma: Guiding EGFR-targeted therapy and beyond. Mod. Pathol. 2008, 21 (Suppl. 2), S16–S22. [Google Scholar] [CrossRef] [PubMed]
  3. Herbst, R.S.; Morgensztern, D.; Boshoff, C. The Biology and Management of Non-Small Cell Lung Cancer. Nature 2018, 553, 446–454. [Google Scholar] [CrossRef] [PubMed]
  4. Wang, L.; Sheng, Z.; Zhang, J.; Song, J.; Teng, L.; Liu, L.; Li, Q.; Wang, B.; Li, B. Comparison of lorlatinib, alectinib and brigatinib in ALK inhibitor–naive/untreated ALK-positive advanced non-small-cell lung cancer: A systematic review and network meta-analysis. J. Chemother. 2021, 34, 87–96. [Google Scholar] [CrossRef] [PubMed]
  5. Reck, M.; van Zandwijk, N.; Gridelli, C.; Baliko, Z.; Rischin, D.; Allan, S.; Krzakowski, M.; Heigener, D. Erlotinib in advanced non-small cell lung cancer: Efficacy and safety findings of the global phase IV Tarceva Lung Cancer Survival Treatment study. J. Thorac. Oncol. 2010, 5, 1616–1622. [Google Scholar] [CrossRef] [PubMed]
  6. Cullen, M.H.; Zatloukal, P.; Sörenson, S.; Novello, S.; Fischer, J.R.; Joy, A.A.; Zereu, M.; Peterson, P.; Visseren-Grul, C.M.; Iscoe, N. A randomized phase III trial comparing standard and high-dose pemetrexed as second-line treatment in patients with locally advanced or metastatic non-small-cell lung cancer. Ann. Oncol. 2008, 19, 939–945. [Google Scholar] [CrossRef] [PubMed]
  7. Fukuoka, M.; Yano, S.; Giaccone, G.; Tamura, T.; Nakagawa, K.; Douillard, J.Y.; Nishiwaki, Y.; Vansteenkiste, J.; Kudoh, S.; Rischin, D. Multi-institutional randomized phase II trial of gefitinib for previously treated patients with advanced non-small-cell lung cancer (The IDEAL 1 trial) corrected. J. Clin. Oncol. 2003, 21, 2237–2246. [Google Scholar] [CrossRef] [PubMed]
  8. Kris, M.G.; Natale, R.B.; Herbst, R.S.; Lynch, T.J., Jr.; Prager, D.; Belani, C.P.; Schiller, J.H.; Kelly, K.; Spiridonidis, H.; Sandler, A. Efficacy of gefitinib, an inhibitor of the epidermal growth factor receptor tyrosine kinase, in symptomatic patients with non-small cell lung cancer: A randomized trial. JAMA 2003, 290, 2149–2158. [Google Scholar] [CrossRef] [PubMed]
  9. Pérez-Soler, R.; Chachoua, A.; Hammond, L.A.; Rowinsky, E.K.; Huberman, M.; Karp, D.; Rigas, J.; Clark, G.M.; Santabárbara, P.; Bonomi, P. Determinants of tumor response and survival with erlotinib in patients with non-small-cell lung cancer. J. Clin. Oncol. 2004, 22, 3238–3247. [Google Scholar] [CrossRef] [PubMed]
  10. Shepherd, F.A.; Rodrigues Pereira, J.; Ciuleanu, T.E.; Tan, E.H.; Hirsh, V.; Thongprasert, S.; Campos, D.; Maoleekoonpiroj, S.; Smylie, M.; Martins, R.; et al. Erlotinib in previously treated non-small-cell lung cancer. N. Engl. J. Med. 2005, 353, 123–132. [Google Scholar] [CrossRef] [PubMed]
  11. Riely, G.J.; Pao, W.; Pham, D.; Li, A.R.; Rizvi, N.; Venkatraman, E.S.; Zakowski, M.F.; Kris, M.G.; Ladanyi, M.; Miller, V.A. Clinical Course of Patients with Non–Small Cell Lung Cancer and Epidermal Growth Factor Receptor Exon 19 and Exon 21 Mutations Treated with Geftinib or Erlotinib. Cancer Ther. Clin. 2006, 12, 839–844. [Google Scholar] [CrossRef] [PubMed]
  12. Schuler, M.; Wu, Y.-L.; Hirsh, V.; O’bYrne, K.; Yamamoto, N.; Mok, T.; Popat, S.; Sequist, L.V.; Massey, D.; Zazulina, V.; et al. First-line afatinib versus chemotherapy in patients with non-small cell lung cancer and common epidermal growth factor receptor gene mutations and brain metastases. J. Thorac. Oncol. 2016, 11, 380–390. [Google Scholar] [CrossRef] [PubMed]
  13. Rueschhoff, A.B.; Moore, A.W.; Jasahui, M.R.P. Lung Cancer Staging—A Clinical Practice Review. J. Respir. 2024, 4, 50–61. [Google Scholar] [CrossRef]
  14. Tang, W.; Li, X.; Xie, X.; Sun, X.; Liu, J.; Zhang, J.; Wang, C.; Yu, J.; Xie, P. EGFR Inhibitors as Adjuvant Therapy for Resected Non-Small Cell Lung Cancer Harboring EGFR Mutations. Lung Cancer 2019, 136, 6–14. [Google Scholar] [CrossRef] [PubMed]
  15. Mitsudomi, T.; Morita, S.; Yatabe, Y.; Negoro, S.; Okamoto, I.; Tsurutani, J.; Seto, T.; Satouchi, M.; Tada, H.; Hirashima, T.; et al. Gefitinib Versus Cisplatin Plus Docetaxel in Patients with Non-Small-Cell Lung Cancer Harbouring Mutations of the Epidermal Growth Factor Receptor (Wjtog3405): An Open Label, Randomised Phase 3 Trial. Lancet Oncol. 2010, 11, 121–128. [Google Scholar] [CrossRef] [PubMed]
  16. Gutierrez-Herrera, J.; Montero-Fernandez, M.A.; Kokaraki, G.; De Petris, L.; Falcão, R.M.; Molina-Centelles, M.; Guijarro, R.; Ekman, S.; Ortiz-Villalón, C. NTRK Gene Expression in Non-Small-Cell Lung Cancer. J. Respir. 2025, 5, 2. [Google Scholar] [CrossRef]
  17. Kobayashi, K. Primary Resistance to EGFR Tyrosine Kinase Inhibitors (TKIs): Contexts and Comparisons in EGFR-Mutated Lung Cancer. J. Respir. 2023, 3, 223–236. [Google Scholar] [CrossRef]
  18. Skoulidis, F.; Heymach, J.V. Co-occurring genomic alterations in non–small cell lung cancer biology and therapy. Nat. Rev. Cancer 2019, 19, 495–509. [Google Scholar] [CrossRef] [PubMed]
  19. Brody, R.; Zhang, Y.; Ballas, M.; Siddiqui, M.K.; Gupta, P.; Barker, C.; Midha, A.; Walker, J. PD-L1 Expression in Advanced NSCLC: Insights into Risk Stratification and Treatment Selection from a Systematic Literature Review. Lung Cancer 2017, 112, 200–215. [Google Scholar] [CrossRef] [PubMed]
  20. Pallumeera, M.; Giang, J.C.; Singh, R.; Pracha, N.S.; Makary, M.S. Evolving and Novel Applications of Artificial Intelligence in Cancer Imaging. Cancers 2025, 17, 1510. [Google Scholar] [CrossRef] [PubMed]
  21. Li, H.; Salehjahromi, M.; Godoy, M.C.B.; Qin, K.; Plummer, C.M.; Zhang, Z.; Hong, L.; Heeke, S.; Le, X.; Vokes, N.; et al. Lung Cancer Risk Prediction in Patients with Persistent Pulmonary Nodules Using the Brock Model and Sybil Model. Cancers 2025, 17, 1499. [Google Scholar] [CrossRef] [PubMed]
  22. Yamazaki, K.; Kawauchi, S.; Okamoto, M.; Tanabe, K.; Hayashi, C.; Mikami, M.; Kusumoto, T. Comprehensive Serum Glycopeptide Spectra Analysis Combined with Machine Learning for Early Detection of Lung Cancer: A Case–Control Study. Cancers 2025, 17, 1474. [Google Scholar] [CrossRef] [PubMed]
  23. Hernandez, N.; Carrillo-Perez, F.; Ortuño, F.M.; Rojas, I.; Valenzuela, O. Understanding the Impact of Deep Learning Model Parameters on Breast Cancer Histopathological Classification Using ANOVA. Cancers 2025, 17, 1425. [Google Scholar] [CrossRef] [PubMed]
  24. Şeker, M.; Niazi, M.K.K.; Chen, W.; Frankel, W.L.; Gurcan, M.N. Tumor Bud Classification in Colorectal Cancer Using Attention-Based Deep Multiple Instance Learning and Domain-Specific Foundation Models. Cancers 2025, 17, 1245. [Google Scholar] [CrossRef] [PubMed]
  25. Marquette, C.-H.; Boutros, J.; Benzaquen, J.; Ferreira, M.; Pastre, J.; Pison, C.; Padovani, B.; Bettayeb, F.; Fallet, V.; Guibert, N.; et al. Circulating tumor cells as a potential biomarker for lung cancer screening: A prospective cohort study. Lancet Respir. Med. 2020, 8, 709–716. [Google Scholar] [CrossRef] [PubMed]
  26. Duranti, L.; Tavecchio, L.; Rolli, L.; Solli, P. New Perspectives on Lung Cancer Screening and Artificial Intelligence. Life 2025, 15, 498. [Google Scholar] [CrossRef] [PubMed]
  27. Benfares, A.; Mourabiti, A.Y.; Alami, B.; Boukansa, S.; El Bouardi, N.; Lamrani, M.Y.A.; El Fatimi, H.; Amara, B.; Serraj, M.; Mohammed, S.; et al. Non-invasive, fast, and high-performance EGFR gene mutation prediction method based on deep transfer learning and model stacking for patients with Non-Small Cell Lung Cancer. Eur. J. Radiol. Open 2024, 13, 100601, ISSN 2352-0477. [Google Scholar] [CrossRef] [PubMed]
  28. Sait, W.A.R. Lung Cancer Detection Model Using Deep Learning Technique. Appl. Sci. 2023, 13, 12510. [Google Scholar] [CrossRef]
  29. Wang, L. Deep Learning Techniques to Diagnose Lung Cancer. Cancers 2022, 14, 5569. [Google Scholar] [CrossRef] [PubMed]
  30. Lv, X.; Li, Y.; Xu, X.; Zheng, Z.; Li, F.; Fang, K.; Wang, Y.; Wang, B.; Hou, D. Multi sequence MRI-based radiomics nomogram for early prediction of osimertinib resistance in patients with non-small cell lung cancer brain metastases’, European. J. Radiol. Open 2023, 11, 100521. [Google Scholar] [CrossRef] [PubMed]
  31. Ortiz, A.F.; Camacho, T.C.; Vásquez, A.F.; del Castillo Herazo, V.; Neira, J.G.A.; Yepes, M.M.; Camacho, E.C. Clinical and CT patterns to predict EGFR mutation in patients with non-small cell lung cancer: A systematic literature review and meta-analysis. Eur. J. Radiol. Open 2022, 9, 100400. [Google Scholar] [CrossRef] [PubMed]
  32. Yang, R.; Xiong, X.; Wang, H.; Li, W. Explainable Machine Learning Model to Prediction EGFR Mutation. Lung Cancer 2022, 12, 924144. [Google Scholar] [CrossRef]
  33. Yang, C.; Chen, W.; Gong, G.; Li, Z.; Qiu, Q.; Yin, Y. Application of CT radiomics features to predict the EGFR mutation status and therapeutic sensitivity to TKIs of advanced lung adenocarcinoma. Transl. Cancer Res. 2020, 9, 6683–6690. [Google Scholar] [CrossRef] [PubMed]
  34. Huang, Z.; Zhang, G.; Lin, J.; Pang, Y.; Wang, H.; Bai, T.; Zhong, L. Multi-modal feature-fusion for CT metal artifact reduction using edge-enhanced generative adversarial networks. Comput. Methods Programs Biomed. 2022, 217, 106700. [Google Scholar] [CrossRef] [PubMed]
  35. Zhang, H.-K.; Zhang, Y.-G.; Zhou, Z.; Li, Y.-F. HONGAT: Graph Attention Networks in the Presence of High-Order Neighbors. In Proceedings of the AAAI Conference on Artificial Intelligence, Philadelphia, PA, USA, 25 February–4 March 2025; Volume 38, pp. 16750–16758. [Google Scholar] [CrossRef]
  36. Roy, S.; Carass, A.; Bazin, P.-L.; Prince, J.L.; Dawant, B.M.; Haynor, D.R. Intensity Inhomogeneity Correction of Magnetic Resonance Images using Patches. Proc. SPIE Int. Soc. Opt. Eng. 2011, 7962, 444–449. [Google Scholar] [CrossRef] [PubMed] [PubMed Central]
  37. Yushkevich, P.A.; Gao, Y.; Gerig, G. ITK-SNAP: An interactive tool for semi-automatic segmentation of multi-modality biomedical images. In Proceedings of the 2016 38th Annual International Conference of the IEEE Engineering in Medicine and Biology Society (EMBC), Orlando, FL, USA, 16–20 August 2016; Volume 2016, pp. 3342–3345. [Google Scholar] [CrossRef]
  38. Egger, J.; Kapur, T.; Fedorov, A.; Pieper, S.; Miller, J.V.; Veeraraghavan, H.; Freisleben, B.; Golby, A.J.; Nimsky, C.; Kikinis, R. GBM volumetry using the 3D slicer-medical image computing platform. Sci. Rep. 2013, 3, 1364. [Google Scholar] [CrossRef] [PubMed]
  39. Velazquez, E.R.; Parmar, C.; Jermoumi, M.; Mak, R.H.; van Baardwijk, A.; Fennessy, F.M.; Lewis, J.H.; De Ruysscher, D.; Kikinis, R.; Lambin, P.; et al. Volumetric CT-based segmentation of NSCLC using 3D-Slicer. Sci. Rep. 2013, 3, 3529. [Google Scholar] [CrossRef] [PubMed]
  40. MacMahon, H.; Naidich, D.P.; Goo, J.M.; Lee, K.S.; Leung, A.N.C.; Mayo, J.R.; Mehta, A.C.; Ohno, Y.; Powell, C.A.; Prokop, M.; et al. Guidelines for Management of Incidental Pulmonary Nodules Detected on CT Images: From the Fleischner Society. Radioloy 2017, 284, 228–243. [Google Scholar]
  41. Rubin, G.D. Lung Nodule and Cancer Detection in Computed Tomography Screening. J. Thorac. Imaging 2015, 30, 130–138. [Google Scholar] [CrossRef] [PubMed]
  42. Benfante, V.; Salvaggio, G.; Ali, M.; Cutaia, G.; Salvaggio, L.; Salerno, S.; Busè, G.; Tulone, G.; Pavan, N.; Di Raimondo, D.; et al. Grading and Staging of Bladder Tumors Using Radiomics Analysis in Magnetic Resonance Imaging. In Image Analysis and Processing—ICIAP 2023 Workshops; Foresti, G.L., Fusiello, A., Hancock, E., Eds.; ICIAP 2023, Lecture Notes in Computer Science; Springer: Cham, Switzerland, 2024; Volume 14366. [Google Scholar] [CrossRef]
  43. Canfora, I.; Cutaia, G.; Marcianò, M.; Calamia, M.; Faraone, R.; Cannella, R.; Benfante, V.; Comelli, A.; Guercio, G.; Giuseppe, L.R.; et al. A Predictive System to Classify Preoperative Grading of Rectal Cancer Using Radiomics Features. In Image Analysis and Processing; Mazzeo, P.L., Frontoni, E., Sclaroff, S., Distante, C., Eds.; ICIAP 2022 Workshops, ICIAP 2022, Lecture Notes in Computer Science; Springer: Cham, Switzerland, 2022; Volume 13373. [Google Scholar] [CrossRef]
  44. Kiso, T.; Okada, Y.; Kawata, S.; Shichiji, K.; Okumura, E.; Hatsumi, N.; Matsuura, R.; Kaminaga, M.; Kuwano, H.; Okumura, E. Ultrasound-based radiomics and machine learning for enhanced diagnosis of knee osteoarthritis: Evaluation of diagnostic accuracy, sensitivity, specificity, and predictive value. Eur. J. Radiol. Open 2025, 14, 100649, ISSN 2352-0477. [Google Scholar] [CrossRef] [PubMed]
  45. Pan, J.; Huang, Q.; Zhu, J.; Huang, W.; Wu, Q.; Fu, T.; Peng, S.; Zou, J. Prediction of plaque progression using different machine learning models of pericoronary adipose tissue radiomics based on coronary computed tomography angiography. Eur. J. Radiol. Open 2025, 14, 100638, ISSN 2352-0477. [Google Scholar] [CrossRef] [PubMed]
  46. Elizabeth, P.V.; Wong, M.Y.Z.; Leonardo, R.; Tarkin, J.M.; Evans, N.R.; Weir-McCall, J.R.; Chowdhury, M.M.; Coughlin, P.A.; Pavey, H.; Zaccagna, F.; et al. Using machine learning to predict carotid artery symptoms from CT angiography: A radiomics and deep learning approach. Eur. J. Radiol. Open 2024, 13, 100594, ISSN 2352-0477. [Google Scholar] [CrossRef] [PubMed]
  47. Chawla, N.V.; Bowyer, K.W.; Hall, L.O.; Kegelmeyer, W.P. SMOTE: Synthetic Minority Over-sampling Technique. J. Artif. Intell. Res. 2002, 16, 321–357. [Google Scholar] [CrossRef]
  48. Rodrigues, C.F.d.S.; de Lima, F.J.C.; Barbosa, F.T. Importance of using basic statistics adequately in clinical research. J. Anesthesiol. 2017, 67, 619–625. [Google Scholar] [CrossRef]
  49. Seshadri, R. Github—Autoviml/Featurewiz: Use Advanced Feature Engineering Strategies And Select The Best Features From Your Data Set Fast with a Single Line of Code. 2020. Available online: https://github.com/AutoViML/featurewiz (accessed on 28 March 2025).
  50. Lundberg, S.M.; Lee, S.I. A Unified Approach to Interpreting Model Predictions. In Proceedings of the 30th Conference on Neural Information Processing Systems (NIPS 2017), Long Beach, CA, USA, 4–8 December 2017. [Google Scholar]
  51. Van Sanden, S.; Murton, M.; Bobrowska, A.; Rahhali, N.; Sermon, J.; Rodrigues, B.; Goff-Leggett, D.; Chouaid, C.; Sebastian, M.; Greystoke, A. Greystoke. Prevalence of Epidermal Growth Factor Receptor Exon 20 Insertion Mutations in Non-small-Cell Lung Cancer in Europe: A Pragmatic Literature Review and Meta-analysis. Target Oncol. 2022, 17, 153–166. [Google Scholar] [CrossRef] [PubMed]
  52. Sow, M.L.; El Yacoubi, H.; Moukafih, B.; Balde, S.; Akimana, G.; Najem, S.; El Khoyaali, S.; Abahssain, H.; Chaibi, A.; Khan, S.Z.; et al. Frequency and types of EGFR mutations in Moroccan patients with non–small cell lung cancer. Tumori 2021, 107, 335–340. [Google Scholar] [CrossRef]
  53. Deng, C.; Zhang, Y.; Ma, Z.; Fu, F.; Deng, L.; Li, Y.; Chen, H. Prognostic value of epidermal growth factor receptor gene mutation in resected lung adenocarcinoma. J. Thorac. Cardiovasc. Surg. 2021, 162, 664–674.e7. [Google Scholar] [CrossRef] [PubMed]
  54. Aokage, K.; Miyoshi, T.; Wakabayashi, M.; Ikeno, T.; Suzuki, J.; Tane, K.; Samejima, J.; Tsuboi, M. Prognostic influence of epidermal growth factor receptor mutation and radiological ground glass appearance in patients with early-stage lung adenocarcinoma. Lung Cancer 2021, 160, 8–16. [Google Scholar] [CrossRef] [PubMed]
  55. Kamigaichi, A.; Mimae, T.; Tsubokawa, N.; Miyata, Y.; Adachi, H.; Shimada, Y.; Ito, H.; Ikeda, N.; Okada, M. Risk Factors for Recurrence of Stage I Epidermal Growth Factor Receptor Mutated Lung Adenocarcinoma. Ann. Thorac. Surg. 2024, 117, 743–751. [Google Scholar] [CrossRef] [PubMed]
Figure 1. Different stages of the current study design flow.
Jor 05 00011 g001
Figure 2. Patient selection criteria in this study.
Jor 05 00011 g002
Figure 3. Performance measurements of the five Random Forest models, (a) AUC to ROC curve, micro- and macro-average ROC curve for Model 1, (b) AUC to ROC curve, micro- and macro-average ROC curve for Model 2, (c) AUC to ROC curve, micro- and macro-average ROC curve for Model 3, (d) AUC to ROC curve, micro- and macro-average ROC curve for Model 3, and (e) AUC to ROC curve, micro- and macro-average ROC curve for Model 5, The black dashed line represents the line of no-discrimination (AUC = 0.5), which corresponds to the performance of a random classifier.
Jor 05 00011 g003
Figure 4. Decision curve analysis (DCA) of five Random Forest models for predicting EGFR mutation status. X-axis: Decision threshold, representing the minimum acceptable risk probability for clinical decision-making. Y-axis: Net benefit of the Random Forest model at various thresholds, evaluating the effectiveness of model-driven decision-making compared to no feature selection (None) or all-feature selection (All). The figure presents DCA results for five Random Forest models (Model (i)) trained on dataset (i), showcasing performance in: (a) training process, (b) validation process, and (c) testing process.
Jor 05 00011 g004
Figure 5. SHAP global relevance of clinical, CT, and radiomic features in predicting EGFR mutation using Model 5: (a) global relevance of clinical and CT characteristics, (b) global relevance of radiomic features.
Jor 05 00011 g005
Figure 6. SHAP individual contributions of clinical, CT, and radiomic features in predicting EGFR mutation using Model 5: (a) global relevance of clinical and CT characteristics, (b) global relevance of radiomic features.
Jor 05 00011 g006
Figure 7. Interactions between characteristics in predicting EGFR mutation status using Model 5: (a) Influence of the clinical feature ‘Age’ on the clinical feature ‘Tobacco’ for the prediction of EGFR mutation, (b) influence of the clinical feature ‘Sex’ on the feature ‘Age’ for the prediction of EGFR mutation, (c) influence of the clinical feature ‘Tobacco’ on the CT feature ‘presence of nodule in the same lobe’ for the prediction of EGFR mutation, (d) influence of the radiomic feature ‘wavelet-HLL_Glmd_low_greylevelemphasis’ on the feature ‘wavelet-HLL_Glcm_lmcl’ for the prediction of EGFR mutation, (e) influence of the radiomic feature ‘wavelet-HLL_Glmd_ShortRunLonglowgrey levelemphasis’ on the feature ‘wavelet-HLL_Glcm_lmcl’ for the prediction of EGFR mutation, (f) and influence of the radiomic feature ‘wavelet HLLGlcml’ on the feature ‘wavelet-HLL_Firstorder_Mean’ for EGFR mutation prediction.
Jor 05 00011 g007aJor 05 00011 g007b
Table 1. Dataset composition used in training RF models.
Random Forest ModelDataset Composition
Model 1All clinical and CT features
Model 2Most relevant clinical and CT selected features
Model 3All radiomic features
Model 4Most relevant radiomic features
Model 5Most relevant clinical, CT, and radiomic features
Table 2. Pearson correlation coefficient between the relevant clinical and CT characteristics and the variable ‘EGFR mutation’.
CharacteristicsPearson Coefficient (r)
Age0.257966
Sex0.226862
Tobacco0.330052
Speculation (Yes/No)0.169459
Pleural attachment0.219918
Enhancement (homogeneous/heterogeneous)0.449128
Pulmonary nodule in the same lobe0.214092
Table 3. p-value and confidence interval (CI) for the seven relevant clinical and CT characteristics.
Characteristicsp-ValueCI 95%
Age0.01[0.219, 0.730]
Sex0.0006[0.232, 0.778]
Tobacco0.00[0.344, 0.982]
Speculation (Yes/No)0.043[0.214, 0.608]
Pleural attachment0.009[0.222, 0.742]
Enhancement (homogeneous/heterogeneous)0.0[0.442, 0.999]
Pulmonary nodule in the same lobe0.021[0.197, 0.648]
Table 4. Top 20 radiomic features with best Pearson correlation rate.
CharacteristicsCorrelation Coefficient (r)
Exponential_Glrlm_Shortrunemphasis0.266689
Wavelet-HHH_Glszm_Smallareaemphasis0.255799
Wavelet-HLH_Firstorder_Mean0.250801
Wavelet-LHH_Firstorder_Mean0.242796
Wavelet-HHL_Gldm_Smalldependencelowgraylevelemphasis0.225996
Wavelet-HHL_Firstorder_Mean0.221477
Wavelet-LLL_Glcm_Imc10.220565
Wavelet-HHL_Glcm_Imc10.211336
Log-Sigma-2-0-Mm-3D_Glrlm_Shortrunlowgraylevelemphasis0.210515
Square_Ngtdm_Strength0.20508
Wavelet-HLL_Gldm_Lowgraylevelemphasis0.175642
Wavelet-LHH_Glcm_Imc10.172359
Log-Sigma-2-0-Mm-3D_Glszm_Zonevariance0.162954
Log-Sigma-3-0-Mm-3D_Glszm_Graylevelnonuniformitynormalized0.156765
Original_Shape_Elongation0.138107
Wavelet-LLH_Glrlm_Shortrunlowgraylevelemphasis0.121732
Exponential_Firstorder_90Percentile0.121231
Wavelet-LLH_Glcm_Imc10.117277
Wavelet-LHH_Glszm_Smallareaemphasis0.116431
Wavelet-HHH_Glszm_Lowgraylevelzoneemphasis0.112967
Table 5. Performance relative to each RF model in the testing process.
ModelClassPrecisionRecallF1-ScoreAccuracy
Model 1: RF model trained on a set of all clinical and CT featuresEGFR-WT0.870.840.860.79
EGFR-Mutant0.550.600.57
Macro-average0.710.720.71
Model 2: RF model trained on an ensemble containing only the most relevant clinical and CT featuresEGFR-WT0.800.800.890.81
EGFR-Mutant0.850.750.33
Macro-average0.900.600.61
Model 3: RF model trained on a set containing all radiomic featuresEGFR-WT0.840.810.830.74
EGFR-Mutant0.450.500.48
Macro-average0.650.660.65
Weighted average0.750.740.74
Model 4: RF model trained on a set containing only the most relevant radiomic featuresEGFR-WT0.900.840.870.81
EGFR-Mutant0.580.700.64
Macro-average0.740.770.75
Weighted average0.820.810.82
Model 5: RF model trained on a set containing only the most relevant clinical, CT, and radiomic featuresEGFR-WT0.900.940.910.87
EGFR-Mutant0.710.500.59
Macro-average0.790.720.74
Weighted average0.820.830.82
Table 6. DeLong test results of different models.
Model 1Model 2Model 3Model 4Model 5
Model 110.0300.6840.0940.008
Model 20.03010.0570.4710.211
Model 30.6840.05710.1930.011
Model 40.0940.4710.19310.044
Model 50.0080.2110.010.0441
Disclaimer/Publisher’s Note: The statements, opinions and data contained in all publications are solely those of the individual author(s) and contributor(s) and not of MDPI and/or the editor(s). MDPI and/or the editor(s) disclaim responsibility for any injury to people or property resulting from any ideas, methods, instructions or products referred to in the content.

