1. Introduction
Despite advances in diagnosis, prevention, and treatment, diabetes mellitus (DM) remains a major clinical and public health challenge worldwide, owing to its high prevalence, steadily increasing incidence, complications, and associated mortality [
1,
2]. According to the 11th edition of the International Diabetes Federation (IDF) Diabetes Atlas, as of 2024, approximately 1 in 10 Europeans has DM, and nearly 1 in 3 cases remain undiagnosed. Moreover, every six seconds, a person dies from DM-related complications. Europe has the highest number of people with type 1 DM (2.7 million), 15% of whom (419,000) are under 20 years of age [
3]. Uncontrolled, long-lasting DM inevitably leads to numerous chronic complications [
4]. Skeletal muscles are recognized as the primary tissue regulating carbohydrate metabolism in the body [
5]. In DM, glucose uptake by skeletal muscles is reduced due to low glycogen levels, leading to systemic and skeletal muscle metabolic alterations [
6]. Diabetic myopathy is a DM complication reported in up to 88% of patients and may present clinically with muscle pain, fever, myositis, ischemia, hemorrhage, infarction, necrosis, fibrosis, and fatty degeneration [
7,
8]. Extensive research has focused on the molecular aspects of diabetic myopathy, including mitochondrial dysfunction, insulin resistance, inflammatory processes, and lipotoxicity [
8,
9,
10]; however, disturbances in the structure and function of neuromuscular synapses (NMSs) remain understudied.
Another aspect we aim to address in this paper is stress. Stress is a complex physiological response to changes in the external or internal environment and a major contributor to disease in modern society [
11]. A substantial proportion of individuals experience chronic stress. Although the general adaptation syndrome has protective and adaptive functions, in some cases, the body’s responses may be disproportionate to the triggering stimuli, leading to psychosomatic disorders [
12]. The autonomic nervous system plays a crucial role in the pathophysiology of stress by regulating associated physiological responses. Notably, the spontaneous electrical activity of human muscles, as recorded by electromyography, has been shown to reflect stress-induced changes in autonomic nervous system activity [
13]. Recent studies have increasingly focused on the psychosocial aspects of DM, suggesting an association between mental disorders and diabetes. Several studies have demonstrated that depression among patients with DM is associated with adverse health outcomes, mainly due to poor adherence to prescribed treatment regimens [
14]. Population-based studies report that individuals with type 2 DM are more likely to experience depression than those without the condition. In contrast, individuals with depression are at higher risk of developing DM [
15]. In type 2 DM, neuroendocrine changes disrupt skeletal muscle metabolism [
10,
16]. Specifically, changes in hormone levels, including glucocorticoids, insulin-like growth factor 1 (IGF-1), and plasminogen activator inhibitor-1 (PAI-1), lead to muscle fiber atrophy and damage [
17]. Myodynamic imbalance of the masticatory muscles in patients with DM often results in occlusal disorders [
18,
19]. Hypercortisolism, which develops in both DM and stress, promotes microangiopathy [
20] and induces gluconeogenesis, thereby exacerbating DM and causing profound metabolic changes in skeletal muscles [
6]. However, comprehensive studies examining changes in the neuromuscular junctions (NMJs) of skeletal muscles, particularly the masticatory muscles, and in their microcirculation in DM under chronic immobilization stress have not yet been reported.
Therefore, this study aimed to establish pathomorphological criteria for assessing diabetic myopathy in the context of comorbidity by examining pathohistological changes in NMJs, muscle fibers, and the vascular supply to the masseter muscle in DM under chronic immobilization stress.
2. Materials and Methods
2.1. Research Design
The experiments were performed on 28 six-month-old male albino laboratory rats, equally divided into four groups (7 rats per group): Group 1 included rats with comorbid pathology—streptozotocin-induced diabetes mellitus (SIDM) combined with chronic immobilization stress (CIS); Group 2 included rats with SIDM only; Group 3 included rats subjected to CIS only and Group 4 (Control) consisted of healthy rats. In Groups 1 and 2, SIDM was simulated by a single intraperitoneal injection of streptozotocin (Sigma-Aldrich, Co. 3050, Spruse Street, St. Louis, MO, USA), 60 mg/kg dissolved in 0.1 M citrate buffer (pH 4.5). In Groups 1 and 3, chronic immobilization stress (CIS) was simulated by placing the animals in a closed plastic container for 5 h per day. This method allows for the combination of physical, psychological, and sociological stress, and has been previously validated to induce high cortisol levels in blood samples from rats [
21,
22].
In Group 1, SIDM was simulated, and CIS was introduced starting from the 14th day of the experiment. The experiment on animals was conducted in the vivarium of Ivano-Frankivsk National Medical University. The rat cages were kept in a room with a controlled environment, in the following standard conditions (12/12 light/dark cycle with 22 ± 3 °C room temperature). All rats were provided with standard laboratory chow and water ad libitum. Every morning on an empty stomach, glucose levels were monitored in a drop of blood from the tail vein using Accu-Chek Active test strips (Roche Diabetes Care GmbH, Mannheim, Germany). The material was collected by decapitation under ether anesthesia, and blood was immediately taken for biochemical analysis. Material collection was performed in the morning (between 7:00 and 8:00 am), before feeding, to exclude the influence of daily rhythm and biological activity on rat metabolism. Glucose levels were measured using the glucose oxidase method at the Center of Bioelementology of Ivano-Frankivsk National Medical University. The levels of glycated hemoglobin (HbA1c) and cortisol were determined in the clinical diagnostics laboratory “Medlux”. Tissue samples (masseter muscle and blood) were collected on the 56th day after the beginning of the experiment in Groups 1, 2, and 4. In Group 3, the materials were collected on the 42nd day from the beginning of CIS induction.
All animal experiments were conducted in compliance with the requirements of the ethics committee of Ivano-Frankivsk National Medical University (Protocol No. 128/22 dated 22 September 2022), following the guidelines of the EU Directive 2010/63/EU for animal experiments, the European Convention for the Protection of Vertebrate Animals Used for Research and Other Scientific Purposes (Strasbourg, 1986).
2.2. Histological Methods
For light microscopic observation, samples (masseter muscles) were fixed in 10% formalin for 24 h, dehydrated and embedded in paraffin. In addition to routine histological examination, the sections were stained with hematoxylin and eosin (H & E), stained according to Hart’s method and additionally counterstained using the Van Gieson technique to identify elastic components in the walls of microvessels, and Masson’s trichrome stain was applied to differentiate connective tissue from muscle.
To identify neuromuscular junctions (NMJ), the masseter muscle was fixed in 12% neutral formalin for 25–30 days. The material was then rinsed, and 30–40 μm thick sections were prepared using a cryostat and processed according to the Bielschowsky–Gross method.
All sections were evaluated with an optical microscopeLeica DM 750 (Max Schmidheiny-Strasse 201, Heerbrugg, Switzerland) and monitored with attached digital camera (ToupCam 5.2M UHCCD C-Mount Sony, Hangzhou ToupTek Photonics, Hangzhou, China). Morphometric analysis was carried out using ImageJ software (version 1.47t). Cross-sections of the masseter muscle were used to assess capillary density, muscle fiber cross-sectional area, and the area of microcirculatory vessels and their lumina. Ten fields of view from each of three randomly selected cross-sections of the masseter muscle were analyzed at a magnification of ×400 in each study group. The Vogenvort index (VI) was calculated using the formula: V = S
o/S
pr × 100 (where S
o represents the cross-sectional area of the vessel wall (μm
2) and S
pr represents the cross-sectional area of the vessel lumen (μm
2)) [
23]. The capillary density was measured by counting the number of capillaries per 0.1 mm
2 of muscle tissue cross-section.
On histological sections stained by the Bielschowsky–Gross method, morphometric analysis of neuromuscular junctions was performed, and their area and axonal sprouting were assessed. Ten fields of view from each of three randomly selected sections of the masseter muscle were analyzed at a magnification of ×1000 in each study group.
2.3. Electron Microscopy
Fragments of the masseter muscle measuring 1 × 1 × 1 mm were fixed in a 2% solution of osmium tetroxide in 0.1 M phosphate buffer (pH 7.4) for 2 h and, following standard procedures, embedded in Epon blocks. Ultrathin sections obtained using a Tesla BS-490A ultramicrotome (Tesla, Brno, Czechoslovakia) were mounted on 1 mm diameter copper grids and contrasted with a 2% solution of uranyl acetate in 70% ethanol and Reynolds’ lead citrate. The specimens were examined using a PEM-125K transmission electron microscope (Selmi, Sumy, Ukraine) at an accelerating voltage of 75 kV, followed by photography at different magnifications. The electron microscopic study was conducted at the Educational and Research Laboratory of Morphological Analysis of Ivano-Frankivsk National Medical University.
On digitized electron micrographs, within a standardized area of 27 μm2, the following parameters were measured: the cross-sectional area of the neuromuscular synapse (NMS), the total number of synaptic vesicles per NMS, the number of postsynaptic folds (PSFs), the distance between adjacent PMFs, and the area of a single PSF.
2.4. Statistical Procedure
All statistical tests were performed using RStudio 4.4.1 (RStudio, PBC; Boston, MA, USA) and Statistica 12 (Stat.Soft.Inc.; Tulsa, OK, USA). For statistical analysis, the normality of the distribution of quantitative traits was checked using the Kolmogorov–Smirnov test with the Lilliefors correction and the Shapiro–Wilk test, as well as a histogram with a waiting line for a normal distribution function. The Mann–Whitney U test was used to test for differences between the indices of independent groups. When analyzing a large number of evaluated parameters, the well-known problem of multiple comparisons arises. To address this issue, the Holm–Bonferroni method was applied in the study. The sample parameters presented in the text are estimated as Mean ± SE, and p < 0.05 value was accepted to be statistically significant.
3. Results
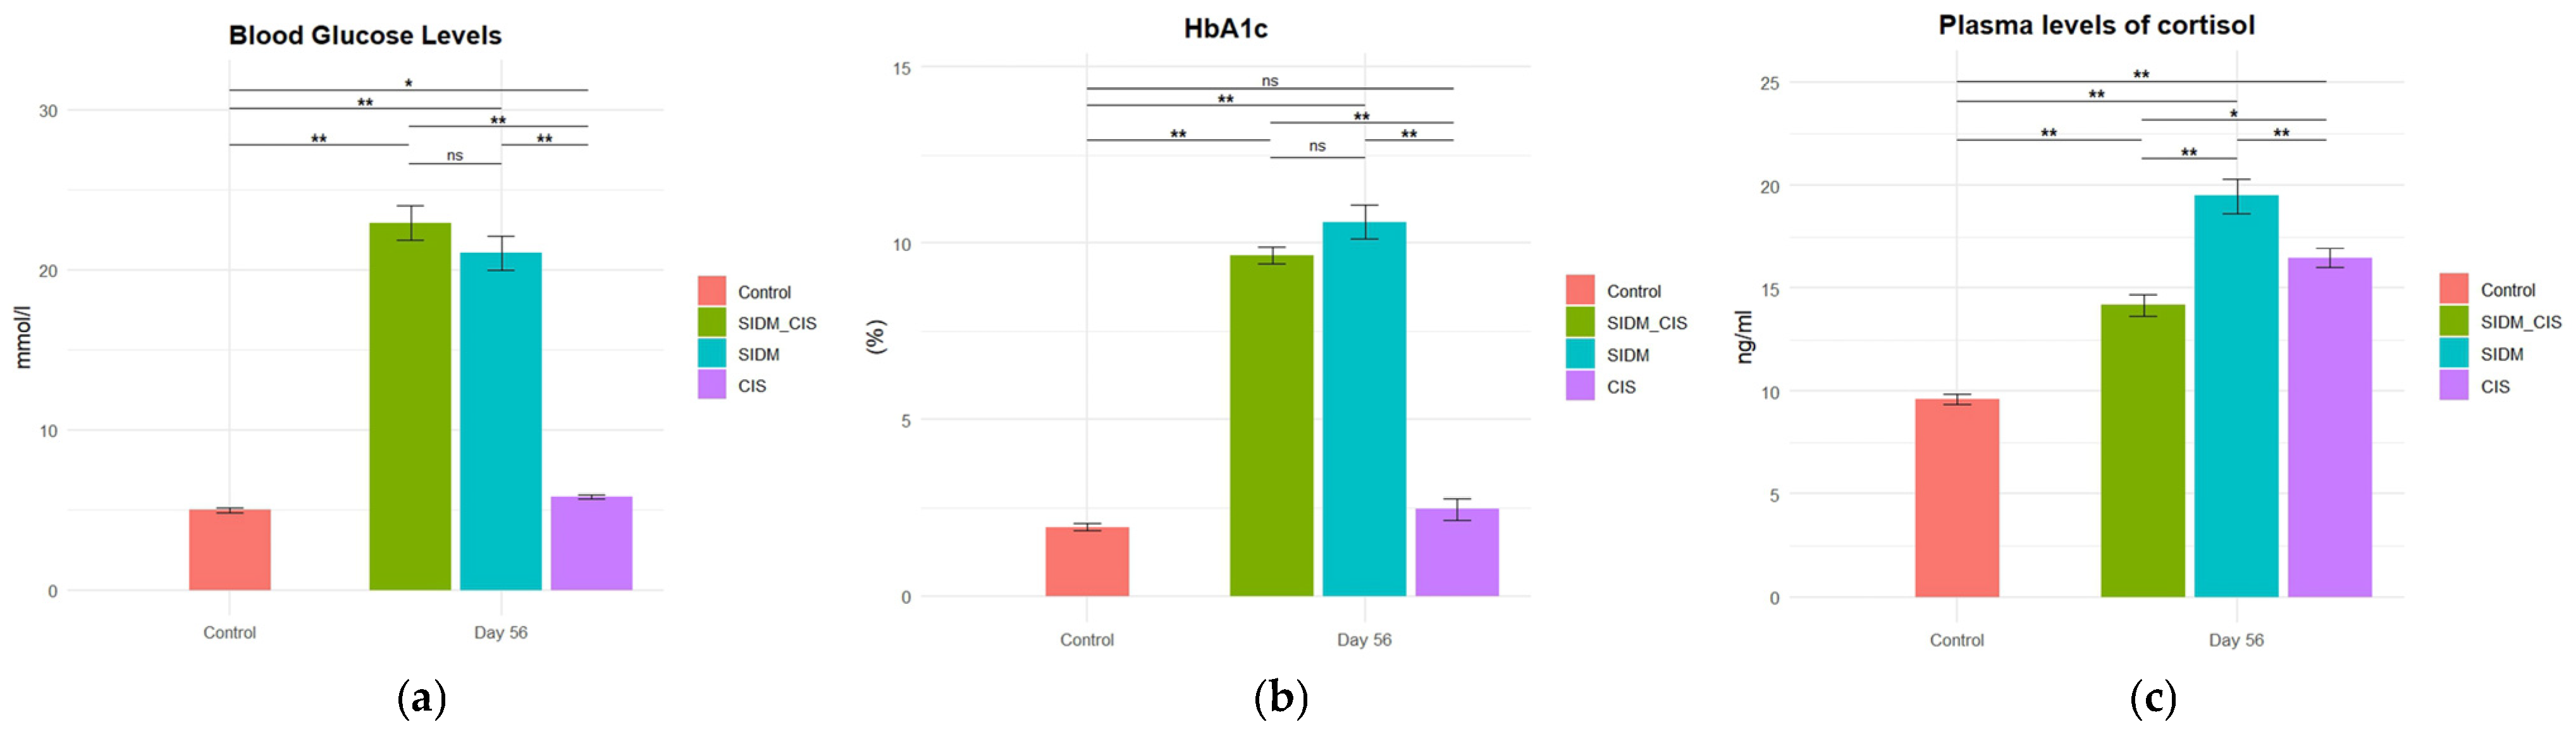
By day 56 of the experiment, Group 1 and Group 2 rats developed decompensated DM, as evidenced by significant increases in blood glucose and HbA1c levels (
Figure 1a,b). In Group 3, carbohydrate metabolism parameters tended to increase, but did not differ significantly from control values for HbA1c (
Figure 1a,b). This suggests that chronic immobilization stress at this stage of the study is characterized by transient hyperglycemia and may potentially lead to the development of diabetes mellitus in the future. Blood cortisol levels were significantly higher across all experimental groups compared to controls (
Figure 1c).
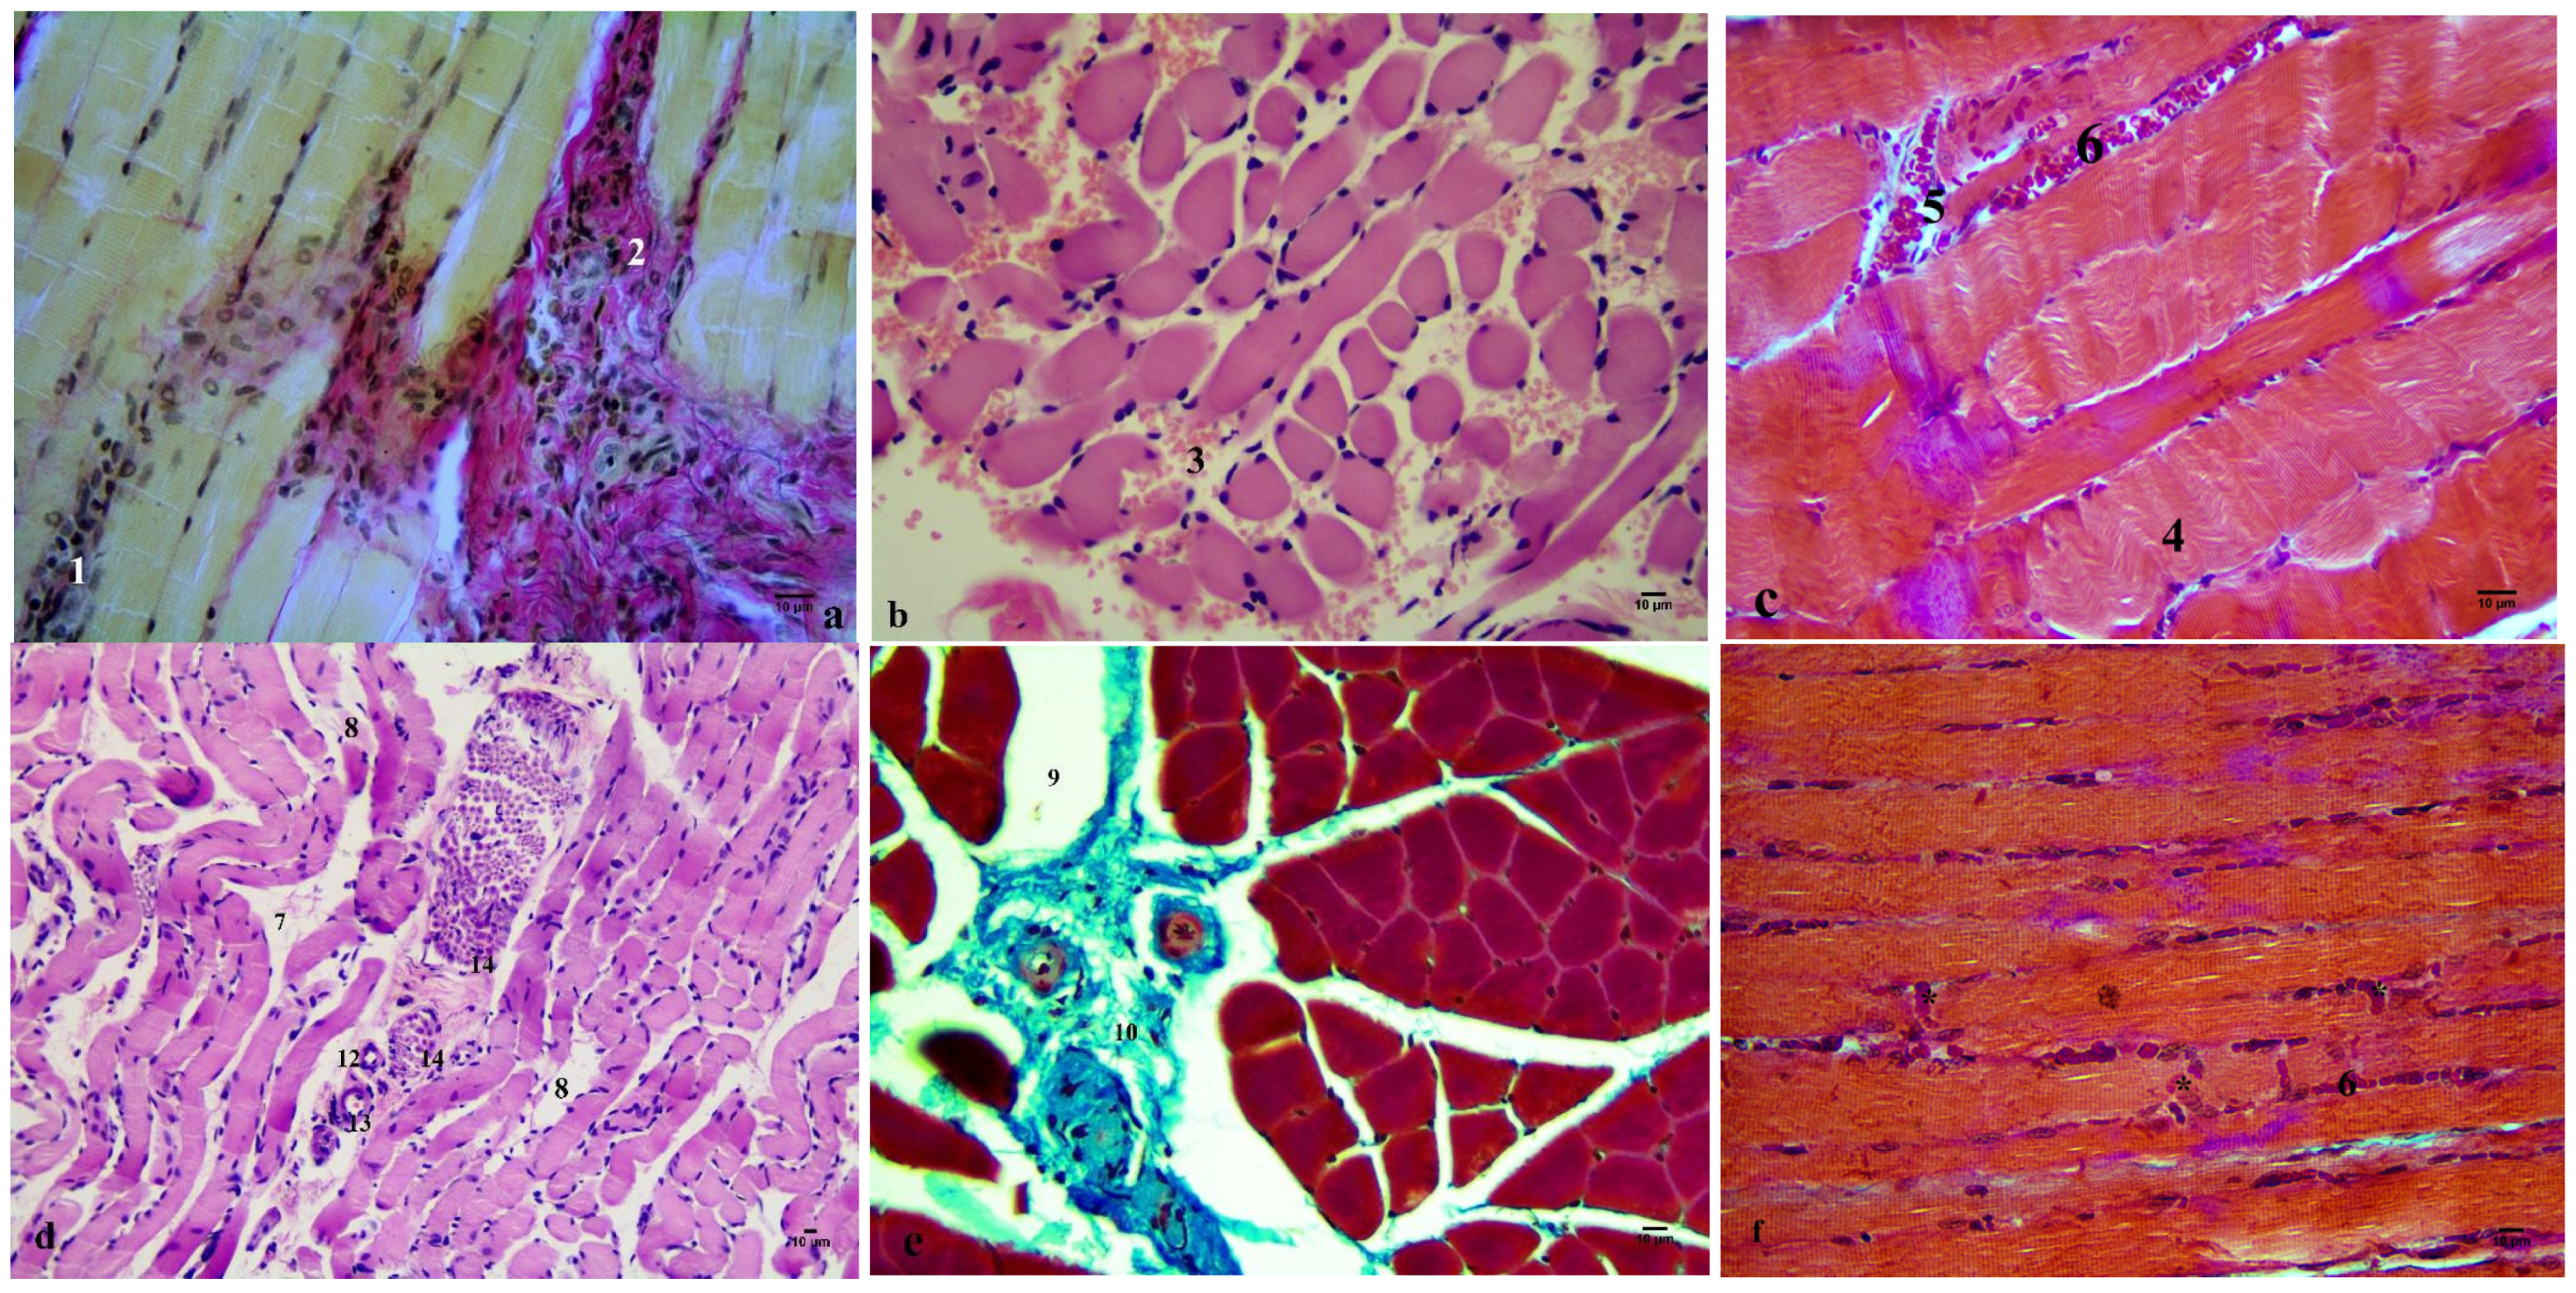
In the masseter muscles of Group 1 and Group 2 rats, focal edema of the endo- and perimysium, resulting from plasma infiltration, was observed, accompanied by connective tissue proliferation around microcirculatory vessels (
Figure 2b,d), contributing to perivascular sclerosis. In the examined muscle specimens, fragmentation and focal lysis of individual muscle fibers were frequently observed, accompanied by histolymphocytic infiltration, indicative of aseptic myositis (
Figure 2a).
Furthermore, some damaged muscle fibers were replaced by connective tissue, resulting in muscle fibrosis (
Figure 2a). In the masseter muscles of Group 1 rats, occasional hemorrhages (
Figure 2b), muscle infarctions (
Figure 2d), and myolysis (
Figure 2b,d) were seen. In Group 1 and Group 2 rats, similar changes occurred against the background of diabetic microangiopathy, which was evident histologically as erythrocyte sludging within the microvascular network (
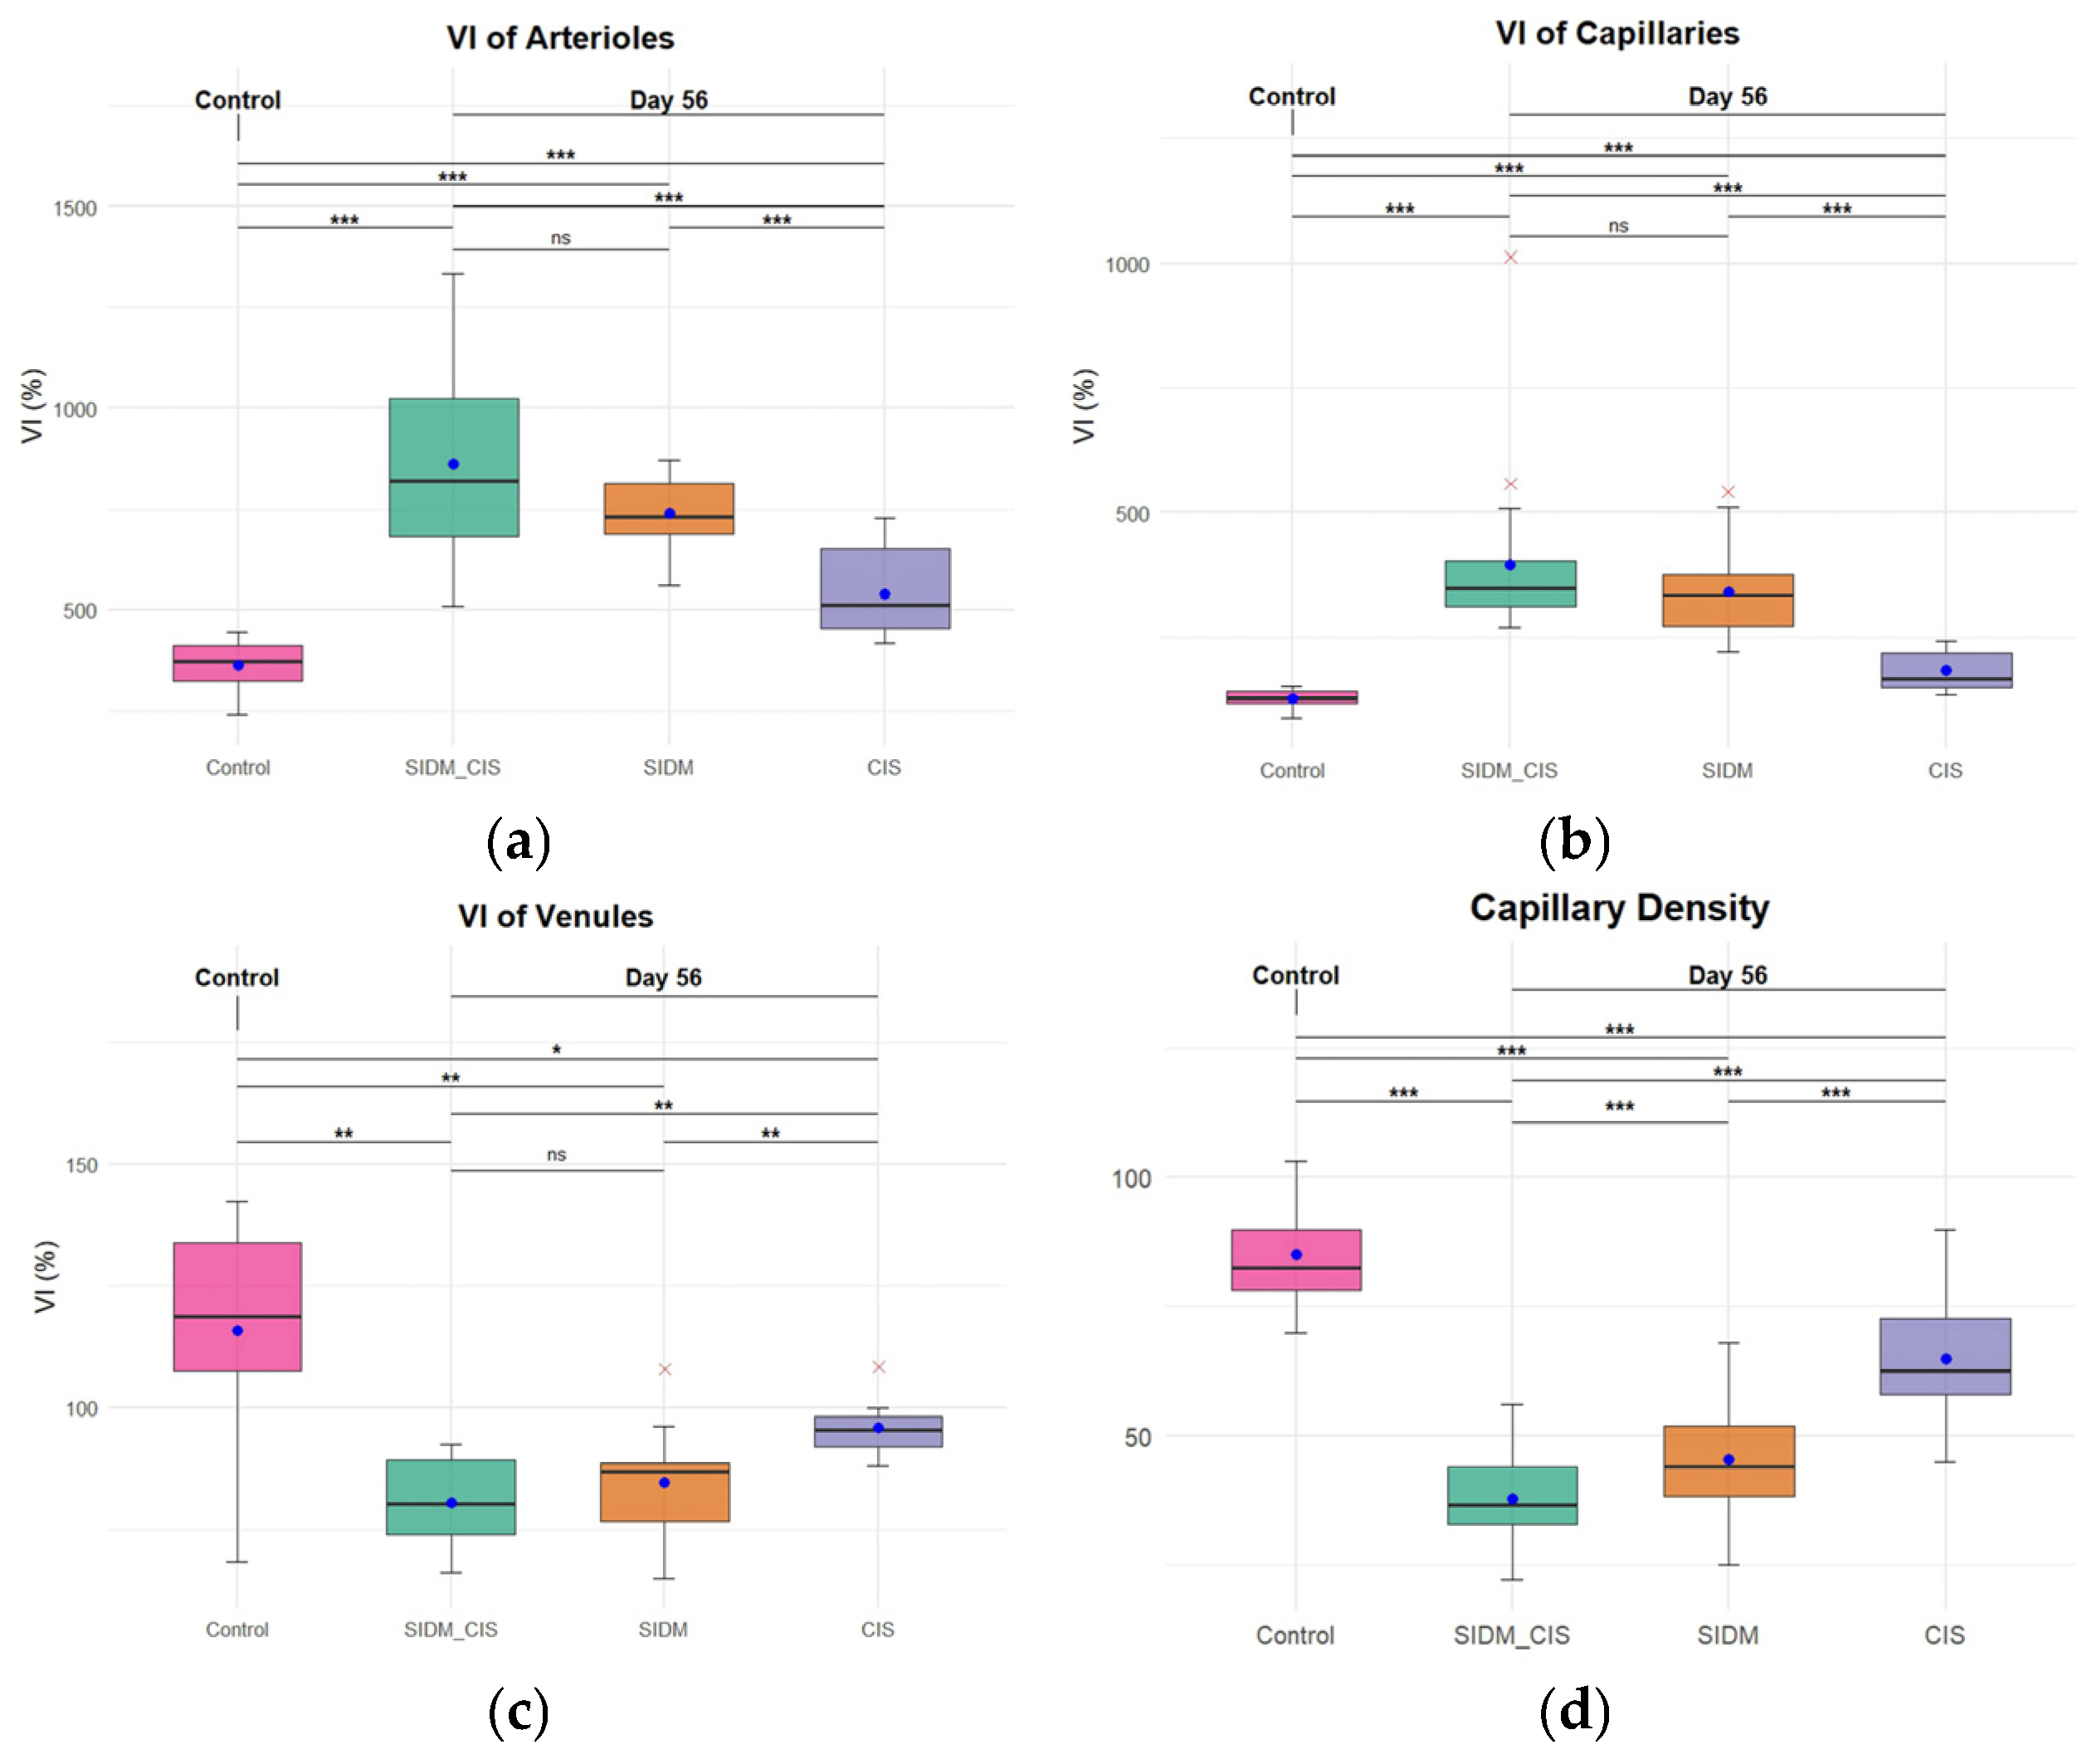
Figure 2c,f) and engorgement of venules and veins. The perfusion capacity of the afferent and exchange segments of the microcirculation was significantly reduced several-fold compared to controls, as reflected by a significant increase in the Vogenvort index (
Figure 3a,b), resulting from thickened vessel walls and narrowed lumens (
Table 1). In contrast, the luminal area of venules increased compared with the control group (
Table 1). Microvessel remodeling led to the formation of arteriolovenular anastomoses (
Figure 2c,f), serving a compensatory and protective role by allowing blood to bypass the capillary bed and flow directly into the venous circulation. These changes in the angioarchitecture of the masseter muscle resulted in a 2.2-fold reduction in the number of blood capillaries per 0.1 mm
2 of muscle tissue cross-section in Group 1 rats and a 1.9-fold reduction in Group 2 rats (
Figure 3d).
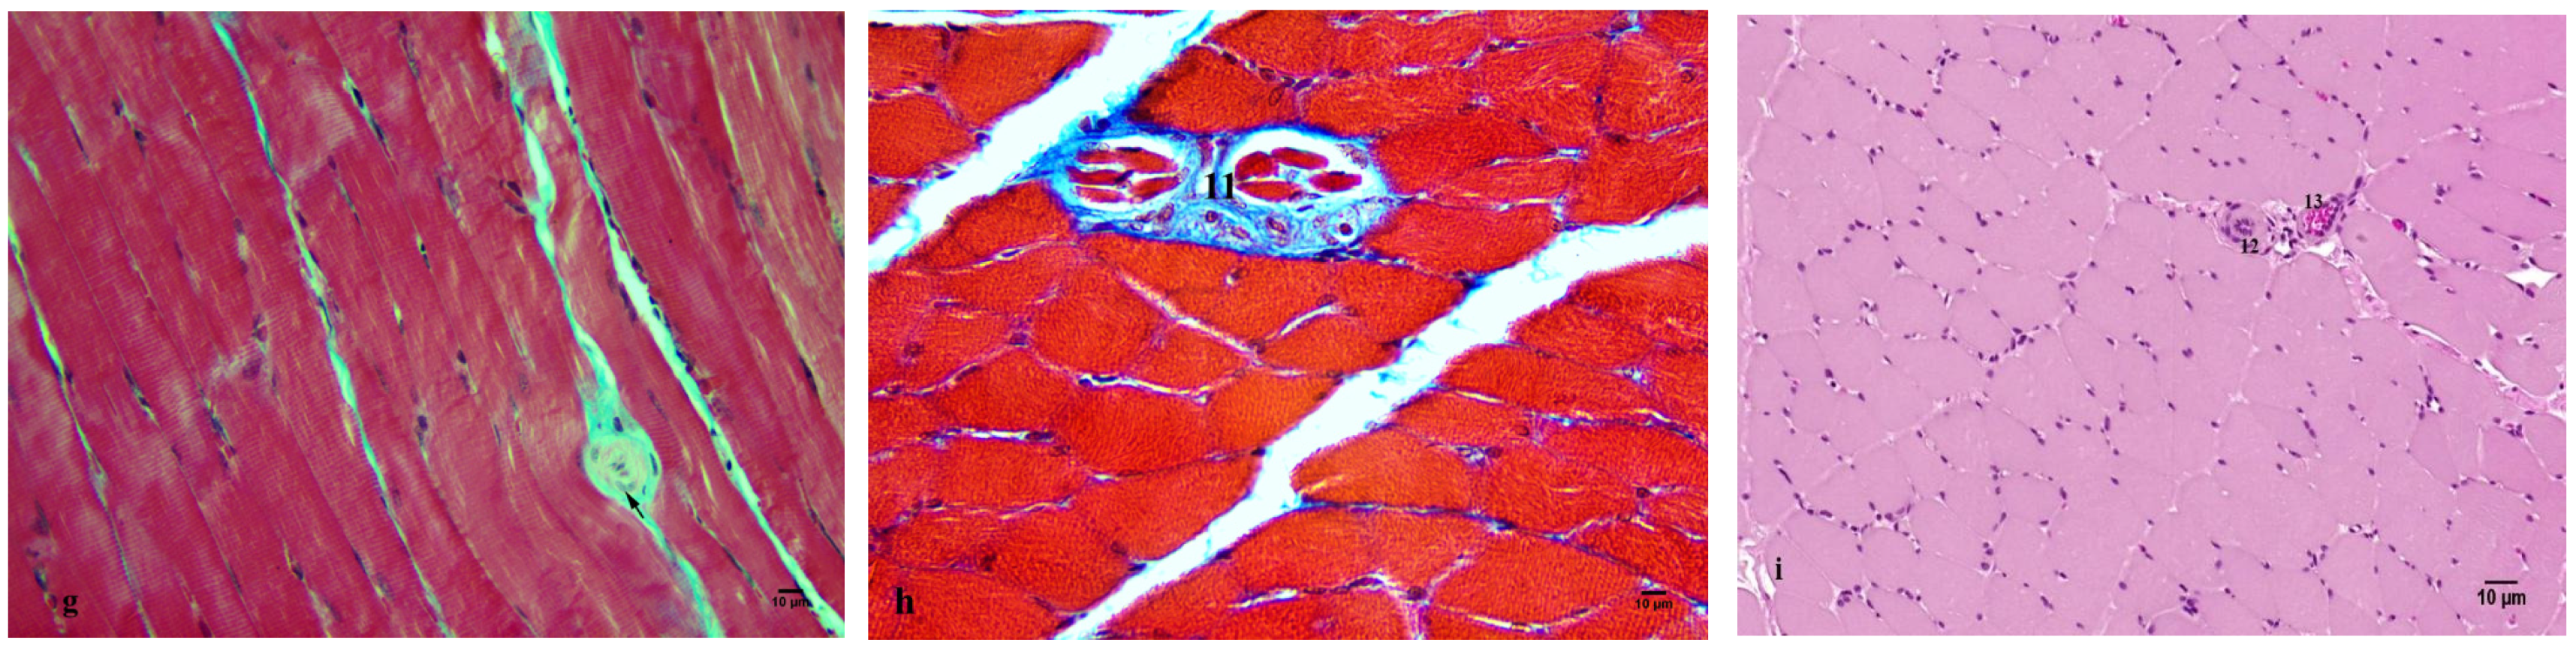
In Group 3 rats exposed to chronic immobilization stress, histological features of the masseter muscle did not differ significantly from those of the control group (
Figure 2g–i). In some regions, focal sequestration of individual muscle fibers was observed (
Figure 2h). Morphometric analysis showed that, under chronic immobilization stress, blood supply to the masseter muscle was impaired, as evidenced by an increased Vogenvort index in arterioles and capillaries compared to control values (
Figure 3a,b). However, these indices remained lower than those observed in Group 1 and Group 2. Additionally, capillary density per 0.1 mm
2 of muscle tissue cross-section was reduced 1.6-fold (
Figure 3d).
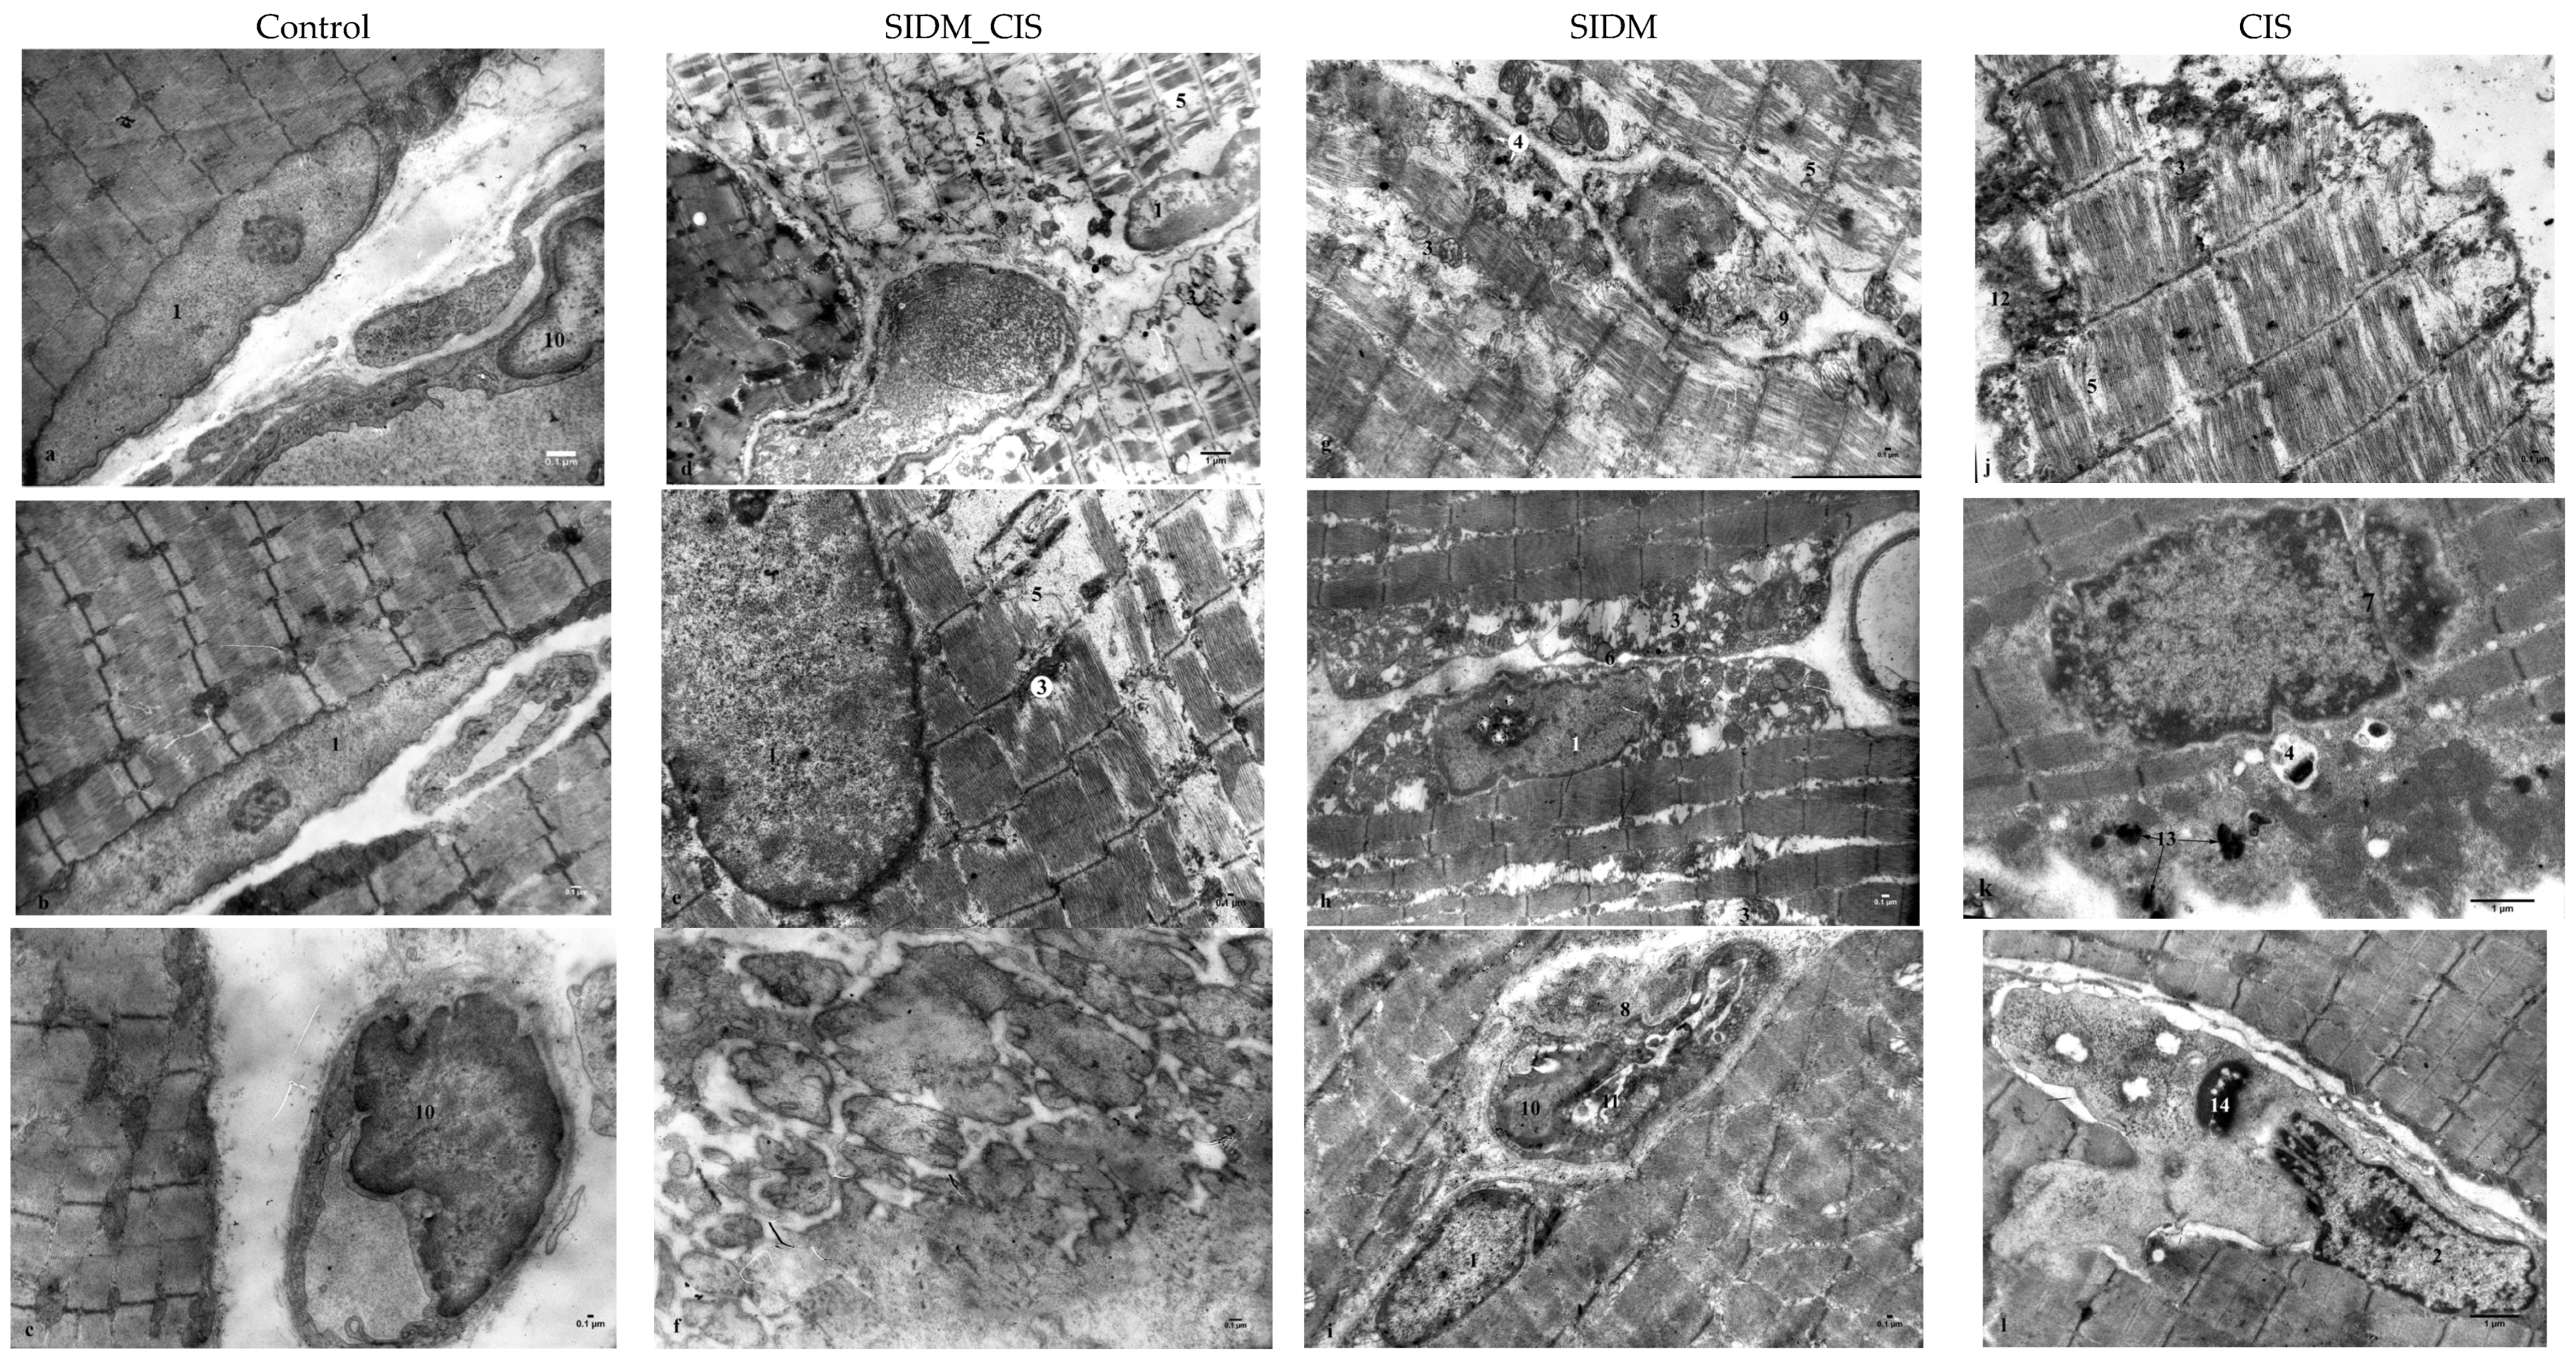
Transmission electron microscopy revealed that the masseter muscle of Group 1 rats displayed the most pronounced heterogeneous changes (
Figure 4d–f). Some muscle fibers underwent partial necrosis, characterized by the lysis of nuclei, myofibrils, and mitochondria (
Figure 4d). The sarcoplasm exhibited reduced electron density and contained widened intermyofibrillar spaces filled with sarcomeric remnants and structurally altered mitochondria. Autophagic vacuoles were observed in the sarcoplasm of adjacent fibers, suggesting a mixed mode of cell death in these muscle fibers. In some muscle fibers, the nuclei were preserved; however, the intermyofibrillar spaces appeared widened and contained atypical mitochondria, focally fragmented myofilaments, and structurally disrupted sarcomeres. Dilated sarcoplasmic reticulum cisternae were also observed which may indicate ferroptotic cell death in these fibers (
Figure 4e). In some muscle fibers, karyopyknosis was observed, characterized by a predominance of electron-dense heterochromatin along the inner surface of the nuclear envelope. In addition, fragmentation and partial destruction of mitochondrial cristae, including membrane rupture, as well as segmental myofibrillar contractures, were noted, indicating the development of necroptosis in these fibers. Focally, muscle fibers exhibited localized destruction with their replacement by collagen fibers (
Figure 4f).
In Group 2 rats, muscle fibers predominantly exhibited features of vacuolar dystrophy and liquefactive necrosis. In some fibers, giant subsarcolemmal mitochondrial aggregates containing severely damaged mitochondria, undergoing pronounced autolysis and swelling, were observed (
Figure 4h). In other fibers, intermyofibrillar and subsarcolemmal edema, myofibrillar lysis, mitochondrial vacuolization, and disruption of both the outer and inner mitochondrial membranes were seen (
Figure 4g). Despite pronounced destructive changes in muscle fibers of Group 1 and Group 2 rats, some fibers in the examined specimens retained intact ultrastructural organization (
Figure 4i).
In Group 3 rats, most muscle fibers exhibited features of ferroptosis (
Figure 4j), while others were undergoing necroptosis (
Figure 4k). In muscle fibers with preserved ultrastructure, the sarcoplasm contained primary and secondary lysosomes, occasional lipid droplets, and rosette-like glycogen aggregates, as seen in control rats. At sites of damaged muscle fibers, myosatellite cells appeared and subsequently differentiated into new fibers, indicating ongoing cellular regeneration. However, these myosatellite cells displayed destructive and degenerative changes that, in some cases, progressed to ballooning degeneration, necroptosis, or apoptosis (
Figure 4l).
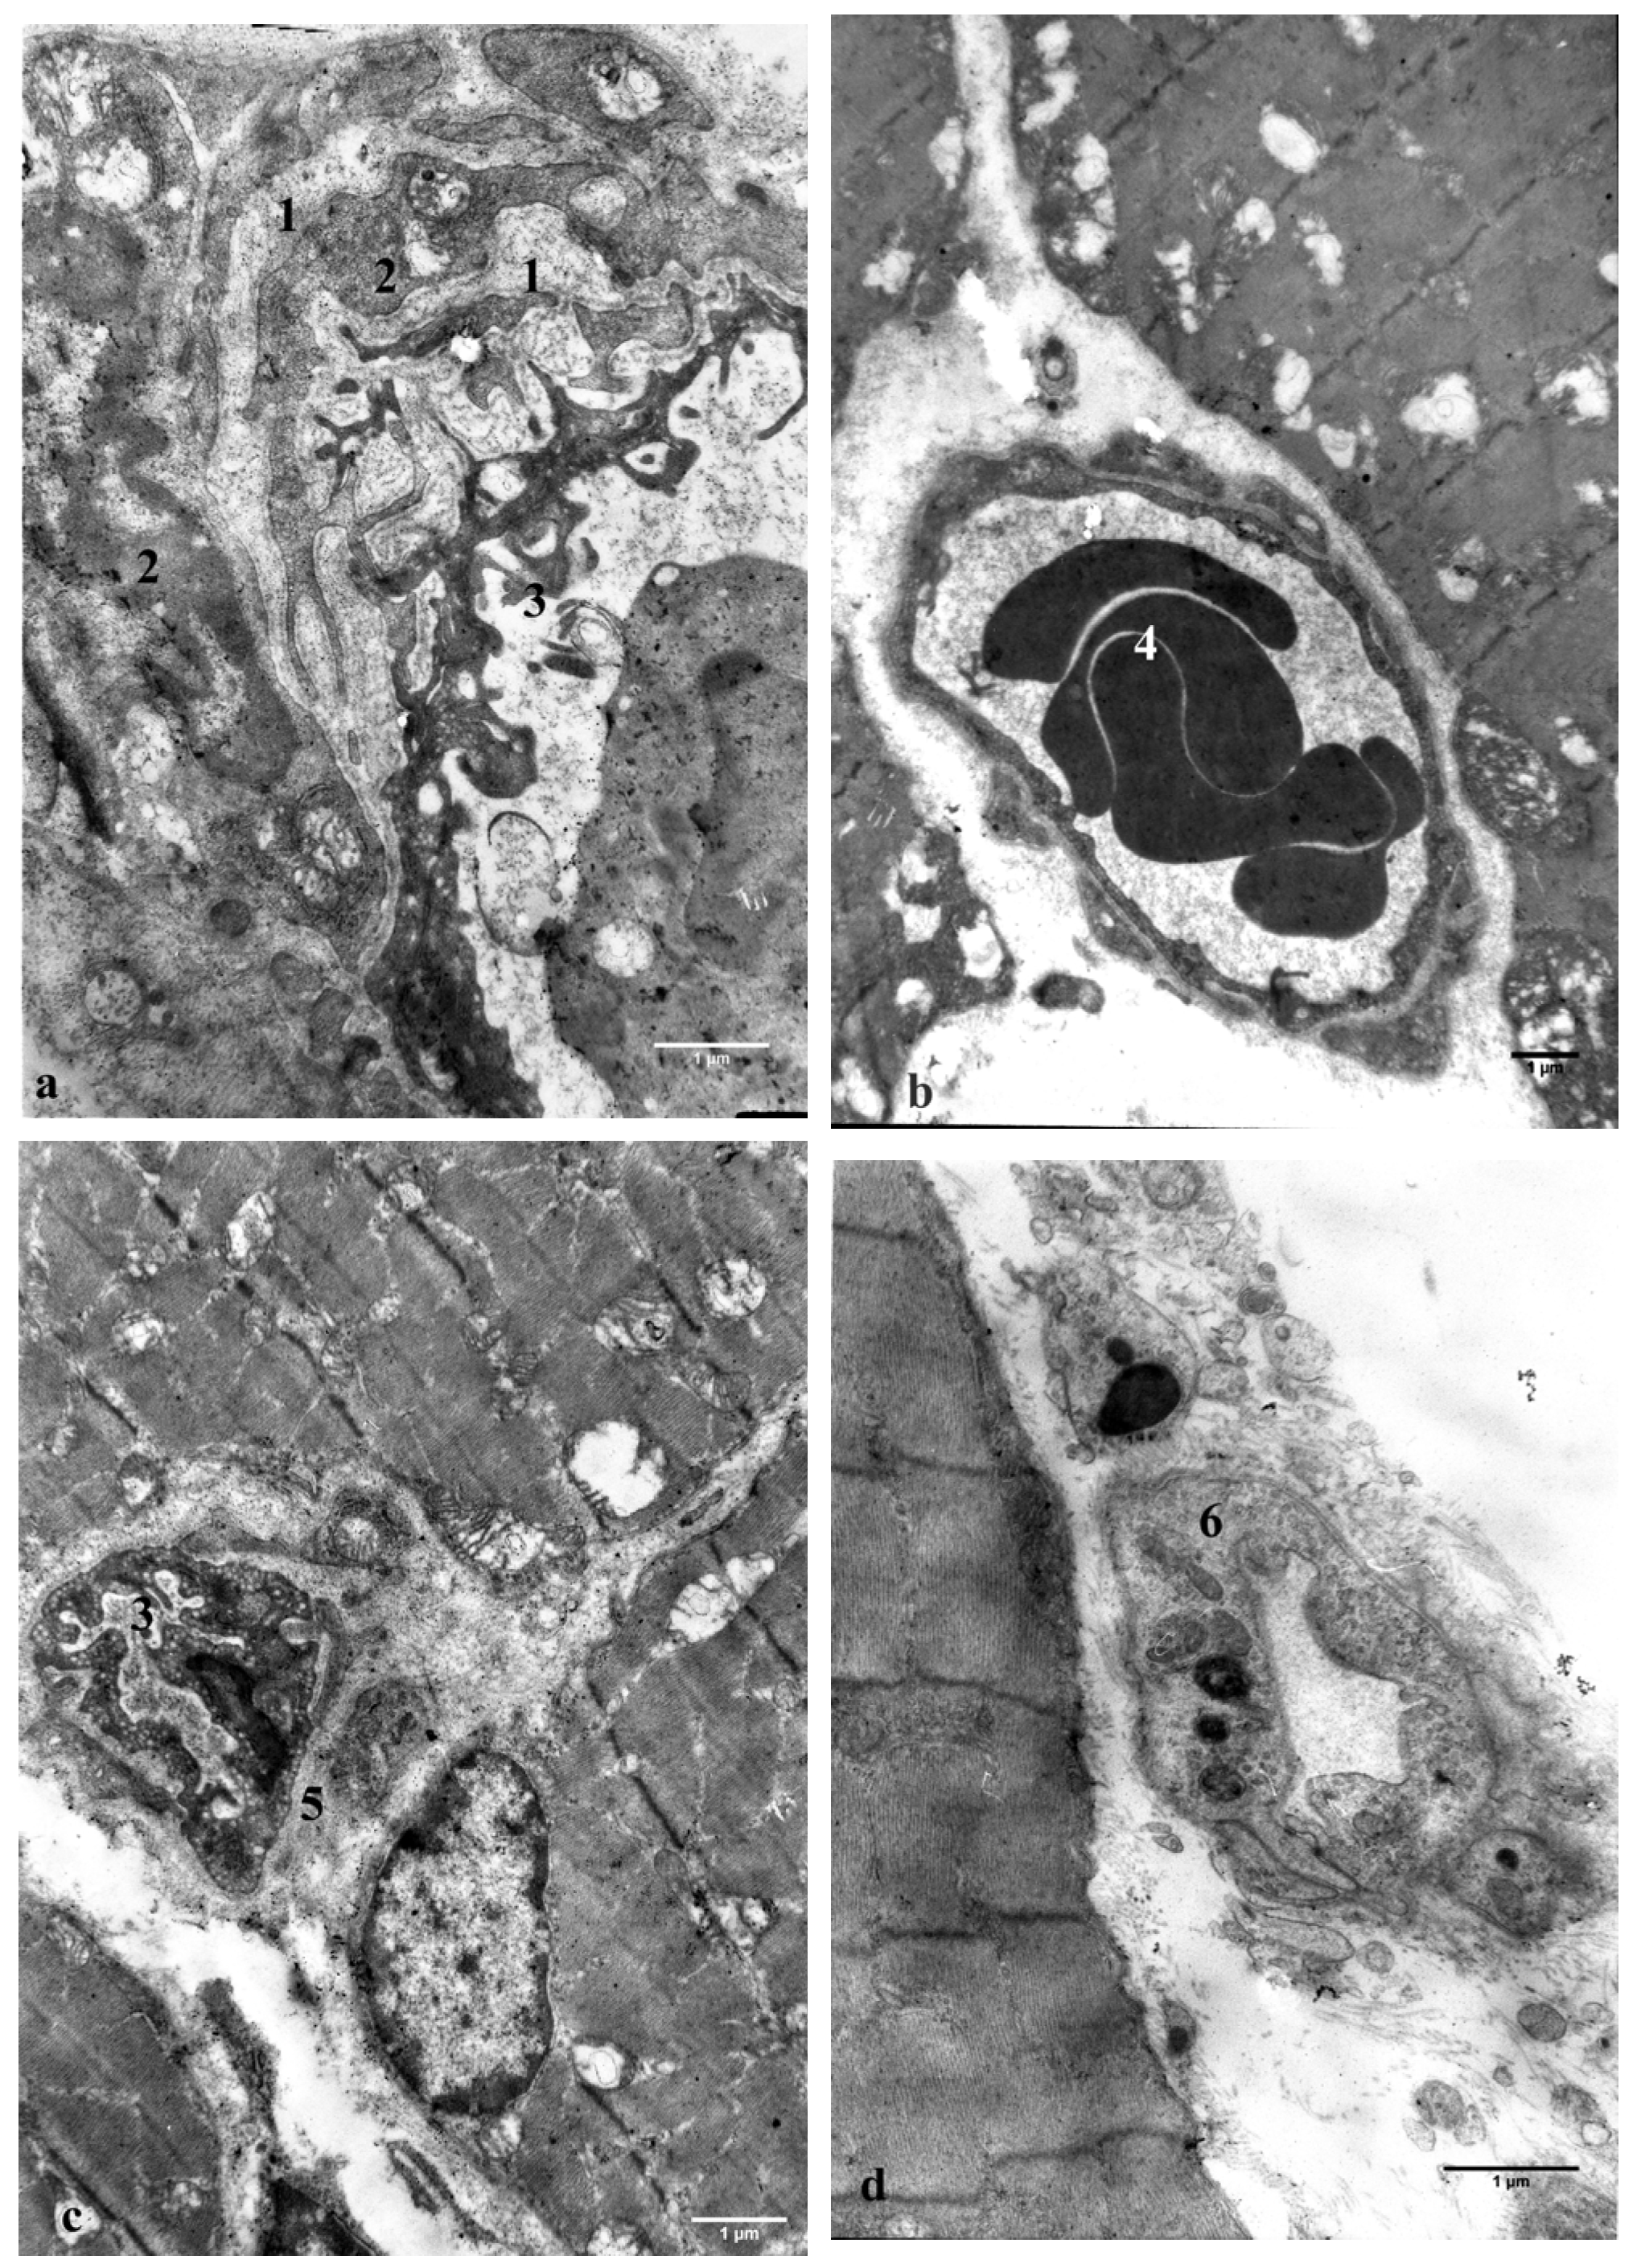
These changes in Group 1 and Group 2 rats occurred against the background of pronounced diabetic microangiopathy characterized ultrastructurally by hemorheological disturbances and destructive changes in the microvascular walls. The lumens of microcirculatory blood vessels showed erythrocyte sludges (
Figure 5b), microthrombi, platelet and erythrocyte adhesion to the endothelial luminal surface, and erythrocyte diapedesis into perivascular spaces. Vacuolar degeneration of myocytes and endothelial cells was evident in arterioles and venules. Endothelial cells exhibited increased cytoplasmic electron density, cytoplasmic vacuolization, and irregular protrusions of the luminal endothelial surface (
Figure 5a). Hyperglycemia induced intimal proliferation and hyalinization in arterioles (
Figure 5a). In capillaries, destructive and degenerative changes in endothelial cells led to micro- and macroclasmatosis (
Figure 5a,c) and, in some cases, to endothelial cell death (
Figure 4g). In blood capillaries, basement membrane proliferation formed discrete lamellae (
Figure 4i and
Figure 5c), a characteristic pathomorphological feature of diabetic microangiopathy. Some blood capillaries were transformed into plasma capillaries (
Figure 4i), with the lumens assuming a slit-like configuration and partially occluded by protrusions and detachments of the endothelial plasmalemma. Frequent desquamation of endothelial cells with exposed basement membranes was observed throughout the microvasculature, occasionally resulting in complete capillary wall destruction (
Figure 4g). Perivascular spaces were expanded by plasma infiltration and filled with collagen fibers and fibroblasts.
In Group 3 rats, blood flow through the microvascular network was preserved. However, most vessels exhibited thickening of the peripheral endothelial cells, resulting in lumen narrowing, as confirmed by morphometric analysis (
Figure 5d). An increase in plasma capillaries was also observed, and this ultrastructural remodeling of the microvasculature reflected a reduction in muscle perfusion compared to control values.
All experimental groups showed varying degrees of NMJ remodeling.
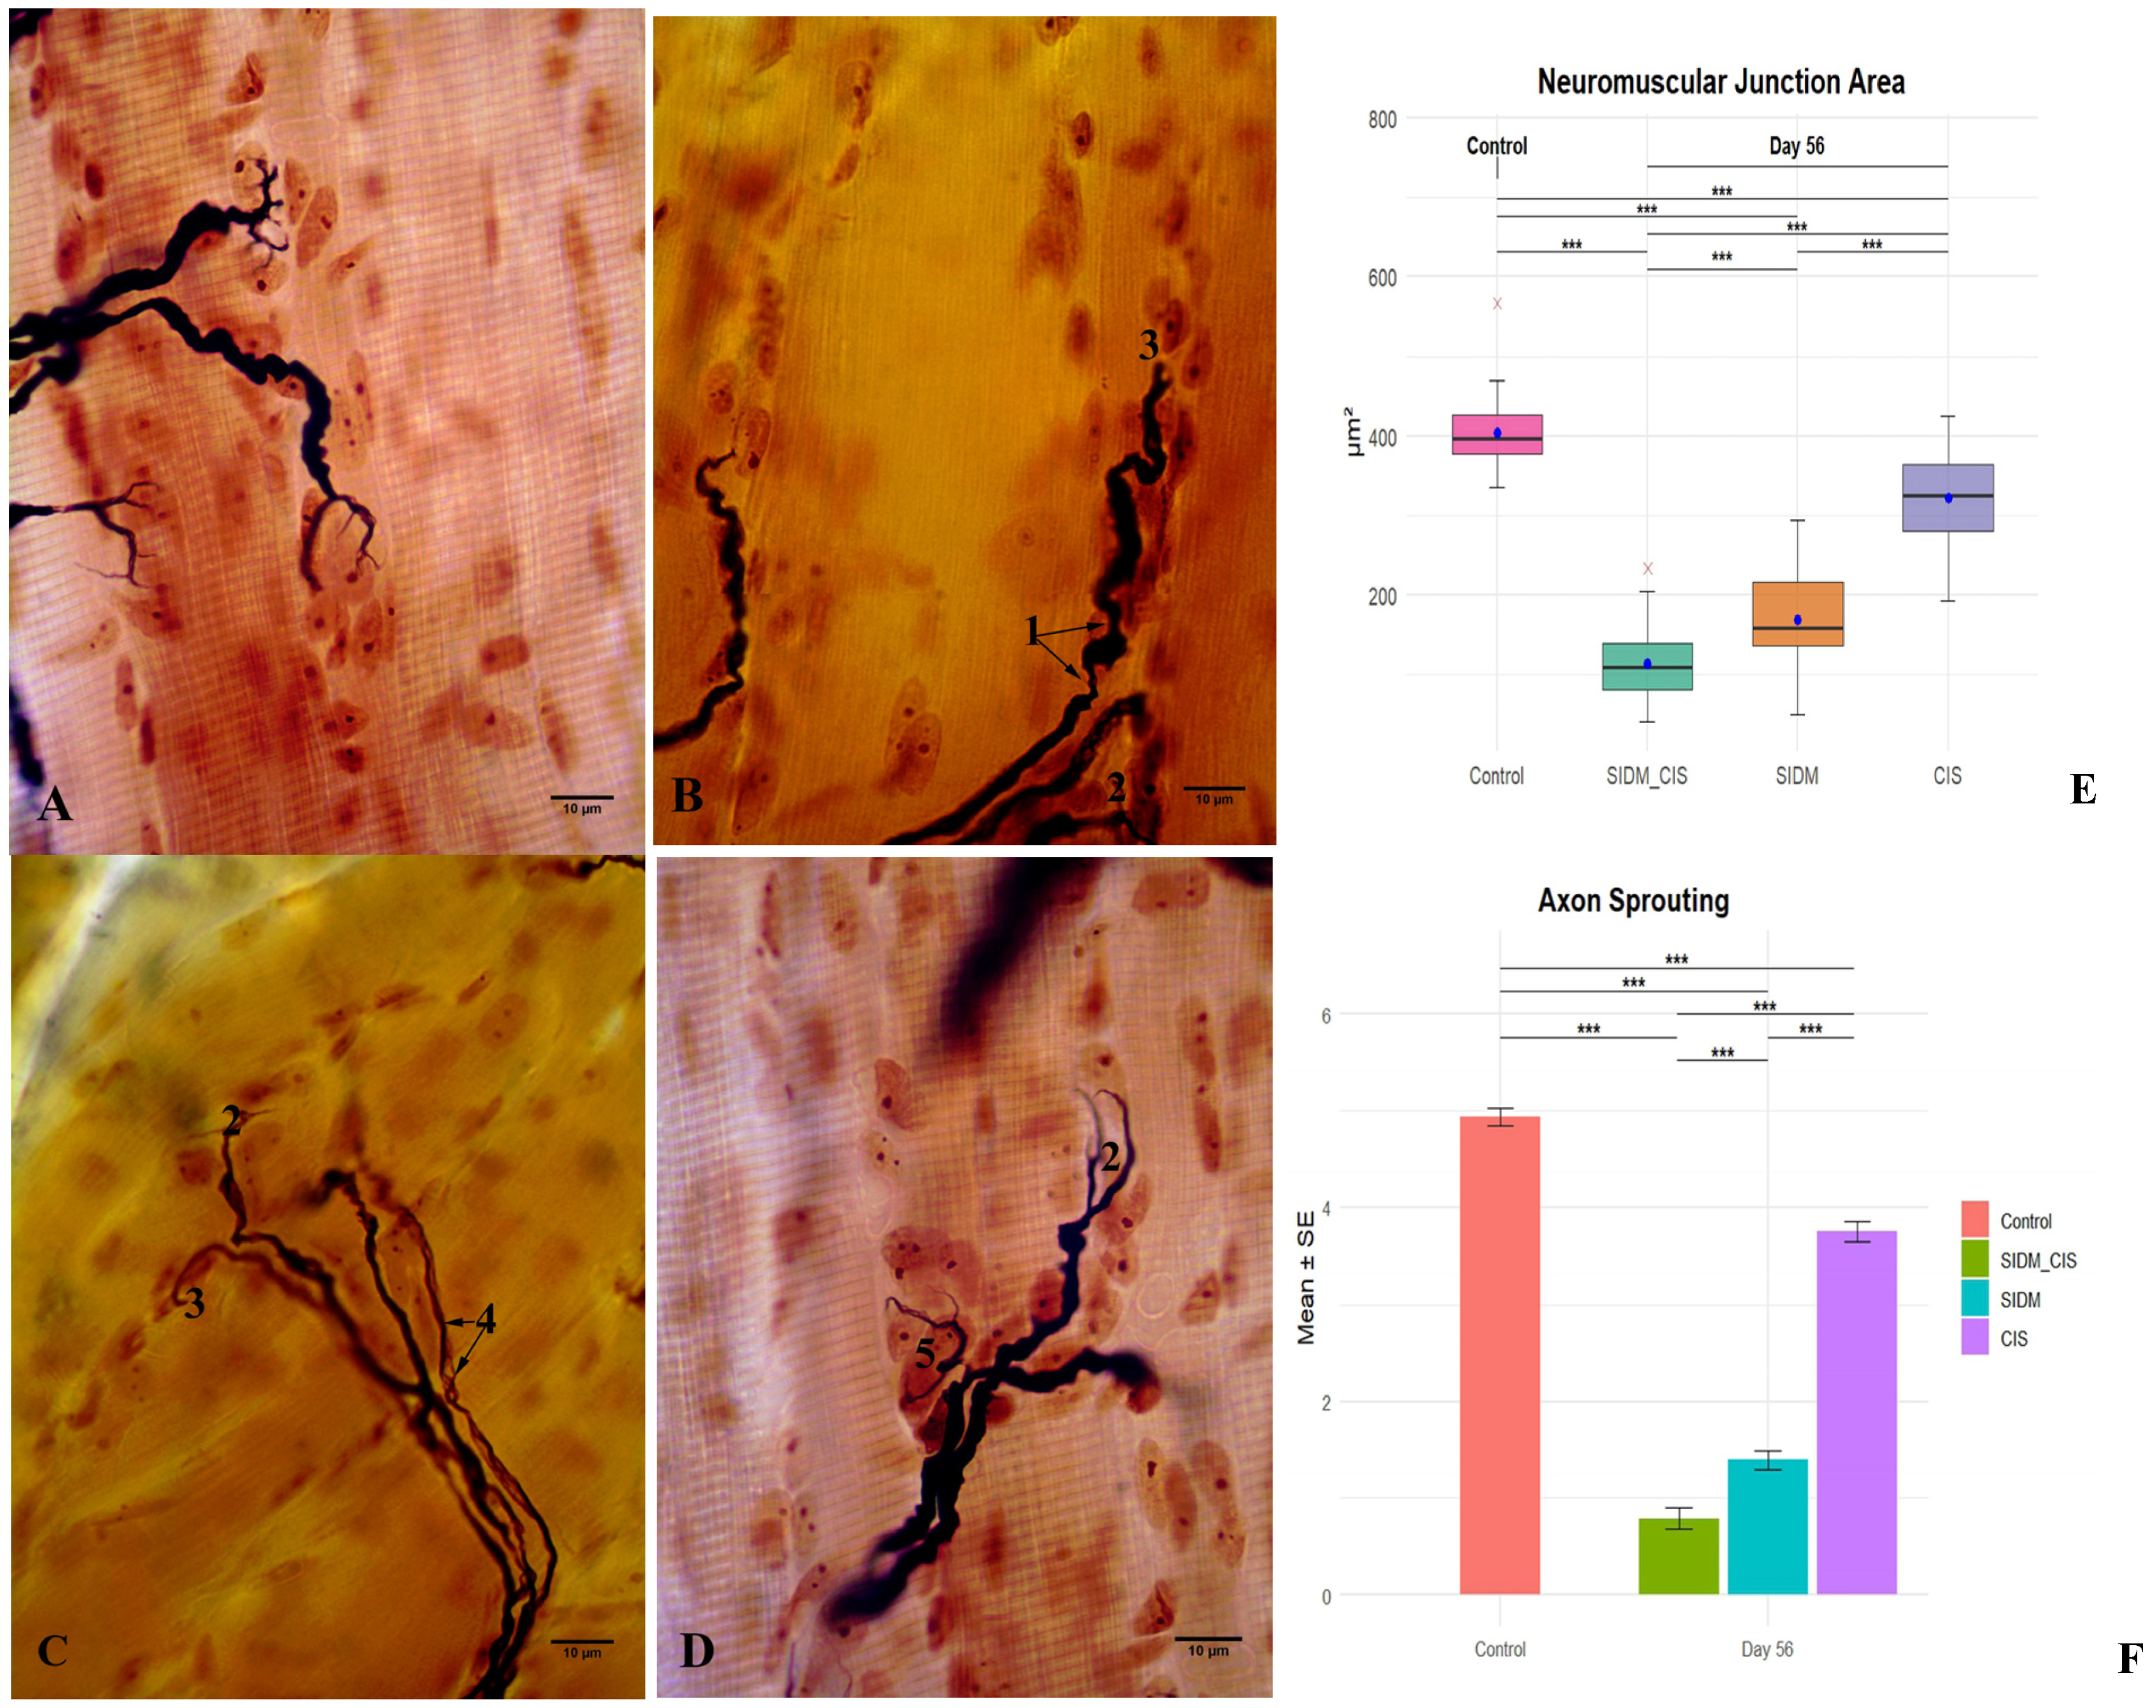
In the masseter muscle of Group 1 and Group 2 rats, silver impregnation revealed pronounced destructive changes in NMJs. Some NMSs degenerated completely, whereas others showed significantly reduced terminal axonal branching compared to controls (
Figure 6). Intramuscular myelinated nerve fibers (MNFs) showed pronounced degenerative changes. Some fibers terminated abruptly within muscle fibers without visible terminal axonal branching (
Figure 6B,C). In other MNFs, alternating regions of marked thickening and sharp thinning of the myelin sheath were observed over extended segments, suggestive of segmental demyelination (
Figure 6B). Moreover, some MNFs exhibited pronounced thinning and splitting of the myelin sheath over extended segments (
Figure 6C), suggesting damage to neurolemmocytes within nerve fibers and a potential attenuation of neuromuscular impulse transmission in the examined muscles. This NMJ remodeling, accompanied by extensive degeneration of terminal axonal branches, led to a significant reduction in axonal sprouting and NMJ area compared to control values, with the lowest values observed in Group 1 animals (
Figure 6E,F).
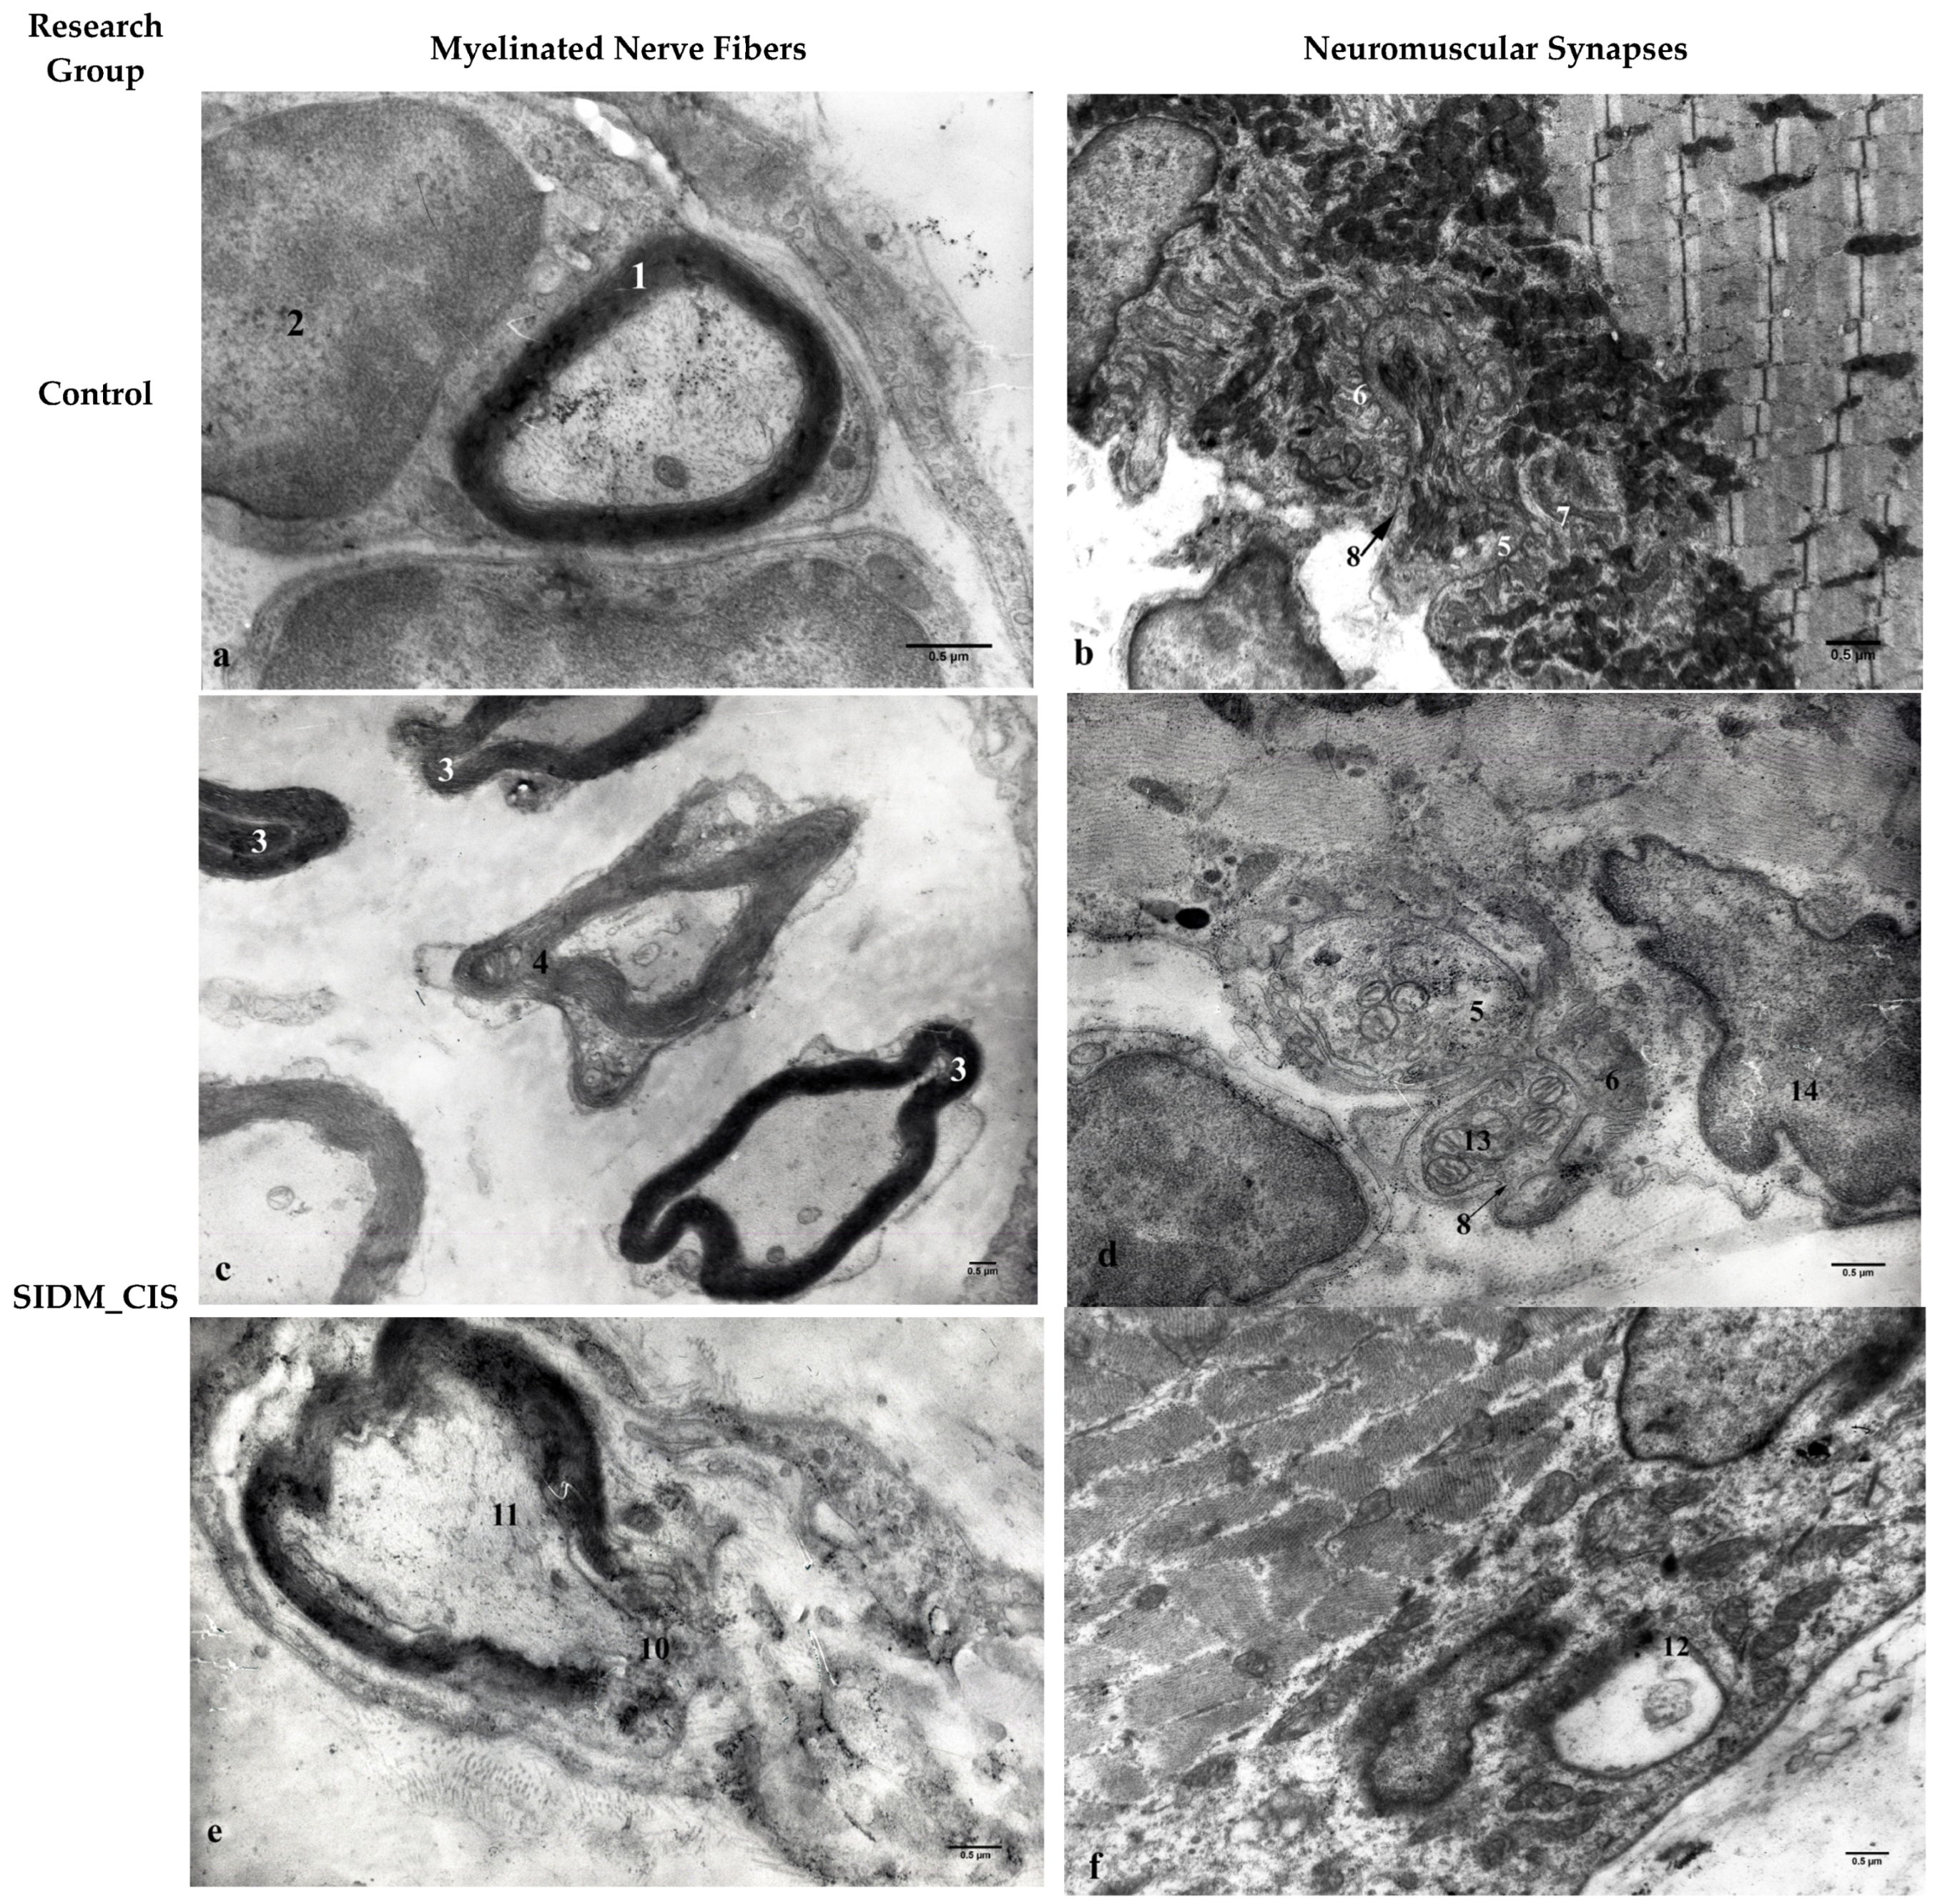
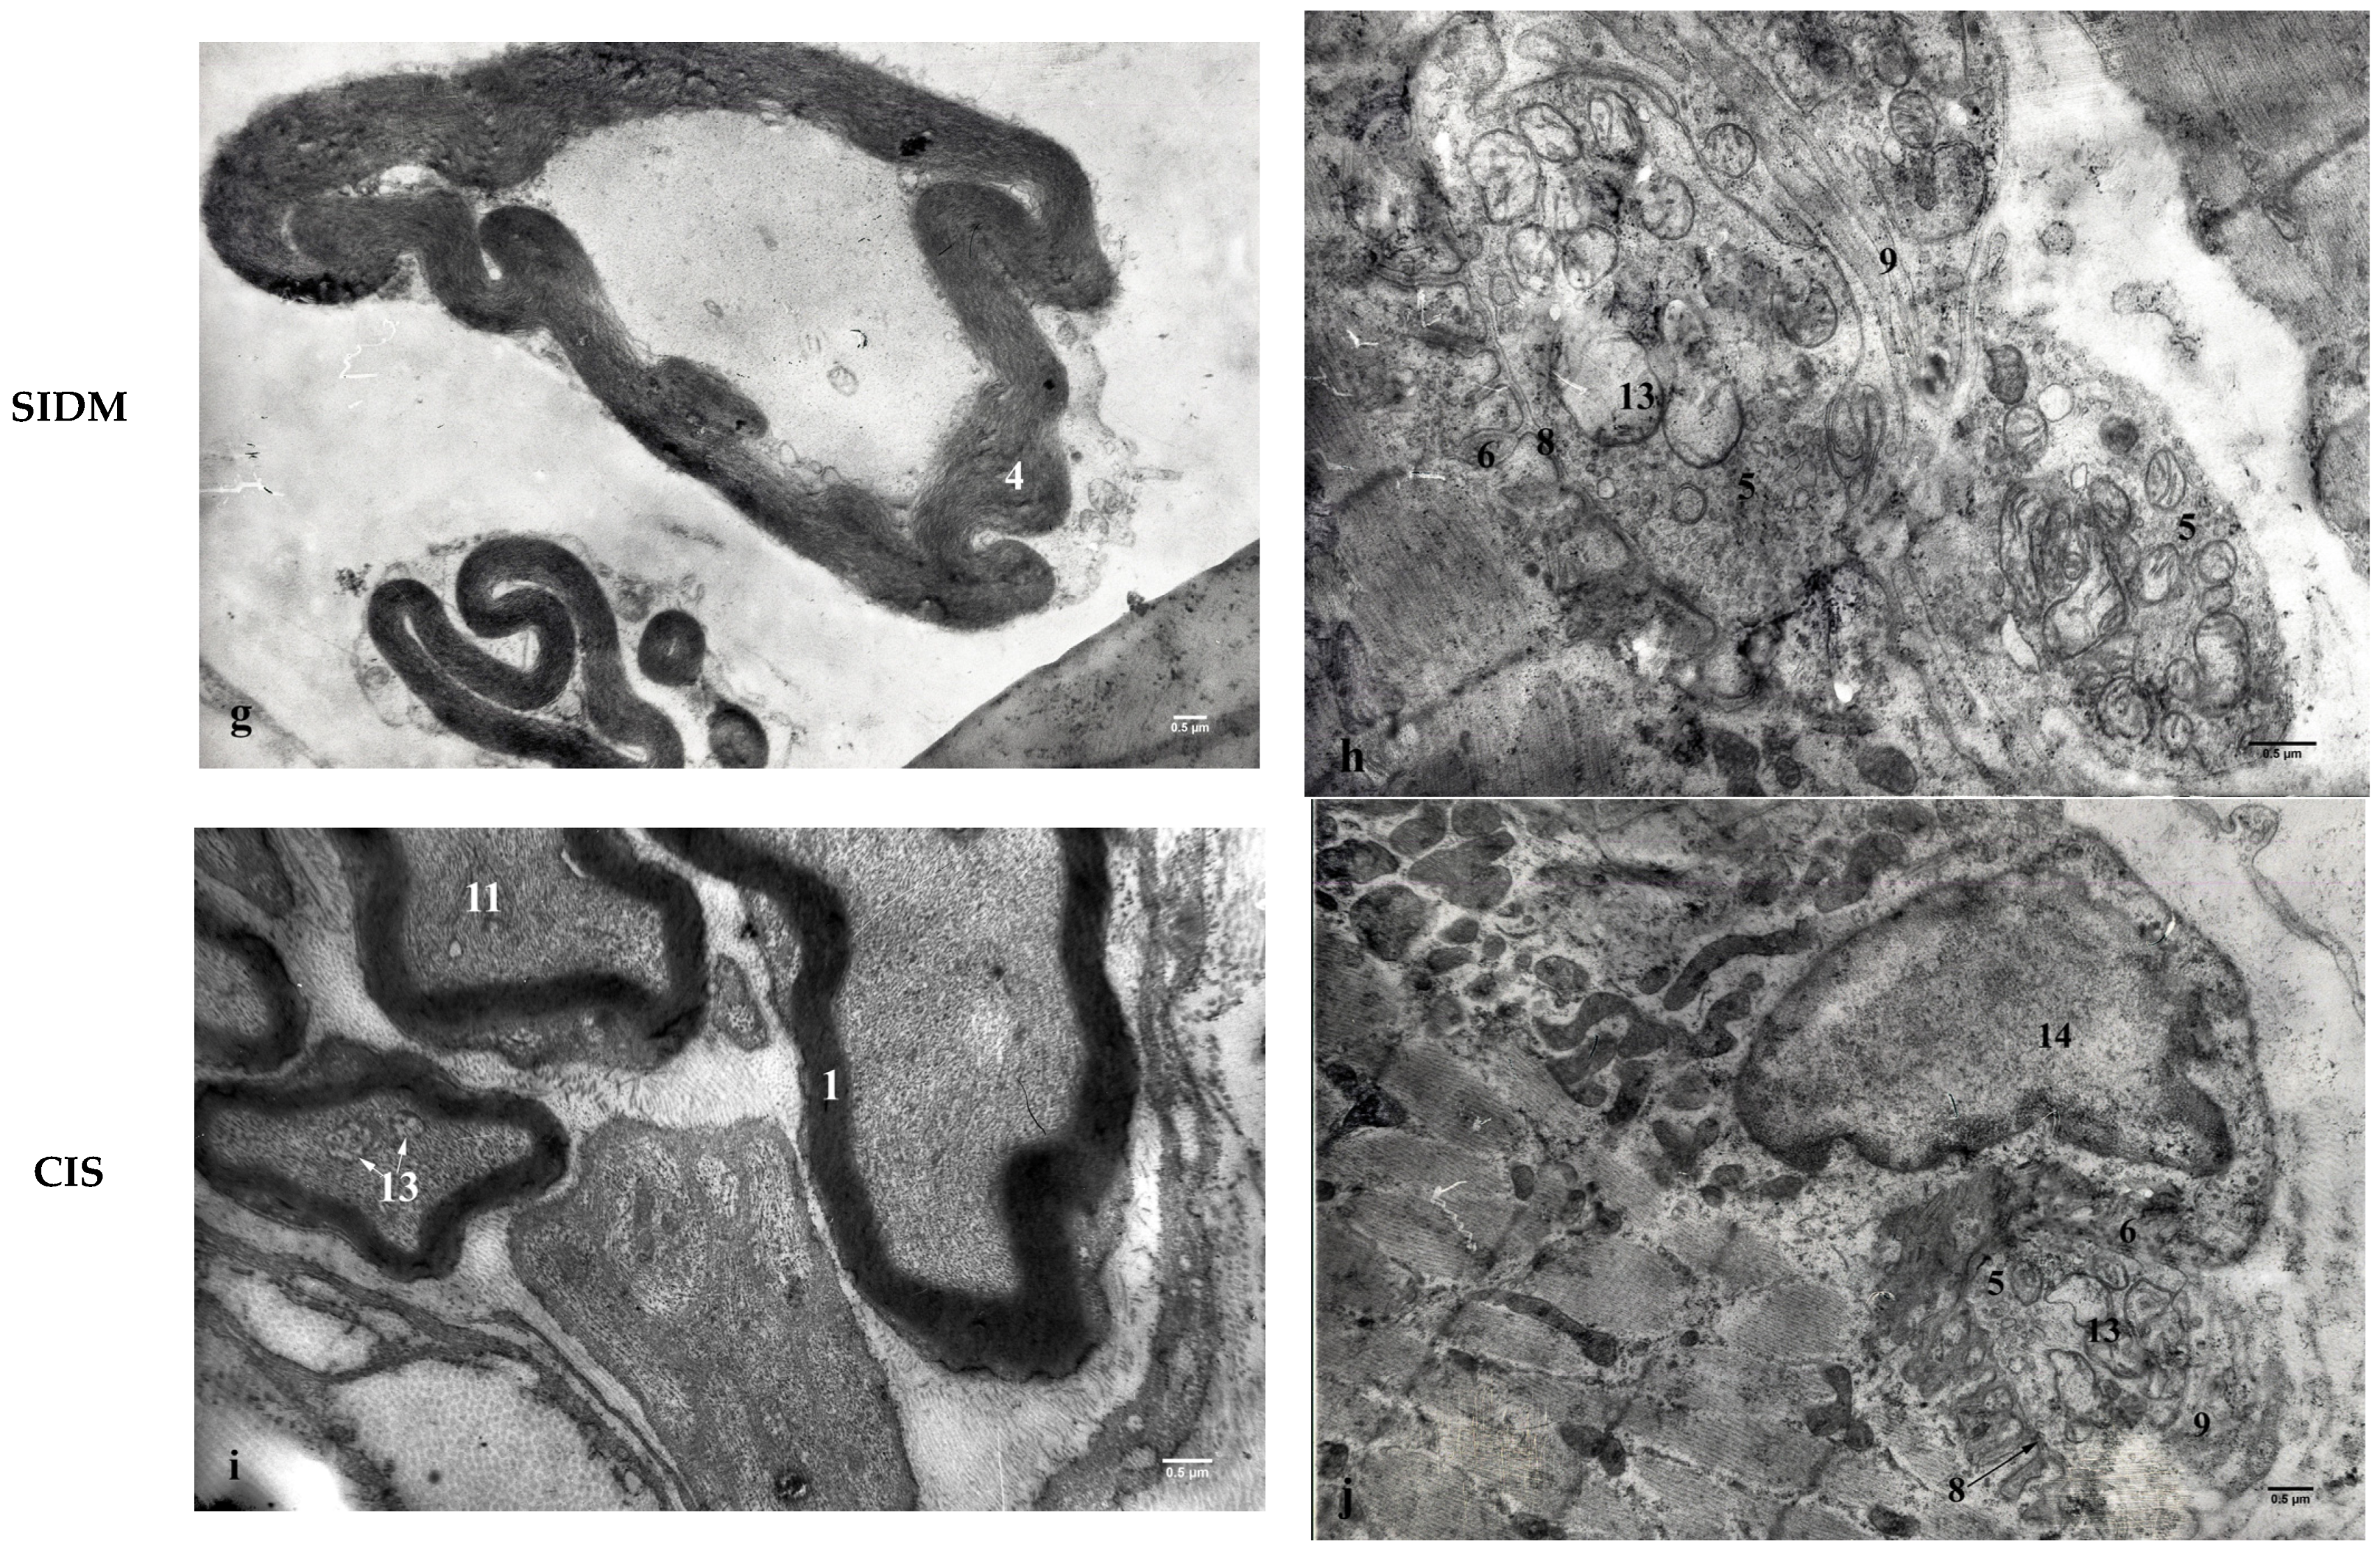
Group 1 and Group 2 rats developed diabetic axonopathy. The electron-lucent axoplasm contained mitochondria with partially or completely disrupted cristae, along with occasional neurofilaments and microtubules (
Figure 7c). In Group 1 and Group 2 rats, MNFs exhibited thickened myelin sheaths due to lamellar splitting. Moreover, the myelin sheath itself formed various protrusions and configurations (
Figure 7c,g) and, in some areas, was disrupted entirely (
Figure 7e). The periaxonal space was expanded and often contained crystalline inclusions. Neurolemmocytes exhibited destructive changes, including vacuolar dystrophy and liquefactive necroptosis, resulting in myelin sheath disruption and axonal exposure, which serve as ultrastructural markers of segmental demyelination in MNFs. Group 1 and Group 2 rats exhibited pronounced ultrastructural destructive changes in NMSs. In some NMSs, both the presynaptic and postsynaptic poles were reduced, with partial destruction of postsynaptic folds (
Figure 7d). In other NMSs, all components were identifiable, but the number of active zones decreased. Some NMSs showed isolated, fragmented, or destroyed postsynaptic folds (
Figure 7h), while in others, only remnants of axoplasmic components were visible due to complete synaptic destruction (
Figure 7f). Most NMSs exhibited axonopathic changes, including electron-lucent axoplasm devoid of neurofilaments and other inclusions, and mitochondria with partially or completely disrupted cristae forming vacuoles of variable size and shape (
Figure 7d,h). In some MNFs of Group 1 rats, axoplasmic regions devoid of synaptic vesicles were observed. In other NMSs, postsynaptic folds were destroyed, leaving only isolated pre- and postsynaptic membrane elements and no detectable active zones (
Figure 7f). A characteristic feature of NMSs at this stage of the experiment was the local widening of the synaptic cleft, within which processes of neurolemmocytes were observed (
Figure 7h). These profound, destructive changes in NMSs led to reductions in surface area by 65% in Group 1, 53% in Group 2, and 27% in Group 3 compared to control values (
Table 2). In the active zones of NMSs, the number of synaptic vesicles reduced significantly, mainly reflecting a reduction in both the number and surface area of postsynaptic folds that form these zones (
Table 2).
In Group 3 rats subjected to chronic immobilization stress, intramuscular MNFs showed varicose swellings of the myelin sheath, with numerous nuclei of terminal neurolemmocytes in their terminal branch regions (
Figure 6D). The number of terminal branches of the motor axon was reduced compared to controls; however, axonal sprouting remained the highest across all experimental groups (
Figure 6F). This NMJ remodeling resulted in a reduction in their area compared to control values (
Figure 6E). At the ultrastructural level, the myelin sheath of intramuscular MNFs remained structurally intact. The axoplasm showed increased electron-optical density due to a higher number of aggregated neurofilaments, accompanied by a reduction in microtubules (
Figure 7i). In some areas, the periaxonal space was expanded. Ultrastructural analysis indicated that, under chronic immobilization stress, NMSs exhibit moderate destructive and degenerative changes, primarily reflected in postsynaptic membrane remodeling, including the disintegration of postsynaptic folds and the loss of their secondary branches (
Figure 7j). In the subsynaptic zone, the number of subcellular elements, including ribosomes, polyribosomes, and rosette-like structures, decreased. Enlarged mitochondria with disintegrated cristae and a cleared matrix, myelin-like bodies, and axoplasmic depletion of synaptic vesicles were also observed (
Figure 7j). Postsynaptic membrane remodeling reduced both the number and area of postsynaptic membrane folds, accompanied by an increase in the interfold distance relative to control values (
Table 2). Within active zone regions, the number of synaptic vesicles was reduced, largely due to active zone shortening and enhanced fragmentation (
Table 2). Overall, the NMS area in this group of animals decreased by only 27% compared to control values and remained the largest across all experimental groups (
Table 2).
4. Discussion
DM is accompanied by neuroendocrine changes that disrupt skeletal muscle metabolism. The primary factor contributing to masseter muscle involvement is circulatory and hemic hypoxia due to diabetic microangiopathy, resulting in tissue hypoxia and impaired trophic support of muscle fibers [
24,
25]. Based on our findings, rats in Group 1 and Group 2 demonstrated a significant enlargement of arteriolar and capillary wall areas, accompanied by a reduction in luminal area. These structural changes led to a pronounced increase in the Vogenvort index, reflecting a several-fold decline in vessel patency. At the same time, the venular segment of the microcirculation dilated, as indicated by a statistically significant increase in luminal area. The opening of arteriolovenular anastomoses served as a compensatory mechanism, redirecting blood from the arterial to the venous circulation to maintain hemodynamic stability. Remodeling of the masseter muscle’s angioarchitecture resulted in a 55% reduction in capillary density per 0.1 mm
2 of muscle tissue cross-section in rats with comorbid pathology and a 41% reduction in rats with SIDM. Increased arteriola-to-venular shunting via arteriolovenular anastomoses reduces microcirculatory reserve and induces local acidosis, thereby promoting tissue hypoxia [
26]. These changes reduce the arteriovenous tissue oxygen gradient, impair transendothelial exchange, and disturb tissue oxidation–reduction processes, thereby adversely affecting metabolism in adjacent structures. In Group 1 and Group 2 rats, hemorheological disturbances in the microcirculation were closely associated with elevated HbA1c levels, leading to changes in erythrocyte surface charge and electrical and deformation properties of the plasmalemma. These changes promoted erythrocyte sludging, enhanced adhesion of the formed elements of blood, particularly erythrocytes and platelets, and facilitated microthrombus formation [
27]. According to our findings, this contributes to the formation of erythrocyte sludge and increased adhesion of erythrocytes and platelets to the luminal surface of endothelial cells and leads to the formation of microthrombi, which was clearly observed at the ultrastructural level by electron microscopy. Moreover, endothelial cell injury results in structural alterations of both the endothelial cells themselves and their plasmalemma, initiating the development of micro- and macroclasmatosis, which further impairs microcirculation and promotes the adhesion of blood cellular elements. Endothelial dysfunction in DM leads to an imbalance between vasodilators and vasoconstrictors, characterized by reduced production of prostacyclin I
2, endothelium-derived hyperpolarizing factor, and nitric oxide, accompanied by elevated endothelin, angiotensin II, and thromboxane A
2 levels [
20,
28]. The primary contributors to endothelial damage in DM are hyperglycemia, which triggers a cascade of mechanisms leading to endothelial cell senescence and death [
29], and activation of the sorbitol pathway of glucose metabolism via increased aldose reductase activity, resulting in intracellular sorbitol accumulation, endothelial cell swelling, and necrosis [
27,
30]. Furthermore, in DM, the microvasculature undergoes structural reorganization in response to disturbances in carbohydrate metabolism, manifesting as proliferative changes and intimal hyalinization of arterioles, which lead to persistent luminal narrowing [
30], as our morphometric data confirm. In chronic hyperglycemia, elevated glucosyltransferase activity promotes synthesis of glycoprotein components of the basement membrane, leading to its thickening and the formation of multilaminar plates, recognized as a morphological marker of diabetic microangiopathy [
24] and clearly evident in Groups 1 and 2.
We found that prolonged chronic immobilization stress induces microvascular rarefaction in the masseter muscle. These changes are mediated by several pathogenic mechanisms, primarily arteriolar spasm due to hypercortisolemia and vessel wall thickening resulting from increased angiotensin II production and angiotensin II-mediated hypertrophic responses [
31]. On the other hand, hypercortisolemia contributes to microvascular rarefaction and reduced capillary density by suppressing the expression of angiogenic factors, including VEGF and the endothelial marker CD31, and by increasing endothelial cell apoptosis [
32,
33,
34]. According to our findings, microcirculatory disturbances caused by arteriolar spasm and a 1.3-fold reduction in capillary density led to hypoxic damage of muscle fibers and NMJs in rats subjected to chronic immobilization stress. These changes were accompanied by muscle fiber atrophy; although the affected fibers exhibited the largest cross-sectional area across all experimental groups, they were significantly smaller than control values.
In DM, skeletal muscles undergo pronounced structural, functional, and metabolic changes, including muscle fiber atrophy, altered myokine secretion, mitochondrial structural and bioenergetic dysfunction, shifts in muscle fiber type composition, and reduced oxidative enzyme activity. Collectively, these changes result in reduced muscle strength, impaired functional capacity, and diabetic myopathy [
35].
Experimental studies in an SIDM rat model have demonstrated increased intramyocellular lipid accumulation associated with reduced activity of citrate synthase, β-hydroxyacyl-CoA dehydrogenase, cytochrome oxidase, and 3-hydroxybutyrate dehydrogenase [
36,
37]. Our ultrastructural analysis corroborated these findings, revealing lipid inclusions within muscle fibers. Another detrimental consequence of DM is protein glycation under hyperglycemic conditions, which can alter protein structure. Subsequent oxidative reactions generate advanced glycation end products (AGEs) [
38], which primarily damage type II fast-twitch myosin fibers and promote their atrophy.
Furthermore, oxidative stress in DM promotes the development of diabetic myopathy by upregulating atrophy-related genes, including MuRF-1 and atrogin-1, while downregulating genes involved in muscle growth in rats with SIDM [
39]. Russell et al. demonstrated that hyperglycemia induces protein degradation and suppresses protein synthesis in myotubes in vitro via activation of caspase-3/-8 and PKR [
40]. At the ultrastructural level, we observed destructive changes in myoblasts, suggesting impaired muscle fiber regeneration.
In type 1 DM, including SIDM, insulin deficiency has been shown to induce protein degradation via the canonical ubiquitin-proteasome pathway and to cause skeletal muscle atrophy [
16].
Another potential mechanism by which hyperglycemia may adversely affect skeletal muscles is the activation of the polyol pathway of glucose metabolism, which promotes tissue damage by impairing cellular defenses against oxidative stress [
39]. The key enzyme in this pathway, aldose reductase, is activated by hyperglycemia, leading to the accumulation of sorbitol and its associated metabolites. In rats with SIDM, we observed muscle fiber death characterized by coagulative and partial necrosis, driven by polyol pathway activation, oxidative stress, and autophagy. The latter is closely associated with mitochondrial dysfunction. Notably, in Group 1 and Group 2 rats, mitochondria were the first organelles to exhibit destructive changes. We observed disintegration and disruption of the inner mitochondrial membrane, vacuolar degeneration, and transformation of mitochondria into vacuoles, along with an overall increase in mitochondrial number, including subsarcolemmal mitochondria within muscle fibers. For the first time, we investigated, described, and provided a comparative characterization of muscle fibers under comorbid conditions, specifically DM and stress. In Group 1 rats, changes in muscle fibers, NMJs, and microcirculatory segments were more pronounced than in the other experimental groups. First, impaired insulin signaling, mitochondrial dysfunction, and altered protein metabolism in skeletal muscle are hallmarks of DM and are closely linked to mitophagy [
41]. Second, hyperglycemia activates mitogen-activated protein kinase p38 (MAPKp38), extracellular signal-regulated kinase (ERK), and c-Jun N-terminal kinase (JNK) via increased oxidative stress and reactive oxygen species (ROS) production [
42]. Consequently, oxidative stress induces autophagy in rat skeletal muscle by activating the ROS-ERK/JNK-p53 signaling pathway [
43]. These changes result in muscle fiber necrosis and activate mitochondrial cytochrome oxidase, along with molecular alterations within the fibers, potentially triggering apoptosis and ferroptosis, as observed under conditions of stress and comorbid pathology [
44,
45].
Moreover, mitochondrial dysfunction and PGC-1α downregulation have been shown to play a central role in skeletal muscle atrophy [
46]. Experimental models of hindlimb immobilization have demonstrated that deficiencies in PGC-1α and mitochondrial fusion proteins are key contributors to the atrophy of type IIb fast-twitch muscle fibers [
46,
47]. We hypothesize that muscle fiber atrophy under chronic immobilization stress is mediated by mitochondrial dysfunction and partial denervation of these muscles, resulting from neurodegenerative changes in NMJs and NMSs. Recent studies by Chibalin et al. have demonstrated that even short-term immobilization (6–12 h) reduces the endplate area in the rat soleus muscle [
48]. At the same time, profound metabolic changes disrupted NMJ homeostasis [
49]. In our study, during muscle immobilization, intramuscular MNFs exhibited peripheral axonopathy, characterized by impaired axonal transport, as evidenced by neurofilament aggregation within the axoplasm and a concurrent reduction in microtubule content. Disuse-mediated damage may also affect motor neurons, which release axonal components, including light and heavy neurofilaments, into the extracellular space [
49]. A mouse model of immobilization demonstrates that axonal damage and neuronal death lead to the release of neurofilaments into the circulation [
50]. Moreover, serum neurofilaments serve as biomarkers of peripheral axonal damage associated with atrophy and impaired neuromuscular transmission following immobilization [
51].
The composition of the sarcolemma plays a critical role in stabilizing the molecular components of NMJs. Disruption of lipid rafts (plasma membrane microdomains) and inhibition of the Na
+/K
+-ATPase α2 isoform have been shown to destroy the postsynaptic membrane at NMSs and destabilize AChR, rapsyn, MuSK, and Src-family kinases during immobilization in rodents. Thus, the composition of the sarcolemma is among the earliest myocellular processes altered during disuse, apparently facilitating skeletal muscle fiber adaptation to inactivity and the redistribution of molecular components [
52]. We observed a reduction in the number of active zones within the postsynaptic membrane of NMSs in rats subjected to prolonged immobilization. This was associated with fewer and smaller postsynaptic folds, thereby reducing the number of synaptic vesicles in NMSs and impairing neuromuscular transmission.
Regarding NMJ remodeling in DM, we observed axonopathy in both intramuscular MNFs and NMJs in Group 1 and Group 2. In the intramuscular nerve fibers, features of peripheral diabetic neuropathy were evident, including segmental demyelination along the MNFs, homogenization and varicose thickening of the myelin sheath, a reduction in NMJ area, and sprouting of terminal axonal branches. Diabetic peripheral neuropathy primarily arises from metabolic and vascular disturbances associated with DM. In our study, hemorheological changes and reduced capillary density in the masseter muscle led to hypoxia of MNFs and NMJs. Metabolic disturbances also play a fundamental role in the development of diabetic peripheral neuropathy. The accumulation of polyols, particularly sorbitol, in peripheral nerves due to aldose reductase activation leads to depletion of axonal myo-inositol, changes in protein kinase C subunits, and dysfunction of Na
+/K
+-ATPase activity. Dysregulation of Na
+/K
+-ATPase is associated with increased intra-axonal Na
+ concentrations, which slow nerve impulse conduction velocity and serve as an early marker of diabetic peripheral neuropathy [
53]. Moreover, the polyol pathway of glucose metabolism in DM induces neurolemmocyte damage and death [
54], which, in our study, appeared as segmental demyelination and myelin sheath thickening and disruption in MNFs. Furthermore, hyperglycemia induces oxidative stress in neurons, increases intra-axonal accumulation of AGEs [
53], and disrupts neuronal interactions with neurotrophic factors [
55], ultimately leading to neuronal death and neurogenic muscle atrophy from denervation [
56].
Insulin deficiency in DM leads to acute glucose deprivation in neurons and muscle fibers, consequently impairing the synthesis and release of the synaptic neurotransmitter acetylcholine from axonal terminals [
57]. Conduction changes at the NMJ are associated with impaired function of presynaptic Ca
2+ channels. In diabetic rats, elevated basal myocellular Ca
2+ levels may reduce Ca
2+ release from the sarcoplasmic reticulum during muscle contraction [
58]. At the NMS, we observed a reduction in synaptic vesicle number and remodeling of the pre- and postsynaptic membranes. Some authors have reported compensatory processes in the temporal muscle of peripubertal rats with SIDM, including reinnervation, neoangiogenesis, and intracellular regenerative events within muscle fibers [
23]. In our study, rats with SIDM developed intracellular regenerative processes within muscle fibers, as evidenced by nascent mitochondria and myoblast differentiation into muscle fibers. However, no reinnervation and neoangiogenic processes were observed in rats with comorbid pathology. Furthermore, in these animals, myoblasts differentiating into muscle fibers exhibited destructive changes even at this stage.
In contrast to immobilization stress-induced diabetic myopathy, diabetic axonopathy is characterized morphologically by reduced axoplasmic electron density, partial or complete destruction of membranous organelles, reduced neurofibrils, neurotubules, and synaptic vesicles, and the presence of myelin-like bodies. The postsynaptic membrane undergoes the most pronounced remodeling, including destruction of its folds, indicative of peripheral diabetic neuropathy and partial muscle fiber denervation, which can lead to masseter muscle atrophy.




 ,
,