Article

Comparing Classifications from Multiple Variant Annotation Software Solutions Using Real-World Next Generation Sequencing Data from Oncology Testing

1
Protean BioDiagnostics, 6555 Sanger Rd. #260, Orlando, FL 32827, USA
2
Roche Diagnostics Solutions, 2881 Scott Blvd., Santa Clara, CA 95050, USA
*
Authors to whom correspondence should be addressed.
These authors contributed equally to this work.
J. Mol. Pathol. 2024, 5(1), 81-95; https://doi.org/10.3390/jmp5010006
Submission received: 12 January 2024 / Revised: 23 February 2024 / Accepted: 27 February 2024 / Published: 1 March 2024

Abstract

:
Variant annotation is an important step in deciphering the functional impact of genomic variants and their association with diseases. In this study, we analyzed 80 pan-cancer cases that underwent comprehensive genomic testing and compared the auto-classified variant tiers among four globally-available software solutions for variant interpretation from Roche, SOPHiA GENETICS, QIAGEN, and Genoox. The results revealed striking differences in tier classifications, which are believed to be a result of several factors, including subjectivity in the AMP/ASCO/CAP guidelines, threshold settings for variant allele frequencies and population allele frequencies, as well as variation in disease ontologies. Although the software tools described here provide a time-saving and repeatable process for interpretation of genomic data, it is crucial to understand the nuances and various settings for these solutions, as they can strongly influence variant tier classifications and downstream management.

1. Introduction

Next generation sequencing (NGS) has globally revolutionized the field of genomics and bioinformatics. Whether addressing whole genomes, whole exomes, or targeted regions, the ability to sequence millions of DNA fragments in a single run at a relatively low cost per base has harbored great appeal to clinicians and researchers. NGS has been transformative by providing a more comprehensive and efficient way to analyze genetic information, leading to new insights and applications across various disciplines. Targeted panels, specifically, have generated interest due to quicker turnaround time, cost effectiveness, and increased coverage depth compared to whole exome sequencing (WES) and whole genome sequencing (WGS) [1]. This allows for querying specific genes of significance with high accuracy in variant detection. Although WES and WGS have their own select advantages depending on the application, targeted panels have practical implications in specific areas of disease management.
The results of NGS are designed to output a multitude of variants from the genes of interest, with a common goal of understanding the significance of each variant with respect to disease. To achieve this goal, steps are needed to ensure accurate and comprehensive variant annotation. Bioinformatic analysis and interpretation of variants have been proven to be non-trivial based on multiple factors, including number and complexity of variants, conflicting literature, and varying classification methods. In an effort to mitigate these complexities and standardize these processes, several international professional societies have published classification guidelines for the interpretation and reporting of genomic variants [2]. For classification of variants, the most notable international guidelines include AMP/ASCO/CAP (Association for Molecular Pathology/American Society of Clinical Oncology/College of American Pathologists), ESCAT (ESMO Scale of Clinical Actionability for molecular Targets), and ACMG/AMP (American College of Medical Genetics/Association for Molecular Pathology) guidelines [3,4,5]. All of these guidelines employ different evidence frameworks to answer different questions. In the AMP/ASCO/CAP guidelines, a tiering system (Tiers I-IV) is employed to categorize variants by the evidence supporting their “diagnostic, prognostic, or therapeutic significance” [3]. In the ESCAT guidelines, a tiering system of 6 tiers ranks variants by evidence supporting “clinical actionability” [4]. In the ACMG/AMP guidelines, variants are classified across five categories of functional pathogenicity [5]. Oftentimes, one or more of these classification frameworks are implemented in laboratories running NGS, as well as in some commercial and non-commercial variant annotator software solutions.
In this study, we analyzed and compared variant classification differences among four different variant annotator software tools: navify® Mutation Profiler (Roche; Santa Clara, CA, USA; RUO*), SOPHIA DDMTM (SOPHiA GENETICS; Boston, MA, USA; RUO in the USA), QIAGEN® (Hilden, Germany) Clinical Insights Interpret (QIAGEN; RUO), and Franklin (Genoox, Tel Aviv, Israel), a free, publicly-available annotator. By examining the differences in variant tier assignments and the underlying criteria employed by these tools, we aim to show the nuances of somatic variant interpretation and offer potential reasons for tier classification differences across the solutions, which, in turn, may help researchers select the most appropriate tertiary analysis software solution for their specific needs.

2. Materials and Methods

2.1. Data Generation and Processing

Formalin fixed paraffin embedded (FFPE) tumor samples were obtained from 80 pan-cancer cases. These were consecutive cases collected over a 12-month period, selected based on high-quality data passing standard quality control (QC) metrics, with no preference for specific cancer types. Tumor specimens underwent processing using the TruSight Oncology 500 (TSO500) assay [6], a targeted panel comprising 523 DNA genes and 55 RNA genes with relevance in cancer. The resulting sequencing files from TSO500 were analyzed using four different commercial software annotators: navify® Mutation Profiler (v. 2.3.2.c090e09), SOPHIA DDM™ (v. 5.10.42.1—h275027-1c0c57f), QIAGEN® Clinical Insight Interpret (v. 9.2.1.20231012), and Franklin (v. 2023.7), a freely available annotator. These software annotators will hereafter be referred to as “navify MP”, “SOPHIA”, “QCI”, and “Franklin”, respectively.
Each of the four annotators in this study had specific requirements for input data, all of which represented the hg19 genome build. Table 1 outlines the different input features for each annotator. navify MP, QCI, and Franklin utilized variant call format (VCF) files containing predefined quality metrics from TSO500. Franklin used VCF files as input, while navify MP utilized VCF files plus a combined variant output file (providing gene copy number amplification data and tumor mutational burden). QCI employed a VCF file, copy number variants file, fusions file, and splice variants file. SOPHIA serves as both secondary and tertiary analysis software, taking processed FASTQ files as input and generating its own quality metrics. Alterations including microsatellite instability (MSI) status, tumor mutation burden (TMB) levels, amplifications, fusions, exon skipping, and combinations were considered in this study to be “complex” variants. As outlined in Table 1, TMB, MSI, Fusions, and CNVs were not supported by the Franklin free annotator. Thus, tier classification comparisons for these alteration types were only made in navify MP, SOPHIA, and QCI. In addition, the annotators all had filter settings that appeared to be either user-defined at the outset or pre-defined for the Illumina TSO500 assay (Table 1). In the cases of pre-defined settings, the user had the ability to modify such settings inside the user interface. To ensure consistency between SOPHIA and TSO500 variant calls, a Python script was employed for variant comparison. SOPHIA achieved a per-case SNP match rate average of 93.604% with minimal exon variant misses, as the majority of missed variants were intronic. Only matched variants were included for subsequent comparisons.

2.2. Software Comparison

The aim of this comparative analysis was to assess genomic alterations across various annotation tools, all of which adhere at some level to the tier and evidence classification framework outlined in the AMP/ASCO/CAP guidelines [3]. These guidelines delineate four recommended tiers, with Tiers I and II being of highest relevance, while Tiers III and IV denote variants of uncertain and benign significance, respectively. The focus of our investigation was on Tiers I and II. Tier I comprises two evidence subgroups, denoted as A and B, while Tier II comprises two evidence subgroups, denoted as C and D, all of which can pertain to “therapeutic, prognostic, or diagnostic significance”. Tier IA designates variants associated with “FDA-approved therapies or inclusion in professional guidelines for a specific cancer type”. Tier IB pertains to variants linked to “well-powered studies with consensus from experts in the field”. Tier IIC designates variants associated with “FDA-approved therapies for different tumor types, investigational therapies, or multiple small, published studies with some consensus”. Tier IID encompasses variants associated with “preclinical trials or a few case reports without consensus”.
For tier classification comparisons that were made in this study, it is important to highlight that the different annotators used different strategies for auto-annotating tiers. navify MP annotated variants as “Tier IA, IB, IIC, IID, III”, and “Unclassified”. SOPHIA and QCI both annotated variants as “Tier IA, IB, IIC, and IID”, with all other unannotated variants falling into the “III+” category. Franklin classified variants into “Tiers I-IV,” with a broad evidence framework employing multiple content sources, thus not including exactly the AMP/ASCO/CAP “A-D” evidence framework. To ensure robust and fair comparisons, only the tier classifications (I and II) were captured from Franklin, and Tier I was therefore compared with Tiers IA + IB from the other annotators, while Tier II was compared with Tier IIC from the other annotators. The focus of the comparisons performed in this study was on Tiers IA, IB, and IIC, as these are the most “actionable” tiers. “Tier IID, III, IV” and any other “non-IA-IB-IIC” categories were therefore excluded from comparison. For example, additional response types such as “No benefit”, “Not applicable”, “Not predictive,” and “Unknown” in the SOPHIA platform were not included in comparisons to ensure accurate and comparable tier-level annotations with other annotators. In addition, SOPHIA and Franklin displayed 781 low confidence “LC” variants, which were not included in tier classification comparisons but can be found in Table S1.
In order to facilitate tier classification comparisons, standardization was required at the levels of variant selection, variant processing, and tier classification categorization. To ensure consistency in variant selection and processing, we accounted for variations in secondary analysis pipelines between SOPHIA and other annotators, differences in input files (as shown in Table 1) for each annotator, and variations in applied processing filters (such as thresholds for VAF, RD, MAF, etc.). We only considered variants present in the outputs of all four annotators for comparisons in tier classifications. Across 80 cases, a total of 4671 high quality variants were present in all four tools, and of these, 4610 were unique (Table S1).

2.3. Statistical Analysis

Two critical performance metrics, positive percent agreement (PPA) and negative percent agreement (NPA), were calculated for each individual tier to facilitate the comparative analysis. Due to the fact that a universally-accepted “gold standard” reference for AMP/ASCO/CAP tier classifications does not exist, PPA and NPA were employed as surrogate measures to approximate sensitivity and specificity in order to assess agreement between annotators. It should be noted, however, that in the absence of a gold standard, PPA and NPA may yield biased estimates of these parameters [7].
In this study, PPA was computed using the formula PPA = [a/(a + c)] × 100, where:
  • a represents the number of variants classified as the given tier by both the test software and comparator software.
  • c represents the number of variants classified as the given tier by the comparator software but not by the test software.
  • Similarly, NPA was determined using the formula NPA = [d/(b + d)] × 100, where:
  • d corresponds to the number of variants not classified as the given tier by both the test software and comparator software.
  • b signifies the number of variants not classified as the given tier by the comparator software but classified as such by the test software.

3. Results

3.1. Case Characteristics

Of the 80 cases in this study, colon (n = 23), lung (n = 16), and breast (n = 15) tumor types accounted for nearly 70% of cases that underwent NGS (Figure 1). The remaining cases were spread across 13 other solid tumor types with 5 or less counts of each. Across this set of cases, there were 4610 unique variants present in all annotators and successfully classified by 1 or more annotators in this study (Table S1).

3.2. Tier I and II Comparisons across All 4 Annotators

In order to obtain an understanding of overall concordance of tier classifications across the 4 different annotators, we first compared Tier I and Tier II calls, since these have the highest impact of the four-tier system. 42 variants in total were classified as Tier I in at least one of the annotators. Of those 42 variants, 10 (23.8%) were in agreement across all four software solutions, while 15 (35.7%) did not overlap among any of the annotators (Figure 2a). 251 variants in total were classified as Tier II (Franklin) or Tier IIC (all other annotators) and, of those, two (0.80%) variants were in agreement across the solutions (Figure 2b). 132 (52.6%) variants in the Tier II category did not overlap among any of the annotators.
To further investigate the classification concordance of the 42 variants within the Tier I category, the annotators which differentiated between Tier IA and Tier IB (navify MP, SOPHIA, and QCI) were compared. 15 variants (45.5%) overlapped for Tier IA across the three annotators, while 14 variants (33.3%) did not overlap (Figure 3a). For Tier IB, there were 19 variants in total (a relatively small sample size), with no agreement among all three annotators, and there were only two variants shared between navify MP and SOPHIA, but not QCI (Figure 3b).

3.3. 2-Way Comparisons of Four Algorithms

Two-way comparisons were performed using PPA (Figure 4) and NPA (Figure S1) calculations for comparable tiers across annotators. For these calculations, each of the four annotators was positioned as the comparator. Raw numbers of variants used for these calculations are present in Table S2. For Tier I (Figure 4a), the highest concordance observed between two different annotators was for navify MP compared to SOPHIA, with a PPA of 95.3%, while the lowest concordance was for SOPHIA compared to Franklin, with a PPA of 36.4%. In general, Tier I comparisons with Franklin exhibited the lowest PPAs (Figure 4a).
Tier IA concordance measured across navify MP, SOPHIA, and QCI (Figure 4b) revealed a maximum PPA of 88.9% (QCI compared to navify MP) and a minimum PPA of 57.7% (SOPHIA compared to QCI). Tier IB concordance measurements (Figure 4c) showed a maximum PPA of 66.7% (SOPHIA compared to navify MP) and a minimum PPA of 0.0% (QCI compared to navify MP and SOPHIA). Finally, Tier IIC concordance measurements (Figure 4d) revealed a maximum PPA of 80.6% (navify MP compared to SOPHIA) and a minimum PPA of 27.4% SOPHIA compared to navify MP).

3.4. Complex Variants Classified by Navify MP, SOPHIA, and QCI

Complex variants, including TMB, MSI, Fusions, and CNVs, were investigated across the 80 cases in this study. A complete list of complex variants with a IA, IB, or IIC classification in at least one annotator can be found in Table S3. A subset of 57 cases was investigated further as they harbored complex variants with tier classifications in all three annotators. Table 2 summarizes the findings, which shows compared tier classifications for four different complex alterations: MSI-high, ALK-EML4, MSI-negative (neg), and ALK-EPS8 in the context of different cancer types. All Tier IA calls for MSI-high and ALK-EML4 were consistent across the three annotators. In 37 cases, Tier IIC classifications for MSI-neg were in agreement for all cancer contexts. A single colorectal adenocarcinoma case with an ALK-EPS8 fusion showed agreement across all three annotators for Tier IIC. Notably, there were eight colorectal adenocarcinoma cases where MSI-neg was classified as Tier IB by navify MP and SOPHIA and Tier IIC by QCI.

4. Discussion

As the demand for variant annotation and interpretation software solutions has increased, there has been more of a necessity for labs to understand the strengths and weaknesses of these tools in order to decide on the right solution for their needs. This study compared Tier IA, IB, and IIC classifications for alterations identified from comprehensive genomic profiling of 80 pan-cancer cases across four variant annotation software solutions: navify® Mutation Profiler (RUO*), SOPHIA DDMTM (RUO in the U.S.), QIAGEN® Clinical Insights (QCI) Interpret (RUO), and Franklin’s free annotator.
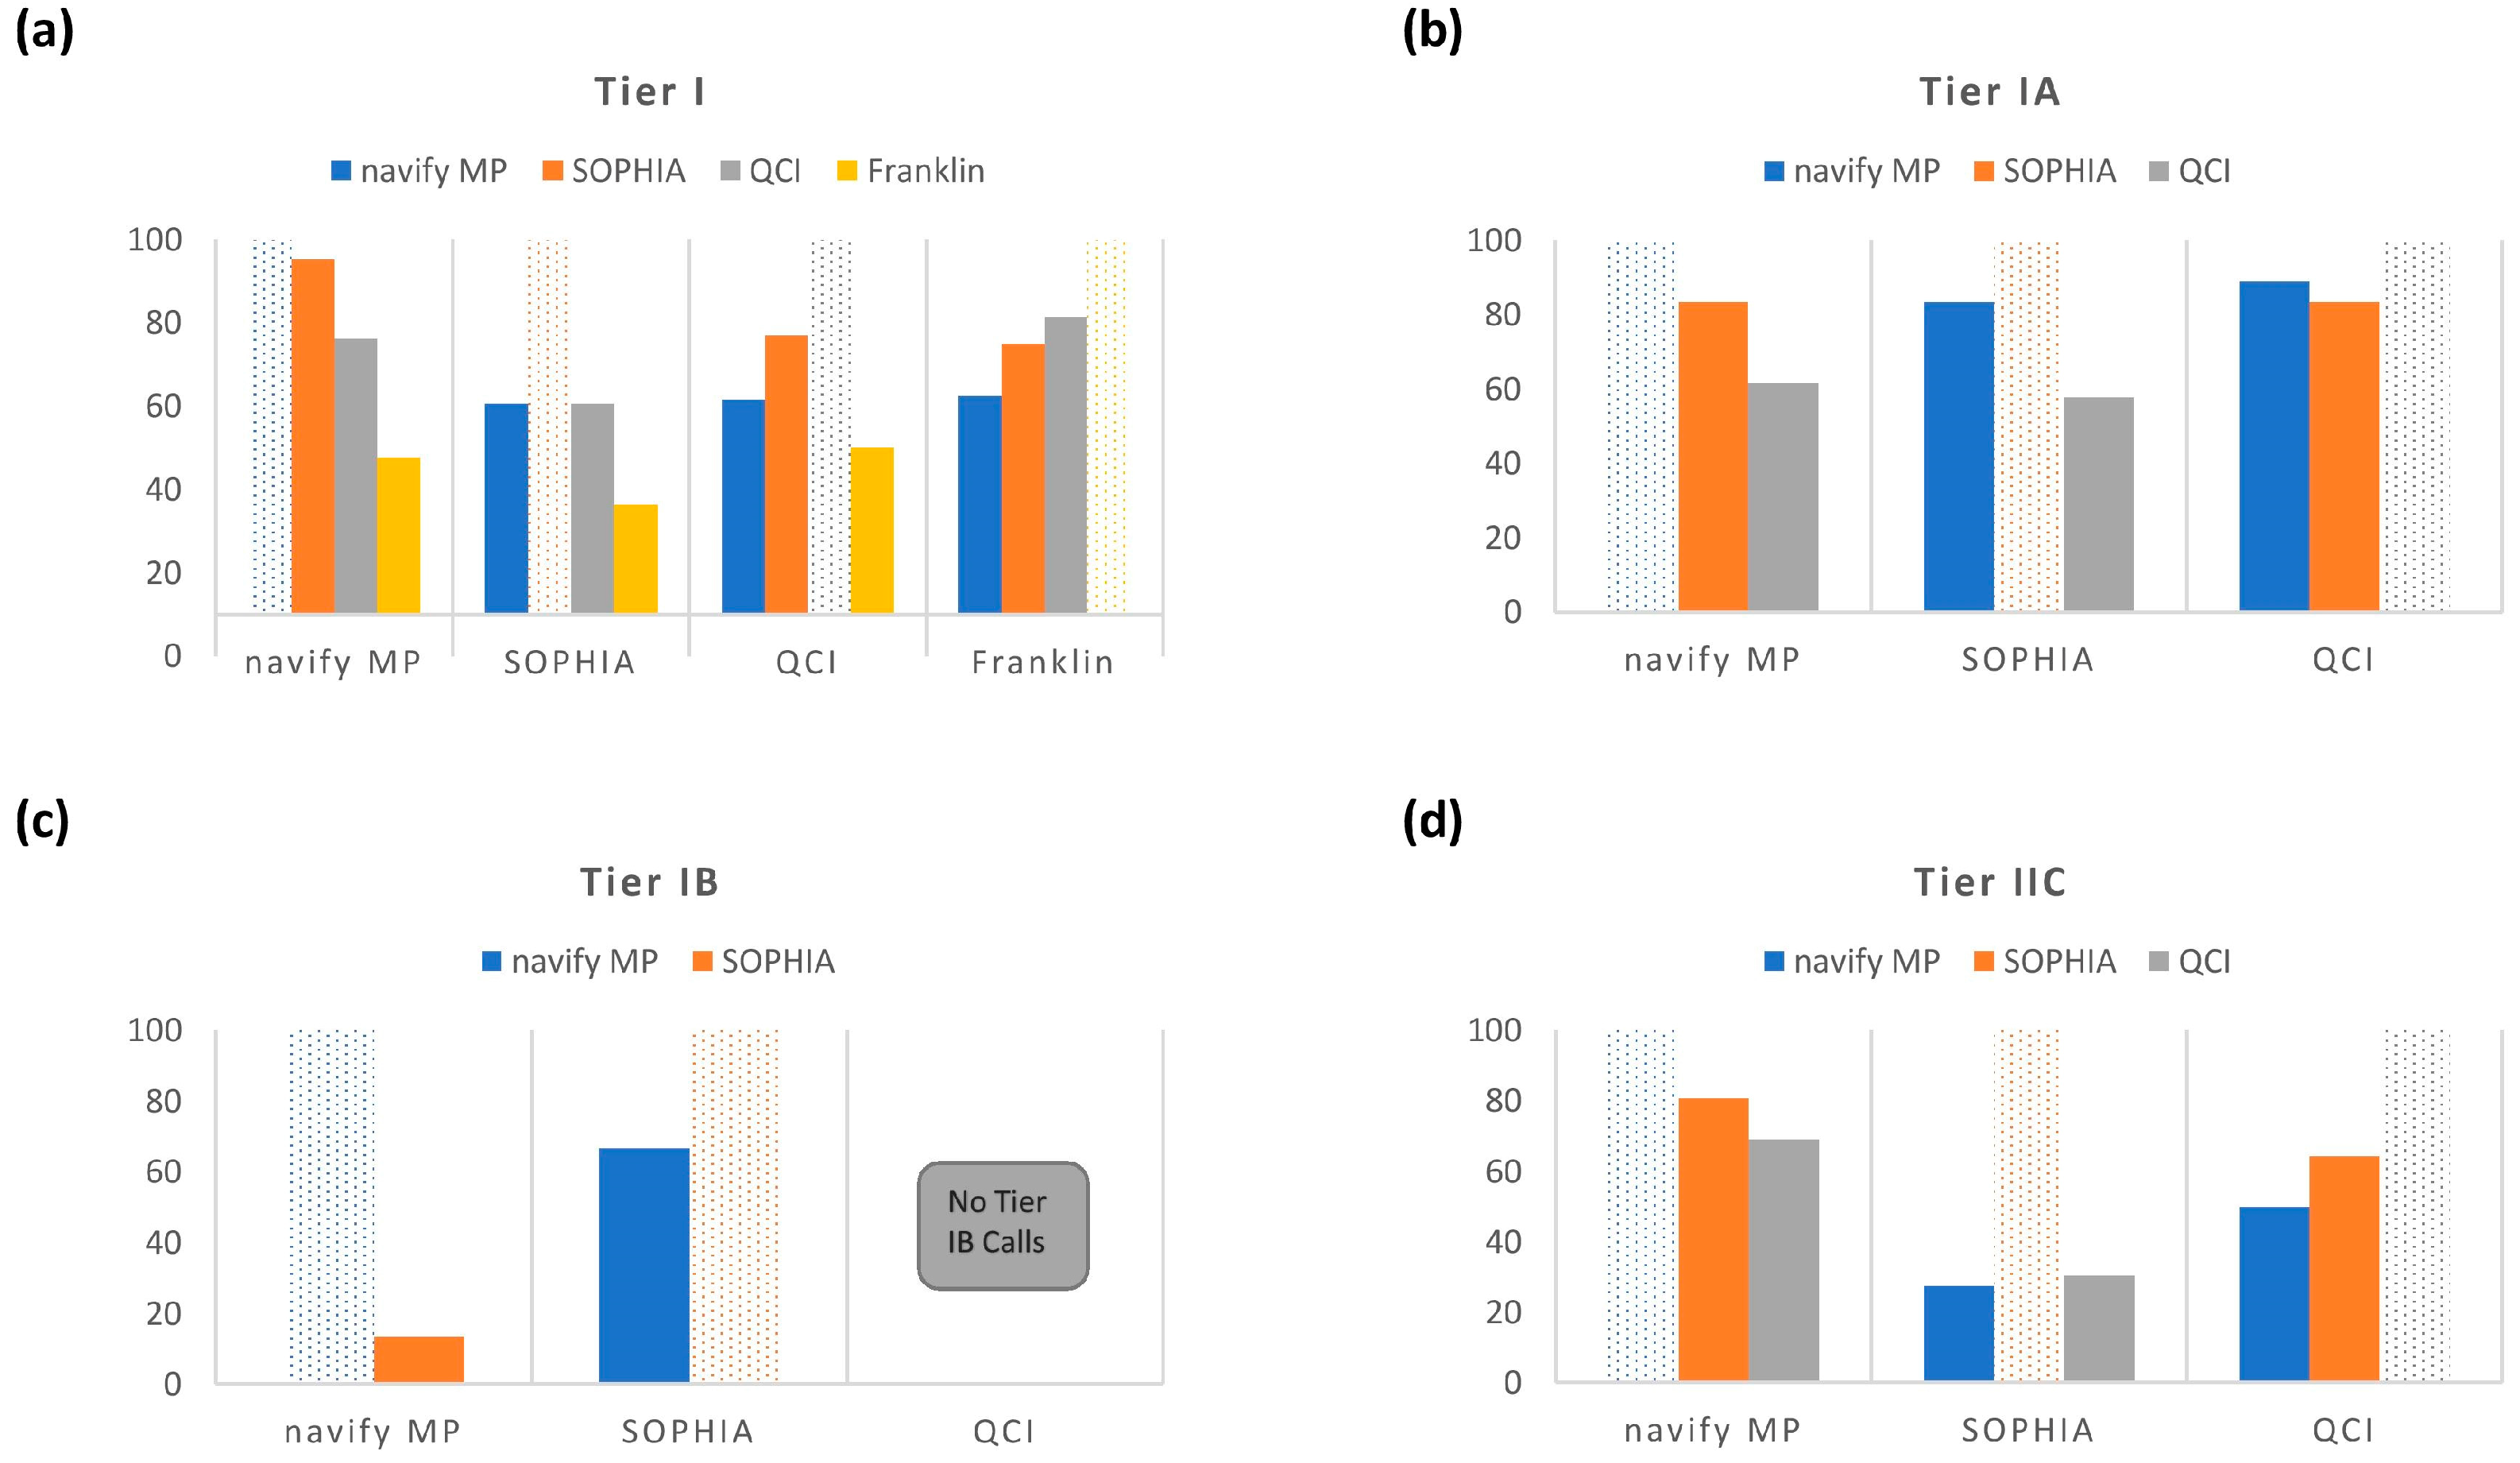
Across all four annotators, in general, classification concordance for Tier I and II variants was quite variable (Figure 4). Clearly, there was a stark difference in the observed Tier I concordance with the Franklin annotator compared to the other tools. One possible explanation is that simply combining Tiers IA and IB in the other annotators may not actually be equivalent to Franklin’s “Tier I”, potentially due to different evidence sources at play. This is currently unclear but highlights the importance of questioning tiering rules when choosing an annotator, especially for high impact AMP/ASCO/CAP categories such as Tier I and II. These findings also may suggest different levels of robustness between commercial and free tertiary analysis solutions. That stated, there were demonstrations of discordance even across the three commercial annotators as evidenced by PPA comparisons made across just those tools (Figure 4b–d). For example, for Tier IA, the PPA between QCI vs. SOPHIA was 57.7% (Figure 4b) with an even lower PPA observed (27.4%) for Tier IIC calls between navify MP and SOPHIA (
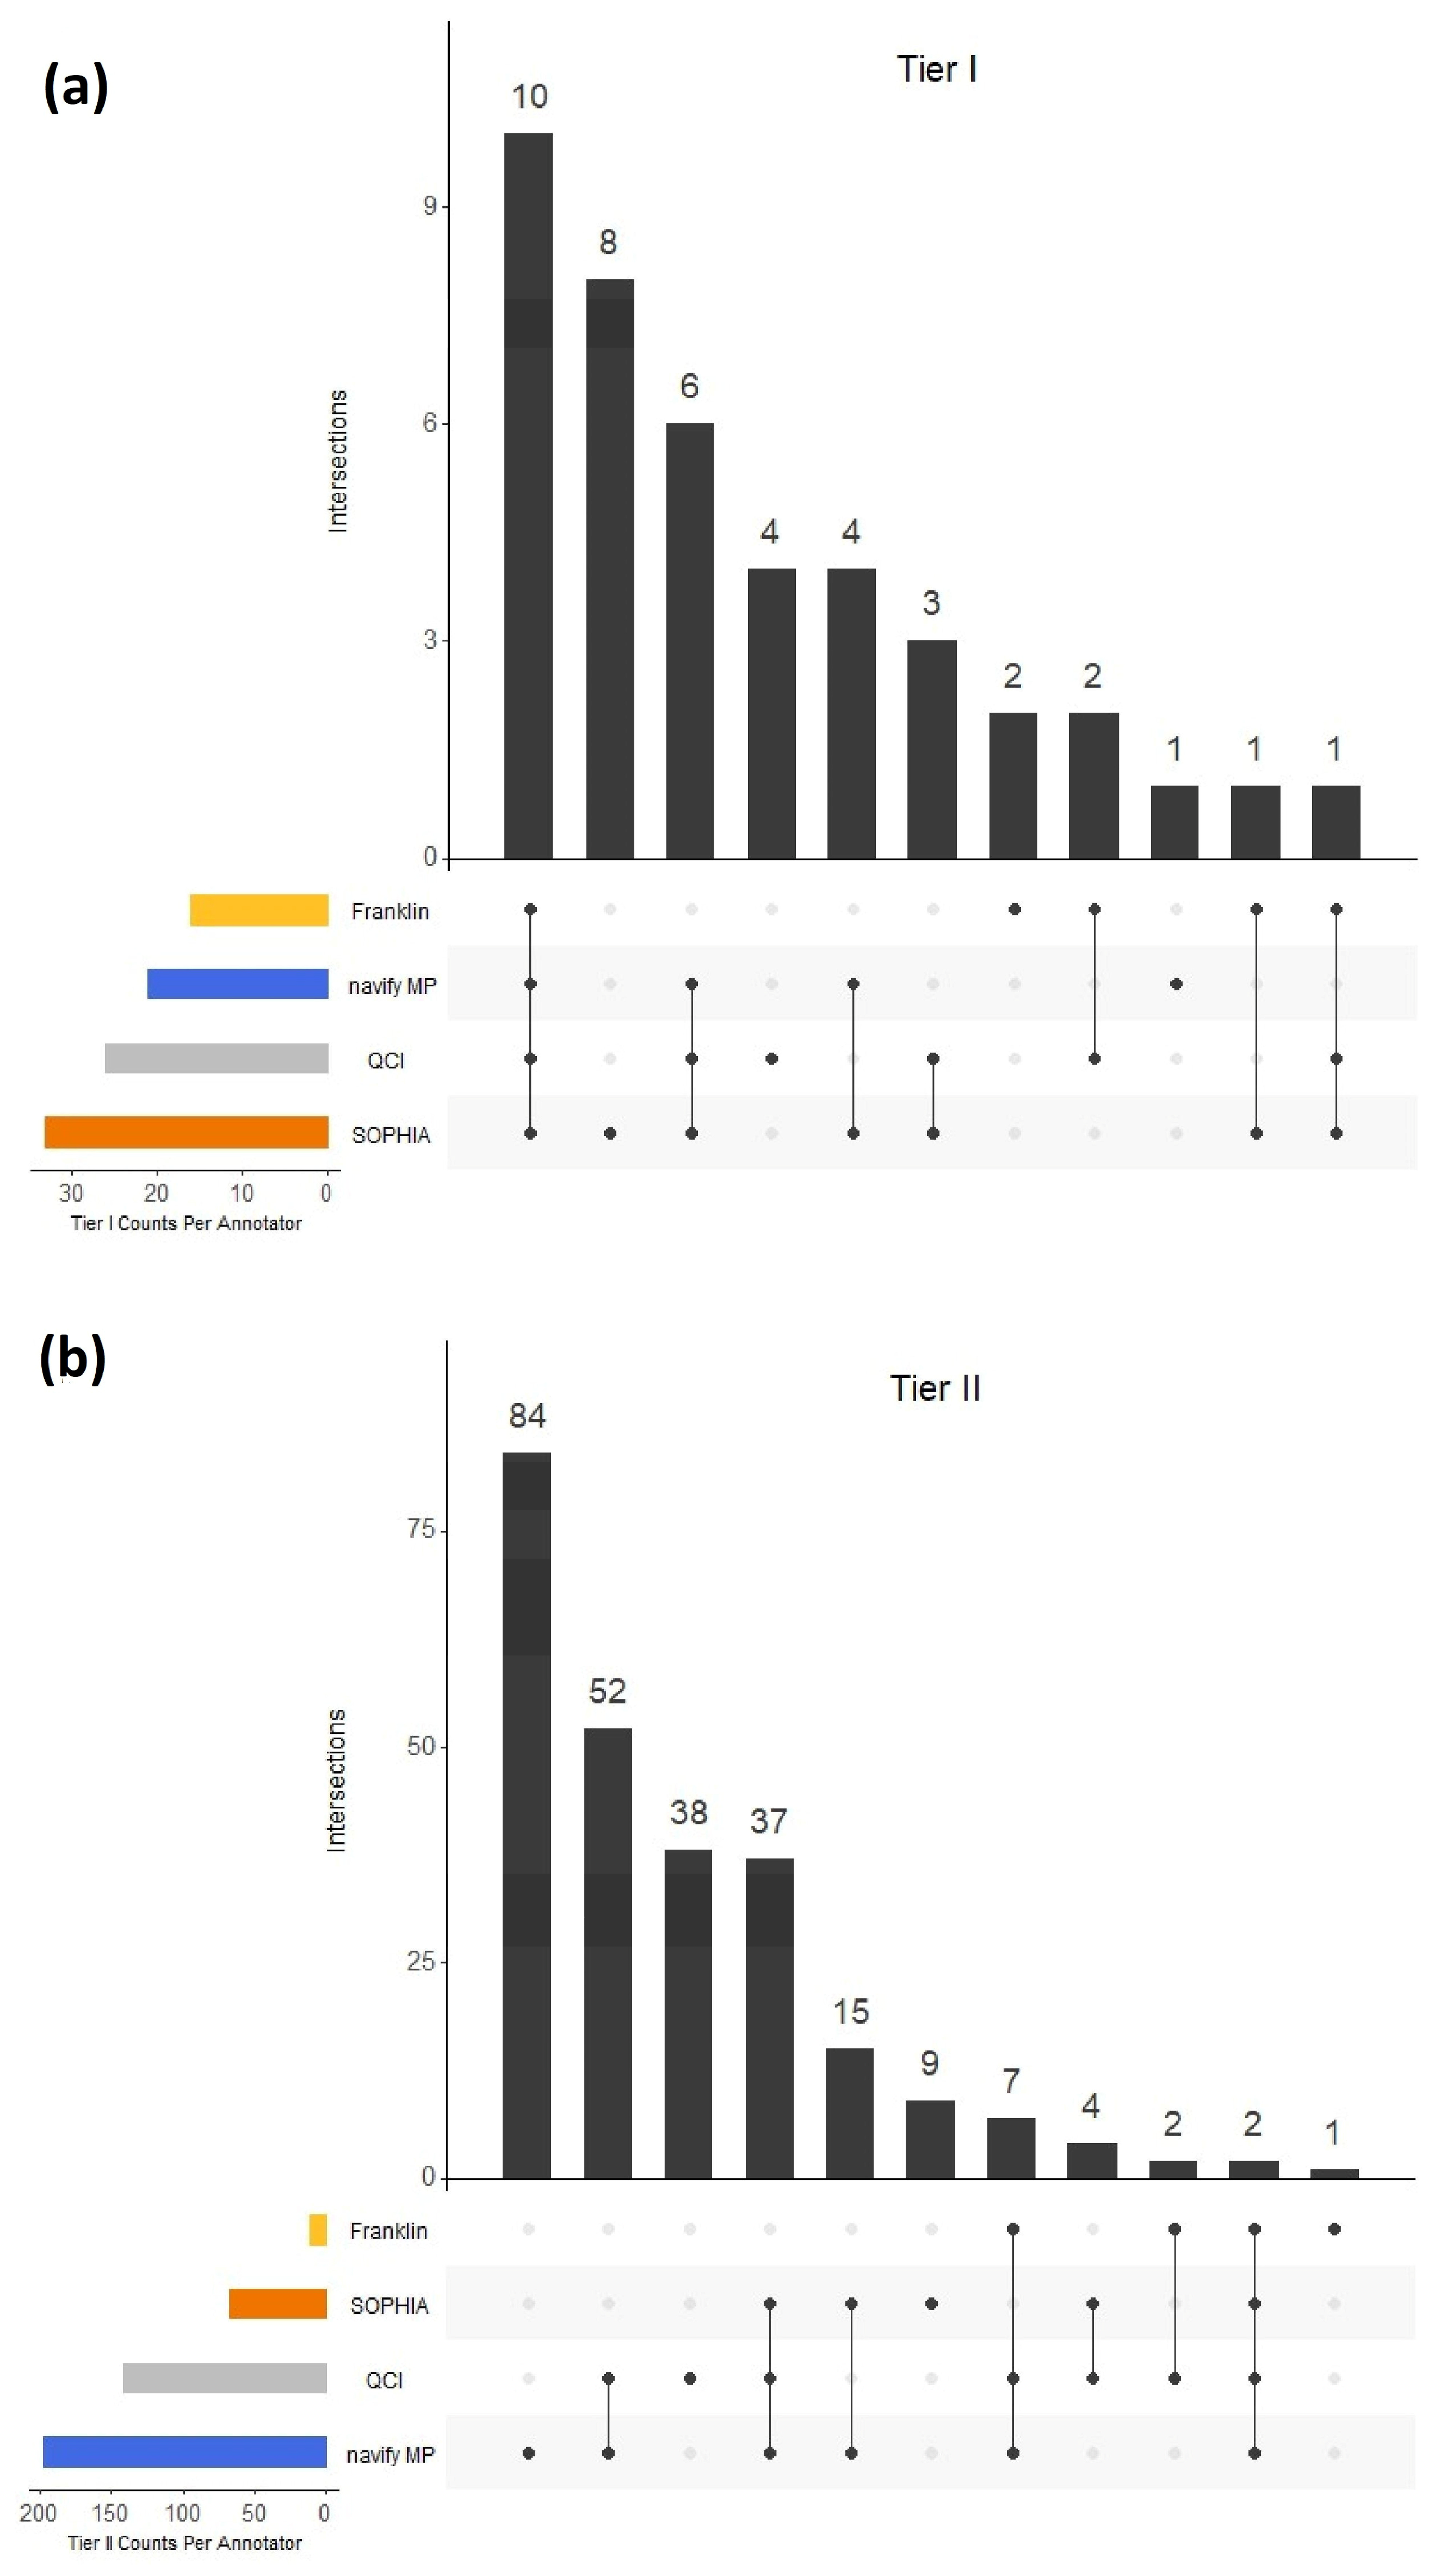
Figure 4d). These low PPA observations may be explained, in part, by gene-level nuances. In the case of Tier IIC, 132 (52.6%) variants in this category did not overlap among any of the annotators (Figure 2b). Upon closer examination of the 84 variants that were unique to navify MP for Tier IIC classification, it is interesting to note that 17 of these variants belong to the TET1 gene (Figure 2a; Table S1). In this case, these variants were grouped into the broad category of “TET1 mutation” to reflect content that described variants at this level. This behavior is not unique to navify MP. All annotators have handling for broader mutation groups, mostly notably of the type called “inactivating/activating” mutations. In these cases, users should take extra care to scrutinize the evidence for such mutations to determine relevance for their case.
In general, the comparisons made across annotators for Tier IA revealed tighter concordance overall than for Tiers IB and IIC (Figure 4b–d). Notably, the highest PPA for Tier IA was between QCI and navify MP (PPA-88.9%). However, with Tier IA being the least subjective category in the AMP/ASCO/CAP guidelines (discussed below with respect to Table 3), the expectation would have been that concordance would be high and similar for all possible comparison permutations. But this was not the case and raises concerns since Tier IA is the most actionable category. It’s possible that concordance would be higher for specific cancer types and it would be interesting to understand whether classification concordance improves for variants from specific cancer types. For example, it would be expected that Tier IA classifications would be more highly concordant across annotators for variants from non-small cell lung cancer cases since this type of cancer is rich with targetable biomarkers in the NCCN guidelines [8].
While concordance for Tier I and II variants in this study was variable, it is important to note that NPA analysis depicted strong agreement for all 4 annotators (Figure S1). Furthermore, the sample sizes for NPA calculations were much higher than the ones used for PPA, as variants from this testing had a much higher tendency to not be classified as Tier IA, IB, or IIC. This may also indicate that these variants are not somatic i.e., common germline, or are possibly skewed to a few specific tumor types. In addition, the high NPA as compared to PPA observed for classifications across the four solutions supports the notion that positive calls are fraught with complexities not present in negative calls. The lack of strong concordance in positive calls was previously demonstrated in a similar study published in 2020 [9], where navify MP and QCI were compared and found to have 14/61 (23.0%) concordant Tier IA classifications. This is significantly lower than what was observed for Tier IA alterations in the present study. However, for Tier IB classifications, the previous study [9] had higher concordance between navify MP and QCI (8 out of 39; 20.5%). These differences between studies implicate multiple factors, including a lower sample size in the previous study (n = 48) compared to the current study (n = 80), tumor type differences (e.g., lung cancer comprises 39% in the previous study vs. 20% in the current study), new approvals and new study data, as well as statistical analysis differences (Kappa statistic in the previous study vs. PPA/NPA in the present study).
In the present study, a Kappa statistic was intentionally not used and instead positive percent agreement (PPA) and negative percent agreement (NPA) [7] were employed in order to account for the lack of a true gold standard reference, as well as account for small sample sizes. The absence of a gold standard is underscored by the weak (59%) concordance demonstrated in the Variant Interpretation Testing Among Laboratories (VITAL) study where 134 participants interpreted the same 11 variants across 4 cancers using the AMP/ASCO/CAP guidelines [10]. The strength of PPA and NPA to compare tier classifications between annotators is the ability to gain a more targeted and meaningful assessment of the annotators’ performance in identifying relevant variants and ensuring that the classifications are aligned with the relevant context. In contrast, the Kappa statistic may not provide the same level of specificity, especially when the primary focus is on accurately identifying disease-associated variants. In addition, the Kappa statistic is not ideal for comparing auto-classification of tiers since it takes into account the potential for guessing (which never occurs in auto-classification) and makes certain assumptions about the independence of the comparators, thus potentially providing an underestimate of the level of agreement between comparators [11].
In this study, complex variants, including microsatellite instability (MSI) status, tumor mutation burden (TMB) levels, amplifications, fusions, exon skipping, and combination alterations were separately analyzed (Table 2; Table S3) across navify MP, SOPHIA, and QCI, as these three annotators had support for this category, while the Franklin annotator did not (Table 1). For the four complex variants across 57 cases, Table 2 shows classifications by the three annotators were largely in agreement.
It is important to note that complex-type biomarkers are not “in scope” for the AMP/ASCO/CAP guidelines; therefore, tertiary analysis solutions must assess them and provide classifications under their intended uses. This has led to annotators applying “AMP/ASCO/CAP guideline-like” tiering to such biomarkers as evidenced by the classifications seen for these types of alterations in such tools. For example, SOPHIA and navify MP auto-classified several combination alterations, which QCI did not. In addition, navify MP automatically classified wildtype NRAS/KRAS in a colorectal adenocarcinoma case as Tier IA, while QCI did not. This finding was, however, expected in this case as “pertinent negative” genes, including NRAS/KRAS were not pre-defined in the metadata for the analyses performed in QCI (underscoring the criticality of specifying pertinent negatives in platforms that require it in order to not miss actionable biomarkers of this nature). Furthermore, navify MP and QCI auto-classified several cases of TMB-high as well as key gene amplifications (including ERBB2 amplification and MET amplification), but SOPHIA did not. In the software version used for this study, it appeared that SOPHIA took a more conservative approach for some complex variant types, including TMB and CNVs. While SOPHIA calculated TMB levels, they did not auto-classify TMB alterations into tiers. SOPHIA also did not auto-classify several CNV amplifications and provided a rationale of a strict requirement for eight samples or more in the same run to address the possibility of a batch effect bias.
Multiple factors may explain the complexities and lack of concordance across different variant annotation software solutions. It is therefore important to consider how these factors may influence the performance of these decision support tools. In the next sections, several reasons for lack of concordance are proposed and discussed.

4.1. Subjectivity in the Guidelines

We believe that the lack of concordance seen across the solutions is in part due to the fact that the underlying classification structure published in the AMP/ASCO/CAP guidelines [3] has a large degree of subjectivity, as evidenced by ambiguity in words and phrases describing different types of evidence that power the tier classifications. Tier I evidence definitions have four subjective words or phrases while Tier II evidence definitions have seven subjective words or phrases (Table 3). These phrases may indeed be interpreted differently by different individuals.
For example, for Tier IB (Table 3, Row 2), several questions have arisen for the guidance that the variant should be the focus of “well-powered studies with consensus from experts in the field”. How does one define a well-powered study? By sample size? By study type? By journal in which it is published? Also, what constitutes “consensus?” Two concordant studies? 10 concordant studies? 100 concordant studies? And how does one define an “expert in the field?” Individuals with specific credentials? Individuals with a certain number of publications? Individuals only in the genomics field? Clearly, there are many questions, and this guidance for Tier IB is a good example of where there needs to be further definition by AMP/ASCO/CAP to standardize language in order to ensure consistency in Tier IB classifications, as well as other tiers with subjective phrasing in the guidelines.

4.2. Variant Allele Frequency (VAF) Thresholds

It is important to highlight that different annotators have different variant allele frequency (VAF) threshold defaults for variants identified from tumor sequencing. Table 1 shows default VAF settings for navify MP (none), SOPHIA (2%), QCI (5%), and Franklin (5%), where variants under these thresholds are filtered out and not subjected to classification. navify MP does not impose a default VAF setting and provides users the opportunity to define the threshold when creating an assay or for each individual case. For this study, a VAF cut-off was not defined in navify MP, and here is an example of a potential negative consequence of not doing so. When investigating discrepant variant classifications across annotators, RB1 p.E209* was uncovered in a breast cancer case where the tier classifications were as follows: Low Confidence (LC)—SOPHIA, Tier IB—navify MP, LC—Franklin, Tier III+—QCI. This variant had a VAF of 1.7%, which resulted in a low confidence annotation via SOPHIA and Franklin (with default VAF cutoffs of 2% and 5%, respectively). Upon closer investigation of the Tier IB classification by navify MP, it was clear that this variant should not have passed through and been classified due to the low VAF. Not filtering out the variant in question resulted in a classification based on broader categorization of this variant as an RB1 inactivating (truncating) mutation. It is therefore critical to ensure that VAF cut-offs are determined ahead of time based on the analytical sensitivity of the specific assay used, where the user should establish the lowest VAF that can reliably be detected at a given amount of input DNA/RNA.

4.3. Minor Allele Frequency (MAF) Thresholds

Another notable characteristic is the gray line cutoff of the minor allele frequency (MAF) thresholds across annotators. MAF measures the frequency at which the variant (minor allele) is seen in general population, where the significance cutoff has been reported to range from 1% to 5% [3]. Of the annotators in this study, only QCI and Franklin have default thresholds of 1% for MAF, while navify MP and SOPHIA do not have default MAF thresholds and rely upon user definition (Table 1). One variant, BRCA1 p.Q356R from a pancreatic adenocarcinoma case, had a wide range of tier classifications across the annotators: Tier IA—navify MP, Tier IA—SOPHIA DDM, Tier III+—QCI, Tier IV—Franklin and was therefore flagged in this study for a deeper dive investigation. This BRCA1 variant had a MAF of 4.7%, which resulted in being filtered out in QCI and Franklin, and explains their Tier III+ and Tier IV classifications, respectively. Without MAF thresholds set, both navify MP and SOPHIA classified this as Tier IA, which would not have been the case had the MAF threshold been set accordingly.
Another variant, TERT c.-245T > C, was classified as follows: Tier IA—navify MP, LC—SOPHIA, QCI—III+, Franklin—Tier IV. This variant had a high MAF as reported in gnomAD, varying from 12% in African/African Americans to 52% in South Asians. In spite of these high MAFs, the variant was classified as a Tier IA variant for glioblastoma via navify MP based on strong, supporting evidence for TERT promoter mutations, in general [12,13]. This raises two important considerations users should understand about their population: (1) pre-defining the MAF cutoff should be considered to avoid potentially misleading results; and (2), more importantly, users need to recognize that the MAF varies by genomic ancestry. Thus, pre-defined cut-offs could remove important variants that differ in frequency by ancestry.

4.4. Disease Ontologies

Disease ontology differences can contribute to tier classification differences that may not be evident when using broad cancer types, such as “breast cancer”. BRCA1 p.Q356R was depicted in two separate cases, one ER+ breast cancer case as well as one triple-receptor negative breast cancer case. In the absence of a MAF filter (as described above), this variant was considered to be in a class of “inactivating BRCA1 alterations” and thus, was auto-classified by navify MP as Tier IB for ER+ breast cancer due to well-powered studies [14,15] and Tier IIC for triple-negative breast cancer due therapies indicated for a different type of breast cancer. The message therefore is that it is very important to be as specific as possible with input cancer types, as variants can fall in or out of higher tier classifications strictly based on the cancer type selected. Choosing a less specific cancer type will often cause inclusion of additional information potentially not relevant to the case at hand.

4.5. Additional Considerations

There are additional factors that may account for tier classification differences, and several are summarized below.

4.5.1. Genome Builds

Discrepancies arising from diverse genome builds (e.g., GrCh38, hg38, GrCh37, hg19) influence the genomic coordinates assigned to variants, affecting their positional accuracy and compatibility with various reference genomes. Some annotators are set up to support VCFs generated from a wide variety of genome builds (e.g., QCI), while others (e.g., navify MP) are optimized for a primary genome build and then perform a liftover function to map coordinates from one build to another. This may cause variants to fail liftover for regions in the primary genome build that are not present in other builds.

4.5.2. Splice Site Regions of Interest

Annotators have distinct regions of interest which are driven by their intended application. When a variant does not fall in these regions, they may be filtered out of the analysis. This was the case for a TP53 variant (c.920-2A > G), where navify MP and QCI classified this variant as Tier IIC, while SOPHIA called this LC due to being an “off-target” region. This may cause missed highly relevant variants, an incomplete biological understanding, or skewed data interpretation when excluding a variant based on predefined regions. It is advisable to periodically review and update the predefined regions of interest, considering the evolving knowledge in the field and the potential implications of variants outside these regions.

4.5.3. Classification Context

Classification contexts of “therapeutic, diagnostic, prognostic”, and/or hereditary significance [3,4,5] can lead to mis-prioritization of variants, thus impacting the interpretation of variants for specific applications. For example, TERT promoter alterations are evidenced to be “diagnostic” for glioblastoma as stated in the NCCN and WHO guidelines [16,17]. One of the glioblastoma cases in this study, previously mentioned above, harbors a TERT c.-245T > C variant where 3 annotators (navify MP, QCI, and Franklin) provided a classification (this variant was classified as a “low confidence” call in SOPHIA). Only navify MP classified this variant as Tier IA, as this qualifies as a “diagnostic” Tier IA classification in accordance with the AMP/ASCO/CAP guidelines [3]. Both QCI and Franklin classified this variant as Tier III or IV, presumably due to having different rules around classification context. Understanding whether a tier classification is “therapeutic, diagnostic, and/or prognostic” in accordance with guidelines [3,4] is therefore critical to proper interpretation of variants and this context should be as transparent as possible in tertiary analysis solutions to avoid misinterpretation. While not the immediate focus of this study, an interesting follow-up activity would be to measure AMP/ASCO/CAP tier classification concordance for therapeutic significance vs. diagnostic/prognostic significance.

4.5.4. Implications of Variant Misclassifications

Over-classifying variants to a higher tier can severely impact downstream management and lead to wasted resources, ethical concerns, and issues with data quality and reproducibility. In this study, PIK3CA variants have been subject to overcalling, as this gene is known to be of high relevance to disease [18]. For example, of the 10 variants that only QCI classified as Tier IA (Figure 3a), 7 of these were PIK3CA variants. This dramatically affected PPAs for QCI compared to navify MP and SOPHIA, which were 61.5% and 57.7%, respectively (Figure 4b). This highlights the need for users in certain cases to confirm any suspicious Tier I and II calls with additional review of literature and trusted databases.
Under-classifying variants to a lower tier can also have profound implications. In this study, there were many examples of classification discordance, and inevitably, some of this discordance stemmed from the under-classification of variants. For example, of variants classified as Tier I (A or B) by navify MP, SOPHIA, and QCI, there were six variants classified as non-IA-IB-IIC by the Franklin annotator (Table S1). It is important to recognize cases of both over- and under-classification through regular quality control measures and provide feedback of any issues to the tertiary analysis software support teams.
As with any comparison-type study, it is crucial to ensure an “apples to apples” strategy is employed to interrogate the data. As a follow-up to this study, it would be interesting to understand the nature of variants that were not present in all four annotators to understand the level at which variants were “unfit” for classification comparisons. This type of exercise would likely uncover interesting nuances in secondary analysis, variant processing for tertiary analysis, and specific rules in tertiary analysis software solutions that result in lack of tier classification. For example, SOPHIA and Franklin have created rules to categorize post-processed variants as “LC”, or low confidence, and understanding the concordance for this category across both annotators would be useful. Finally, we recognize that since the time the data were captured and compared, it is possible that newer versions of all the annotators would show improved calls of Tier I and II variants based on updated content and/or software feature enhancements. It would be of paramount interest to perform the same analysis over time to see if concordance improves across the annotators in this study.

5. Conclusions

Both secondary and tertiary software solutions provide a time-saving, repeatable method for variant annotation, analysis, and reporting. The output of the different variant annotators varies and is attributable to how and what genomic information is applied to a variant, and also the disease ontology that is available for each software tool. All four software solutions analyzed provide a user-friendly interface and surpass manual curation in terms of efficiency. However, there were marked disagreements between all annotators, suggesting that it is important to carefully consider the choice of variant annotation software for specific applications and to be educated in the nuances and settings. In addition, as reported from the Variant Interpretation Testing Among Laboratories (VITAL) challenge conducted by AMP, variant classification remains challenging and clarifications in the guidelines are warranted [10]. In addition, future versions of the AMP/ASCO/CAP guidelines should address impactful complex biomarkers, such as TMB and MSI, expand international applicability (e.g., inclusion beyond FDA drug approvals), and aim for greater standardization of tier classification criteria.

Supplementary Materials

The following supporting information can be downloaded at: https://www.mdpi.com/article/10.3390/jmp5010006/s1, Table S1: Unique variants classified as IA, IB, or IIC by one or more annotators; Table S2: Raw variant counts for PPA and NPA comparisons across annotator software solutions; Figure S1: Negative Percent Agreement (NPA) for 2-way comparisons for Tier I (a), Tier IA (b), Tier IB (c), and Tier IIC (d); Table S3: Complete list of complex variants present in one or more annotators and any available classifications.

Author Contributions

R.K. and T.M.L. contributed equally to this work. R.K. acquired and normalized all data for this study, performed data analysis and interpretation, and contributed to drafting this work. T.M.L. was the primary drafter of this work and made substantial contributions to the study design and data representations. L.S.-C. provided input into the study design, statistical tests, and data representations. M.J.C. provided input into the study design and direction for statistical tests. S.K. provided assistance in data interpretation. H.S. provided input into the study design. A.M. provided strategic direction and guidance on the study design and manuscript preparation. All authors provided critical review of drafts of this work. All authors have read and agreed to the published version of the manuscript.

Funding

Roche provided financial support to Protean BioDiagnostics for this study.

Institutional Review Board Statement

This study was reviewed by the WCG Institutional Review Board (IRB) Affairs Department and determined to be exempt under 45 CFR § 46.104(d)(4) (WCG IRB Work Order #1-1721889-1).

Informed Consent Statement

All subjects gave their informed consent for inclusion before they participated in the study.

Data Availability Statement

The data that supported the findings in this study is available on reasonable request from the corresponding author. The data is not publicly available due to ethical restrictions.

Acknowledgments

Thank you to Amin Gholami, Damien Jones, and Martin Jones for providing technical assistance for software and scripting. Thank you to Adeline Pek for assistance with initial study design. Thank you to Hannah Park for assistance with IRB review. Thank you to Beate Litzenburger for providing scientific advice. Thank you to the study participants.

Conflicts of Interest

R.K. and A.M., of Protean BioDiagnostics, received a research grant from Roche for this study. A.M. has been a consultant and received speaker honoraria from Roche. Roche authors, L.S. and H.S. contributed to the design of the study. T.L., L.S.-C., M.C. and S.K. aided R.K. in the analyses and interpretation of the data.

References

  1. Reid, E.S.; Papandreou, A.; Drury, S.; Boustred, C.; Yue, W.W.; Wedatilake, Y.; Beesley, C.; Jacques, T.S.; Anderson, G.; Abulhoul, L.; et al. Advantages and pitfalls of an extended gene panel for investigating complex neurometabolic phenotypes. Brain 2016, 139, 2844–2854. [Google Scholar] [CrossRef] [PubMed]
  2. Horak, P.; Leichsenring, J.; Goldschmid, H.; Kreutzfeldt, S.; Kazdal, D.; Teleanu, V.; Endris, V.; Gieldon, L.; Allgäuer, M.; Volckmar, A.; et al. Assigning evidence to actionability: An introduction to variant interpretation in precision cancer medicine. Genes Chromosomes Cancer 2022, 61, 303–313. [Google Scholar] [CrossRef] [PubMed]
  3. Li, M.M.; Datto, M.; Duncavage, E.J.; Kulkarni, S.; Lindeman, N.I.; Roy, S.; Tsimberidou, A.M.; Vnencak-Jones, C.L.; Wolff, D.J.; Younes, A.; et al. Standards and Guidelines for the Interpretation and Reporting of Sequence Variants in Cancer: A Joint Consensus Recommendation of the Association for Molecular Pathology, American Society of Clinical Oncology, and College of American Pathologists. J. Mol. Diagn. 2017, 19, 4–23. [Google Scholar] [CrossRef] [PubMed]
  4. Mateo, J.; Chakravarty, D.; Dienstmann, R.; Jezdic, S.; Gonzalez-Perez, A.; Lopez-Bigas, N.; Ng, C.K.Y.; Bedard, P.L.; Tortora, G.; Douillard, J.Y.; et al. A framework to rank genomic alterations as targets for cancer precision medicine: The ESMO Scale for Clinical Actionability of molecular Targets (ESCAT). Ann. Oncol. 2018, 29, 1895–1902. [Google Scholar] [CrossRef] [PubMed]
  5. Richards, S.; Aziz, N.; Bale, S.; Bick, D.; Das, S.; Gastier-Foster, J.; Grody, W.W.; Hegde, M.; Lyon, E.; Spector, E.; et al. Standards and guidelines for the interpretation of sequence variants: A joint consensus recommendation of the American College of Medical Genetics and Genomics and the Association for Molecular Pathology. Genet. Med. 2015, 17, 405–424. [Google Scholar] [CrossRef] [PubMed]
  6. Illumina. TruSight Oncology 500. 2018. Available online: https://www.illumina.com/products/by-type/clinical-research-products/trusight-oncology-500.html (accessed on 13 December 2023).
  7. Meier, K. Statistical Guidance on Reporting Results from Studies Evaluating Diagnostic Tests—Guidance for Industry and FDA Staff; U.S. Food & Drug Administration: Silver Spring, MD, USA, 2007.
  8. National Comprehensive Cancer Network. Non-Small Cell Lung Cancer (Version 2.2024). Available online: https://www.nccn.org/professionals/physician_gls/pdf/nscl.pdf (accessed on 11 February 2024).
  9. Perakis, S.O.; Weber, S.; Zhou, Q.; Graf, R.; Hojas, S.; Riedl, J.M.; Gerger, A.; Dandachi, N.; Balic, M.; Hoefler, G.; et al. Comparison of three commercial decision support platforms for matching of next-generation sequencing results with therapies in patients with cancer. ESMO Open 2020, 5, e000872. [Google Scholar] [CrossRef] [PubMed]
  10. Lyon, E.; Temple-Smolkin, R.L.; Hegde, M.; Gastier-Foster, J.M.; Palomaki, G.E.; Richards, C.S. An Educational Assessment of Evidence Used for Variant Classification: A Report of the Association for Molecular Pathology. J. Mol. Diagn. 2022, 24, 555–565. [Google Scholar] [CrossRef] [PubMed]
  11. McHugh, M.L. Interrater reliability: The kappa statistic. Biochem. Med. 2012, 22, 276–282. [Google Scholar] [CrossRef]
  12. Eckel-Passow, J.E.; Lachance, D.H.; Molinaro, A.M.; Walsh, K.M.; Decker, P.A.; Sicotte, H.; Pekmezci, M.; Rice, T.; Kosel, M.L.; Smirnov, I.V.; et al. Glioma Groups Based on 1p/19q, IDH, and TERT Promoter Mutations in Tumors. N. Engl. J. Med. 2015, 372, 2499–2508. [Google Scholar] [CrossRef] [PubMed]
  13. Labussière, M.; Di Stefano, A.L.; Gleize, V.; Boisselier, B.; Giry, M.; Mangesius, S.; Bruno, A.; Paterra, R.; Marie, Y.; Rahimian, A.; et al. TERT promoter mutations in gliomas, genetic associations and clinico-pathological correlations. Br. J. Cancer. 2014, 111, 2024–2032. [Google Scholar] [CrossRef] [PubMed]
  14. Tung, N.M.; Robson, M.E.; Ventz, S.; Santa-Maria, C.A.; Nanda, R.; Marcom, P.K.; Shah, P.D.; Ballinger, T.J.; Yang, E.S.; Vinayak, S.; et al. TBCRC 048: Phase II Study of Olaparib for Metastatic Breast Cancer and Mutations in Homologous Recombination-Related Genes. J. Clin. Oncol. 2020, 38, 4274–4282. [Google Scholar] [CrossRef] [PubMed]
  15. Sharma, P.; Rodler, E.; Barlow, W.E.; Gralow, J.; Huggins-Puhalla, S.L.; Anders, C.K.; Goldstein, L.J.; Brown-Glaberman, U.A.; Huynh, T.; Szyarto, C.S.; et al. Results of a phase II randomized trial of cisplatin +/- veliparib in metastatic triple-negative breast cancer (TNBC) and/or germline BRCA-associated breast cancer (SWOG S1416). J. Clin. Oncol. 2020, 38, 1001. [Google Scholar] [CrossRef]
  16. National Comprehensive Cancer Network. Central Nervous System Cancers (Version 1.2023). Available online: https://www.nccn.org/professionals/physician_gls/pdf/cns.pdf (accessed on 8 November 2023).
  17. Louis, D.N.; Perry, A.; Wesseling, P.; Brat, D.J.; Cree, I.A.; Figarella-Branger, D.; Hawkins, C.; Ng, H.K.; Pfister, S.M.; Reifenberger, G.; et al. The 2021 WHO Classification of Tumors of the Central Nervous System: A summary. Neuro Oncol. 2021, 23, 1231–1251. [Google Scholar] [CrossRef] [PubMed]
  18. National Comprehensive Cancer Network. Breast Cancer (Version 5.2023). Available online: https://www.nccn.org/professionals/physician_gls/pdf/breast.pdf (accessed on 13 December 2023).
Figure 1. Pie chart signifying the tumor types of the 80 cases in this study. The majority of cases come from colon (n = 23), lung (n = 16), and breast (n = 15) tumor types.
Jmp 05 00006 g001
Figure 2. Tier I (a) and Tier II (b) concordance across the 4 annotators. For Tier I comparisons, Tier I from Franklin was compared with Tier IA and IB combined in each of the other annotators. For Tier II comparisons, Tier II from Franklin was compared with Tier IIC in each of the other annotators.
Jmp 05 00006 g002
Figure 3. Tier IA (a) and Tier IB (b) calls across comparable annotators. n represents the total number of variants classified as Tier IA or Tier IB in at least one annotator. Agreement in calls between all annotators is represented by the bold number in the center. Agreement in calls between pairs of annotators as well as unique calls are represented by non-bold numbers.
Jmp 05 00006 g003
Figure 4. Positive Percent Agreement (PPA) for 2-way comparisons for Tier I (a), Tier IA (b), Tier IB (c), and Tier IIC (d).
Jmp 05 00006 g004
Table 1. Input data and default filter settings across annotators. SNV—Single Nucleotide Variant; INDEL—Insertion/Deletion; TMB—Tumor Mutation Burden; MSI—Microsatellite Instability; CNV—Copy Number Variation; VAF—Variant Allele Frequency; RD—Read Depth; MAF—Minor Allele Frequency; UD—User-defined; X—indicates that the file input type is supported.
FeaturesNavify MPSOPHIAQCIFranklin
File InputVCF, Combined Variant FileFASTQVCF, Combined Variant File, CNVs, Fusions, Splice VariantsVCF
SNVsXXXX
INDELsXXXX
TMBXXX
MSIXXX
FusionsXXX
CNVsXXX
Select Default Filter Settings (for inclusion)
VAFUD≥2%≥5%≥5%
RDUDUD≥10UD
MAFUDUD≤1%≤1%
Table 2. Summary of complex-type variants available for tier comparisons across three annotators. 57 total cases covering the listed cancer types had four different complex variants classified by all three annotators.
Complex Variants Cancer Type (s)# CasesNavify
MP
SOPHIAQCI
MSI-highColorectal adenocarcinoma9IAIAIA
ALK-EML4Lung adenocarcinoma1IAIAIA
MSI-negColorectal adenocarcinoma8IBIBIIC
MSI-negColorectal adenocarcinoma
Colon squamous cell carcinoma
1IBIICIIC
MSI-negBladder urothelial carcinoma
Breast adenoid cystic carcinoma
Breast mucinous carcinoma
ER-positive positive breast cancer
Esophagus adenocarcinoma
Gastric adenocarcinoma
Head and neck squamous cell carcinoma
Her2-receptor positive breast cancer
Lung adenocarcinoma
Lung small cell carcinoma
Lung squamous cell carcinoma
Melanoma
Non-Hodgkin lymphoma
Ovarian clear cell carcinoma
Pancreatic adenocarcinoma
Prostate adenocarcinoma
Triple-receptor negative breast cancer
37IICIICIIC
ALK-EPS8Colorectal adenocarcinoma1IICIICIIC
Table 3. Subjective words and phrases exactly as published in the AMP/ASCO/CAP guidelines [3]. Bold, underlined words are considered “subjective” and require further definition by each site implementing this classification structure.
TierEvidence 1Evidence 2Evidence 3# of Subjective Words or Phrases
IA“FDA-approved therapy”“Included in professional guidelines” 1
IBWell-powered studies with consensus from experts in the field 3
IIC“FDA-approved therapies for different tumor types”Investigational therapies”Multiple, published, small studies with some consensus4
IIDPreclinicaltrials”“A few case reports without consensus 3
Disclaimer/Publisher’s Note: The statements, opinions and data contained in all publications are solely those of the individual author(s) and contributor(s) and not of MDPI and/or the editor(s). MDPI and/or the editor(s) disclaim responsibility for any injury to people or property resulting from any ideas, methods, instructions or products referred to in the content.

