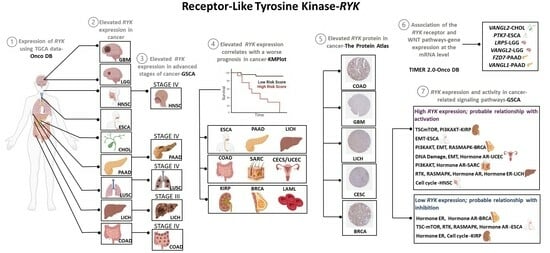
Article

Delving into the Role of Receptor-like Tyrosine Kinase (RYK) in Cancer: In Silico Insights into Its Diagnostic and Prognostic Utility

by
Jessica Alejandra Zapata-García
1,*,
Luis Felipe Jave-Suárez
2 and
Adriana Aguilar-Lemarroy
2
1
Facultad de Medicina, Decanato de Ciencias de la Salud, Universidad Autónoma de Guadalajara Zapopan, Zapopan 45129, Mexico
2
División de Inmunología, Centro de Investigación Biomédica de Occidente (CIBO), Instituto Mexicano del Seguro Social (IMSS), Guadalajara C.P. 44340, Mexico
*
Author to whom correspondence should be addressed.
J. Mol. Pathol. 2024, 5(1), 66-80; https://doi.org/10.3390/jmp5010005
Submission received: 5 December 2023 / Revised: 11 January 2024 / Accepted: 29 January 2024 / Published: 6 February 2024

Abstract

:
The RYK gene encodes a receptor-like tyrosine kinase crucial for several biological processes, including development, tissue homeostasis, and cancer. This study utilized data from the Cancer Genome Atlas Project (TCGA) to evaluate RYK expression at both mRNA and protein levels in various cancers, determine its prognostic significance, and explore its involvement in cancer-related signaling pathways. Elevated levels of RYK mRNA were identified in cholangiocarcinoma (CHOL), pancreatic adenocarcinoma (PAAD), glioblastoma multiforme (GBM), lung squamous cell carcinoma (LUSC), brain lower grade glioma (LGG), head and neck squamous cell carcinoma (HNSC), liver hepatocellular carcinoma (LICH), esophageal carcinoma (ESCA), and colon adenocarcinoma (COAD), while RYK protein levels were observed to be increased in colon adenocarcinoma (COAD), GBM, LICH, cervical and endocervical adenocarcinoma (CESC), and breast invasive carcinoma (BRCA). Additionally, RYK overexpression correlated with poorer prognosis in several cancers, including PAAD, LICH, BRCA, ESCA, COAD, and CESC. Furthermore, RYK showed a positive correlation with the upregulation of multiple receptors and coreceptors in the WNT signaling pathway in various types of cancer. In terms of cancer-related signaling pathways, RYK was found to potentially interact with DNA damage, TSC/mTOR, PI3K/AKT, EMT, RTK, RAS/MAPK, ER hormone, AR hormone, and the cell cycle. This study provides new and previously unreported insights into the role of RYK in cancer biology.

Graphical Abstract

1. Introduction

The RYK gene encodes a receptor-like protein tyrosine kinase; this molecule has essential functions in various biological processes, including development and tissue homeostasis [1]. It was first described in 1992 [2]. This receptor is a component of the WNT signaling pathways, which represent a complex cellular communication network [3]. In humans, RYK can bind different WNT ligands, such as WNT3, WNT5B, WNT1, WNT3A, WNT5A, and WNT11 through its extracellular WIF domain [4]. This triggers the activation of β-catenin-dependent or -independent signaling [5]. RYK also interacts with other WNT receptors or coreceptors, such as ROR [3], FZD7 [6], PTK7 [7,8] LRP5/6, and VANGL, which diversifies its biological function [9].
Structurally, RYK is composed of three main domains. The protein RYK consists of an N-terminal extracellular domain that contains WNT-inhibitory factor (WIF). This domain mediates RYK’s interaction with WNT ligands, allowing it to sequester these ligands. RYK also has a single-step transmembrane helix followed by an intracellular domain that contains a region rich in serine and threonine. However, the function of this region remains unknown. Finally, RYK has an intracellular pseudokinase domain that lacks kinase and nucleotide binding activity [4,10]. The biochemical aspects of RYK are closely related to its activity. Its pseudokinase domain exhibits atypical amino acid residues in its subdomains I and II, preventing ATP binding and classifying it as a putative pseudo tyrosine kinase compared to the consensus sequence of tyrosine kinases [1,2]. However, genetic analyses of RYK orthologs and paralogs in model organisms have revealed WNT-responsive regulatory functions in various developmental and pathological contexts [11].
RYK has been observed to have a pathological association with the nervous system in diseases. In a C. elegans model, the intracellular region of the gene was found to inhibit the neuroprotective activity of the transcription factor FOXO in the early phases of Huntington’s disease [12]. Furthermore, RYK was found to be upregulated in the motor neurons and ventral white matter of a mouse model of amyotrophic lateral sclerosis [13]. Additionally, a human monoclonal antibody against RYK has been developed to block WNT5A-stimulated regulation, modulating the development and homeostasis of neurite outgrowth in humans [11].
RYK is highly expressed in various malignancies, including mesothelioma [14], small cell lung cancer [15], gastric cancer [16], glioma [17], glioblastoma [18], liver cancer [16], acute leukemias [10], and breast cancer [19]. Conversely, it has been observed that treatment with antitumor agents, such as osimertinib in lung cancer-derived cells [20], and Galectin-9 in pancreatic cancer [21] can induce high expression of RYK. Furthermore, in head and neck squamous cell carcinoma [22], high expression of the gene is correlated with a worse probability of survival, in advanced stages of the disease.
Therefore, given the limited elucidation of the precise mechanisms through which this receptor operates at the molecular and cellular levels in cancer, the aim of this study was to identify changes in RYK expression in cancer using data from RNA sequencing, immunohistochemistry, and reverse phase protein array (RPPA). The expression of this gene also was correlated with overall survival and its association with ten signaling pathways implicated in this disease was explored.

2. Materials and Methods

2.1. Analysis of RYK Expression in Cancer-Derived RNA Data Sets

To determine the messenger RNA expression of RYK, we utilized OncoDB, an online tool that provides data on thirty-four different types of cancer, accessible at https://academic.oup.com/nar/article/50/D1/D1334/6413597?login=false (last accessed on 25 October 2023) [23]. Data from cancer and non-cancer tissues were obtained from The Cancer Genome Atlas (TCGA) and the GTEx projects, respectively [24]. Differential expression analysis was conducted by comparing tumor samples to normal samples using Student’s t-test. Data normalization was carried out using the transcripts per million (TPM) method, and the Log2 fold change was calculated. The Boxplot Plot in Figure 1A–I was created using the ggpubr package in version 0.6.0 (https://cran.r-project.org/web/packages/ggpubr/index.html, last accessed on 1 November 2023) [25] in R version 4.3.1 (https://cran.r-project.org/bin/windows/base/old/, last accessed on 1 November 2023) [26].

2.2. RYK Expression in Cancer Subtypes RNA Data Sets

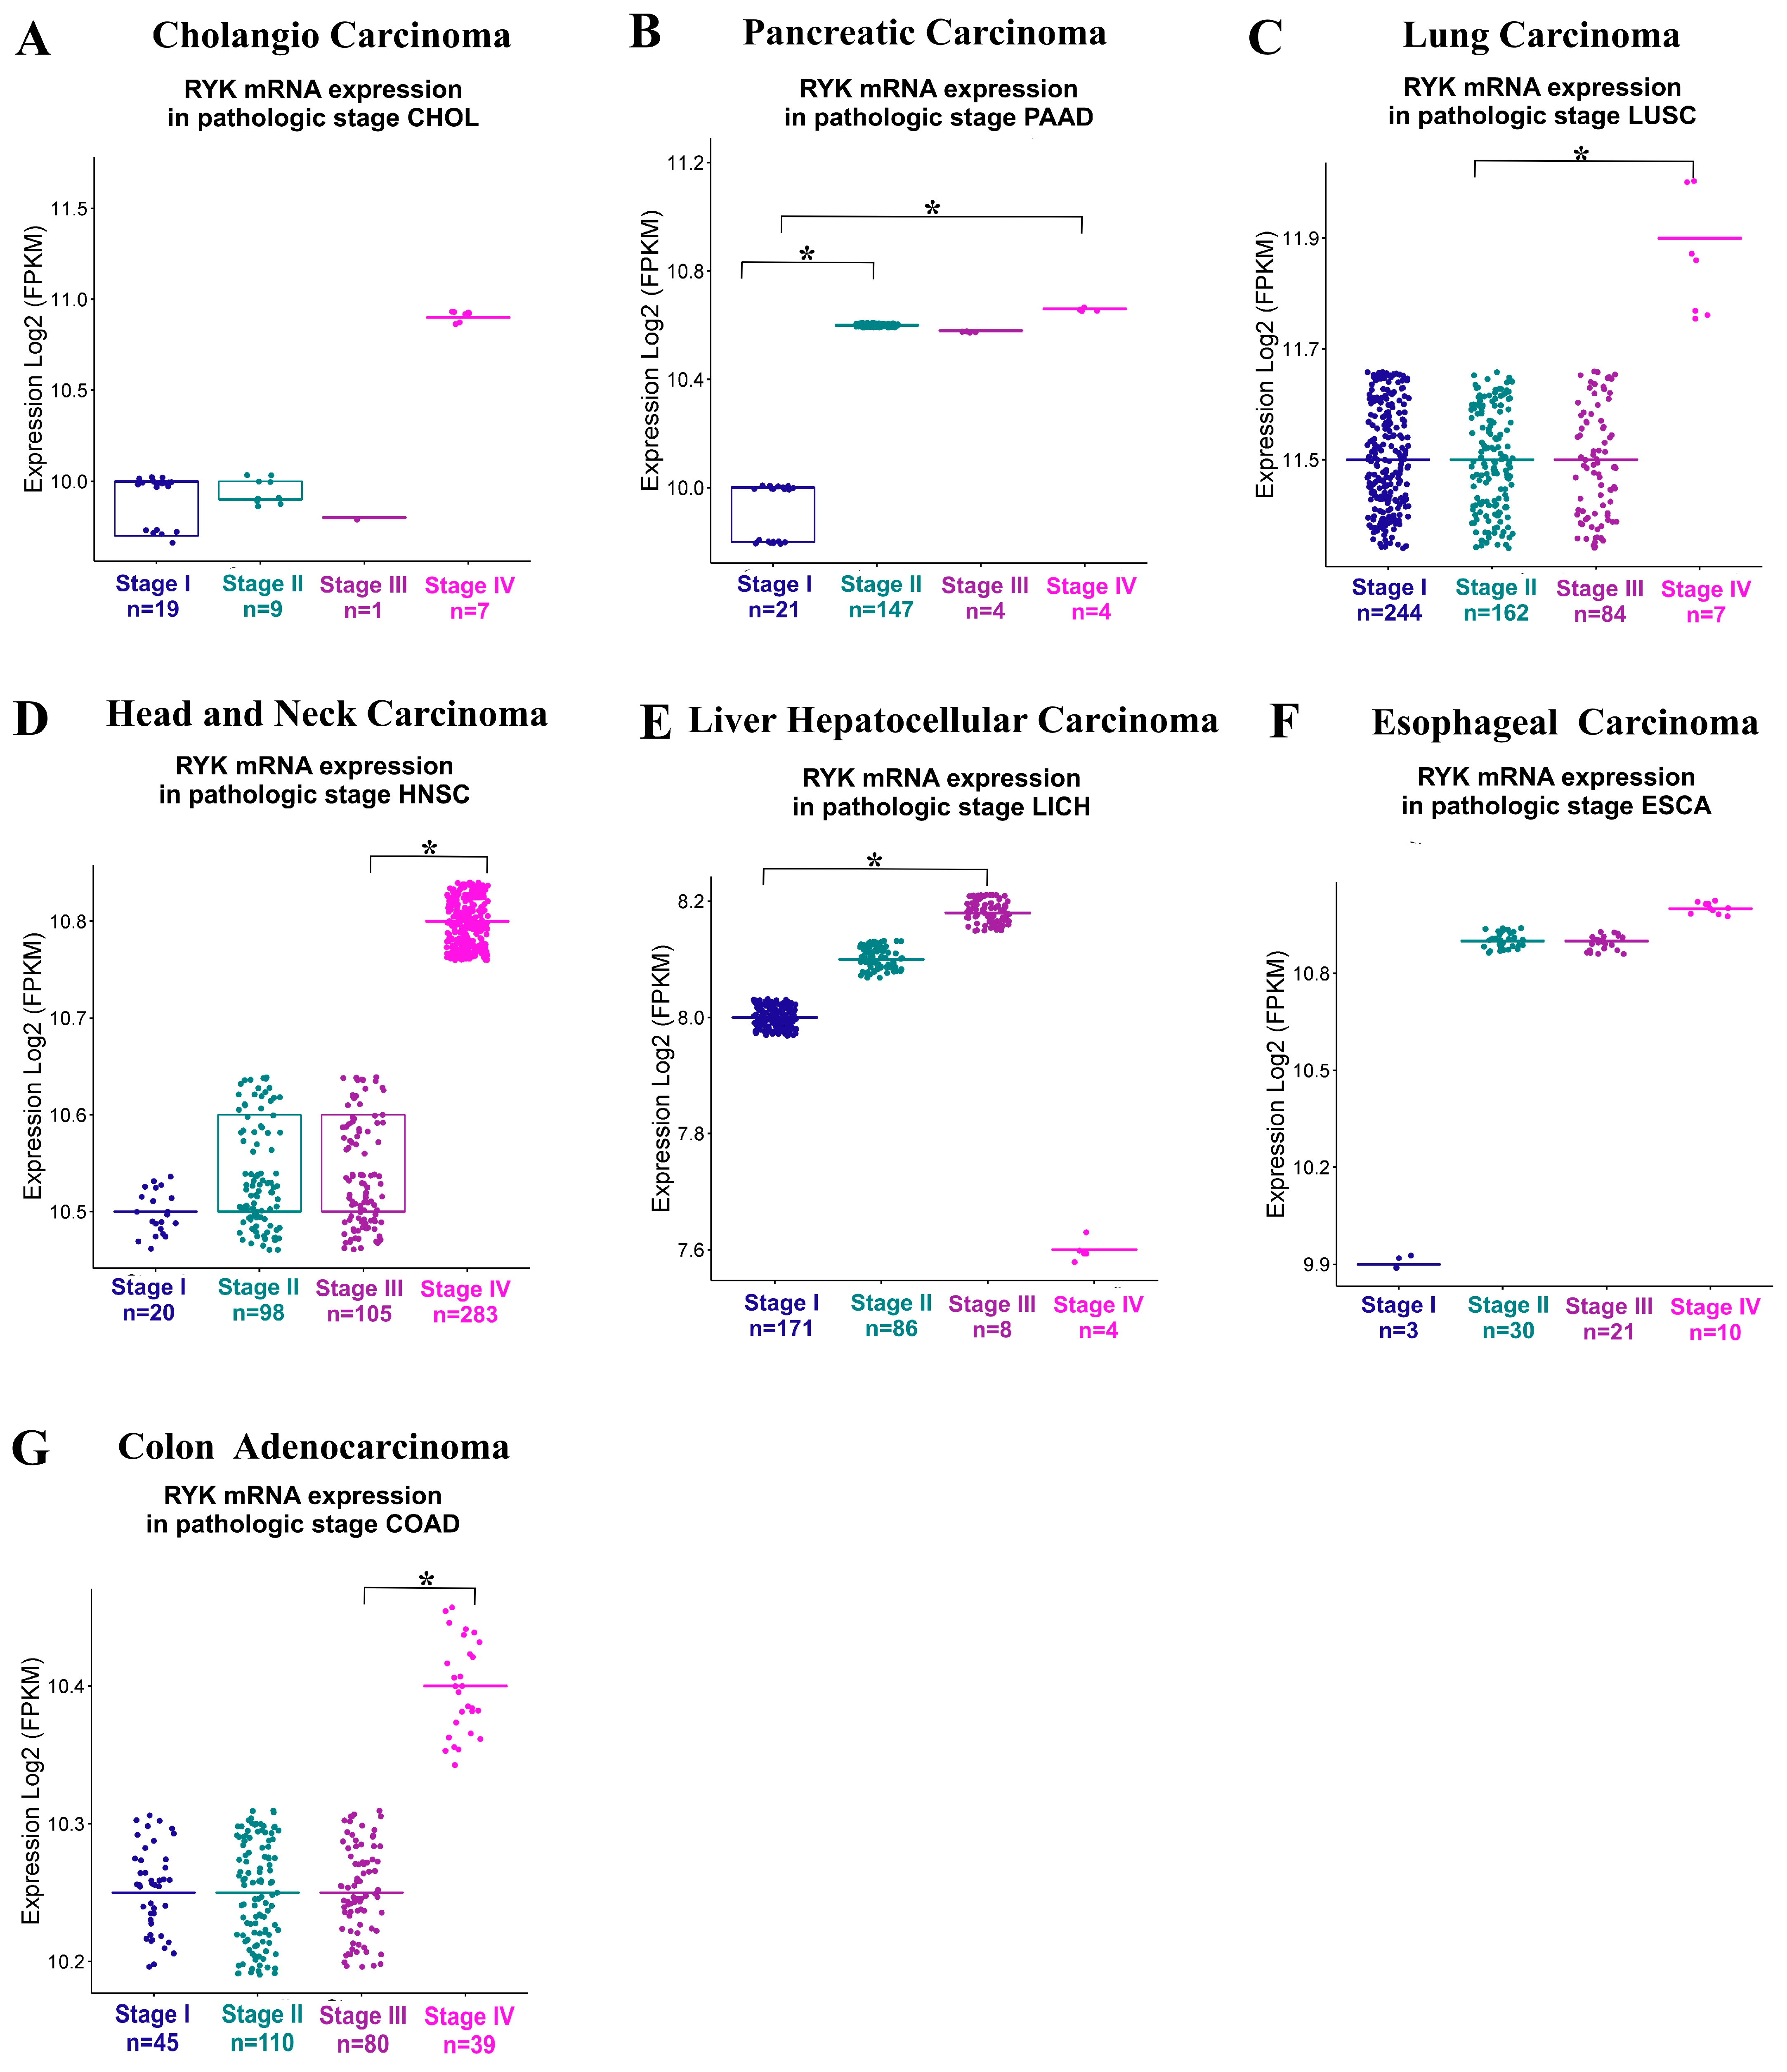
To evaluate RYK expression in cancer subtypes, we utilized the Gene Set Cancer Analysis (GSCA) online tool, accessible at http://bioinfo.life.hust.edu.cn/GSCA/#/expression (last accessed on 6 November 2023) [27,28]. The calculation of mRNA expression was derived from fusion by a sample barcode in Fragments per Million Kilobase (FPKM). Statistical comparisons between groups were performed using the ANOVA test, with significance set at p < 0.05, as shown in Figure 2A–G.

2.3. Protein Expression Analysis

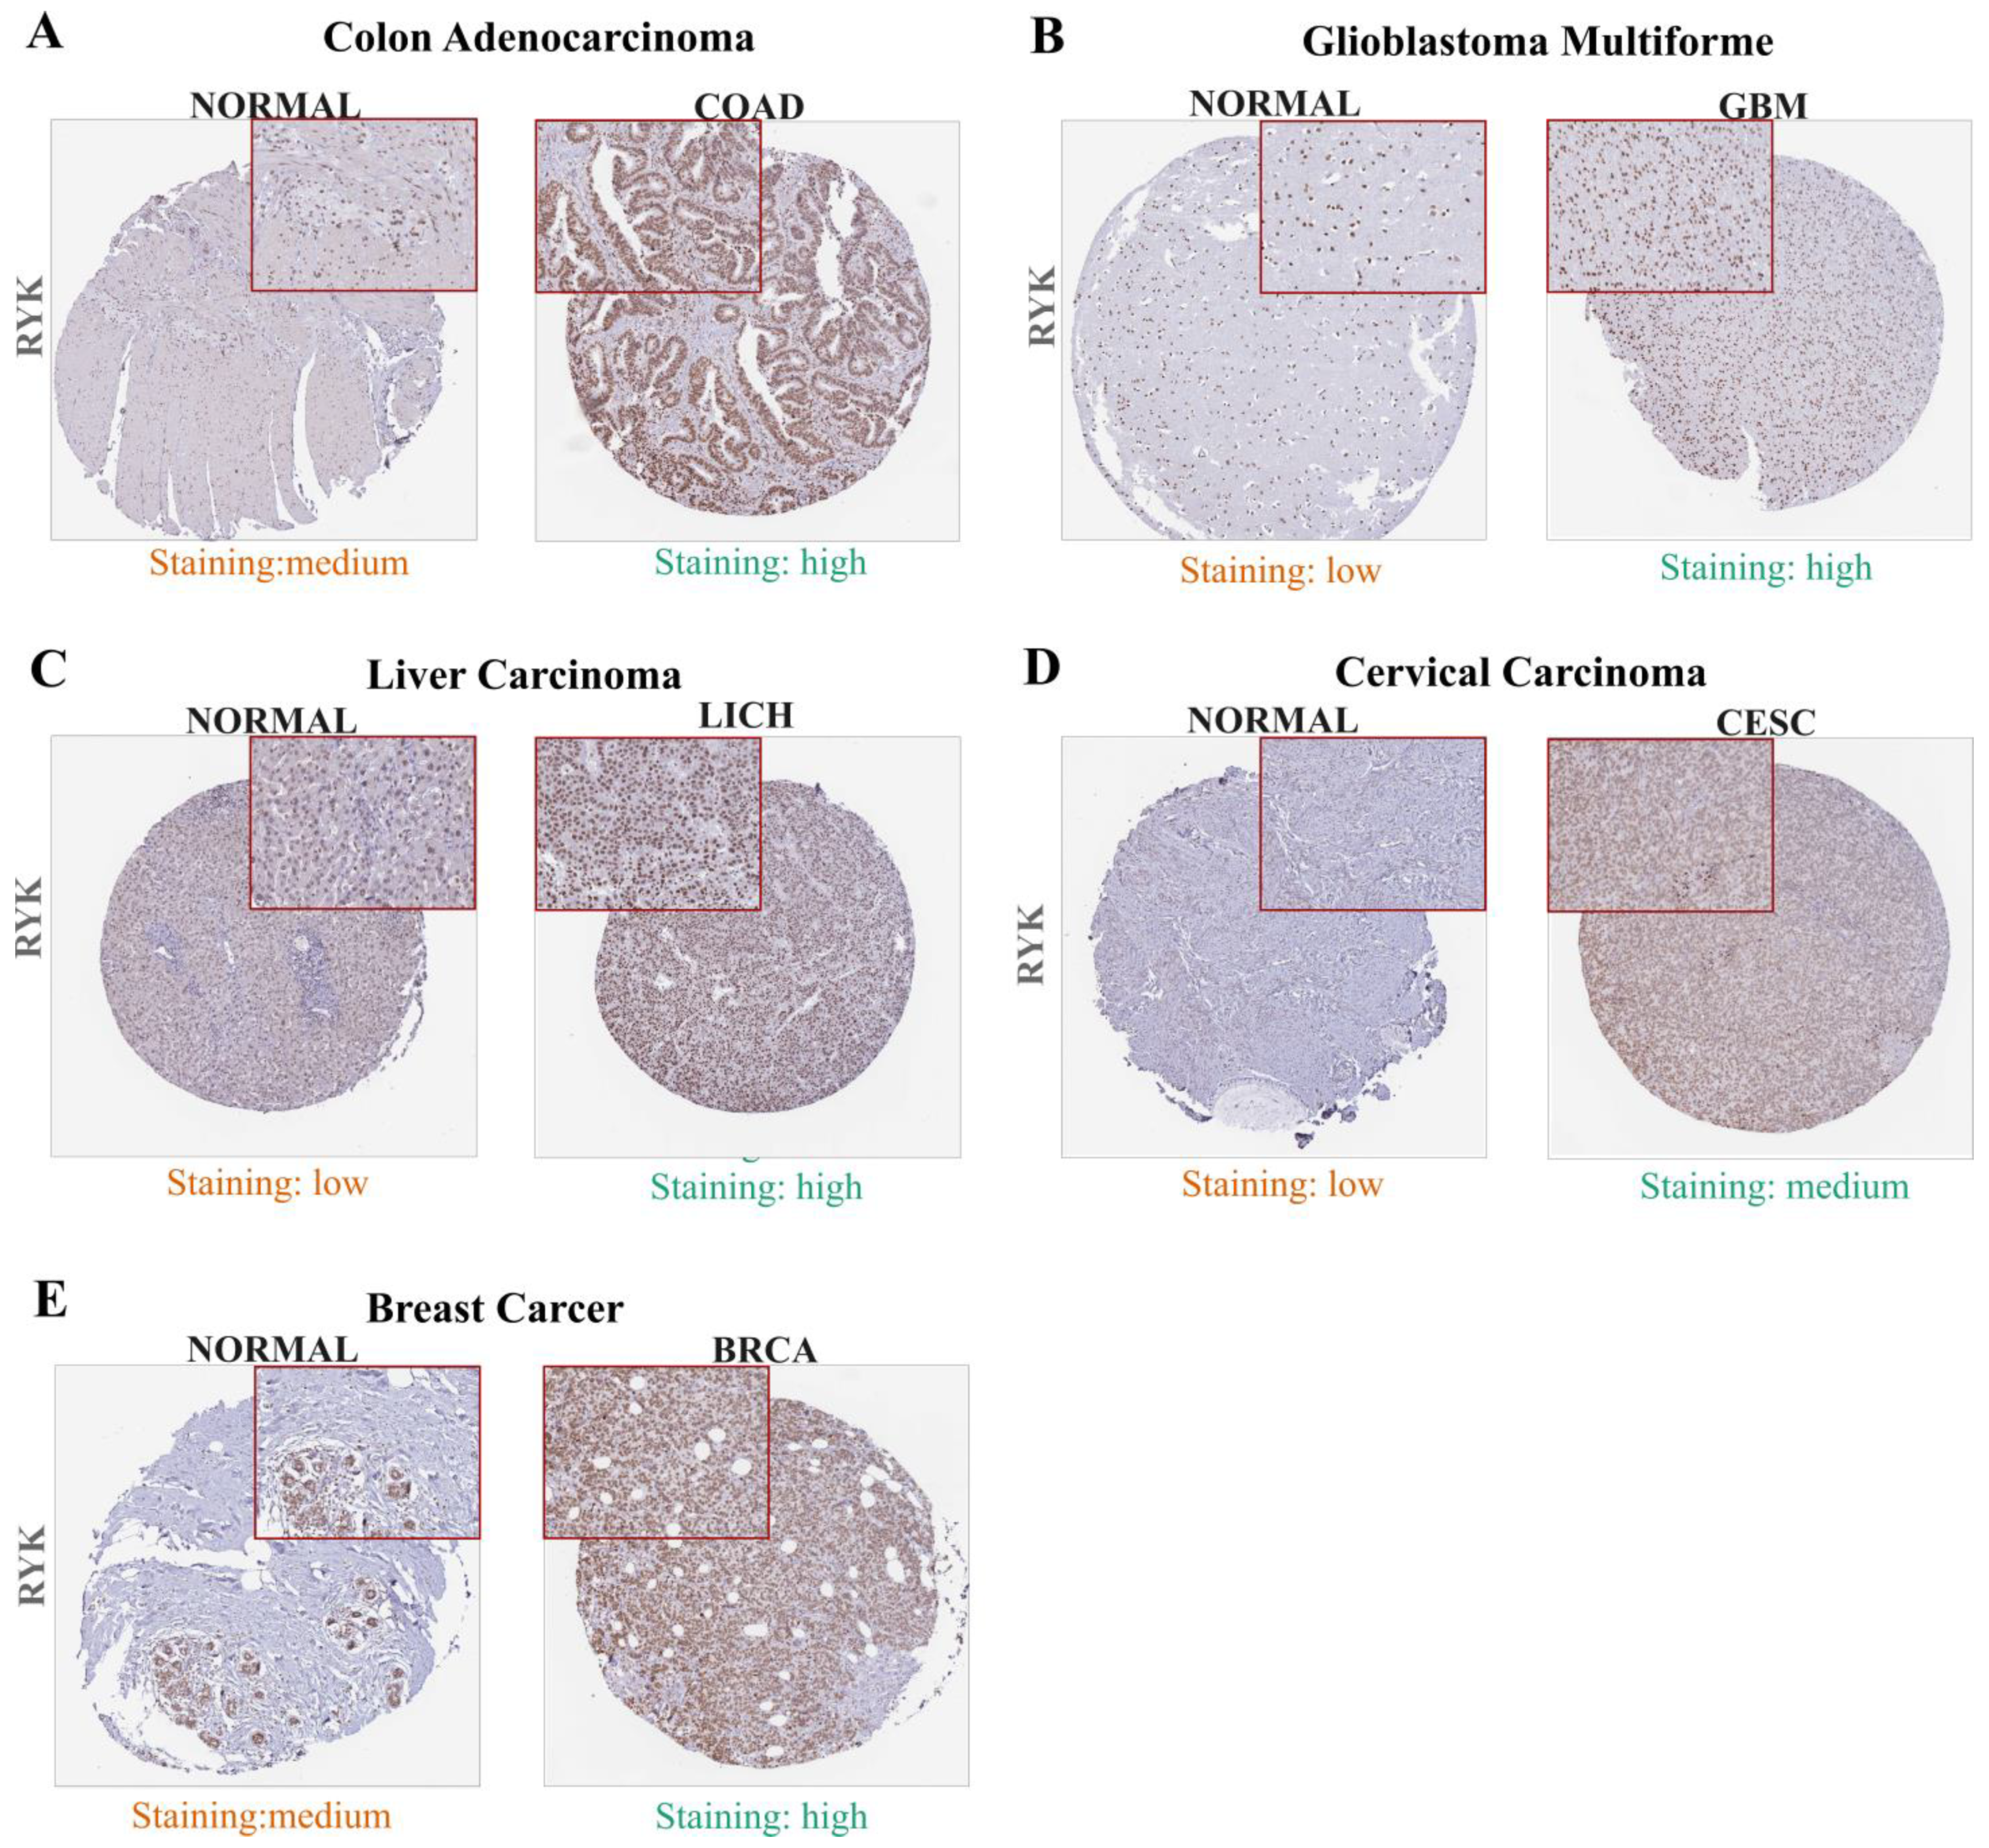
For this study, we utilized the Human Protein Atlas website, available at https://www.proteinatlas.org (last accessed on 25 October 2023), to identify the expression pattern of the protein “Receptor-like tyrosine kinase” in tumor tissue and non-disease tissue. All samples used for the analysis are part of the sample collection managed by the Uppsala Biobank, available at http://www.uppsalabiobank.uu.se/en/ (last accessed on 3 November 2023) [29,30]. Immunohistochemistry was analyzed by pathologists who scored the images based on staining intensity and the fraction of cancer cells or normal cells positive for the polyclonal Anti-RYK antibody (Cat. No. HPA045503, Zymo Research, Irvine, CA, USA), which recognizes an epitope of the intracellular domain of the receptor. The results were summarized as high, medium, low, or non-detected expression, as shown in Figure 3A–E.

2.4. Survival Analysis

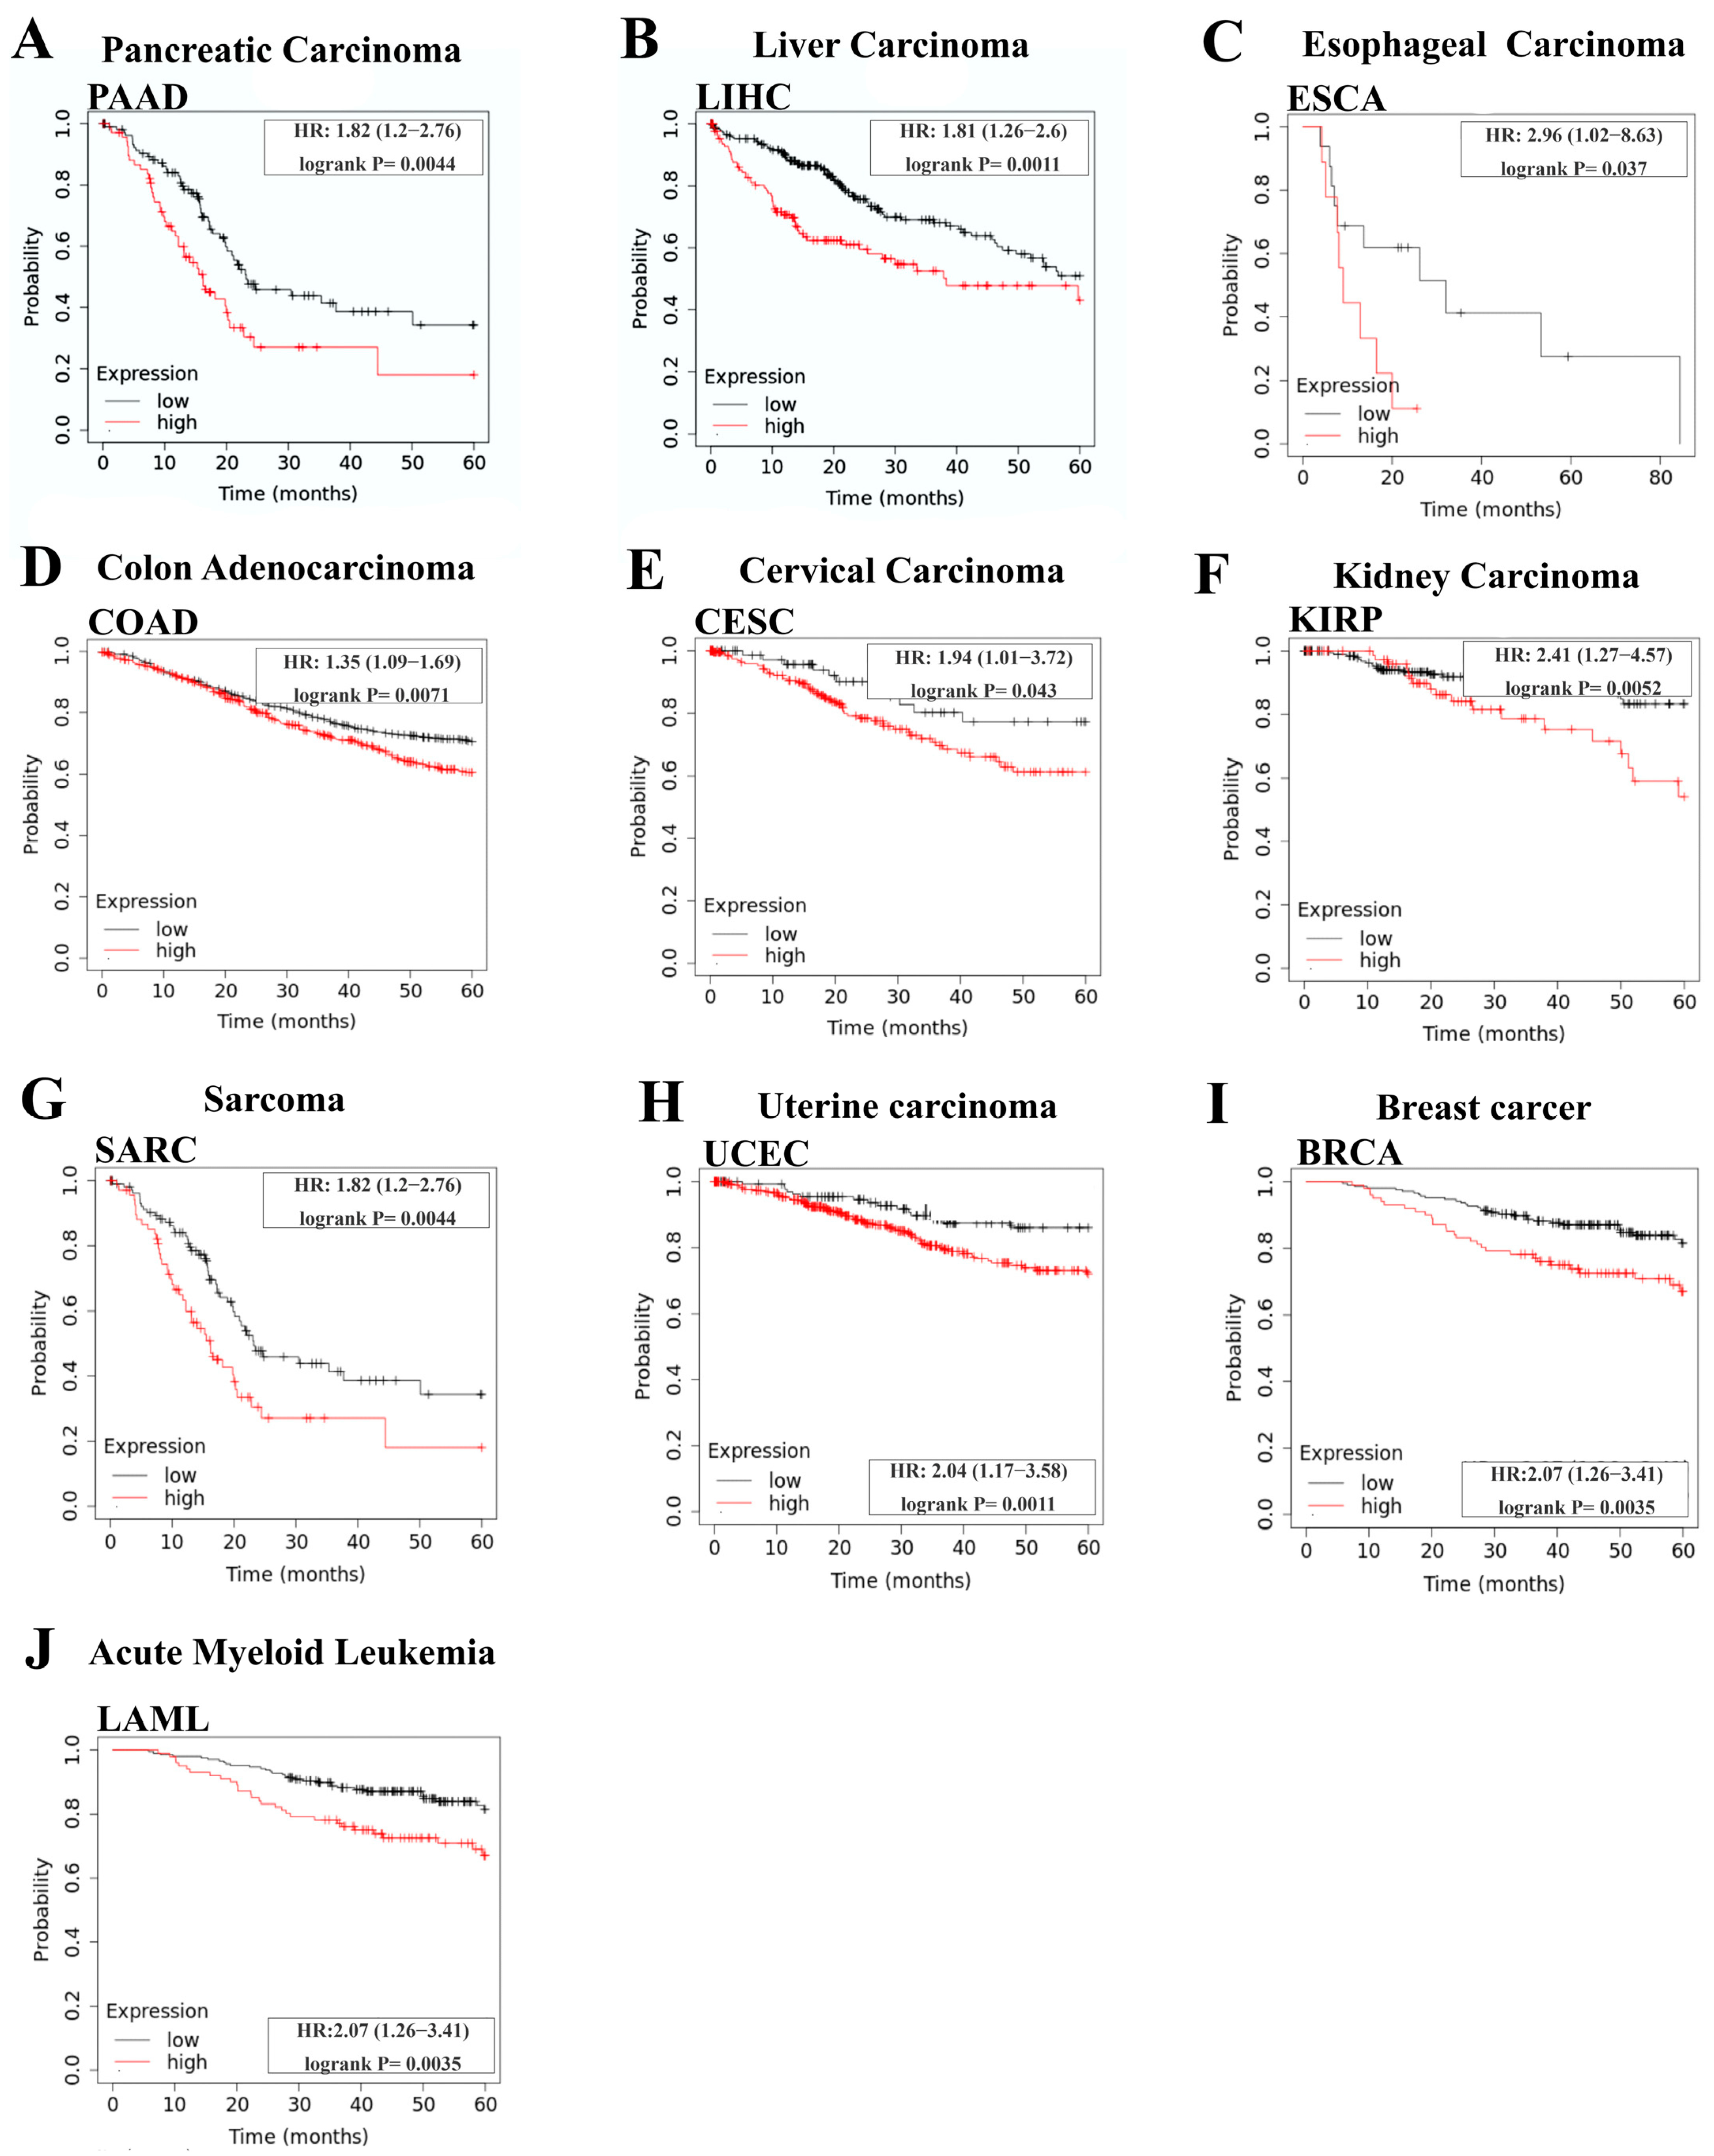
The association between overall survival and RYK gene expression was assessed across various types of cancer using the online tool KMPlot, which is available at https://kmplot.com/analysis/index.php?p=termsofuse (last accessed on 25 October 2023). Survival calculations were based on data from all patients during 60-month follow-up across different stages of each type of cancer. The platform uses a Kaplan–Meier test and then applies the log-rank and Cox regression test to assess the significance of the difference between the groups with high and low gene expression [31]. All survival curves presented in Figure 4A–J were statistically significant, with a p-value < 0.05.

2.5. Correlation and Expression of WNT Pathway Receptors and Ligands

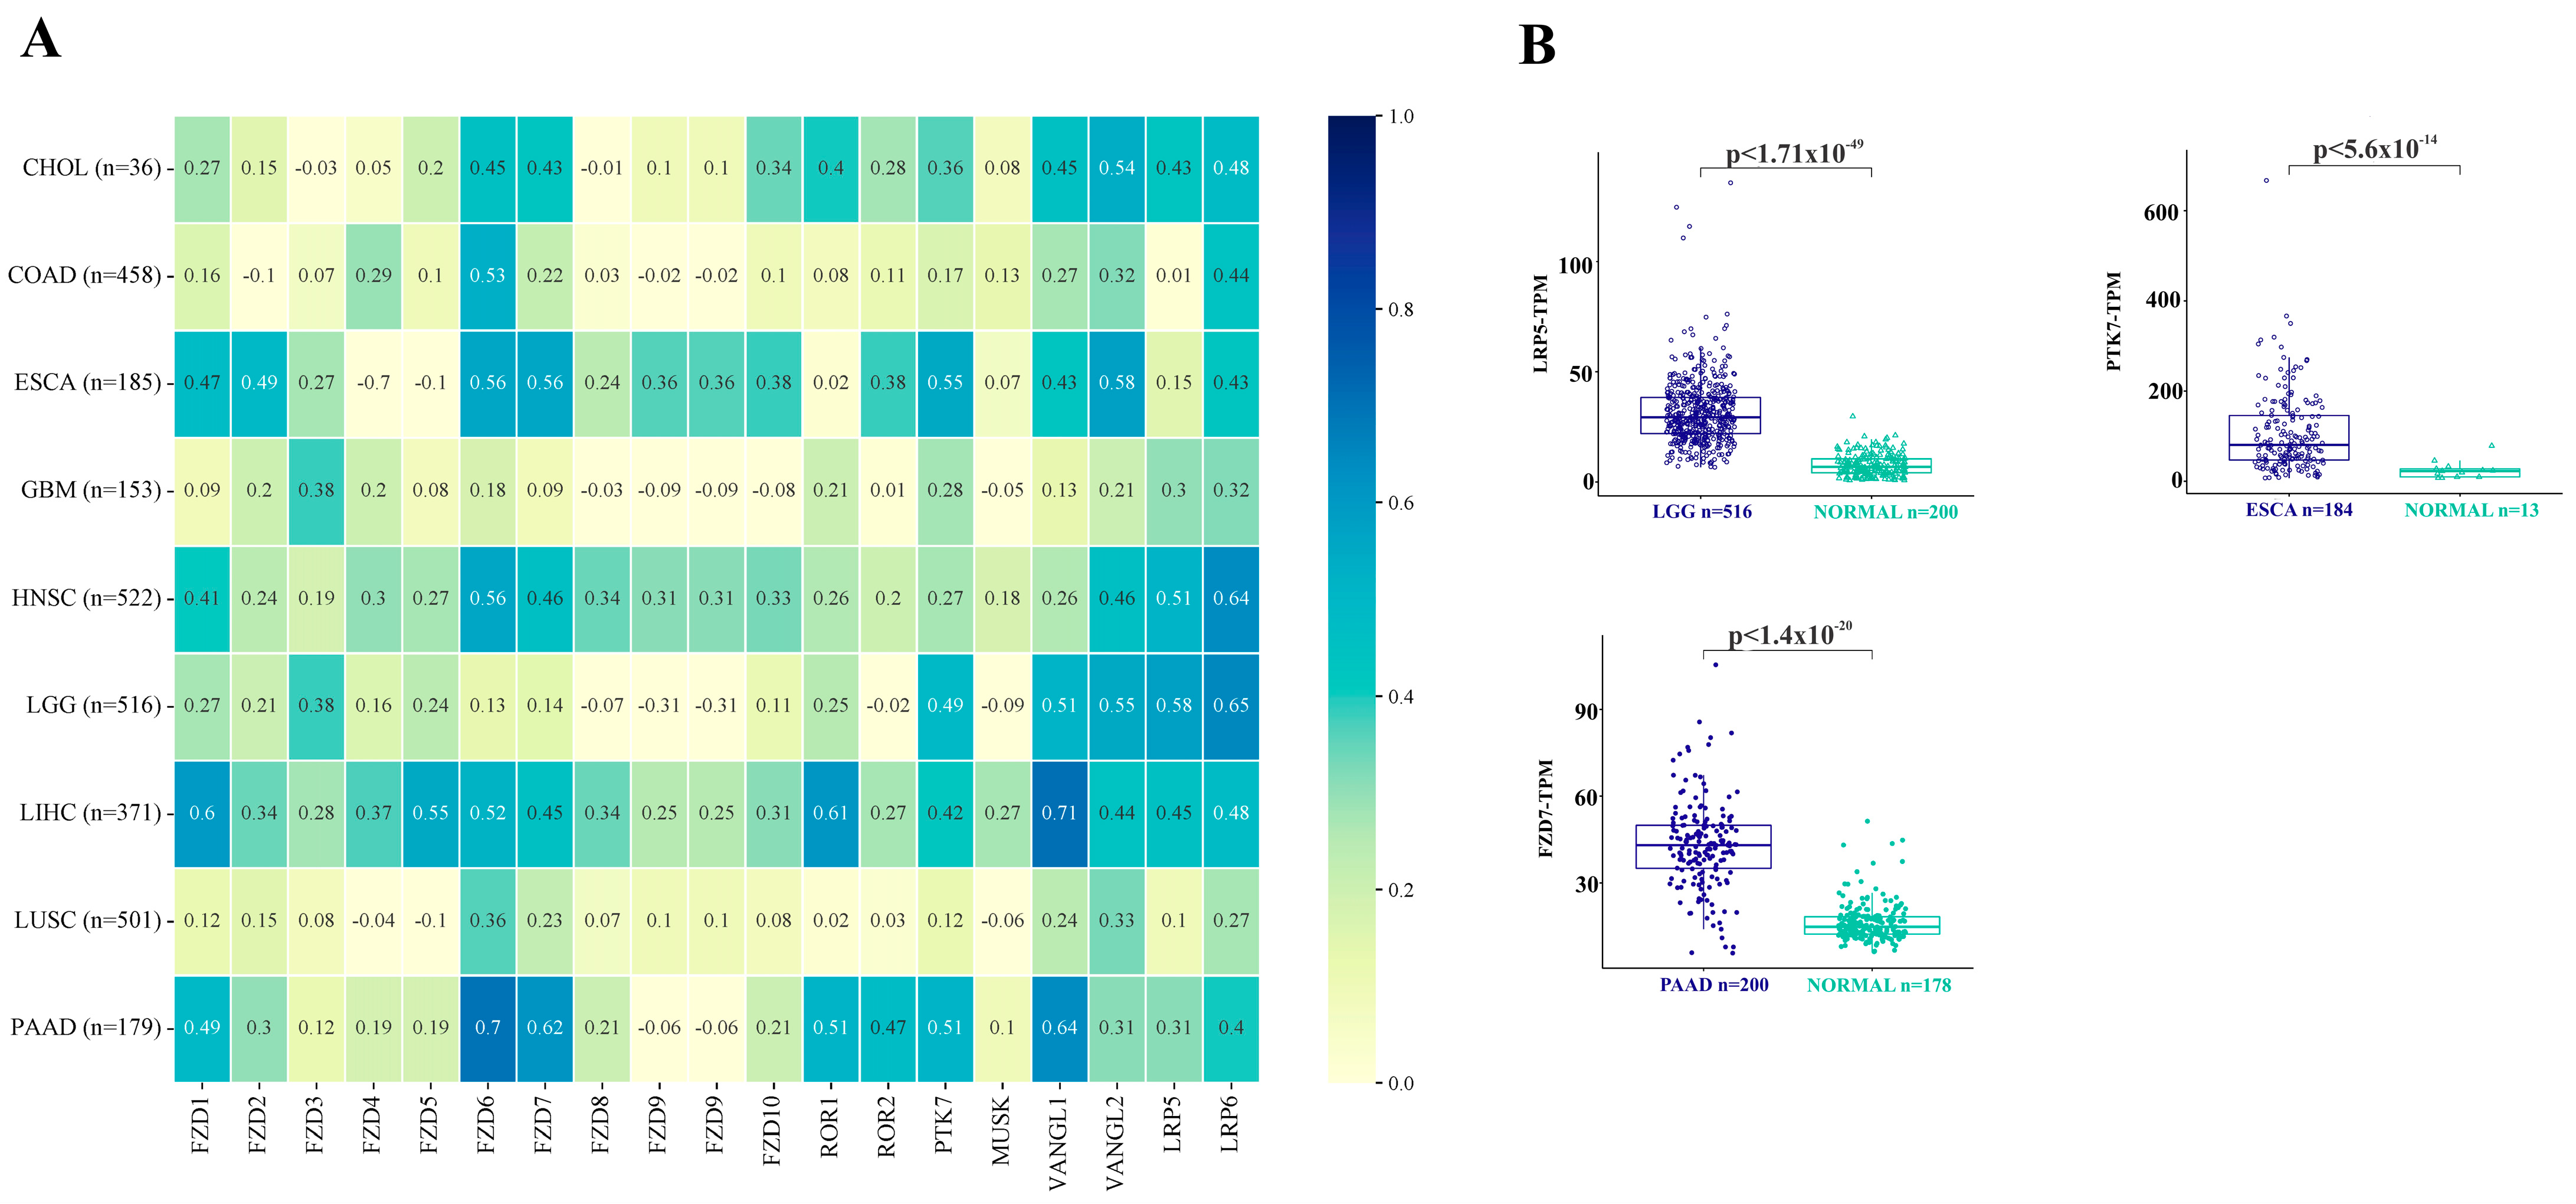
The correlation between RYK and the receptors Frizzled, MUSK, or coreceptors ROR1, ROR2, PTK7, VANGL1, VANGL2, LRP5, and LRP6—as well as 19 ligands of the WNT signaling pathways in cancer-derived tissues, shown in Figure 5A,B—was calculated using the online tool TIMER 2.0, available at http://timer.cistrome.org/ (last accessed on 14 October 2023) [32]. Additionally, we obtained the correlation coefficients for several receptors of interest, from adjacent non-diseased tissues using data from GEPIA online tool, accessible at http://gepia.cancer-pku.cn/ (last accessed on 4 January 2023). The results can be found in Supplementary Figure S1A–C, [33]. Both platforms utilize data from The Cancer Genome Atlas (TCGA) project. The raw counts and transcripts per million (TPM) were extracted in order to apply a Spearman correlation between the genes of interest, obtaining correlation coefficients (Rho values). Only correlations with a p-value < 0.05, were considered statistically significant.
The heatmap shown in Figure 5A was generated using the R package Pheatmap available at https://cran.r-project.org/web/packages/pheatmap/index.html, (last accessed on 10 October 2023) [34], and R version 4.3.1 available at https://cran.r-project.org/bin/windows/base/old/, (last accessed on 12 October 2023) [26].

2.6. Expression and Relation of RYK with Cancer-Related Pathways

This section examines the expression of RYK and its association with the activation or inhibition of ten signaling pathways commonly implicated in cancer, including TSC/mTOR, RTK, RAS/MAPK, PI3K/AKT, Hormone ER, Hormone AR, EMT, DNA damage response, cell cycle, and apoptosis. The analysis was conducted using the online tool Gene Set Cancer Analysis (GSCA), available at http://bioinfo.life.hust.edu.cn/GSCA/#/expression (last accessed on 6 November 2023) [27,28].
The analysis data from reverse phase protein array (RPPA) are shown in Figure 6A–D, Figures S2A–P and S3A–H. Briefly, relative protein levels were determined using the median values of all samples. The gene activity score within the pathways was calculated by summing the relative protein levels of all positive regulatory components while subtracting those of negative regulatory components, following the methodology described by R. Akbani et al. [35]. The difference in pathway activity score (PAS) was calculated using Student’s t-test, and the resulting p-values were adjusted using the False Discovery Rate (FDR). A significance level of FDR ≤ 0.05 was considered statistically significant.
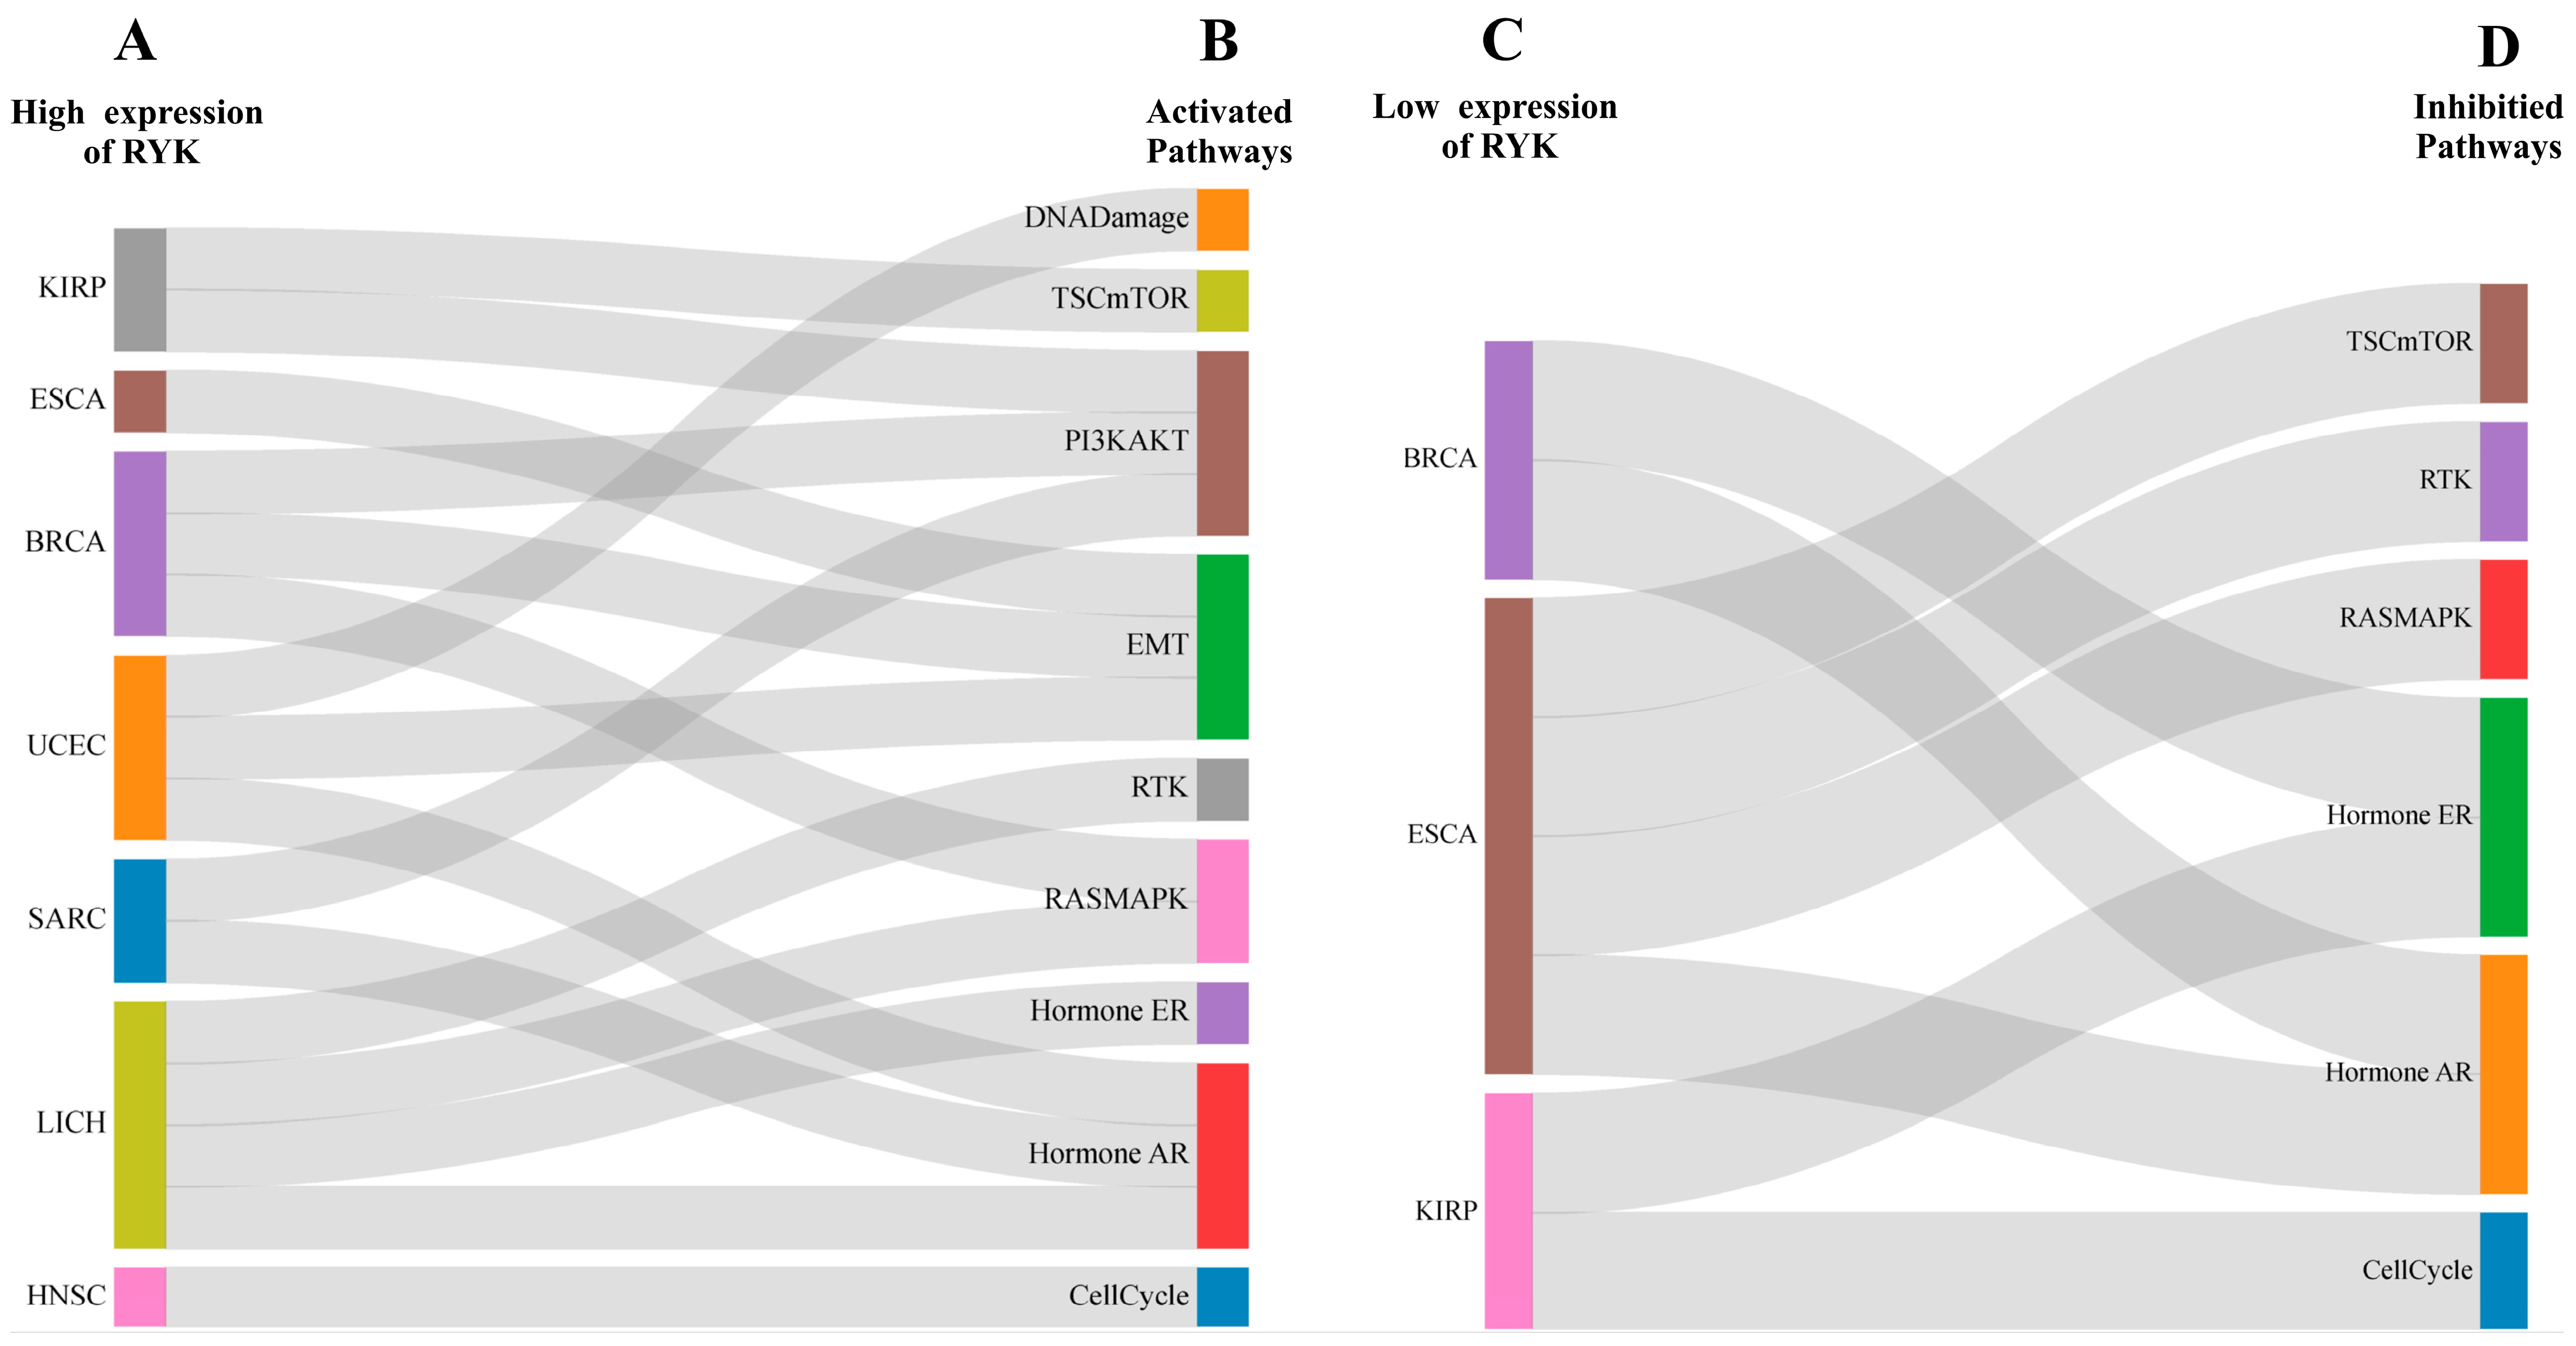
To create the Sankey Plot, shown in Figure 6A–D, we used the ggplot2 package, available at https://cran.r-project.org/web/packages/ggplot2/index.html, (last accessed on 25 October 2023) [36], as well as the alluvial package, available at https://cran.r-project.org/web/packages/alluvial/vignettes/alluvial.html, (last accessed on 25 October 2023) [37], in R version 4.3.1 available at https://cran.r-project.org/bin/windows/base/old/ (last accessed on 25 October 2023) [26].

3. Results

3.1. RYK Overexpression in Cancer

To identify significant changes in RYK expression across various cancer types, we utilized the online tool OncoDB, as described in the Materials and Methods section. In Figure 1A–I, a statistically significant upregulation of RYK is evident in nine different cancer types when compared to non-diseased samples. The cancer type with the highest fold change was cholangiocarcinoma (CHOL) (Figure 1A), followed by pancreatic adenocarcinoma (PAAD) (Figure 1B), glioblastoma multiforme (GBM) (Figure 1C), lung squamous cell carcinoma (LUSC) (Figure 1D), brain lower grade glioma (LGG) (Figure 1E), head and neck squamous cell carcinoma (HNSC) (Figure 1F), liver hepatocellular carcinoma (LICH) (Figure 1G), esophageal carcinoma (ESCA) (Figure 1H), and colon adenocarcinoma (COAD) (Figure 1I).
After identifying the cancer types with elevated RYK expression, our subsequent investigation aimed to compare the expression levels across different cancer stages within each tumor subtype. As depicted in Figure 2A–G, RYK displayed significantly higher expression in stage IV of PAAD (Figure 2B) (although it was not statistically significant), LUSC (Figure 2C), HNSC (Figure 2D), and COAD (Figure 2G). Notably, in the case of LICH, the highest expression was observed in stage III. In contrast, for CHOL (Figure 2A) and ESCA (Figure 2F), there is no significant difference in gene expression among disease stages. In relation to GBM and LGG, the platform lacked sufficient data to evaluate the expression of RYK by stages.

3.2. Overexpression of Receptor-like Tyrosine Kinase in Cancer- and Non-Cancer-Derived Tissues

To investigate the expression patterns of the receptor-like tyrosine kinase protein, we examined representative immunohistochemical images of cancer- versus non-cancer-derived tissues provided by the Human Protein Atlas (HPA), as shown in Figure 3A–E. The receptor-like tyrosine kinase protein was found to be overexpressed in specific cancer-derived tissues, such as colon adenocarcinoma (COAD) (Figure 3A), glioblastoma multiforme (GBM) (Figure 3B), liver hepatocellular carcinoma (LICH) (Figure 3C), cervical squamous cell carcinoma and endocervical adenocarcinoma (CESC) (Figure 3D), and breast invasive carcinoma (BRCA) (Figure 3E), and particularly in the nucleus rather than the cytoplasm or cell membrane.

3.3. Prognostic Value of RYK in Cancer

After identifying upregulated RYK expression in the nine types of cancer mentioned earlier (Figure 1A–I), we investigated whether there is a correlation between high RYK expression and a worse probability of overall survival (OS). Our findings, as shown in Figure 4A–J, indicate that high RYK expression is significantly correlated (p < 0.05) with a worse probability of overall survival in four of the nine types of cancer: PAAD (Figure 4A), LICH (Figure 4B), ESCA (Figure 4C), and COAD (Figure 4D).
Furthermore, we were interested in determining the impact of RYK expression on overall survival in cancer types where RYK did not exhibit upregulation, as determined using the online tool OncoDB. To investigate this, we considered and analyzed all cancer types available in the KMPlot Project and found a correlation with worse OS in cervical squamous cell carcinoma (CESC) (Figure 4E), kidney renal papillary cell carcinoma (KIRP) (Figure 4F), sarcoma (SARC) (Figure 4G), uterine corpus endometrial carcinoma (UCEC) (Figure 4H), and breast invasive carcinoma (BRCA) (Figure 4I). Additionally, in acute myeloid leukemia (LAML), although this correlation was not established in the bone marrow, it was evident in the blood (see Figure 4J).

3.4. Correlation of the WNT Signaling Pathway Receptors and Ligands with RYK Expression in Cancer- and Non-Cancer-Derived Samples

As RYK functions as a coreceptor of the WNT signaling pathways, we aimed to investigate its relationship with other receptors or ligands involved in these pathways, particularly in different types of cancer. This exploration aimed to elucidate the potential molecular mechanisms through which RYK contributes to disease promotion. Using cancer data from The Cancer Genome Atlas (TCGA) project and the TIMER 2.0 online tool, as described in the Materials and Methods section, we analyzed cancer types where RYK exhibited high expression (Figure 1A–I) or where the gene correlated with a worse prognostic value (Figure 4A–J).
Figure 5A illustrated the correlation coefficients (Rho) between RYK and receptors or coreceptors of the WNT signaling pathways. The Rho values range from 0.5 to 0.7 for receptors or coreceptors, and from 0.3 to 0.5. Therefore, we focused on the correlations between RYK and other receptors or coreceptors. To enhance the comprehension of these correlations, we calculated the reference values of the correlation between RYK and the same receptors or coreceptors in non-diseased tissues. The correlations with coefficients lower than those obtained in cancer were LRP5 in brain tissue, PTK7 in esophageal tissue, and FZD7 in pancreas tissue, as shown in Supplementary Figure S1A–C.
Our next step was to evaluate whether the expression of these receptors was maintained in the types of cancer where we found the differences. Our findings indicate an elevated expression of LRP5 in brain lower grade glioma (LGG), PTK7 in esophageal carcinoma (ESCA), and FZD7 in pancreatic adenocarcinoma (PAAD) compared to normal tissues, as shown in Figure 5B.

3.5. Association of RYK with Ten Cancer-Related Signaling Pathways

Our analysis of the potential relationship of RYK with other coreceptors, receptors, or ligands within the WNT signaling pathways led us to investigate its possible involvement in other signaling cascades that are widely associated with the initiation and promotion of cancer. The analysis has revealed significant findings. RYK has demonstrated high expression levels and potential links to the activation of DNA damage in uterine corpus endometrial carcinoma (UCEC), TSC/mTOR in kidney renal papillary cell carcinoma (KIRP), PI3K/AKT in KIRP, breast invasive carcinoma (BRCA), and sarcoma (SARC), and epithelial–mesenchymal transition (EMT) in esophageal carcinoma (ESCA). The following pathways were analyzed in various types of cancer. BRCA, UCEC, Receptor Tyrosine Kinase (RTK) in liver hepatocellular carcinoma (LIHC), RAS/Mitogen-Activated Protein Kinase (RAS/MAPK) in BRCA and LIHC, Hormone Estrogen Receptor (ER) in LIHC, Hormone Androgen Receptor (AR) in UCEC, SARC, and LIHC, and cell cycle in head and neck squamous cell carcinoma (HNSC) (refer to Figure 6A,B and Figure S2A–P). In contrast, reduced RYK expression seems to be associated with inhibitory effects on various signaling pathways and related cancer types. These include TSC/mTOR, RTK, and RAS/MAPK in ESCA, ER hormone in BRCA and KIRP, AR hormone in BRCA and ESCA, and cell cycle in KIRP. These findings are illustrated in Figure 6C,D and Figure S3A–H.

4. Discussion

RYK is member of the Receptor Tyrosine Kinases (RTKs) family, which are central regulators of pivotal developmental, physiological, and pathological signaling pathways [38,39]. These receptors interact with various ligands of the WNT signaling pathways, triggering their activation [40,41], and the dysregulation of these signaling pathways is a hallmark of tumorigenesis [42,43]. RYK is known to be highly expressed in various types of cancer including mesothelioma [14], lung cancer [20], small cell lung cancer [15], gastric cancer [16], chronic leukemia [44], acute leukemias [10], glioma [17], glioblastoma [18], breast cancer [19], head and neck squamous cell carcinoma [22], liver cancer [16], and pancreatic cancer [21].
However, it is unclear whether RYK is also associated with other types of cancer, and little is known about its molecular regulation in the tumor context. Therefore, in this study, to the best of our knowledge, we conducted the first bioinformatic analysis of this molecule with this objective. Our analysis utilized information derived from thirty-four different types of cancer, using OncoDB [23], and data sourced from The Cancer Genome Atlas Project (TGCA).
Figure 1A–I illustrated that RYK expression is significantly elevated in PAAD, CHOL, GBM, LGG, LICH, ESCA, HNSC, LUSC, and COAD compared to non-tumor samples. Furthermore, our analysis identified that in five of these cancer types, gene expression increased in stage III (LICH) or stage IV (PAAD, HNSC, LUSC, and COAD) (Figure 2A–G), suggesting a potential oncogenic role of RYK in disease progression. Our findings are consistent with previous studies on GBM [18], LGG [17], ESCA [45], HNSC (specifically in the larynx) [46], and LUSC [15], which also reported high expression of RYK. It is worth noting that our study is the first to identify such elevated expression in PAAD, CHOL, or COAD.
In this research, we were also keen to explore whether RYK expression remained elevated at the protein level in specific cancer types. Our findings reveal that, in comparison to non-diseased tissues, the receptor-like tyrosine kinase is overexpressed in COAD, GBM, LICH, CESC, and BRCA (refer to Figure 3A–E). Consequently, we believe that RYK may hold diagnostic value not only at the messenger RNA level but also at the protein level.
In accordance with our staining analysis, we found that this protein could be located in the nucleus rather than the cytoplasm. This is contrary to our initial expectations, given its receptor nature. Previous studies in neurites have shown that the intracellular domain of the receptor is cleaved by a c-secretase when stimulated by WNT3A, leading to its release into the cytoplasm and subsequent translocation to the nucleus [47]; however, the precise mechanism by which this occurs is not yet fully elucidated. In mesothelioma, researchers have described that progranulin promotes the ubiquitination and endocytosis of RYK, primarily through pathways enriched with caveolin-1 [14]. However, this information needs experimental validation.
Based on these findings, it is noteworthy that not all types of cancer with high RYK expression at the messenger RNA level exhibit the same pattern at the protein level. Specifically, CESC and BRCA showed elevated RYK expression at the protein level despite lower mRNA expression. These variations can be attributed to specific mechanisms governing transcription and translation processes, respectively. For example, low levels of messenger RNA may be linked to degradation and a reduced replication rate [48]. Meanwhile, reduced protein levels could be associated with post-transcriptional modifications and the protein’s half-life in vivo [49].
According to the Kaplan–Meier survival curves depicted in Figure 4A–J, our findings indicate that RYK holds prognostic value in ten different cancer types. Specifically, a high expression of RYK is significantly associated with a poorer survival probability in PAAD, LICH, ESCA, COAD, CESC, KIRP, SARC, UCEC, and BRCA. However, there was no correlation observed in bone marrow LAML, but a worse prognostic value was found at the blood level.
Our investigation of liver cancer (LICH) and breast cancer (BRCA) cases is supported by existing research, providing valuable context for our findings. Previous studies suggest that RYK is involved in the promotion of metastasis in liver cancer, [16]. Similarly, in breast cancer, there is a correlation between high RYK expression and traits associated with EMT and invasiveness [19]. In the case of soft tissue sarcoma (SARC), prior research has highlighted a connection between elevated genetic expression of RYK and an unfavorable prognostic outcome [50]. However, our work is limited in that we have not validated these findings in patient-derived samples from the specific cancer types exhibiting changes. This is an important aspect that we aim to address in future research.
As previously mentioned, RYK is a receptor for both canonical and non-canonical WNT signaling pathways. It has been established that RYK interacts with ligands such as WNT3, WNT5B, WNT1, WNT3A, WNT5A, and WNT11 [4], in addition to acting as a coreceptor in certain types of cancer [16,51]; for this, we conducted correlation analysis to establish associations between RYK and other receptors (shown in Figure 5A,B) or ligands.
Figure 5A,B, display genes with the highest correlation coefficients in cancer-derived samples, which also had higher Rho values when compared with non-cancer tissues. Our analysis revealed sustained elevation in the expression of PTK7 in ESCA, LRP5 in LGG, and FZD7 in PAAD. Therefore, we conclude that there may be a correlation between the high expression of these genes in cancer versus non-diseased tissues and RYK. However, to establish the strength of this correlation in the biological context of each type of cancer where differences were found, experimental validation is required using cellular models of over- or under-expression of RYK, or even the RYK knockout mouse model established by Michael Halford et al. [52].
To further investigate the role of RYK in the context of cancer, we conducted additional bioinformatic analyses using data available from the phase array (RPMA) of signaling pathways linked to cancer. This pathway includes TSC/mTOR, RTK, RAS/MAPK, PI3K/AKT, Hormone ER, Hormone AR, EMT, DNA damage response, cell cycle, and apoptosis.
Figure 6A–D and Supplementary Figures S2A–P and S3A–H depict the previously unreported relationship between RYK and these signaling cascades. Elevated RYK expression is associated with the activation of DNA damage pathways in UCEC, TSCmTOR in KIRP, PI3K/AKT in KIRP, BRCA, and SARC, EMT in ESCA, BRCA, and UCEC, RTK in LICH, RASMPAK in BRCA and LICH, Hormone ER in LICH, Hormone AR in UCEC and LICH, and cell cycle in HNSC, while low RYK expression is linked to the inhibition of TSCmTOR, RTK, RASMPAK, and Hormone AR in ESCA, Hormone AR, and Hormone ER in BRCA, and Hormone ER and cell cycle in KIRP.
Based on these outcomes, it can be inferred that the persistent malignant transformation of these cells contributes to the progression of cancer development through continuous interactions within signaling cascades. This phenomenon is exemplified by instances such as AKT-mTOR, which plays a role in inducing epithelial–mesenchymal transition (EMT) [53,54]. Additionally, these cascades may act in synergy to induce cell death, as evidenced by the observed cases involving DNA damage and PI3K/AKT [55,56].
Moreover, although no direct association has been established between RYK and DNA damage or the PI3K/AKT signaling pathway, previous research has reported correlations with the WNT signaling pathways. Components of the WNT pathways, including APC, Axin, FZD, and GSK-3β, have been demonstrated to directly regulate the DNA damage response (DDR) [57]. In breast cancer, it has been observed that the protein phosphatase PP2A of the PI3K/AKT signaling pathway activates β-catenin, thereby promoting its transcriptional activity [58]. However, the specific role of RYK in these scenarios requires further exploration through experimental trials.
Finally, this analysis revealed variable expression levels of RYK in the TSC/mTOR, RTK, RAS/MAPK, Hormone ER, Hormone AR, and cell cycle signaling pathways, depending on the type of cancer. This variability is intriguing and aligns with research led by Nolan-Stevaux et al. [59], indicating that RYK can function as either an oncogenic or tumor suppressor gene based on the specific malignancy. Although our research emphasized RYK’s role as a cancer promoter, this result suggests a dual role for RYK, depending on the cancer type. This discovery suggests a promising area of research on the nuanced role of RYK in these signaling pathways. It also provides insight into a possible link between RYK and oncogenesis, positioning this molecule as a promising marker for diagnosis and therapy, particularly in cancer types that demonstrate heightened expression in advanced stages of the disease or a correlation with unfavorable prognostic outcomes. Furthermore, RYK emerges as a valuable target for further investigation and potential clinical applications could be pursued by targeting RYK.

5. Conclusions

In summary, our study provides new and significant insights into the relationship between the RYK coreceptor and cancer. We found that this gene exhibits higher expression as certain types of cancer progress, and this is associated with poorer prognosis when messenger RNA levels are high. This work revealed a high possibility of RYK’s presence at the protein level within the nucleus. It interacts with the LRP5, PTK5, and FZD7 receptors to promote the transformation of malignant cells. This interaction may also be associated with the activation or inhibition of some signaling pathways strongly related to cancer. Therefore, this research highlights the need for the experimental validation of these results to determine how RYK promotes or inhibits oncogenesis, depending on the type of cancer. This work delves into this gene as a possible therapeutic target in malignant neoplasms, which should continue to be studied.

Supplementary Materials

The following supporting information can be downloaded at https://www.mdpi.com/article/10.3390/jmp5010005/s1, Supplementary Figure S1 displays the correlation between RYK and WNT pathway receptors in non-disease tissues using TCGA data. Supplementary Figure S2 illustrates the Activity Score of Cancer-Related Signaling Pathways where RYK is upregulated, while Supplementary Figure S3 depicts the Activity Score of Signaling Pathways Related to Cancer where RYK is underregulated.

Author Contributions

Conceptualization, J.A.Z.-G.; Methodology, J.A.Z.-G., A.A.-L. and L.F.J.-S.; Formal Analysis, J.A.Z.-G.; Investigation, J.A.Z.-G., A.A.-L. and L.F.J.-S.; Data Curation, J.A.Z.-G.; Writing—Original Draft Preparation, J.A.Z.-G., A.A.-L. and L.F.J.-S.; Writing—Review and Editing, J.A.Z.-G., A.A.-L. and L.F.J.-S.; Visualization, J.A.Z.-G. All authors have read and agreed to the published version of the manuscript.

Funding

This research received no external funding.

Institutional Review Board Statement

Not applicable.

Informed Consent Statement

Not applicable.

Data Availability Statement

The datasets analyzed during the current study are derived from a public database at The Cancer Genome Atlas Program (TGCA), which can be accessed at https://www.cancer.gov/ccg/research/genome-sequencing/tcga.

Acknowledgments

We want to thank the developers of the online tools OncoDB [23], Gene Set Cancer Analysis (GSCA) [28], Kaplan Meier plotter [29], The Human Protein Atlas [30], TIMER 2.0 [32], and GEPIA [33] for allowing us to access data derived from cancer and apply different analyses of our interest to this work. We also want to thank the Consejo Nacional de Ciencia y Tecnología (CONACyT) for supporting the research protocol SALUD-2018-A3-S-29778.

Conflicts of Interest

The authors declare no conflicts of interest.

References

  1. Halford, M.M.; Macheda, M.L.; Stacker, S.A. The RYK Receptor Family. In Receptor Tyrosine Kinases: Family and Subfamilies; Springer: Cham, Switzerland, 2015; pp. 685–741. Available online: https://link.springer.com/chapter/10.1007/978-3-319-11888-8_15 (accessed on 11 November 2023).
  2. Hovens, C.M.; Stacker, S.A.; Andres, A.C.; Harpur, A.G.; Ziemiecki, A.; Wilks, A.F. RYK, a receptor tyrosine kinase-related molecule with unusual kinase domain motifs. Proc. Natl. Acad. Sci. USA 1992, 89, 11818–11822. [Google Scholar] [CrossRef]
  3. Green, J.; Nusse, R.; van Amerongen, R. The role of Ryk and Ror receptor tyrosine kinases in Wnt signal transduction. Cold Spring Harb. Perspect. Biol. 2014, 6, a009175. [Google Scholar] [CrossRef]
  4. Roy, J.P.; Halford, M.M.; Stacker, S.A. The biochemistry, signalling and disease relevance of RYK and other WNT-binding receptor tyrosine kinases. Growth Factors 2018, 36, 15–40. [Google Scholar] [CrossRef]
  5. Bovolenta, P.; Rodriguez, J.; Esteve, P. Frizzled/RYK mediated signalling in axon guidance. Development 2006, 133, 4399–4408. [Google Scholar] [CrossRef]
  6. Zhang, Z.; Gao, S.; Xu, Y.; Zhao, C. Regulation of ABCG2 expression by Wnt5a through FZD7 in human pancreatic cancer cells. Mol. Med. Rep. 2021, 23, 52. [Google Scholar] [CrossRef] [PubMed]
  7. Bie, J.; Hu, X.; Yang, M.; Shi, X.; Zhang, X.; Wang, Z. PTK7 promotes the malignant properties of cancer stem-like cells in esophageal squamous cell lines. Hum. Cell 2020, 33, 356–365. [Google Scholar] [CrossRef] [PubMed]
  8. Liu, K.; Song, G.; Zhang, X.; Li, Q.; Zhao, Y.; Zhou, Y.; Xiong, R.; Hu, X.; Tang, Z.; Feng, G. PTK7 is a novel oncogenic target for esophageal squamous cell carcinoma. World J. Surg. Oncol. 2017, 15, 105. [Google Scholar] [CrossRef]
  9. Macheda, M.L.; Sun, W.W.; Kugathasan, K.; Hogan, B.M.; Bower, N.I.; Halford, M.M.; Zhang, Y.F.; Jacques, B.E.; Lieschke, G.J.; Dabdoub, A.; et al. The Wnt receptor Ryk plays a role in mammalian planar cell polarity signaling. J. Biol. Chem. 2012, 287, 29312–29323. [Google Scholar] [CrossRef] [PubMed]
  10. Alvarez-Zavala, M.; Riveros-Magana, A.R.; Garcia-Castro, B.; Barrera-Chairez, E.; Rubio-Jurado, B.; Garces-Ruiz, O.M.; Ramos-Solano, M.; Aguilar-Lemarroy, A.; Jave-Suarez, L.F. WNT receptors profile expression in mature blood cells and immature leukemic cells: RYK emerges as a hallmark receptor of acute leukemia. Eur. J. Haematol. 2016, 97, 155–165. [Google Scholar] [CrossRef] [PubMed]
  11. Halford, M.M.; Macheda, M.L.; Parish, C.L.; Takano, E.A.; Fox, S.; Layton, D.; Nice, E.; Stacker, S.A. A fully human inhibitory monoclonal antibody to the Wnt receptor RYK. PLoS ONE 2013, 8, e75447. [Google Scholar] [CrossRef] [PubMed]
  12. Liu, Y.; Wang, X.; Lu, C.C.; Kerman, R.; Steward, O.; Xu, X.M.; Zou, Y. Repulsive Wnt signaling inhibits axon regeneration after CNS injury. J. Neurosci. 2008, 28, 8376–8382. [Google Scholar] [CrossRef]
  13. Tury, A.; Tolentino, K.; Zou, Y. Altered expression of atypical PKC and Ryk in the spinal cord of a mouse model of amyotrophic lateral sclerosis. Dev. Neurobiol. 2014, 74, 839–850. [Google Scholar] [CrossRef]
  14. Ventura, E.; Belfiore, A.; Iozzo, R.V.; Giordano, A.; Morrione, A. Progranulin and EGFR modulate receptor-like tyrosine kinase sorting and stability in mesothelioma cells. Am. J. Physiol. Cell Physiol. 2023, 325, C391–C405. [Google Scholar] [CrossRef]
  15. Hamilton, G.; Rath, B.; Klameth, L.; Hochmair, M. Receptor tyrosine kinase expression of circulating tumor cells in small cell lung cancer. Oncoscience 2015, 2, 629–634. [Google Scholar] [CrossRef]
  16. Fu, Y.; Chen, Y.; Huang, J.; Cai, Z.; Wang, Y. RYK, a receptor of noncanonical Wnt ligand Wnt5a, is positively correlated with gastric cancer tumorigenesis and potential of liver metastasis. Am. J. Physiol. Gastrointest. Liver Physiol. 2020, 318, G352–G360. [Google Scholar] [CrossRef]
  17. Habu, M.; Koyama, H.; Kishida, M.; Kamino, M.; Iijima, M.; Fuchigami, T.; Tokimura, H.; Ueda, M.; Tokudome, M.; Koriyama, C.; et al. Ryk is essential for Wnt-5a-dependent invasiveness in human glioma. J. Biochem. 2014, 156, 29–38. [Google Scholar] [CrossRef]
  18. Adamo, A.; Fiore, D.; De Martino, F.; Roscigno, G.; Affinito, A.; Donnarumma, E.; Puoti, I.; Ricci Vitiani, L.; Pallini, R.; Quintavalle, C.; et al. RYK promotes the stemness of glioblastoma cells via the WNT/ beta-catenin pathway. Oncotarget 2017, 8, 13476–13487. [Google Scholar] [CrossRef] [PubMed]
  19. Liang, Z.; Liu, L.; Gao, R.; Che, C.; Yang, G. Downregulation of exosomal miR-7-5p promotes breast cancer migration and invasion by targeting RYK and participating in the atypical WNT signalling pathway. Cell. Mol. Biol. Lett. 2022, 27, 88. [Google Scholar] [CrossRef] [PubMed]
  20. Ohara, S.; Suda, K.; Fujino, T.; Hamada, A.; Koga, T.; Nishino, M.; Chiba, M.; Shimoji, M.; Takemoto, T.; Soh, J.; et al. Dose-dependence in acquisition of drug tolerant phenotype and high RYK expression as a mechanism of osimertinib tolerance in lung cancer. Lung Cancer 2021, 154, 84–91. [Google Scholar] [CrossRef] [PubMed]
  21. Okura, R.; Fujihara, S.; Iwama, H.; Morishita, A.; Chiyo, T.; Watanabe, M.; Hirose, K.; Kobayashi, K.; Fujimori, T.; Kato, K.; et al. MicroRNA profiles during galectin-9-induced apoptosis of pancreatic cancer cells. Oncol. Lett. 2018, 15, 407–414. [Google Scholar] [CrossRef] [PubMed]
  22. Reddy, R.B.; Khora, S.S.; Suresh, A. Molecular prognosticators in clinically and pathologically distinct cohorts of head and neck squamous cell carcinoma-A meta-analysis approach. PLoS ONE 2019, 14, e0218989. [Google Scholar] [CrossRef]
  23. Tang, G.; Cho, M.; Wang, X. OncoDB: An interactive online database for analysis of gene expression and viral infection in cancer. Nucleic Acids Res. 2022, 50, D1334–D1339. [Google Scholar] [CrossRef]
  24. Consortium, G.T. The Genotype-Tissue Expression (GTEx) project. Nat. Genet. 2013, 45, 580–585. [Google Scholar] [CrossRef]
  25. Kassambara, A. Package ‘ggpubr’. 2013. Available online: https://rpkgs.datanovia.com/ggpubr/ (accessed on 1 November 2023).
  26. Ross Ihaka, R.G. R Programming Language. 1993. Available online: https://cran.r-project.org/bin/windows/base/old/ (accessed on 25 October 2023).
  27. Jung, K.; Panko, P.; Lee, J.; Hwang, H. A Comparative Study on the Performance of GSCA and CSA in Parameter Recovery for Structural Equation Models with Ordinal Observed Variables. Front. Psychol. 2018, 9, 2461. [Google Scholar] [CrossRef]
  28. Liu, C.J.; Hu, F.F.; Xie, G.Y.; Miao, Y.R.; Li, X.W.; Zeng, Y.; Guo, A.Y. GSCA: An integrated platform for gene set cancer analysis at genomic, pharmacogenomic and immunogenomic levels. Brief. Bioinform. 2023, 24, bbac558. [Google Scholar] [CrossRef]
  29. Uhlen, M.; Zhang, C.; Lee, S.; Sjostedt, E.; Fagerberg, L.; Bidkhori, G.; Benfeitas, R.; Arif, M.; Liu, Z.; Edfors, F.; et al. A pathology atlas of the human cancer transcriptome. Science 2017, 357, eaan2507. [Google Scholar] [CrossRef]
  30. Uhlen, M.; Fagerberg, L.; Hallstrom, B.M.; Lindskog, C.; Oksvold, P.; Mardinoglu, A.; Sivertsson, A.; Kampf, C.; Sjostedt, E.; Asplund, A.; et al. Proteomics. Tissue-based map of the human proteome. Science 2015, 347, 1260419. [Google Scholar] [CrossRef]
  31. Lanczky, A.; Gyorffy, B. Web-Based Survival Analysis Tool Tailored for Medical Research (KMplot): Development and Implementation. J. Med. Internet Res. 2021, 23, e27633. [Google Scholar] [CrossRef] [PubMed]
  32. Li, T.; Fu, J.; Zeng, Z.; Cohen, D.; Li, J.; Chen, Q.; Li, B.; Liu, X.S. TIMER2.0 for analysis of tumor-infiltrating immune cells. Nucleic Acids Res. 2020, 48, W509–W514. [Google Scholar] [CrossRef] [PubMed]
  33. Tang, Z.; Li, C.; Kang, B.; Gao, G.; Li, C.; Zhang, Z. GEPIA: A web server for cancer and normal gene expression profiling and interactive analyses. Nucleic Acids Res. 2017, 45, W98–W102. [Google Scholar] [CrossRef] [PubMed]
  34. Kolde, R. Pheat Maps Package. 2019. Available online: https://cran.r-project.org/web/packages/pheatmap/index.html (accessed on 10 October 2023).
  35. Akbani, R.; Ng, P.K.; Werner, H.M.; Shahmoradgoli, M.; Zhang, F.; Ju, Z.; Liu, W.; Yang, J.Y.; Yoshihara, K.; Li, J.; et al. Corrigendum: A pan-cancer proteomic perspective on The Cancer Genome Atlas. Nat. Commun. 2015, 6, 4852. [Google Scholar] [CrossRef] [PubMed]
  36. Wickham, H.; Chang, W.; Henry, L.; Pedersen, T.L.; Takahashi, K.; Wilke, C.; Woo, K.; Yutani, H.; Dunnington, D.; Posit, P.B.C. ggplot2. 2023. Available online: https://cran.r-project.org/web/packages/ggplot2/index.html (accessed on 25 October 2023).
  37. Bojanowski, M. Alluvial Diagrams. 2019. Available online: https://cran.r-project.org/web/packages/alluvial/vignettes/alluvial.html (accessed on 25 October 2023).
  38. Lemmon, M.A.; Schlessinger, J. Cell signaling by receptor tyrosine kinases. Cell 2010, 141, 1117–1134. [Google Scholar] [CrossRef] [PubMed]
  39. Schlessinger, J. Receptor tyrosine kinases: Legacy of the first two decades. Cold Spring Harb. Perspect. Biol. 2014, 6, a008912. [Google Scholar] [CrossRef] [PubMed]
  40. Krishnamurthy, N.; Kurzrock, R. Targeting the Wnt/beta-catenin pathway in cancer: Update on effectors and inhibitors. Cancer Treat. Rev. 2018, 62, 50–60. [Google Scholar] [CrossRef] [PubMed]
  41. Lojk, J.; Marc, J. Roles of Non-Canonical Wnt Signalling Pathways in Bone Biology. Int. J. Mol. Sci. 2021, 22, 10840. [Google Scholar] [CrossRef] [PubMed]
  42. Duchartre, Y.; Kim, Y.M.; Kahn, M. The Wnt signaling pathway in cancer. Crit. Rev. Oncol. Hematol. 2016, 99, 141–149. [Google Scholar] [CrossRef]
  43. Parsons, M.J.; Tammela, T.; Dow, L.E. WNT as a Driver and Dependency in Cancer. Cancer Discov. 2021, 11, 2413–2429. [Google Scholar] [CrossRef] [PubMed]
  44. Micci, F.; Panagopoulos, I.; Haugom, L.; Andersen, H.K.; Tjonnfjord, G.E.; Beiske, K.; Heim, S. t(3;21)(q22;q22) leading to truncation of the RYK gene in atypical chronic myeloid leukemia. Cancer Lett. 2009, 277, 205–211. [Google Scholar] [CrossRef]
  45. He, W.; Yuan, K.; He, J.; Wang, C.; Peng, L.; Han, Y.; Chen, N. Network and pathway-based analysis of genes associated with esophageal squamous cell carcinoma. Ann. Transl. Med. 2023, 11, 102. [Google Scholar] [CrossRef]
  46. Zhou, G.; Zhang, S.; Jin, M.; Hu, S. Comprehensive analysis reveals COPB2 and RYK associated with tumor stages of larynx squamous cell carcinoma. BMC Cancer 2022, 22, 667. [Google Scholar] [CrossRef]
  47. Lyu, J.; Wesselschmidt, R.L.; Lu, W. Cdc37 regulates Ryk signaling by stabilizing the cleaved Ryk intracellular domain. J. Biol. Chem. 2009, 284, 12940–12948. [Google Scholar] [CrossRef]
  48. Vogel, C.; Marcotte, E.M. Insights into the regulation of protein abundance from proteomic and transcriptomic analyses. Nat. Rev. Genet. 2012, 13, 227–232. [Google Scholar] [CrossRef]
  49. Greenbaum, D.; Colangelo, C.; Williams, K.; Gerstein, M. Comparing protein abundance and mRNA expression levels on a genomic scale. Genome Biol. 2003, 4, 117. [Google Scholar] [CrossRef] [PubMed]
  50. Skoda, J.; Neradil, J.; Staniczkova Zambo, I.; Nunukova, A.; Macsek, P.; Borankova, K.; Dobrotkova, V.; Nemec, P.; Sterba, J.; Veselska, R. Serial Xenotransplantation in NSG Mice Promotes a Hybrid Epithelial/Mesenchymal Gene Expression Signature and Stemness in Rhabdomyosarcoma Cells. Cancers 2020, 12, 196. [Google Scholar] [CrossRef] [PubMed]
  51. Ueno, K.; Hirata, H.; Hinoda, Y.; Dahiya, R. Frizzled homolog proteins, microRNAs and Wnt signaling in cancer. Int. J. Cancer 2013, 132, 1731–1740. [Google Scholar] [CrossRef] [PubMed]
  52. Halford, M.M.; Armes, J.; Buchert, M.; Meskenaite, V.; Grail, D.; Hibbs, M.L.; Wilks, A.F.; Farlie, P.G.; Newgreen, D.F.; Hovens, C.M.; et al. Ryk-deficient mice exhibit craniofacial defects associated with perturbed Eph receptor crosstalk. Nat. Genet. 2000, 25, 414–418. [Google Scholar] [CrossRef] [PubMed]
  53. Karimi Roshan, M.; Soltani, A.; Soleimani, A.; Rezaie Kahkhaie, K.; Afshari, A.R.; Soukhtanloo, M. Role of AKT and mTOR signaling pathways in the induction of epithelial-mesenchymal transition (EMT) process. Biochimie 2019, 165, 229–234. [Google Scholar] [CrossRef] [PubMed]
  54. Glaviano, A.; Foo, A.S.C.; Lam, H.Y.; Yap, K.C.H.; Jacot, W.; Jones, R.H.; Eng, H.; Nair, M.G.; Makvandi, P.; Geoerger, B.; et al. PI3K/AKT/mTOR signaling transduction pathway and targeted therapies in cancer. Mol. Cancer 2023, 22, 138. [Google Scholar] [CrossRef] [PubMed]
  55. Roos, W.P.; Thomas, A.D.; Kaina, B. DNA damage and the balance between survival and death in cancer biology. Nat. Rev. Cancer 2016, 16, 20–33. [Google Scholar] [CrossRef]
  56. Xu, J.; Li, Y.; Kang, M.; Chang, C.; Wei, H.; Zhang, C.; Chen, Y. Multiple forms of cell death: A focus on the PI3K/AKT pathway. J. Cell. Physiol. 2023, 238, 2026–2038. [Google Scholar] [CrossRef]
  57. Zhang, X.; Yu, X. Crosstalk between Wnt/beta-catenin signaling pathway and DNA damage response in cancer: A new direction for overcoming therapy resistance. Front. Pharmacol. 2023, 14, 1230822. [Google Scholar] [CrossRef] [PubMed]
  58. Persad, A.; Venkateswaran, G.; Hao, L.; Garcia, M.E.; Yoon, J.; Sidhu, J.; Persad, S. Active beta-catenin is regulated by the PTEN/PI3 kinase pathway: A role for protein phosphatase PP2A. Genes. Cancer 2016, 7, 368–382. [Google Scholar] [CrossRef] [PubMed]
  59. Trivier, E.; Ganesan, T.S. RYK, a catalytically inactive receptor tyrosine kinase, associates with EphB2 and EphB3 but does not interact with AF-6. J. Biol. Chem. 2002, 277, 23037–23043. [Google Scholar] [CrossRef] [PubMed]
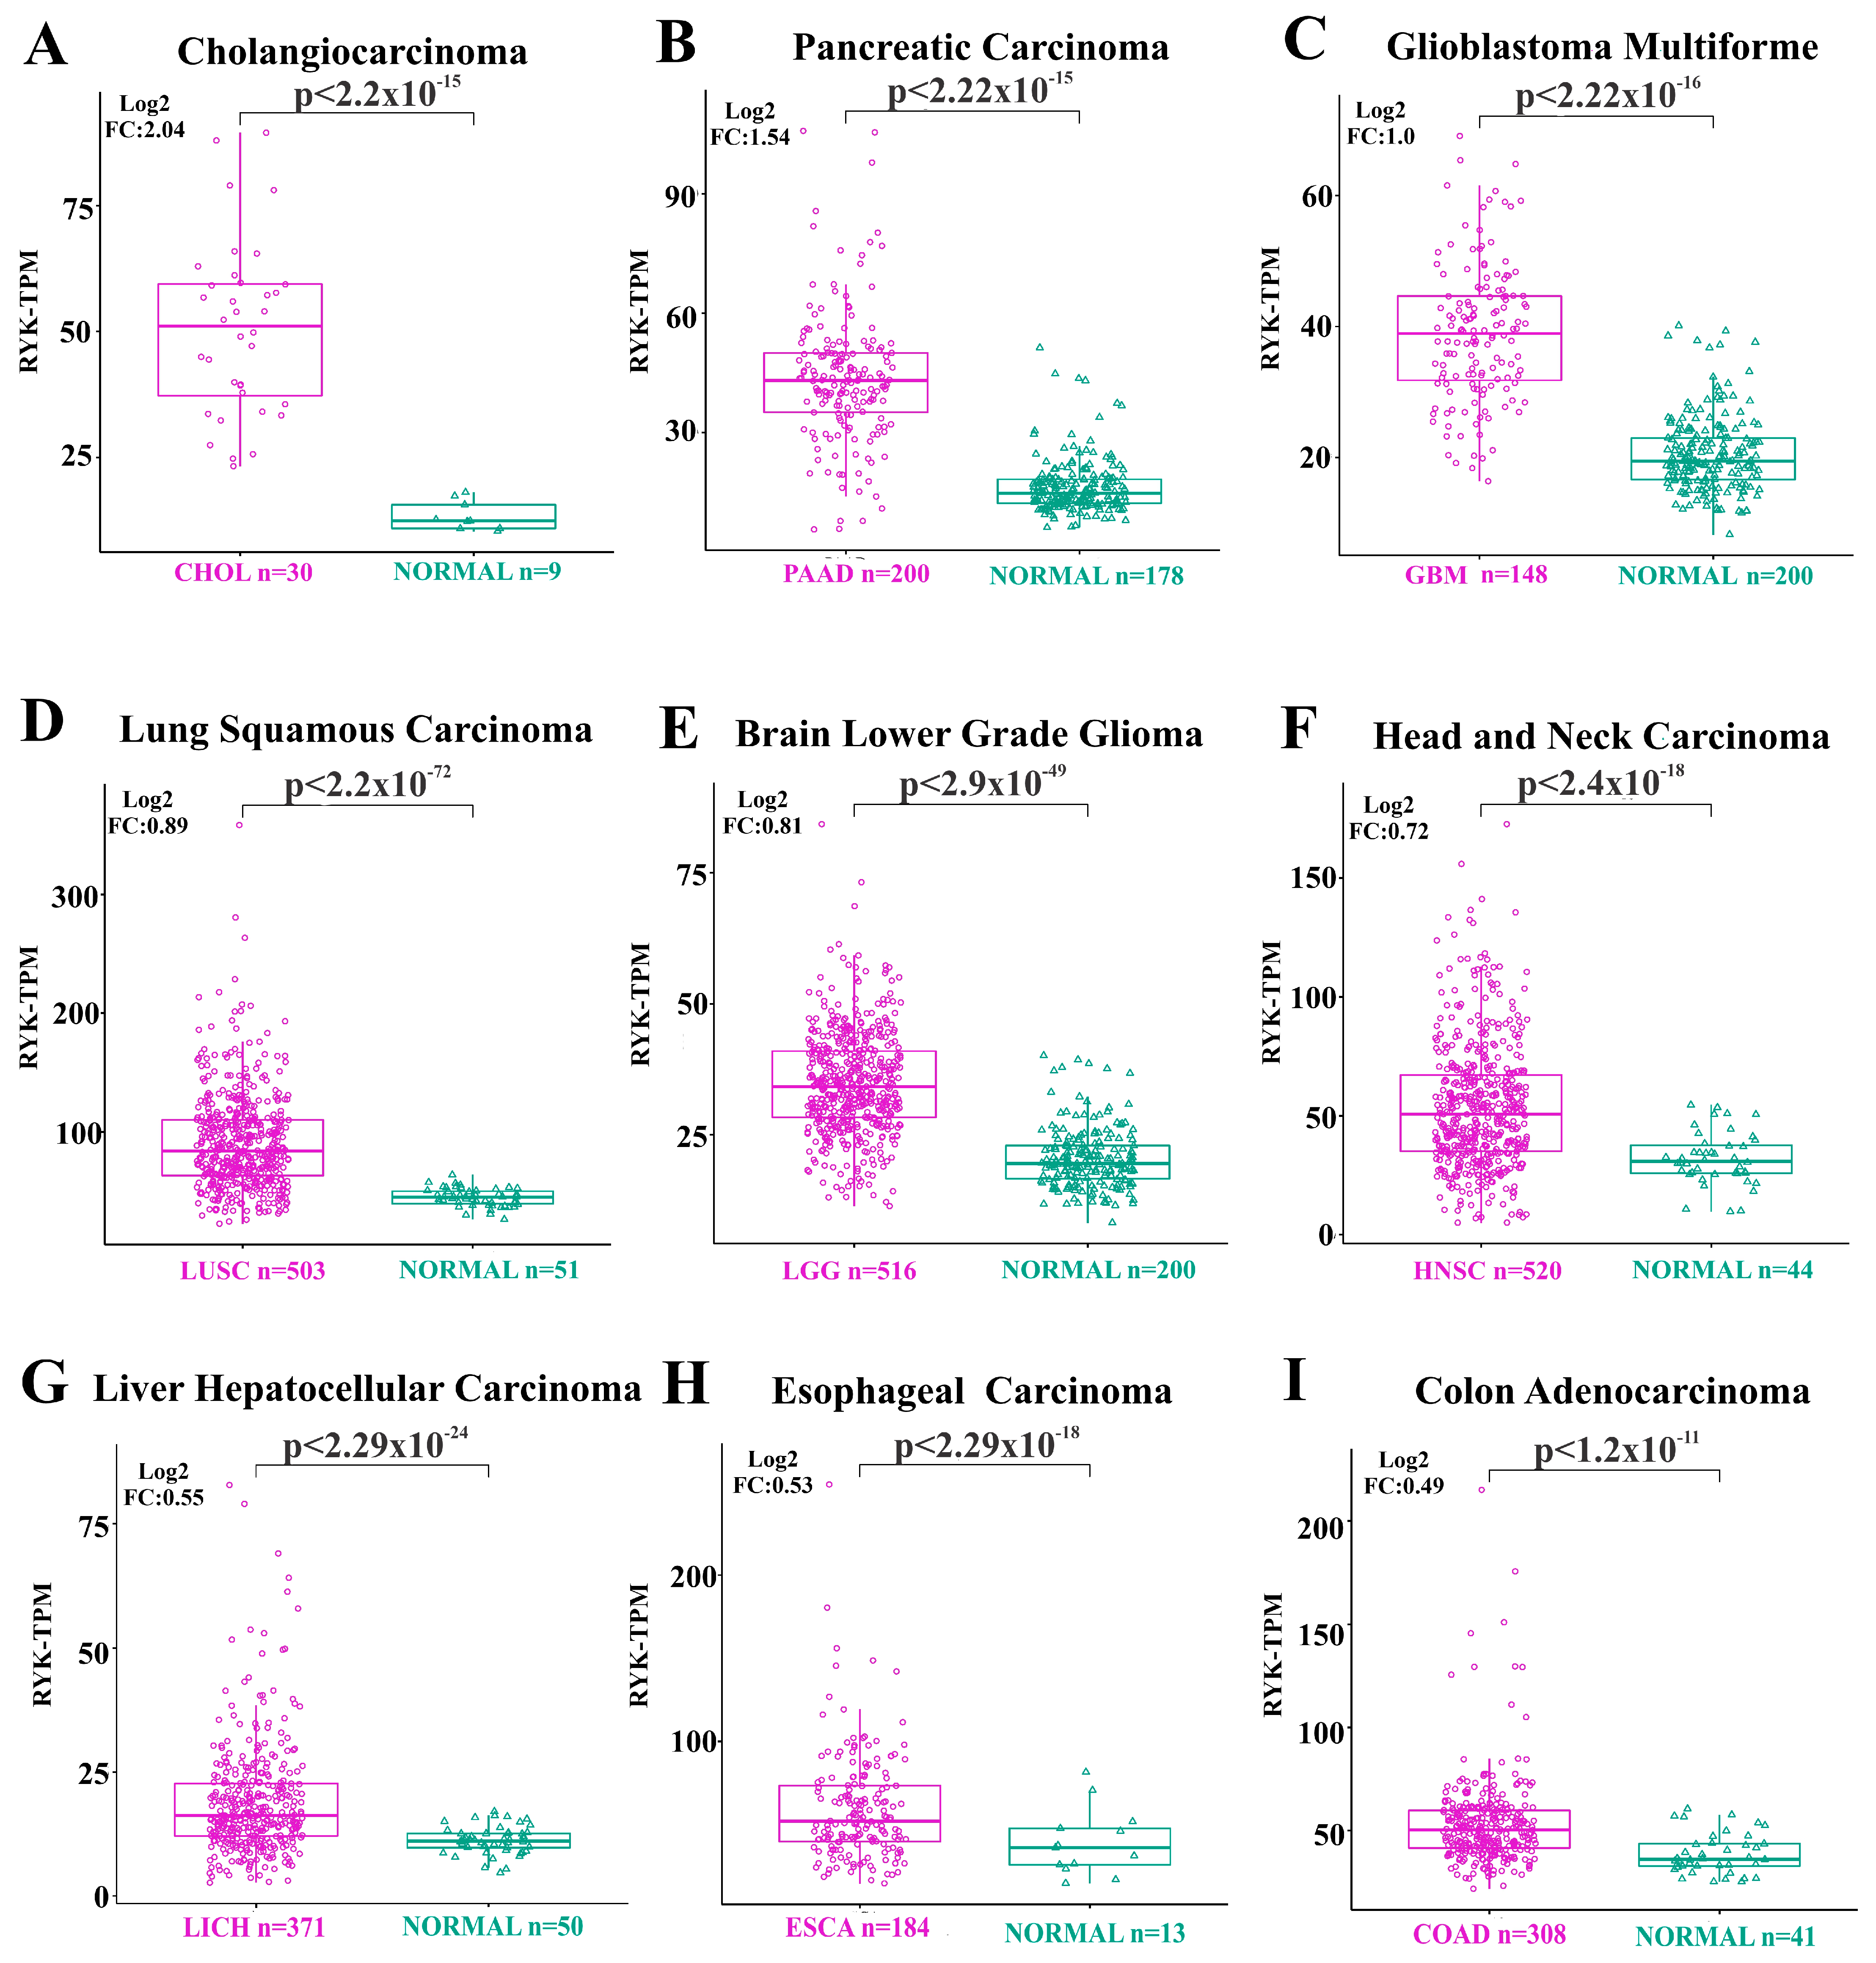
Figure 1. RYK Expressions in Cancer Samples and Non-Disease Samples Derived. The box plots depict messenger RNA expression levels in samples obtained from cancer (shown in fuchsia), and those obtained from non-disease samples (shown in bluish-green). The p-value reflects the outcome of the Student’s t-test applied between cancer-derived and normal tissue-derived samples. Transcripts per million (TPM), fold change in gene expression transformed into a logarithm with base 2 (Log2 FC), (A) cholangiocarcinoma (CHOL), (B) pancreatic adenocarcinoma (PAAD), (C) glioblastoma multiforme (GBM), (D) lung squamous cell carcinoma (LUSC), (E) brain lower grade glioma (LGG), (F) head and neck squamous cell carcinoma (HNSC), (G) liver hepato-cellular carcinoma (LIHC), (H) esophageal carcinoma (ESCA), and (I) colon adenocarcinoma (COAD).
Jmp 05 00005 g001
Figure 2. RYK expression in different tumor types. The boxplots illustrate the differential expression of the RYK gene across different cancer stages, utilizing data obtained from the TCGA project. The stages are categorized as Stage I–IV, representing different degrees of cancer progression. The panels show staining for the following tissues: (A) colangiosarcoma (CHOL), (B) pancreatic adenocarcinoma (PAAD), (C) lung squamous cell carcinoma (LUSC), (D) Head and Neck squamous cell carcinoma (HNSC), (E) liver hepatocellular carcinoma (LICH), (F) Esophageal carcinoma (ESCA), (G) Colon adenocarcinoma (COAD). The data are presented as Fragments per Million Kilobases normalized and logarithmically transformed to the base 2 (Log2 FPKM Expression). Significance levels are indicated for p < 0.05 (*).
Jmp 05 00005 g002
Figure 3. Representative images of RYK immunohistochemistry stains in tissues derived from cancer and non-disease sources. The staining intensity is observed in tissues derived from the specific types of cancer (as shown above pictures) and non-disease tissues (NORMAL). The panels show staining for the following tissues: (A) colon adenocarcinoma (COAD), (B) glioblastoma multiforme (GBM), (C) liver hepato-cellular carcinoma (LIHC), (D), cervical squamous cell carcinoma and endocervical adenocarcinoma (CESC), and (E) breast invasive carcinoma (BRCA). Receptor-like tyrosine kinase (RYK).
Jmp 05 00005 g003
Figure 4. Overall survival analysis of RYK gene using KMPlot data for eleven types of cancer. A cut-off time of 60 months and significance for the Cox log-rank test (p < 0.05) were established. In each panel, red denotes patients with upregulated RYK gene expression, while black represents those with downregulated expression. The panels display the Hazard Ratio (HR) and the statistical significance of the log-rank and Cox regression test for each cancer type. (A) Pancreatic adenocarcinoma (PAAD), (B) liver hepatocellular carcinoma (LIHC), (C) esophageal carcinoma (ESCA), (D) colon adenocarcinoma (COAD), (E) cervical squamous cell carcinoma and endocervical adenocarcinoma (CESC), (F) kidney renal papillary cell carcinoma (KIRP), (G) sarcoma (SARC), (H) uterine corpus endometrial carcinoma (UCEC), (I) breast invasive carcinoma (BRCA), and (J) acute myeloid leukemia (LAML).
Jmp 05 00005 g004
Figure 5. Correlation between RYK and WNT pathway receptors in cancer using TCGA data. (A) The heat map visually depicts the correlation between nine types of cancer (listed on the left) and eighteen receptors (described along the bottom). The color bar on the right represents the correlation coefficient, ranging from 0 (yellow) to 1 (blue). The number of individuals for each cancer type (n) is indicated for cholangiocarcinoma (CHOL), colon adenocarcinoma (COAD), esophageal carcinoma (ESCA), glioblastoma multiforme (GBM), head and neck squamous cell carcinoma (HNSC), brain lower grade glioma (LGG), liver hepatocellular carcinoma (LIHC), lung squamous cell carcinoma (LUSC), pancreatic adenocarcinoma (PAAD), and (B) Boxplot displays the messenger RNA expression levels of three receptors in different types of cancer, represented by transcripts per million (TPM). Significance values were obtained by applying Student’s t-test. The analyzed cancers include brain lower grade glioma (LGG), esophageal carcinoma (ESCA), and pancreatic adenocarcinoma (PAAD).
Jmp 05 00005 g005
Figure 6. Sankey plot depicting the interplay among RYK, different cancer types, and oncological signaling pathways. In panel (A), eight cancer types exhibited elevated RYK expression, while in panel (B), the signaling pathways associated with each cancer type that show activation are illustrated. In panel (C), three types of cancer demonstrate decreased RYK expression, and in panel (D), the inhibited signaling pathways related to each cancer type are depicted. The gray lines represent the connections between both. All relationships depicted maintain a significance level with a false discovery rate (FDR) ≤ 0.05.
Jmp 05 00005 g006
Disclaimer/Publisher’s Note: The statements, opinions and data contained in all publications are solely those of the individual author(s) and contributor(s) and not of MDPI and/or the editor(s). MDPI and/or the editor(s) disclaim responsibility for any injury to people or property resulting from any ideas, methods, instructions or products referred to in the content.