Abstract
B-cell neoplasms possess clonal B-cell receptor rearrangements (BCR clonotype lineages) that can be identified by sequencing the B-cell repertoire for use in diagnostics, risk stratification, and high-sensitivity monitoring. BCR somatic hypermutation (SHM) can result in clonality detection failure from point mutations in PCR primer binding regions, often necessitating splitting samples into multiple reactions which increases test costs, turnaround times, and sample requirements. We evaluated the Oncomine BCR Pan-Clonality Assay, a novel single-tube PCR reaction that simultaneously amplifies all BCR loci for next-generation DNA sequencing, using neoplastic B-cell lines and clinical research samples from multiple myeloma (MM) patients, a plasma cell neoplasm associated with high SHM levels. The assay showed a linear detection range down to 1 ng of clonal DNA input, sensitivity to 10−6 in a polyclonal background, and high reproducibility. Clonotype lineages were identified in 42/45 (93%) MM samples. Ion Reporter software packaged with the assay permitted straightforward identification of MM subgroups. As expected, SHM was identified in 94% of MM cases, but several unexpected subgroups were identified including biased IGHV3-11 or IGHV4-34 usage in 20% of MM samples, and two cases with very low levels of SHM. Evidence of intraclonal diversity/ongoing SHM was identified in 18% of samples, suggesting a possible germinal center origin for some MM cases. The single-tube Oncomine BCR Pan-Clonality assay efficiently detects BCR clonotype lineages at rates comparable to existing multiple reaction assays and permits their characterization for cell of origin studies and lymphoma classification.
1. Introduction
B-cell neoplasms possess clonal B-cell receptor (BCR) rearrangements that can be identified by sequencing the B-cell repertoire [,]. B-cell clonality methods target immunoglobulin (IG) heavy and/or light chain rearrangements formed by genomic recombination of variable (V), diversity (D), and joining (J) genes (V and J only for light chains) creating a highly diverse repertoire of V(D)J sequences that define the diversity of antigen-binding regions in BCRs [,]. Further diversity is introduced into the rearranged BCR sequence by exonuclease activity and N-additions at the junctions between recombined genes, and somatic hypermutation (SHM) in later stages of B-cell development to produce high-affinity antibodies capable of eliciting a more effective immune response. In general, healthy individuals have a highly diverse B-cell repertoire (“polyclonal” B cells), whereas clonal BCR rearrangements with frequencies above polyclonal backgrounds are observed in B-cell neoplasia [,].
Over the last two decades, clonality testing in suspected B-cell neoplasms has grown in overall adoption, initially with the establishment of guidelines for PCR-based analysis of B-cell rearrangements []. Commercially available PCR-based clonality assays include multiplexed primer sets for amplification of IG genes, followed by fragment size analysis of the fluorescently labeled products using capillary electrophoresis (CE). Interpretation of the “clonal” readout by this method relies on the demonstration of a dominant amplicon peak of a specific length, rather than a Gaussian distribution of varying amplicon lengths in a polyclonal sample.
Clonality testing using multiplexed PCR followed by fragment analysis is not without drawbacks. Firstly, the sensitivity to detect rearranged BCR sequences is limited because clones of different sequences may have the same size and minor (low frequency) clones of interest can be masked by a noisy background. Secondly, in the absence of sequence information, SHM status cannot be determined. Lastly, without identifying the unique characteristics of rearranged clonal sequences, such approaches are not directly amenable to subsequent tracking of clones of interest.
Recently, with the large-scale adoption and affordability of next-generation sequencing (NGS), the design concepts for multiplex PCR primers were ported to NGS-based clonality testing solutions [,,]. The EuroClonality-NGS working group developed NGS-based protocols for clonality detection that were executed by laboratories in an international multicenter biological validation [], who reported a very high concordance with conventional clonality analysis (98%). Most samples in this cohort were derived from formalin-fixed, paraffin-embedded (FFPE) tissue and thus comprised lower-quality DNA. Furthermore, guidelines that aim to enable more structured approaches for clonality evaluation using NGS assays have been published in the literature [,,,]. A few other studies have established the efficacy of NGS assays in detecting clonality in T-cell receptors (TCRs) and BCRs on the Ion Torrent platform and others [,,,,].
NGS clonality assays allow for in-depth analysis of BCR rearrangements including nucleotide sequence and a determination of the SHM levels of each clone []. SHM measurements are especially key in chronic lymphocytic leukemia prognosis, as increased hypermutation in the immunoglobulin heavy variable (IGHV) gene predicts improved survival []. NGS-based clonality testing offers significant advantages over traditional approaches like PCR by providing (i) comprehensive information on the entire repertoire including broad changes to any remaining polyclonal background, (ii) quantification of abundance of different B-cell clones in a sample, (iii) higher sensitivity (or) lower limit of detection, and (iv) the potential to evaluate sub-, intra-, and inter-clonal diversity in mature B cells given precise clone sequence readouts []. This makes it possible to track clonotype lineages—sets of B cells sharing antigen specificities that might show sequence differences due to SHM or class switching.
The diversity in BCR rearrangements conferred by SHM may result in a failure to detect clonotype lineages due to inefficient primer binding from point mutations that can occur in the framework (FR) regions of the IGHV gene targeted by most common multiplex primer designs []. For this reason, separate assays targeting multiple loci including the leader and/or various framework regions of the IGH chain (FR1, FR2, FR3) and IG light chains can be used to improve clonality testing success. Most NGS testing solutions designed to target individual BCR loci are split into multiple pools to avoid primer–primer interactions or limit primer bias that can be associated with multiplex PCR library preparation []. The need for multiple reactions to profile the B-cell repertoire may be prohibitive from a cost and turn-around-time perspective, as well as the requirement for higher sample inputs that may not be available from limited clinical specimens [].
To determine if acceptable rates of clonal BCR rearrangement detection can be achieved without requiring splitting samples into multiple reactions, we evaluated the performance of the Oncomine BCR Pan-Clonality Assay (hereinafter referred to as the ‘Pan-Clonality Assay’), a novel NGS assay that combines primers targeting the BCR IGH, IG kappa (IGK), and IG lambda (IGL) chains and rearrangements of the kappa deletion element (KDE) and the constant region intron (Cint) in a single-tube reaction. In this first report of the Pan-Clonality Assay, we validated its performance across a range of input DNA amounts and dilutions and assessed its ability to detect clonotype lineages in neoplastic B-cell lines and multiple myeloma (MM) clinical samples, a plasma cell neoplasm associated with high levels of SHM.
Unlike chronic lymphocytic leukemia (CLL), where SHM status functions as both a prognostic and predictive marker, currently, B-cell clonotype sequence information is not used to predict responses to specific therapies in MM. However, clonotyping can help confirm a MM diagnosis in some cases and is assuming an increasingly important role in guiding therapy decisions by providing clonal markers for high sensitivity monitoring. NGS offers additional benefits compared to CE by providing information about the clone that may be relevant to the pathogenesis of lymphoid malignancies, including MM. This includes biased usage of V gene segments, stereotypy, SHM status, and intra-clonal diversity status. As this information can suggest cell of origin and potentially identify subgroups within categories of B-cell lymphoproliferative disorders (B-LPDs) with distinct clinicopathologic features, we also examined the utility of Ion Reporter software packaged with the Pan-Clonality Assay to identify MM subgroups.
2. Materials and Methods
2.1. Neoplastic B-Cell Line Sample Preparation
B-cell leukemia and lymphoma cell lines were procured from the American Type Culture Collection (ATCC) and The Leibniz Institute Deutsche Sammlung von Mikroorganismen und Zellkulturen (DSMZ). Cell line gDNA was extracted using the RecoverAll Total Nucleic Acid Isolation Kit for FFPE (Thermo Fisher Scientific, Waltham, MA, USA) omitting the “Step 1: Prepare the FFPE samples” portion of the protocol and stored at −80 °C. Cell line gDNA samples were evaluated as monoclonal material, using 5 ng input into library preparation, or diluted 1:100 into a background of polyclonal PBL gDNA (BioChain Institute Inc., Newark, CA, USA), where 100 ng total gDNA was used for library preparation.
2.2. Multiple Myeloma Sample Collection and Preparation
The cohort comprised 42 cases of MM, 2 cases of monoclonal gammopathy of undetermined significance (MGUS), and 1 case of smoldering MM. One of the MM cases also had co-existing monoclonal B-cell lymphocytosis (MBL). The study was approved by the University of Saskatchewan Biomedical Research Ethics Board. Written informed consent was obtained from all patients to provide bone marrow aspirate samples collected concurrently with standard-of-care bone marrow analysis, blood testing, and imaging studies performed to confirm the diagnosis of MM and complete staging according to International Myeloma Working Group (IMWG) diagnostic criteria and the Revised International Staging System (R-ISS) [,]. All bone marrow specimens were assessed by light microscopy and immunohistochemistry (IHC) to determine overall cellularity; percentages of cellular elements; and morphological and immunophenotypic features of the neoplastic plasma cell population. Cytogenetic abnormalities were assessed by fluorescence in situ hybridization (FISH). The percentage of neoplastic plasma cells in the bone marrow ranged from 10 to 90% with 19 of 45 (42.2%) having >60% clonal plasma cells, a feature diagnostic of MM regardless of other findings. In nearly all cases, the neoplastic plasma cell population present in the bone marrow was confirmed to be clonal by immunoglobulin light chain restriction performed by IHC or in situ hybridization (ISH) analysis of bone marrow biopsies or clot sections, or by flow cytometry analysis of bone marrow aspirates. In two patients (MM43 and MM44) assessment of light chain restriction in the neoplastic plasma cell population was not performed. An aberrant plasma cell immunophenotype was detected in both patients and both had serum monoclonal IgG kappa proteins, 30 g/L in patient MM43 and 42 g/L in patient MM44. In total, based on assessment of light chain restriction in marrow plasma cells and/or the presence of a serum monoclonal paraprotein, 29 of 45 (64%) patients were kappa positive and 16 of 45 (36%) were lambda positive. DNA was extracted from BMA specimens using QIAmp DNA Mini Kit reagents (Qiagen, Tokyo, Japan) according to the manufacturer’s instructions and stored at −80 °C. Library preparation was performed with 100 ng of input DNA.
2.3. Library Preparation and Sequencing
Neoplastic B-cell and MM samples were evaluated for clonality by targeted NGS performed on the Ion GeneStudio S5 platform using the Oncomine BCR Pan-Clonality Assay (IGH, IGK, IGL, IGK-Kde, Cint-KDE) from Thermo Fisher Scientific, in combination with the Ion AmpliSeq Library Kit Plus and the Ion Dual Barcode Kit 1–96. The resulting purified and barcoded libraries were pooled and processed using the Ion Chef automated templating instrument, followed by sequencing using Ion 540 Chips and the Ion GeneStudio S5 sequencing platform and sequenced to a target depth of 2 M reads per sample. BCR rearrangements were considered clonal if present at frequencies greater than 2.5% of total reads and exceeding background frequencies by at least 10-fold.
2.4. Pan-Clonality Assay Immune Repertoire Data Analysis
NGS results were processed using the Ion Reporter software solution from Thermo Fisher Scientific. Data from the GeneStudio S5 sequencer were auto-uploaded to Ion Reporter 5.16 and analyzed using Oncomine BCR IGH-SR DNA and BCR IGKL-SR DNA single sample workflows, for the heavy and light chains, respectively. The two workflows provided end-to-end analysis beginning from sequenced reads generated from the single-tube reaction to output tables and visualizations of primary repertoire features such as detected clones (unique rearrangements in the receptor DNA sequence); frequencies for clonal rearrangement assessment and rare clone detection; V, D, J and third complementarity determining region (CDR3) sequence annotations and productive/unproductive rearrangement annotations as determined by NCBI IgBLAST sequence alignments against the international ImmunoGeneTics (IMGT) database; and SHM levels computed for each rearrangement []. The CDR3 sequence of each rearrangement is delimited by (but does not include) the anchor positions 2nd-CYS 104 and J-TRP/J-PHE for the heavy chain and light chain, respectively consistent with IMGT nomenclature.
The software workflow internally implemented an error-correction pipeline to improve the accuracy of the detected clonal population frequencies []. Homopolymer errors, manifested as single nucleotide additions or subtractions to a homopolymer stretch, make up the large majority of Ion Torrent platform sequencing errors. These insertion/deletion (indel) errors can lead to frameshift mutations that often cause rearrangements to appear unproductive due to out-of-frame nonsense (i.e., stop) codons. Thus, to identify sequences containing such indel errors, VDJ DNA sequences are translated to the protein space, and the productivity of the rearrangement is evaluated (i.e., whether the V and J genes are in-frame and there are no premature stop codons). In some cases, an indel error occurring within the variable gene portion of the sequence causes the alignment to the variable gene IMGT reference to indicate a gap within the indel containing homopolymer tract, and re-evaluation of the initial base calling at such positions often leads to correction of the error to produce an ostensibly sequencing error-free read representing a productive rearrangement. After indel error correction, PCR-derived errors are eliminated by evaluating edit distances between VDJ rearrangements, taking into consideration the frequency of the rearrangement and whether the rearranged sequence is the same for forward and reverse strand reads. The sequence and frequency of IMGT-annotated VDJ rearrangements detected in the sample are then reported. The somatic hypermutation level is calculated by determining the number of mismatches between a clone variable gene sequence (V-gene) and the best matching IMGT reference variable gene allele.
The software also quantified and reported several secondary and tertiary repertoire features in samples, such as Shannon diversity and evenness of the total population, as well as B-cell lineage groupings useful in identifying related sub-clones or clonotype lineages representing groups of B-cell clones believed to be related by descent (shared V(D)J rearrangement) but with distinct V(D)J sequences due to SHM. Clonotype lineages are identified as sets of IGH and IGK/L rearrangements having the same variable gene identity, the same CDR3 length, and CDR3 nucleotide similarity greater than the user-defined threshold (default: minimum 85% homology). Furthermore, the software includes spectratyping-format plots, wherein spectratyping refers to the clinical gold standard technique used historically for the analysis of immune repertoires. It plots the length distribution of unique CDR3 sequences detected in every V-gene locus across the entire repertoire. Reads for identified clones are arranged along the X-axis according to the variable gene identity and the Y-axis according to the CDR3 nucleotide length. The size of the circles indicates the frequency of a particular variable gene-CDR3 NT length combination within the dataset, while color indicates the frequency of the largest clone having a particular variable gene-CDR3 NT length combination. It enables easy visual identification of highly expanded or mutated clones in the samples.
We would like the user to note that the Oncomine BCR Pan-Clonality assay primes in the Framework 3 region of the V-gene, whereas the two reflex assays, FR3(d) and FR2 prime in the distal Framework 3 and Framework 2 regions of the V-gene, respectively. Depending on the insert sequence of the V-gene captured and amplified (less/more sequence information owing to different regions of priming), mapping to IMGT can sometimes lead to different V-gene identity results for the same clone. In most cases, the V-gene sequences are unique enough to resolve identity with shorter segments, but this is not always the case.
3. Results
3.1. Pan-Clonality Assay BCR Targets
The Pan-Clonality Assay was used to sequence multiple BCR targets in a single reaction, using amplicons priming in the FR3 and J genes of (i) IGH rearrangements (amplifying an ~100 bp region) involving IGHV genes, (ii) IGK, IGL rearrangements (amplifying an ~50–60 bp region) involving IGKV and IGLV genes, respectively, as well as rearrangements containing (iii) Cint (C-intron; amplifying an ~60 bp region) and (iv) kappa-deletion element, or KDE (amplifying an ~70 bp region) (Figure 1). Each targeting primer set consists of multiple primers per V and J gene family that allows for degeneracy within each family to optimize clonotype detection in the presence of SHM at primer binding sites. Please note that IGKV-Kdel and IGK-KDE refer to the same type of rearrangement and are used interchangeably throughout the manuscript.
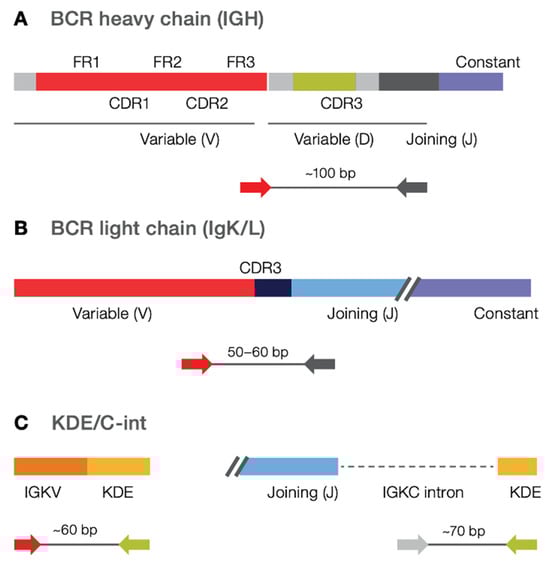
Figure 1.
Targeted amplicons in the Pan-Clonality Assay. B cell Pan-Clonality Assay (IGH/K/L) contains FR3-J primers for (A) IGH, (B) IGK, IGL, as well as (C) Kde/Cint primers in a single library preparation reaction.
3.2. Clonotype Lineage Detection in Neoplastic B-Cell Lines
In the preliminary round of testing, a total of 27 neoplastic B-cell lines were profiled. Ion Reporter workflows that accompany the assay reported all identified clonal rearrangements and frequencies, CDR3 sequence readouts, and levels of SHM. Although various definitions exist for assigning B-cell clonality by NGS, the detection of BCR rearrangements with frequencies greater than 2.5% that exceed background rearrangement frequencies by at least 10-fold is well-established [,,]. Table 1 presents the results of the cell line clonality assessment, reporting clonal rearrangement lineages and the number of rearrangements detected. The Pan-Clonality Assay detected at least one rearrangement (IGH, IGK, IGL, IGK-KDE/Cint-KDE) in 25/26 cell lines tested indicating a sensitivity of approximately 96%. Heavy chain rearrangements were detected in 13/26 (50%) cases, and light chain rearrangements were detected in 23/26 (88%) cases. The clonal rearrangement profile of the BDCM cell line is particularly significant, as it shows that all four known clonal rearrangements involving heavy and light chains (IGHV3-23, IGLV4-60) and the Cint and KDE (IGKV2-28-IGKdel, Cint-IGKdel) were successfully identified using the single reaction Pan-Clonality Assay [,]. Figure 2 shows the detected clonal rearrangements and their frequency distributions as generated by the IGH and IGK/L repertoire analysis workflows on Ion Reporter software. The software outputs both the tabular format (Figure 2B,E) and the spectratyping plot format (Figure 2A,C,D) of clone frequencies across the repertoire (refer to Methods for a description of spectratyping).

Table 1.
Clonal rearrangement lineages (clonotype lineages) detected by the Pan-Clonality Assay in B-cell malignancy cell lines.
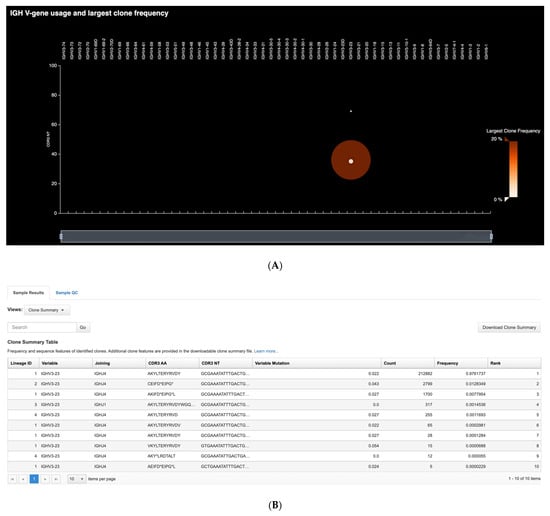
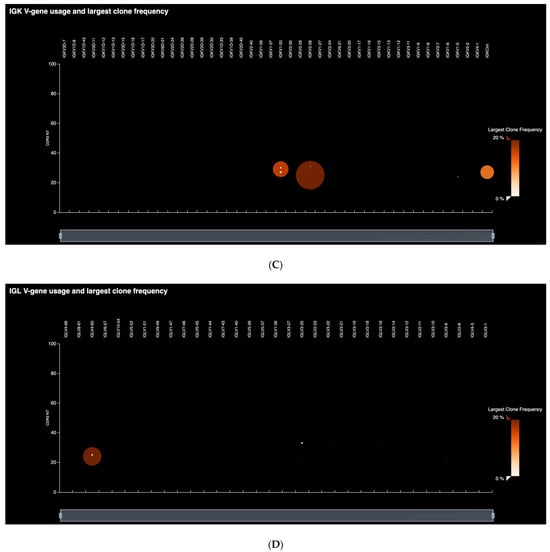

Figure 2.
Clonal rearrangement profile of the BDCM cell line. All four known heavy and light chain clonotypes (IGHV3-23, IGLV4-60, IGKV2-28-IGKdel, Cint-IGKdel) are detected using the single reaction Pan-Clonality Assay. (A) Spectratyping plot of heavy chain clonotypes highlights the largest clone frequencies in the sample as a function of V-gene usage and CDR3 length combinations. (B) Clone Summary Table first screen snapshot illustrating output from the heavy chain (IGH) workflow that lists every detected heavy chain clonotype in the sample, along with their VDJ annotation, CDR3 sequence and V-gene SHM levels. (C) Spectratyping plot for IGK clonotypes. (D) Spectratyping plot for IGL clonotypes. (E) Clone Summary Table first screen snapshot illustrating output from the light chain (IGKL) workflow.
A few clonal rearrangements were detected at lower-than-expected frequencies (indicated with a single asterisk in Table 1) or comprised a single clone with multiple entries (indicated with a double asterisk in Table 1), raising the possibility that SHM inhibited efficient priming during amplification [,]. The extensive V-gene diversity along with potential SHM and other mutations suggests that targeting additional loci may increase the success of detecting clonotypes in some cases. For this reason, we used two supplemental reflex assays, the Oncomine IGH FR2-J Assay and the Oncomine IGH FR3(d)-J Assay, designed to target different segments of the V(D)J region (V gene framework 2 and framework 3 distal to CDR3, respectively) for use as secondary or follow-up tests to improve detection. As expected, these assays identified IGH clonotypes in six additional cell line samples with five of these identified by the FR3(d)-J assay (Table 1). Of note, the SU-DHL-6 cell line has a translocation that juxtaposes a truncated bcl-2 gene with J6 in a tail-to-head configuration, so detection is not expected given the assay design and was used as a negative control cell line.
3.3. Range of DNA Input Concentrations and Limits of Detection
Clonotype detection across a range of DNA inputs was assessed. Cell line DNA ranging from 50 ng to 1 ng was spiked into peripheral blood lymphocyte (PBL) DNA at a ratio of 1:10 and total DNA input amounts ranging from 500 ng to 10 ng were sequenced. Assay performance was measured by tracking the detected frequency of a given clone across the range of inputs. The frequencies of IGH, IGK and IGL clonal rearrangements were highly similar across the different DNA inputs, suggesting that the Pan-Clonality Assay is robust to varying input concentrations (Figure 3A).
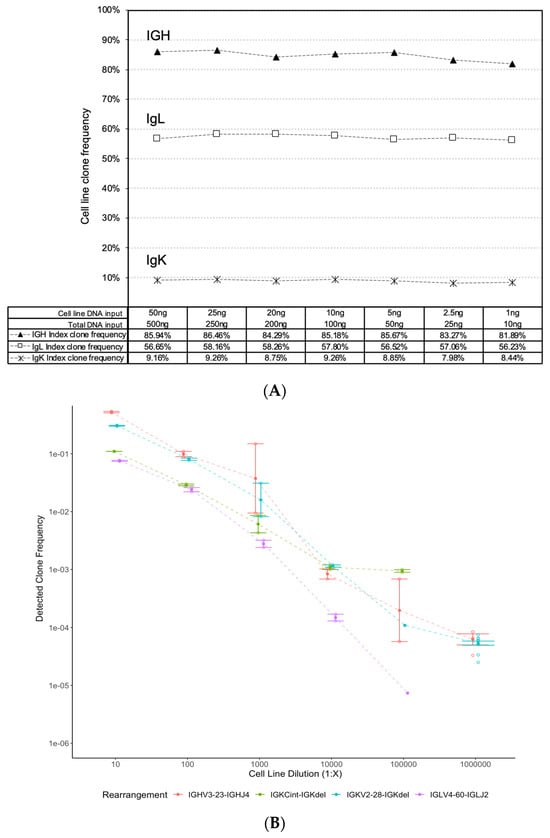
Figure 3.
Pan-Clonality Assay clonotype detection across a range of low DNA inputs and limits of dilution. Stable detection of IGH, IGK and IGL clonal rearrangements is evident from the dot plots of clonal frequencies detected (y-axis) across a range of (A) cell line DNA inputs from 50 ng down to 1 ng (x-axis), and (B) serial cell line dilutions from 10−1 down to 10−6 (x-axis).
Next, the lower limit of clonal rearrangement detection was evaluated. BDCM cell line DNA input was serially diluted down from 10−1 to 10−6 (1:10 to 1:1,000,000) in a background of 2 μg of PBL DNA, and the frequencies of the four known clonal rearrangements were tracked across these dilutions. The Oncomine BCR Pan-Clonality Assay User Guide MAN0019231 Revision B.0. that accompanies this assay outlines the recommended protocol for sequencing cell line dilutions for rare clone detection [] (Page 149; Table 11 of User Guide), and we noted that the recommended amount of input DNA required for the lowest LOD tested at 10−6 is higher than the other LOD ranges tested in this study. Accordingly, two gDNA libraries were prepared and sequenced to a depth of 2 M reads each, for all the cell line dilution experiments at 1:10 up to 1:100,000, and twelve gDNA libraries sequenced to a depth of 4 M reads each for that at 1:1,000,000. The assay showed a linear response among all four identified rearrangements (IGHV3-23-IGHJ4, IGKV2-28-IGKdel, IGLV4-60-IGLJ2, IGKCint-IGKdel) in the BDCM cell line (Figure 3B). The standard-error bars around the mean of receptor detection frequencies across the different gDNA libraries sequenced in each dilution experiment indicate robust detection. Furthermore, two of the four rearrangements (IGHV3-23-IGHJ4 and IGKV2-28-IGKdel) were detected at the lowest 1:10−6 dilution point, suggesting an overall lower limit of detection of approximately 10−6 for the assay.
3.4. Reproducibility
To assess the degree of reproducibility of the Pan-Clonality Assay, nine replicate libraries were generated from the same sample of PBL gDNA (BioChain Institute) by two different operators and sequenced on different chips using the Ion GeneStudio. The Ion Reporter multi-sample analysis option was used to compare clonal rearrangement frequencies between the replicates. The very high correlation of the top 50 detected clone frequencies between library replicates (Mean Pearson’s rho > 0.95) suggested that the assay was highly reproducible across experiments (Figure 4).
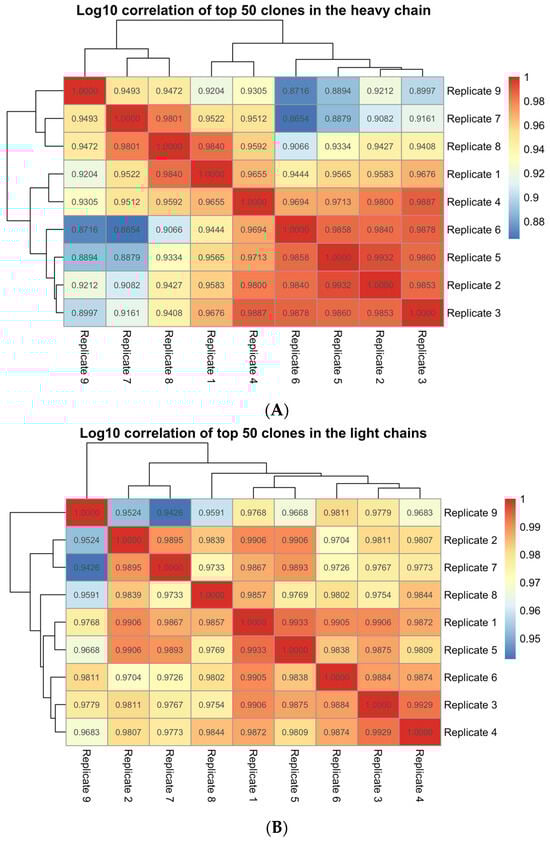
Figure 4.
Ion Reporter multi-sample analysis of library replicates from a single PBL gDNA sample. Pearson’s correlation value of the top 50 clone frequencies across pairwise comparisons of 9 library replicates using, (A) the IGH workflow (Mean Pearson’s rho = 0.95) and (B) the IGKL workflow (Mean Pearson’s rho = 0.98) of the Pan-Clonality Assay.
3.5. Clonotype Lineage Detection in Multiple Myeloma Samples
BCR SHM can result in clonality detection failure from point mutations targeted by most common multiplex primer designs, necessitating splitting samples into multiple reactions and requiring higher sample inputs. We tested the ability of the single-tube Pan-Clonality Assay to detect clonotype lineages in clinically relevant samples associated with SHM by analyzing BMA samples from 45 patients with MM and related plasma cell neoplasms. The number of reads required increases proportionally with the DNA input when sequencing to saturation for capturing the entire library complexity of a sample. In our experiment, we have established a standardized sequencing protocol that involves using a consistent 100 ng of DNA input per sample for library preparation across all the multiple myeloma samples. Based on this DNA input, >20,000 reads per sample were required to reach saturation, and only four samples had less than 50,000 reads. The Ion Reporter Clone Summary Table lists all unique sequence rearrangements in a sample. However, in order to merge highly similar sequences that may represent intraclonal diversity, the Ion Reporter Lineage Summary Table output was used to identify clonotype lineages. Examples of the Clone Summary Table and corresponding Lineage Summary Table from sample MM17 are shown in Figure 5.
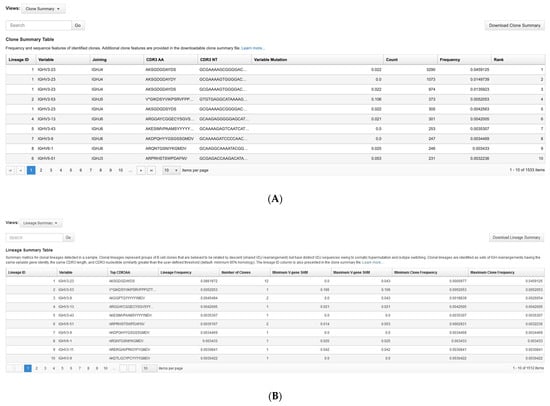

Figure 5.
Ion Reporter visualization of BCR rearrangements in a multiple myeloma sample. First-screen snapshots from Ion Reporter showing the first ten listings in the (A) Clone Summary Table and (B) Lineage Summary Table outputs for sample MM17. (C) The corresponding spectratyping plot shows the number of clonal rearrangements (green shaded circles) of a given CDR3nt length (y-axis) and IGH V-gene (x-axis).
The Pan-Clonality Assay results for the MM sample cohort are summarized in Table 2, and additional detailed sequencing data including chain usage, SHM and intraclonal diversity is provided in Supplementary Table S1. Table 2 shows the number of clonotype lineages detected in each sample. IGH and IGK clonotype lineages were detected in 33/45 (73%) and 30/45 (67%) samples, respectively. Clonotype lineages involving the KDE were observed in 11/45 (24%) samples for IGK-KDE and 9/45 (20%) for Cint-KDE. Clonal rearrangements of IGL were limited to lambda light chain restricted samples and occurred in 9/45 (20%) of patient samples overall and 9/16 (56%) lambda-restricted samples, including two samples (MM8 and MM16) that did not have detectable IGK or KDE clonal rearrangements. MM8 harbored a clonal IGH rearrangement in addition to the clonal IGL rearrangement, but IGL was the only clonal BCR marker in MM16. Altogether, at least one clonotype lineage was identified in 42/45 (93%) samples from patients with MM and related plasma cell neoplasms. All MM cases with detectable clonal IGH rearrangements contained one or two IGH clonotype lineages with the exception of MM35 which contained three. This sample had two separate monoclonal B-cell processes: MM and monoclonal B-cell lymphocytosis (MBL). In addition to the MM study, the Pan-Clonality Assay was tested using 10 BMA and 35 FFPE polyclonal specimens without clinically identifiable B cell neoplasms and confirmed no clonal rearrangements were detected (Supplementary Table S2). Supplementary Table S3 contains additional assay results from the analysis of 20 clonal B cell lymphoproliferative samples in a variety of FFPE tissues spanning a large range of tumor load and clonal frequency.
Table 2.
Clonal rearrangement lineages (clonotype lineages) detected by the Pan-Clonality Assay in a multiple myeloma sample cohort.
3.6. Identification of Subgroups in Multiple Myeloma Samples
Ion Reporter analysis of the MM sample cohort identified a few unexpected subgroups. Lineage analysis revealed several with multiple clonal rearrangements belonging to the same lineage (Supplementary Table S1). Some of these lineages may consist of multiple unique clonotype sequences with minor differences for technical reasons, resulting from the large sequencing depth (in some cases >1 million reads per sample) and inherent substitution rates []. However, other instances suggest bona fide intraclonal diversity. One example is illustrated using the Ion Reporter spectratyping plot (refer to Methods for a description of spectratyping) to highlight the number of identified clones. As seen in Figure 5C, the IGH spectratyping plot for sample MM17 revealed a dominant clonal lineage in the population, as indicated by the size of the circle, with green shading to indicate that multiple rearrangements share the same IGHV chain and CDR3 nucleotide length. The lineage summary table shows that this dominant member comprises 12 unique clones (Figure 5B) and the corresponding clone summary table snapshot (Figure 5A) shows that four of these rearrangements (indicated by Lineage ID 1) have a relative abundance (counts ranging from 305 to 3290 reads) much higher than can be explained by base substitution sequencing errors, particularly given the exceptionally low substitution sequencing error rate of the Ion Torrent Platform [,]. Within the MM sample cohort having clonal IGH rearrangements, we identified 8/33 (24%) with five or more clones, including one case (MM30) with 23 clones. These findings suggest intraclonal diversity/ongoing SHM occurring in 8/45 (18%) patients in the MM sample cohort overall.
The analysis also revealed that two heavy chains, IGHV3-11 and IGHV4-34, were disproportionately represented among the clonal rearrangements identified. Within patient samples having detectable IgH clonotype lineages, IGHV3-11 was the highest frequency clonotype in 5/33 (15%) samples, while IGHV4-34 was the highest frequency clonotype in 4/33 (12%) samples. Taken together, IGHV3-11 or IGHV4-34 clonotype lineages accounted for the dominant clonotype in 9/33 (27%) patient samples with clonal IgH rearrangements representing 9/45 (20%) of the overall MM sample cohort.
Over the applicable V-gene read length, Ion Reporter also reports % SHM. Within the MM sample cohort, 31/33 (94%) with clonal IGH rearrangements showed evidence of SHM including 13/33 (39%) with SHM levels > 7% and 6/33 (18%) with SHM levels >10%. However, two samples (MM7 and MM23) contained dominant IGH clonotypes with 0% SHM over the FR3-J read length. Follow-up FR1-J sequencing (near full-length V-gene) confirmed SHM rates lower than expected for plasma cells, at 0.44% and 1.33% SHM for MM7 and MM23, respectively (data not shown).
4. Discussion
BCR clonality testing by NGS offers advantages over PCR-based methods such as CE and next-generation flow cytometry (NFC) in the clinical diagnosis and follow-up of patients with B-cell neoplasms, including MM. CE clonality assessment is based on sizing PCR fragments (not sequence identity), and it is well recognized that clonal CE peaks may contain more than one distinct clonotype lineage having the same PCR product size. This limits the sensitivity of CE to about 5% making it unsuitable for the clinical diagnosis and follow-up of minor clonal B-cell populations. NGS clonality assessment offers advantages over NFC including requiring fewer cells to achieve 10−5 sensitivity and being applicable to frozen and formalin-fixed paraffin-embedded samples. Standard NGS clonotyping can identify clonal BCR rearrangements in up to 95% of B-cell neoplasms but frequently requires sequential testing with multiple IGH primer sets targeting IGH (FR1, FR2, FR3, leader sequence upstream of FR1) and IGK, especially in cases associated with high levels of SHM due to inefficient primer binding from point mutations in FR regions. The need for multiple reactions to profile the B-cell repertoire increases assay cost and turn-around time and may not be suitable for limited samples.
A single-tube reaction that enables the sequencing of all the B-cell receptor loci presents a significant advantage over multi-tube assays for highly efficient, low input clonality assessment. Here, we validate the performance of the Pan-Clonality Assay for deep sequencing and clonotype detection in B-cell neoplasms. In a single reaction, one or more clonal rearrangements involving IGH, IGK, IGL, and Cint-KDE loci were detected in 25/26 (96%) B-cell lines and 42/45 (93%) BMA samples from patients with MM and related plasma cell neoplasms. Within the lambda-restricted light chain group, IGL clonotype lineages were identified in 9/16 (56%) samples, including one sample (MM8) that had no IGK or KDE clonal rearrangements, and another (MM16) for which IGL was the only clonal BCR marker identified. The detection of a lambda rearrangement without a corresponding Cint-KDE or IGK-KDE rearrangement was also observed in the cell line samples (Table 1). This may result from inefficient priming due to SNPs in the non-hypermutated rearrangements, or from an unamplified IGK rearrangement in cells that may co-express kappa and lambda chain RNA []. Taken together, the overall frequency of clonal rearrangement detection using the Pan-Clonality Assay is comparable to clonotype detection rates reported in MM performed using other NGS assays that require multiple tubes targeting individual BCR loci [,,]. Furthermore, the identification of clonal IGL rearrangements afforded by the Pan-Clonality Assay is a significant benefit for clonotype detection.
NGS offers additional benefits compared to CE and NFC-based analysis because it allows investigators to assess potentially valuable information about the clone that may be relevant to the pathogenesis of lymphoid malignancies, including MM. This includes biased usage of V gene segments, stereotypy, SHM status, and intra-clonal diversity status that can provide clues to the cell of origin, and potentially identify subgroups within categories of lymphoid neoplasms with distinct clinicopathologic features.
Analysis of our MM cohort with the Pan-Clonality Assay identified biased IGHV usage with V3-11 and V4-34 overrepresented compared to normal B-cell repertoires. IGHV4-34 usage is linked to autoreactive antibodies and is underrepresented in germinal center (GC) and memory B cells from healthy individuals, possibly as a mechanism to prevent plasma cells from producing autoantibodies [,,,]. The high prevalence of IGHV4-34 usage in Burkitt lymphoma, CLL, and marginal zone lymphoma has led to a suggestion that autoreactive antigens may drive the expansion of some B-cell neoplasms with our findings suggesting that some cases of MM can be added to this list [,]. In contrast to CLL, mantle cell lymphoma, and marginal zone lymphoma, and in agreement with other MM studies, our cohort of MM samples showed no evidence of stereotypy [,].
Within the MM sample cohort with clonal IGH rearrangements, 31/33 (94%) showed SHM, defined as less than 98% homology with germline genes [,]. This finding is in agreement with studies of reactive and neoplastic plasma cells and consistent with a postulated post-GC B-cell as the cell of origin in MM [,]. Of note, Medina et al. reported high levels of SHM (>7%) in 26% of transplant-ineligible MM samples with IGH clonal rearrangements, which was associated with improved survival []. Consistent with this report, 13/33 (39%) of the MM patients with clonal IGH rearrangements in our study fulfilled the criterion for high levels of SHM, with 6/33 (18%) showing mutational loads of >10%.
Although most MM cases showed high rates of SHM, 2/33 (6%) cases with clonal IGH rearrangements were found to be 0% mutated using the Pan-Clonality Assay that assesses FR3. Medina et al., also identified unmutated SHM status in 5/349 (1.4%) of MM cases with clonal IGH rearrangements but attributed this to not being able to sequence FR1 and part of FR2, stating that “the mutational load was most likely underestimated, rather than being truly mutated cases” []. However, we sequenced both unmutated cases in our cohort with FR1-J primers and found the mutation rate was truly low in both (0.44% and 1.3%). Although not 0%, this level of SHM is well below the 2% threshold used to assign SHM status in CLL and suggests some MM cases may originate from a pre-GC B-cell.
The Ion Reporter software also permits assessment of intraclonal diversity as a marker of ongoing SHM that is characteristic of B-cell neoplasms of germinal center origin including follicular lymphoma, Burkitt lymphoma, and the germinal center B-cell subtype of Diffuse Large B Cell Lymphoma []. Within the MM sample cohort overall, we identified 8/45 (18%) cases with five or more clones, including one case (MM30) with 23 clones. This high level of intraclonal diversity indicates a possible germinal center origin for some MM cases and is consistent with IGHV NGS analysis of RNA samples from MM that suggested neoplastic transformation can be initiated in a germinal center B-cell with ongoing SHM that has committed to terminal differentiation []. It will be of interest to determine the effect, if any, that ongoing SHM has on clinical outcomes in MM in future studies.
The Pan-Clonality Assay uses the AmpliSeq primer design strategy to enable a single-tube reaction. This strategy reduces the level of mis-priming or primer-dimer formation, while the primers themselves are chemically modified so they can be digested away after the targeting PCR reaction, removing most wasteful primer-related byproducts []. The ability to eliminate off-target products allows for primer concentrations to be saturating, leading to library workflows with flexibility in sample input amounts from 1 ng to 2 µg of gDNA. Robust performance across a large input range is particularly significant for immune repertoire sequencing where peripheral blood or BMA samples may have drastically different input requirements compared to tissue biopsies with limited immune cell infiltration. We also determined that the assay is suitable for formalin fixed tissue biopsies from 100 ng inputs indicating its broad applicability for lymphoma diagnostics, including low-input degraded DNA samples (Supplementary Table S3).
NGS clonality determination can be integrated into routine B-LPD diagnostic algorithms as an adjunct to IHC and/or FCM (flow cytometry) studies in cases where IHC is equivocal or fresh tissue is not available for FCM. However, even in cases where clonality has been established by IHC and/or FCM, NGS clonotyping can still play a significant role in disease classification and treatment selection which is best illustrated by IGHV SHM status functioning as both a prognostic and predictive marker in CLL []. Finally, NGS clonotyping is key to identifying trackable markers for monitoring B-LPD treatment response with high sensitivity. Although clonotype detection by NGS is superior to CE analysis, one limitation is that a clonotype cannot be detected in all B-LPDs, even using multiple tube approaches. In these cases, NGS analysis of genes implicated in the pathogenesis of B-LPD can potentially function as clonal markers. However, for the vast majority of B-LPD patients, NGS clonotyping would suffice for these purposes. Thus, the single-tube assay Pan-Clonality Assay is expected to be widely adopted in B-LPD diagnostic algorithms, as it will obviate the need for multiple tube reflex testing associated with existing NGS approaches to achieve extremely high levels of clonotype detection even in challenging cases associated with high levels of SHM, such as MM.
5. Conclusions
The highly efficient, low input BCR Pan-Clonality Assay, that sequences all B-cell receptor loci in a single reaction tube and detects BCR clonotype lineages at rates comparable to existing multiple reaction assays, offers key advantages of relevance to B-cell neoplasia diagnosis and monitoring with respect to cost savings, improved turnaround time, and clinical sample preservation. The Ion Reporter analysis software packaged with the assay also provides exciting opportunities to conduct cell-of-origin studies in B-cell neoplasia and uncover subgroups within categories of lymphoid neoplasms having distinct clinicopathologic features.
Supplementary Materials
The following supporting information can be downloaded at: https://www.mdpi.com/article/10.3390/jmp5010004/s1, Table S1: List of Clonotype Lineages Detected in Multiple Myeloma Specimens; Table S2: IGH, IGK, KDE, IGL Analysis of Reactive Lymphoproliferation (Polyclonal) Samples; Table S3: IGH, IGK, KDE, IGL Analysis of Clonal B-Cell Lymphoproliferative Samples in FFPE Tissue.
Author Contributions
Conceptualization, L.P., S.S., G.M.L. and J.F.D.; methodology, L.P., S.S., T.J.L., C.Y., G.M.L. and J.F.D.; software, T.J.L.; validation, J.S., M.J.B. and H.G.; formal analysis, L.P., S.S., M.T., L.T.P., S.O., C.Y., K.M., C.R.G., G.M.L. and J.F.D.; investigation, L.P., S.S., W.H., C.G., M.T., L.T.P. and S.O.; resources, J.S., M.J.B., H.G., G.M.L. and J.F.D.; data curation, J.S., K.M. and J.F.D.; writing—original draft preparation, L.P., S.S., G.M.L. and J.F.D.; writing—review and editing, L.P., S.S., C.R.G., T.J.L., G.M.L. and J.F.D.; visualization, T.J.L.; supervision, G.M.L. and J.F.D.; project administration, K.M. and J.F.D.; funding acquisition, J.S. and J.F.D. All authors have read and agreed to the published version of the manuscript.
Funding
This research was funded by the Saskatchewan Cancer Agency, grant number 426243-1106.
Institutional Review Board Statement
The study was conducted in accordance with the Declaration of Helsinki and approved by the University of Saskatchewan Biomedical Research Ethics Board (Study Number: 356834-CFS; Date of Approval: 9 August 2022).
Informed Consent Statement
Informed consent was obtained from all subjects involved in the study.
Data Availability Statement
The datasets from this study are available from the corresponding author upon request.
Acknowledgments
The authors would like to acknowledge Helen Fleisig for her contributions in organizing this collaborative study.
Conflicts of Interest
L.P., K.M., W.H., C.G., J.S., M.J.B., H.G. and C.R.G. declare no conflicts of interest. J.F.D. served as a member of the Thermo Fisher Scientific, Inc. Hemato-Oncology Advisory Board. S.S., M.T., L.T.P., S.O., T.J.L. and C.Y. are full-time employees of Thermo Fisher Scientific, Inc. G.M.L. is a full-time employee of and stockholder in Thermo Fisher Scientific, Inc.
References
- Gazzola, A.; Mannu, C.; Rossi, M.; Laginestra, M.A.; Sapienza, M.R.; Fuligni, F.; Etebari, M.; Melle, F.; Sabattini, E.; Agostinelli, C.; et al. The evolution of clonality testing in the diagnosis and monitoring of hematological malignancies. Ther. Adv. Hematol. 2014, 5, 35–47. [Google Scholar] [CrossRef] [PubMed]
- Ma, J.; Redmond, D.; Miyaguchi, A.; Nam, A.S.; Nie, K.; Mathew, S.; Elemento, O.; Tam, W. Exploring tumor clonal evolution in bone marrow of patients with diffuse large B-cell lymphoma by deep IGH sequencing and its potential relevance in relapse. Blood Cancer J. 2019, 9, 69. [Google Scholar] [CrossRef] [PubMed]
- Murphy, K.; Weaver, C.; Janeway, C. Janeway’s Immunobiology, 9th ed.; Garland Science: New York, NY, USA, 2017. [Google Scholar]
- Yaari, G.; Kleinstein, S.H. Practical guidelines for B-cell receptor repertoire sequencing analysis. Genome Med. 2015, 7, 121. [Google Scholar] [CrossRef]
- Rustad, E.H.; Hultcrantz, M.; Yellapantula, V.D.; Akhlaghi, T.; Ho, C.; Arcila, M.E.; Roshal, M.; Patel, A.; Chen, D.; Devlin, S.M.; et al. Baseline identification of clonal V(D)J sequences for DNA-based minimal residual disease detection in multiple myeloma. PLoS ONE 2019, 14, e0211600. [Google Scholar] [CrossRef] [PubMed]
- Evans, P.A.S.; Pott, C.; Groenen, P.J.T.A.; Salles, G.; Davi, F.; Berger, F.; Garcia, J.F.; van Krieken, J.H.J.M.; Pals, S.; Kluin, P.; et al. Significantly improved PCR-based clonality testing in B-cell malignancies by use of multiple immunoglobulin gene targets. Report of the BIOMED-2 Concerted Action BHM4-CT98-3936. Leukemia 2007, 21, 207–214. [Google Scholar] [CrossRef]
- van Dongen, J.J.M.; Langerak, A.W.; Brüggemann, M.; Evans, P.A.S.; Hummel, M.; Lavender, F.L.; Delabesse, E.; Davi, F.; Schuuring, E.; García-Sanz, R.; et al. Design and standardization of PCR primers and protocols for detection of clonal immunoglobulin and T-cell receptor gene recombinations in suspect lymphoproliferations: Report of the BIOMED-2 Concerted Action BMH4-CT98-3936. Leukemia 2003, 17, 2257–2317. [Google Scholar] [CrossRef]
- Langerak, A.W.; Groenen, P.J.T.A.; Brüggemann, M.; Beldjord, K.; Bellan, C.; Bonello, L.; Boone, E.; Carter, G.I.; Catherwood, M.; Davi, F.; et al. EuroClonality/BIOMED-2 guidelines for interpretation and reporting of Ig/TCR clonality testing in suspected lymphoproliferations. Leukemia 2012, 26, 2159–2171. [Google Scholar] [CrossRef]
- Scheijen, B.; Meijers, R.W.J.; Rijntjes, J.; van der Klift, M.Y.; Möbs, M.; Steinhilber, J.; Steinhilber, J.; Reigl, T.; Brand, M.v.D.; Kotrová, M.; et al. Next-generation sequencing of immunoglobulin gene rearrangements for clonality assessment: A technical feasibility study by EuroClonality-NGS. Leukemia 2019, 33, 2227–2240. [Google Scholar] [CrossRef]
- Stewart, J.P.; Gazdova, J.; Darzentas, N.; Wren, D.; Proszek, P.; Fazio, G.; Songia, S.; Alcoceba, M.; Sarasquete, M.E.; Villarese, P.; et al. Validation of the EuroClonality-NGS DNA capture panel as an integrated genomic tool for lymphoproliferative disorders. Blood Adv. 2021, 5, 3188–3198. [Google Scholar] [CrossRef]
- van den Brand, M.; Rijntjes, J.; Möbs, M.; Steinhilber, J.; van der Klift, M.Y.; Heezen, K.C.; Kroeze, L.I.; Reigl, T.; Porc, J.; Darzentas, N.; et al. Next-Generation Sequencing–Based Clonality Assessment of Ig Gene Rearrangements: A Multicenter Validation Study by EuroClonality-NGS. J. Mol. Diagn. 2021, 23, 1105–1115. [Google Scholar] [CrossRef]
- Ho, C.; Syed, M.; Roshal, M.; Petrova-Drus, K.; Moung, C.; Yao, J.; Quesada, A.E.; Benhamida, J.; Vanderbilt, C.; Liu, Y.; et al. Routine Evaluation of Minimal Residual Disease in Myeloma Using Next-Generation Sequencing Clonality Testing. J. Mol. Diagn. 2021, 23, 181–199. [Google Scholar] [CrossRef] [PubMed]
- Arcila, M.E.; Yu, W.; Syed, M.; Kim, H.; Maciag, L.; Yao, J.; Ho, C.; Petrova, K.; Moung, C.; Salazar, P.; et al. Establishment of Immunoglobulin Heavy (IGH) Chain Clonality Testing by Next-Generation Sequencing for Routine Characterization of B-Cell and Plasma Cell Neoplasms. J. Mol. Diagn. 2019, 21, 330–342. [Google Scholar] [CrossRef] [PubMed]
- Van den Brand, M.; Möbs, M.; Otto, F.; Kroeze, L.I.; Gonzalez de Castro, D.; Stamatopoulos, K.; Davi, F.; Bravetti, C.; Kolijn, P.M.; Vlachonikola, E.; et al. EuroClonality-NGS Recommendations for Evaluation of B-Cell Clonality Analysis by Next-Generation Sequencing: A Structured Approach with the DEPART Algorithm. J. Mol. Diagn. 2023, 25, 729–739. [Google Scholar] [CrossRef] [PubMed]
- van Bladel, D.A.G.; van der Last-Kempkes, J.L.M.; Scheijen, B.; Groenen, P.J.T.A. Next-Generation Sequencing-Based Clonality Detection of Immunoglobulin Gene Rearrangements in B-Cell Lymphoma. In Methods in Molecular Biology; Humana Press Inc.: Totowa, NJ, USA, 2022; Volume 2453, pp. 7–42. [Google Scholar] [CrossRef]
- Brüggemann, M.; Kotrová, M.; Knecht, H.; Bartram, J.; Boudjogrha, M.; Bystry, V.; Bystry, V.; Fazio, G.; Froňková, E.; Giraud, M.; et al. Standardized next-generation sequencing of immunoglobulin and T-cell receptor gene recombinations for MRD marker identification in acute lymphoblastic leukaemia; a EuroClonality-NGS validation study. Leukemia 2019, 33, 2241–2253. [Google Scholar] [CrossRef] [PubMed]
- Glenn, S.T.; Galbo, P.M.; Luce, J.D.; Miles, K.M.; Singh, P.K.; Glynias, M.J.; Morrison, C. Development and Implementation of an Automated and Highly Accurate Reporting Process for NGS-Based Clonality Testing. Oncotarget 2023, 14, 450–461. [Google Scholar] [CrossRef] [PubMed]
- Ha, J.; Lee, H.; Shin, S.; Cho, H.; Chung, H.; Jang, J.E.; Kim, S.-J.; Cheong, J.-W.; Lee, S.-T.; Kim, J.S.; et al. Ig Gene Clonality Analysis Using Next-Generation Sequencing for Improved Minimal Residual Disease Detection with Significant Prognostic Value in Multiple Myeloma Patients. J. Mol. Diagn. 2022, 24, 48–56. [Google Scholar] [CrossRef] [PubMed]
- Hou, X.; Chen, J.; Wang, L.; Dai, Y.; Diao, H. Basic research and clinical application of immune repertoire sequencing. Int. J. Clin. Exp. Med. 2016, 9, 18868–18882. [Google Scholar]
- Ghia, P.; Stamatopoulos, K.; Belessi, C.; Moreno, C.; Stilgenbauer, S.; Stevenson, F.; Davi, F.; Rosenquist, R. ERIC recommendations on IGHV gene mutational status analysis in chronic lymphocytic leukemia. Leukemia 2007, 21, 1–3. [Google Scholar] [CrossRef]
- Storb, U.; Ming Shen, H.; Michael, N.; Kim, N. Somatic hypermutation of immunoglobulin and non–immunoglobulin genes. Philos. Trans. R. Soc. London. Ser. B Biol. Sci. 2001, 356, 13–19. [Google Scholar] [CrossRef]
- Rawstron, A.C.; Orfao, A.; Beksac, M.; Bezdickova, L.; Brooimans, R.A.; Bumbea, H.; Dalva, K.; Fuhler, G.; Gratama, J.; Hose, D.; et al. Report of the European Myeloma Network on multiparametric flow cytometry in multiple myeloma and related disorders. Haematologica 2008, 93, 431–438. [Google Scholar] [CrossRef]
- Rajkumar, S.V.; Dimopoulos, M.A.; Palumbo, A.; Blade, J.; Merlini, G.; Mateos, M.-V.; Kumar, S.; Hillengass, J.; Kastritis, E.; Richardson, P.; et al. International Myeloma Working Group updated criteria for the diagnosis of multiple myeloma. Lancet Oncol. 2014, 15, e538–e548. [Google Scholar] [CrossRef]
- Palumbo, A.; Avet-Loiseau, H.; Oliva, S.; Lokhorst, H.M.; Goldschmidt, H.; Rosinol, L.; Richardson, P.; Caltagirone, S.; Lahuerta, J.J.; Facon, T.; et al. Revised International Staging System for Multiple Myeloma: A Report from International Myeloma Working Group. J. Clin. Oncol. 2015, 33, 2863–2869. [Google Scholar] [CrossRef]
- Lefranc, M.-P. IMGT, the International ImMunoGeneTics Information System. Cold Spring Harb. Protoc. 2011, 2011, pdb.top115. [Google Scholar] [CrossRef]
- Looney, T.J.; Duose, D.Y.; Lowman, G.; Linch, E.; Hajjar, J.; Topacio-Hall, D.; Xu, M.; Zheng, J.; Alshawa, A.; Tapia, C.; et al. Haplotype Analysis of the T-Cell Receptor Beta (TCRB) Locus by Long-Amplicon TCRB Repertoire Sequencing. J. Immunother. Precis. Oncol. 2019, 2, 137–143. [Google Scholar] [CrossRef]
- Tan, K.-T.; Ding, L.-W.; Sun, Q.-Y.; Lao, Z.-T.; Chien, W.; Ren, X.; Xiao, J.-F.; Loh, X.Y.; Xu, L.; Lill, M.; et al. Profiling the B/T cell receptor repertoire of lymphocyte derived cell lines. BMC Cancer 2018, 18, 940. [Google Scholar] [CrossRef]
- Matsuo, Y.; Drexler, H.G. Establishment and characterization of human B cell precursor-leukemia cell lines. Leuk. Res. 1998, 22, 567–579. [Google Scholar] [CrossRef] [PubMed]
- Oncomine Human Immune Repertoire User Guide (For Use in Hematology Research); Thermo Fisher Scientific: Waltham, MA, USA, 2021; MAN0019231, Rev. B.0.
- Merriman, B.; Ion Torrent R&D Team; Rothberg, J.M. Progress in Ion Torrent semiconductor chip based sequencing. Electrophoresis 2012, 33, 3397–3417. [Google Scholar] [CrossRef] [PubMed]
- Looney, T.J.; Topacio-Hall, D.; Lowman, G.; Conroy, J.; Morrison, C.; Oh, D.; Fong, L.; Zhang, L. TCR Convergence in Individuals Treated with Immune Checkpoint Inhibition for Cancer. Front. Immunol. 2020, 10, 2985. [Google Scholar] [CrossRef]
- Guo, L.; Wang, Z.; Anderson, C.M.; Doolittle, E.; Kernag, S.; Cotta, C.V.; Ma, X.-J.; Cook, J.R. Ultrasensitive automated RNA in situ hybridization for kappa and lambda light chain mRNA detects B-cell clonality in tissue biopsies with performance comparable or superior to flow cytometry. Mod. Pathol. 2018, 31, 385–394. [Google Scholar] [CrossRef] [PubMed]
- Martinez-Lopez, J.; Lahuerta, J.J.; Pepin, F.; González, M.; Barrio, S.; Ayala, R.; Puig, N.; Montalban, M.A.; Paiva, B.; Weng, L.; et al. Prognostic value of deep sequencing method for minimal residual disease detection in multiple myeloma. Blood 2014, 123, 3073–3079. [Google Scholar] [CrossRef] [PubMed]
- Rustad, E.H.; Misund, K.; Bernard, E.; Coward, E.; Yellapantula, V.D.; Hultcrantz, M.; Ho, C.; Kazandjian, D.; Korde, N.; Mailankody, S.; et al. Stability and uniqueness of clonal immunoglobulin CDR3 sequences for MRD tracking in multiple myeloma. Am. J. Hematol. 2019, 94, 1364–1373. [Google Scholar] [CrossRef]
- Hultcrantz, M.; Rustad, E.H.; Yellapantula, V.; Arcila, M.; Ho, C.; Syed, M.H.; Ho, C.; Kazandjian, D.; Korde, N.; Mailankody, S.; et al. Baseline VDJ clonotype detection using a targeted sequencing NGS assay: Allowing for subsequent MRD assessment. Blood Cancer J. 2020, 10, 76. [Google Scholar] [CrossRef] [PubMed]
- Bashford-Rogers, R.J.M.; Smith, K.G.C.; Thomas, D.C. Antibody repertoire analysis in polygenic autoimmune diseases. Immunology 2018, 155, 3–17. [Google Scholar] [CrossRef]
- Pugh-Bernard, A.E.; Silverman, G.J.; Cappione, A.J.; Villano, M.E.; Ryan, D.H.; Insel, R.A.; Sanz, I. Regulation of inherently autoreactive VH4-34 B cells in the maintenance of human B cell tolerance. J. Clin. Investig. 2001, 108, 1061–1070. [Google Scholar] [CrossRef] [PubMed]
- Funkhouser, W.K.; Warnke, R.A. Preferential IgH V4-34 gene segment usage in particular subtypes of B-cell lymphoma detected by antibody 9G4. Hum. Pathol. 1998, 29, 1317–1321. [Google Scholar] [CrossRef]
- Kostareli, E.; Hadzidimitriou, A.; Stavroyianni, N.; Darzentas, N.; Athanasiadou, A.; Gounari, M.; Bikos, V.; Agathagelidis, A.; Touloumenidou, T.; Zorbas, I.; et al. Molecular evidence for EBV and CMV persistence in a subset of patients with chronic lymphocytic leukemia expressing stereotyped IGHV4-34 B-cell receptors. Leukemia 2009, 23, 919–924. [Google Scholar] [CrossRef] [PubMed]
- Medina, A.; Jiménez, C.; Sarasquete, M.E.; González, M.; Chillón, M.C.; Balanzategui, A.; Prieto-Conde, I.; García-Álvarez, M.; Puig, N.; González-Calle, V.; et al. Molecular profiling of immunoglobulin heavy-chain gene rearrangements unveils new potential prognostic markers for multiple myeloma patients. Blood Cancer J. 2020, 10, 14. [Google Scholar] [CrossRef]
- Ferrero, S.; Capello, D.; Svaldi, M.; Boi, M.; Gatti, D.; Drandi, D.; Rossi, D.; Barbiero, S.; Mantoan, B.; Mantella, E.; et al. Multiple myeloma shows no intra-disease clustering of immunoglobulin heavy chain genes. Haematologica 2012, 97, 849–853. [Google Scholar] [CrossRef]
- Rosenquist, R.; Ghia, P.; Hadzidimitriou, A.; Sutton, L.-A.; Agathangelidis, A.; Baliakas, P.; Darzentas, N.; Giudicelli, V.; Lefranc, M.-P.; Langerak, A.W.; et al. Immunoglobulin gene sequence analysis in chronic lymphocytic leukemia: Updated ERIC recommendations. Leukemia 2017, 31, 1477–1481. [Google Scholar] [CrossRef]
- Guo, J.; McKenna, S.L.; O’Dwyer, M.E.; Cahill, M.R.; O’Driscoll, C.M. RNA interference for multiple myeloma therapy: Targeting signal transduction pathways. Expert Opin. Ther. Targets 2016, 20, 107–121. [Google Scholar] [CrossRef]
- Munguía-Fuentes, R.; Maqueda-Alfaro, R.A.; Chacón-Salinas, R.; Flores-Romo, L.; Yam-Puc, J.C. Germinal Center Cells Turning to the Dark Side: Neoplasms of B Cells, Follicular Helper T Cells, and Follicular Dendritic Cells. Front. Oncol. 2021, 10, 587809. [Google Scholar] [CrossRef] [PubMed]
- Cowan, G.; Weston-Bell, N.J.; Bryant, D.; Seckinger, A.; Hose, D.; Zojer, N.; Sahota, S.S. Massive parallel IGHV gene sequencing reveals a germinal center pathway in origins of human multiple myeloma. Oncotarget 2015, 6, 13229–13240. [Google Scholar] [CrossRef] [PubMed]
Disclaimer/Publisher’s Note: The statements, opinions and data contained in all publications are solely those of the individual author(s) and contributor(s) and not of MDPI and/or the editor(s). MDPI and/or the editor(s) disclaim responsibility for any injury to people or property resulting from any ideas, methods, instructions or products referred to in the content. |
© 2024 by the authors. Licensee MDPI, Basel, Switzerland. This article is an open access article distributed under the terms and conditions of the Creative Commons Attribution (CC BY) license (https://creativecommons.org/licenses/by/4.0/).