
Evaluation of the TruSight Tumor 170 Assay and Its Value in Clinical Diagnostics

 and
and
Abstract
:1. Introduction
2. Materials and Methods
2.1. Samples
2.2. Nucleic Acid Extraction
2.3. TruSight Tumor 170 Assay
3. Results
4. Discussion
5. Conclusions
Author Contributions
Funding
Institutional Review Board Statement
Informed Consent Statement
Data Availability Statement
Conflicts of Interest
References
- Tan, O.; Shrestha, R.; Cunich, M.; Schofield, D.J. Application of next-generation sequencing to improve cancer management: A review of the clinical effectiveness and cost-effectiveness. Clin. Genet. 2018, 93, 533–544. [Google Scholar] [CrossRef] [PubMed] [Green Version]
- Verma, R.; Sharma, P.C. Next generation sequencing-based emerging trends in molecular biology of gastric cancer. Am. J. Cancer Res. 2018, 8, 207–225. [Google Scholar] [PubMed]
- Behjati, S.; Tarpey, P.S. What is next generation sequencing? Arch. Dis. Child Educ. Pract. Ed. 2013, 98, 236–238. [Google Scholar] [CrossRef] [PubMed]
- Hadd, A.G.; Houghton, J.; Choudhary, A.; Sah, S.; Chen, L.; Marko, A.C.; Sanford, T.; Buddavarapu, K.; Krosting, J.; Garmire, L.; et al. Targeted, high-depth, next-generation sequencing of cancer genes in formalin-fixed, paraffin-embedded and fine-needle aspiration tumor specimens. J. Mol. Diagn. 2013, 15, 234–247. [Google Scholar] [CrossRef] [PubMed]
- Heydt, C.; Fassunke, J.; Kunstlinger, H.; Ihle, M.A.; Konig, K.; Heukamp, L.C.; Schildhaus, H.U.; Odenthal, M.; Buttner, R.; Merkelbach-Bruse, S. Comparison of pre-analytical FFPE sample preparation methods and their impact on massively parallel sequencing in routine diagnostics. PLoS ONE 2014, 9, e104566. [Google Scholar] [CrossRef] [PubMed]
- König, K.; Peifer, M.; Fassunke, J.; Ihle, M.A.; Künstlinger, H.; Heydt, C.; Stamm, K.; Ueckeroth, F.; Vollbrecht, C.; Bos, M.; et al. Implementation of Amplicon Parallel Sequencing Leads to Improvement of Diagnosis and Therapy of Lung Cancer Patients. J. Thorac. Oncol. 2015, 10, 1049–1057. [Google Scholar] [CrossRef] [PubMed] [Green Version]
- Abel, H.J.; Duncavage, E.J. Detection of structural DNA variation from next generation sequencing data: A review of informatic approaches. Cancer Genet. 2013, 206, 432–440. [Google Scholar] [CrossRef] [PubMed] [Green Version]
- Cheng, D.T.; Mitchell, T.N.; Zehir, A.; Shah, R.H.; Benayed, R.; Syed, A.; Chandramohan, R.; Liu, Z.Y.; Won, H.H.; Scott, S.N.; et al. Memorial Sloan Kettering-Integrated Mutation Profiling of Actionable Cancer Targets (MSK-IMPACT): A Hybridization Capture-Based Next-Generation Sequencing Clinical Assay for Solid Tumor Molecular Oncology. J. Mol. Diagn. 2015, 17, 251–264. [Google Scholar] [CrossRef] [PubMed]
- Zarei, S.; Abdul-Karim, F.W.; Chase, D.M.; Astbury, C.; Policarpio-Nicolas, M.L.C. Uterine Inflammatory Myofibroblastic Tumor Showing an Atypical ALK Signal Pattern by FISH and DES-ALK Fusion by RNA Sequencing: A Case Report. Int. J. Gynecol. Pathol. 2019, 39, 152–156. [Google Scholar] [CrossRef] [PubMed]
- Bergethon, K.; Shaw, A.T.; Ou, S.H.; Katayama, R.; Lovly, C.M.; McDonald, N.T.; Massion, P.P.; Siwak-Tapp, C.; Gonzalez, A.; Fang, R.; et al. ROS1 rearrangements define a unique molecular class of lung cancers. J. Clin. Oncol. 2012, 30, 863–870. [Google Scholar] [CrossRef] [PubMed] [Green Version]
- Lindeman, N.I.; Cagle, P.T.; Aisner, D.L.; Arcila, M.E.; Beasley, M.B.; Bernicker, E.H.; Colasacco, C.; Dacic, S.; Hirsch, F.R.; Kerr, K.; et al. Updated Molecular Testing Guideline for the Selection of Lung Cancer Patients for Treatment With Targeted Tyrosine Kinase Inhibitors: Guideline From the College of American Pathologists, the International Association for the Study of Lung Cancer, and the Association for Molecular Pathology. J. Mol. Diagn. 2018, 20, 129–159. [Google Scholar] [CrossRef] [PubMed] [Green Version]
- Heydt, C.; Becher, A.K.; Wagener-Ryczek, S.; Ball, M.; Schultheis, A.M.; Schallenberg, S.; Rüsseler, V.; Büttner, R.; Merkelbach-Bruse, S. Comparison of in situ and extraction-based methods for the detection of MET amplifications in solid tumors. Comput. Struct. Biotechnol. J. 2019, 17, 1339–1347. [Google Scholar] [CrossRef] [PubMed]
- Illumina. TruSight Tumor 170 v1.0 Local App User Guide. Available online: https://emea.support.illumina.com/content/dam/illumina-support/documents/documentation/software_documentation/trusight/trusight-tumor-170/trusight-tumor-170-v1-0-local-app-user-guide-1000000036413-01.pdf (accessed on 13 January 2022).
- Boyle, T.A.; Mondal, A.K.; Saeed-Vafa, D.; Ananth, S.; Ahluwalia, P.; Kothapalli, R.; Chaubey, A.; Roberts, E.; Qin, D.; Magliocco, A.M.; et al. Guideline-Adherent Clinical Validation of a Comprehensive 170-Gene DNA/RNA Panel for Determination of Small Variants, Copy Number Variations, Splice Variants, and Fusions on a Next-Generation Sequencing Platform in the CLIA Setting. Front. Genet. 2021, 12, 503830. [Google Scholar] [CrossRef] [PubMed]
- Karimnezhad, A.; Palidwor, G.A.; Thavorn, K.; Stewart, D.J.; Campbell, P.A.; Lo, B.; Perkins, T.J. Accuracy and reproducibility of somatic point mutation calling in clinical-type targeted sequencing data. BMC Med. Genomics 2020, 13, 156. [Google Scholar] [CrossRef] [PubMed]
- Pfarr, N.; Penzel, R.; Klauschen, F.; Heim, D.; Brandt, R.; Kazdal, D.; Jesinghaus, M.; Herpel, E.; Schirmacher, P.; Warth, A.; et al. Copy number changes of clinically actionable genes in melanoma, non-small cell lung cancer and colorectal cancer—A survey across 822 routine diagnostic cases. Genes Chromosomes Cancer 2016, 55, 821–833. [Google Scholar] [CrossRef] [PubMed]
- Schildhaus, H.-U.; Schultheis, A.M.; Rüschoff, J.; Binot, E.; Merkelbach-Bruse, S.; Fassunke, J.; Schulte, W.; Ko, Y.-D.; Schlesinger, A.; Bos, M.; et al. MET Amplification Status in Therapy-Naïve Adeno- and Squamous Cell Carcinomas of the Lung. Clin. Cancer Res. 2015, 21, 907–915. [Google Scholar] [CrossRef] [PubMed] [Green Version]
- Heydt, C.; Ruesseler, V.; Pappesch, R.; Wagener, S.; Haak, A.; Siebolts, U.; Riedel, R.; Michels, S.; Wolf, J.; Schultheis, A.M.; et al. Comparison of in Situ and Extraction-Based Methods for the Detection of ROS1 Rearrangements in Solid Tumors. J. Mol. Diagn. 2019, 21, 971–984. [Google Scholar] [CrossRef] [PubMed]
- Heydt, C.; Wölwer, C.B.; Velazquez Camacho, O.; Wagener-Ryczek, S.; Pappesch, R.; Siemanowski, J.; Rehker, J.; Haller, F.; Agaimy, A.; Worm, K.; et al. Detection of gene fusions using targeted next-generation sequencing: A comparative evaluation. BMC Med. Genomics 2021, 14, 62. [Google Scholar] [CrossRef] [PubMed]


| No. | Tumor Type | TCC (%) | DNA Input (ng) | Median Insert Size (≥79 bp) | PCT Exon Bases 100X (≥95) | Cov. MAD [(≤0.2)] | Bin Count CNV Targets (≥1) | Expected Somatic Gene Mutations | Expected CNVs | Results DNA Illumina |
|---|---|---|---|---|---|---|---|---|---|---|
| 1 | NSCLC, Squamous | 40 | 120 | 130 | 99.72 | 0.12 | 32.14 | KEAP1: c.743C>G p.A248G; PIK3CA: c.1633G>A p.E545K; TP53: c.892G>T p.E298* | √ (KEAP1 not in panel) | |
| 2 | NSCLC, Adeno | 50 | 120 | 125 | 99.73 | 0.09 | 23.6 | KEAP1: c.1576G>C p.D526H; KRAS: c.35G>T p.G12V; TP53: c.475G>C p.A159P | √ (KEAP1 not in panel) | |
| 3 | NSCLC, Adeno | 60 | 120 | 89 | 99.76 | 0.1 | 8.35 | TP53: c.848G>C p.R283P | MET amplification (4.87 Copies) | (√) (MET amplification not detected) |
| 4 | NSCLC, Adeno | 50 | 95.5 | 127 | 99.77 | 0.09 | 19.42 | TP53: c.713G>A p.C238Y | √ | |
| 5 | NSCLC, Adeno | 80 | 120 | 107 | 99.74 | 0.11 | 14.84 | n/a | n/a | |
| 6 | NSCLC, Adeno | 40 | 117 | 124 | 99.77 | 0.06 | 22.61 | n/a | n/a | |
| 7 | NSCLC, Adeno | 50 | 120 | 125 | 99.75 | 0.08 | 26.92 | n/a | n/a | |
| 8 | NSCLC, Adeno | 20 | 120 | 134 | 99.64 | 0.08 | 24.6 | TP53: c.614A>G p.Y205C; MET: c.[2942-20_2942-7del]; [2942-14_2942-4del] | MET amplification (6.87 Copies) | (√) (MET amplification not detected, MET deletion not detected on DNA-level) |
| 9 | NSCLC, Adeno | 60 | 120 | 125 | 0 | 0 | 0 | MET: c.3082_3082+23del | MET amplification (4.77 Copies) | n.n. |
| 10 | NSCLC, Adeno | 80 | 120 | 119 | 99.66 | 0.16 | 19.39 | EGFR: c.2309_2310ins23 p.D770Efs*4; KEAP1: c.340G>T p.G114W; PTEN: c.640C>T p.Q214*; TP53: c.746G>T p.R249M | MET amplification (Copies 3.20) | (√) (KEAP1 not in panel, MET amplification not detected) |
| 11 | NSCLC, Adeno | 50 | 120 | 138 | 99.61 | 0.08 | 25.37 | EGFR: c.2235_2249del p.K746_A750del; EGFR: c.2369C>T p.T790M; TP53: c.661G>T p.E221* | MET amplification (Copies 4.47) | (√) (MET amplification not detected) |
| 12 | NSCLC, Adeno | 50 | 55.9 | 126 | 99.32 | 0.19 | 9.1 | BRAF: c.1780G>A p.D594N; EGFR: c.2300_2308dup p.A767_V769dup | MET amplification (Copies 3.85) | (√) (MET amplification not detected) |
| 13 | Chordoma | 80 | 120 | 125 | 99.73 | 0.08 | 22.03 | n/a | n/a | |
| 14 | NSCLC, Adeno | 70 | 90.2 | 131 | 99.69 | 0.13 | 17.84 | n/a | n/a | |
| 15 | NSCLC, Adeno | 40 | 52.8 | 101 | 99.25 | 0.19 | 3.91 | n/a | n/a | |
| 16 | Pancreas | 70 | 120 | 132 | 99.78 | 0.16 | 19.29 | ATM: c.2494C>T p.R832C | √ | |
| 17 | NSCLC, Adeno | 15 | 8.6 | 115 | 95.55 | 0.13 | 1.47 | n/a | MET amplification (3.85 Copies) | X MET amplification not detected on DNA-level |
| 18 | NSCLC, Adeno | 40 | 43.4 | 116 | 99.22 | 0.07 | 6.45 | TP53: c.473G>T p.R158L | MET amplification (9.23 Copies) | (√) (MET amplification not detected) |
| 19 | NSCLC, Adeno | 70 | 120 | 127 | 99.77 | 0.11 | 29.91 | DDR2: c.1189A>G p.N397D; KRAS: c.35G>T p.G12V; TP53: c.722C>A p.S241Y | MET amplification (7.50 Copies) | √ |
| 20 | Pancreas | 50 | 120 | 121 | 99.78 | 0.09 | 20.04 | BRCA2: c.10095delCinsGAATTATAT p.S3366Nfs*4 | √ | |
| 21 | Ovary | 70 | 90 | 115 | 99.75 | 0.1 | 19.37 | BRCA2: c.3975_3978dup p.A1327Cfs*4, BRCA2: c.682-9_682-3delinsTTTTGG | X BRCA2 deletion not detected on DNA-level | |
| 22 | NSCLC, Adeno | 90 | 120 | 101 | 76.85 | 0.14 | 1.14 | MET: c.2942-19_2942-9del | X MET deletion not detected on DNA-level | |
| 23 | NSCLC, Adeno | 50 | 120 | 129 | 98.74 | 0.08 | 5.15 | TP53: c.637C>T p.R213*; MET: c.2942-27_2942-5del | (√) (MET deletion not detected on DNA-level) | |
| 24 | NSCLC, Adeno | 50 | 120 | 137 | 99.25 | 0.1 | 6.98 | MET: c.2942-28_2942-2del | X MET deletion not detected on DNA-level | |
| 25 | NSCLC, Adeno | 70 | 120 | 131 | 99.32 | 0.1 | 6.37 | MET: c.3070_3082+22del | √ | |
| 26 | NSCLC, Adeno | 20 | 120 | 123 | 97.6 | 0.07 | 3.25 | MET: c.3073_3082+21del | √ | |
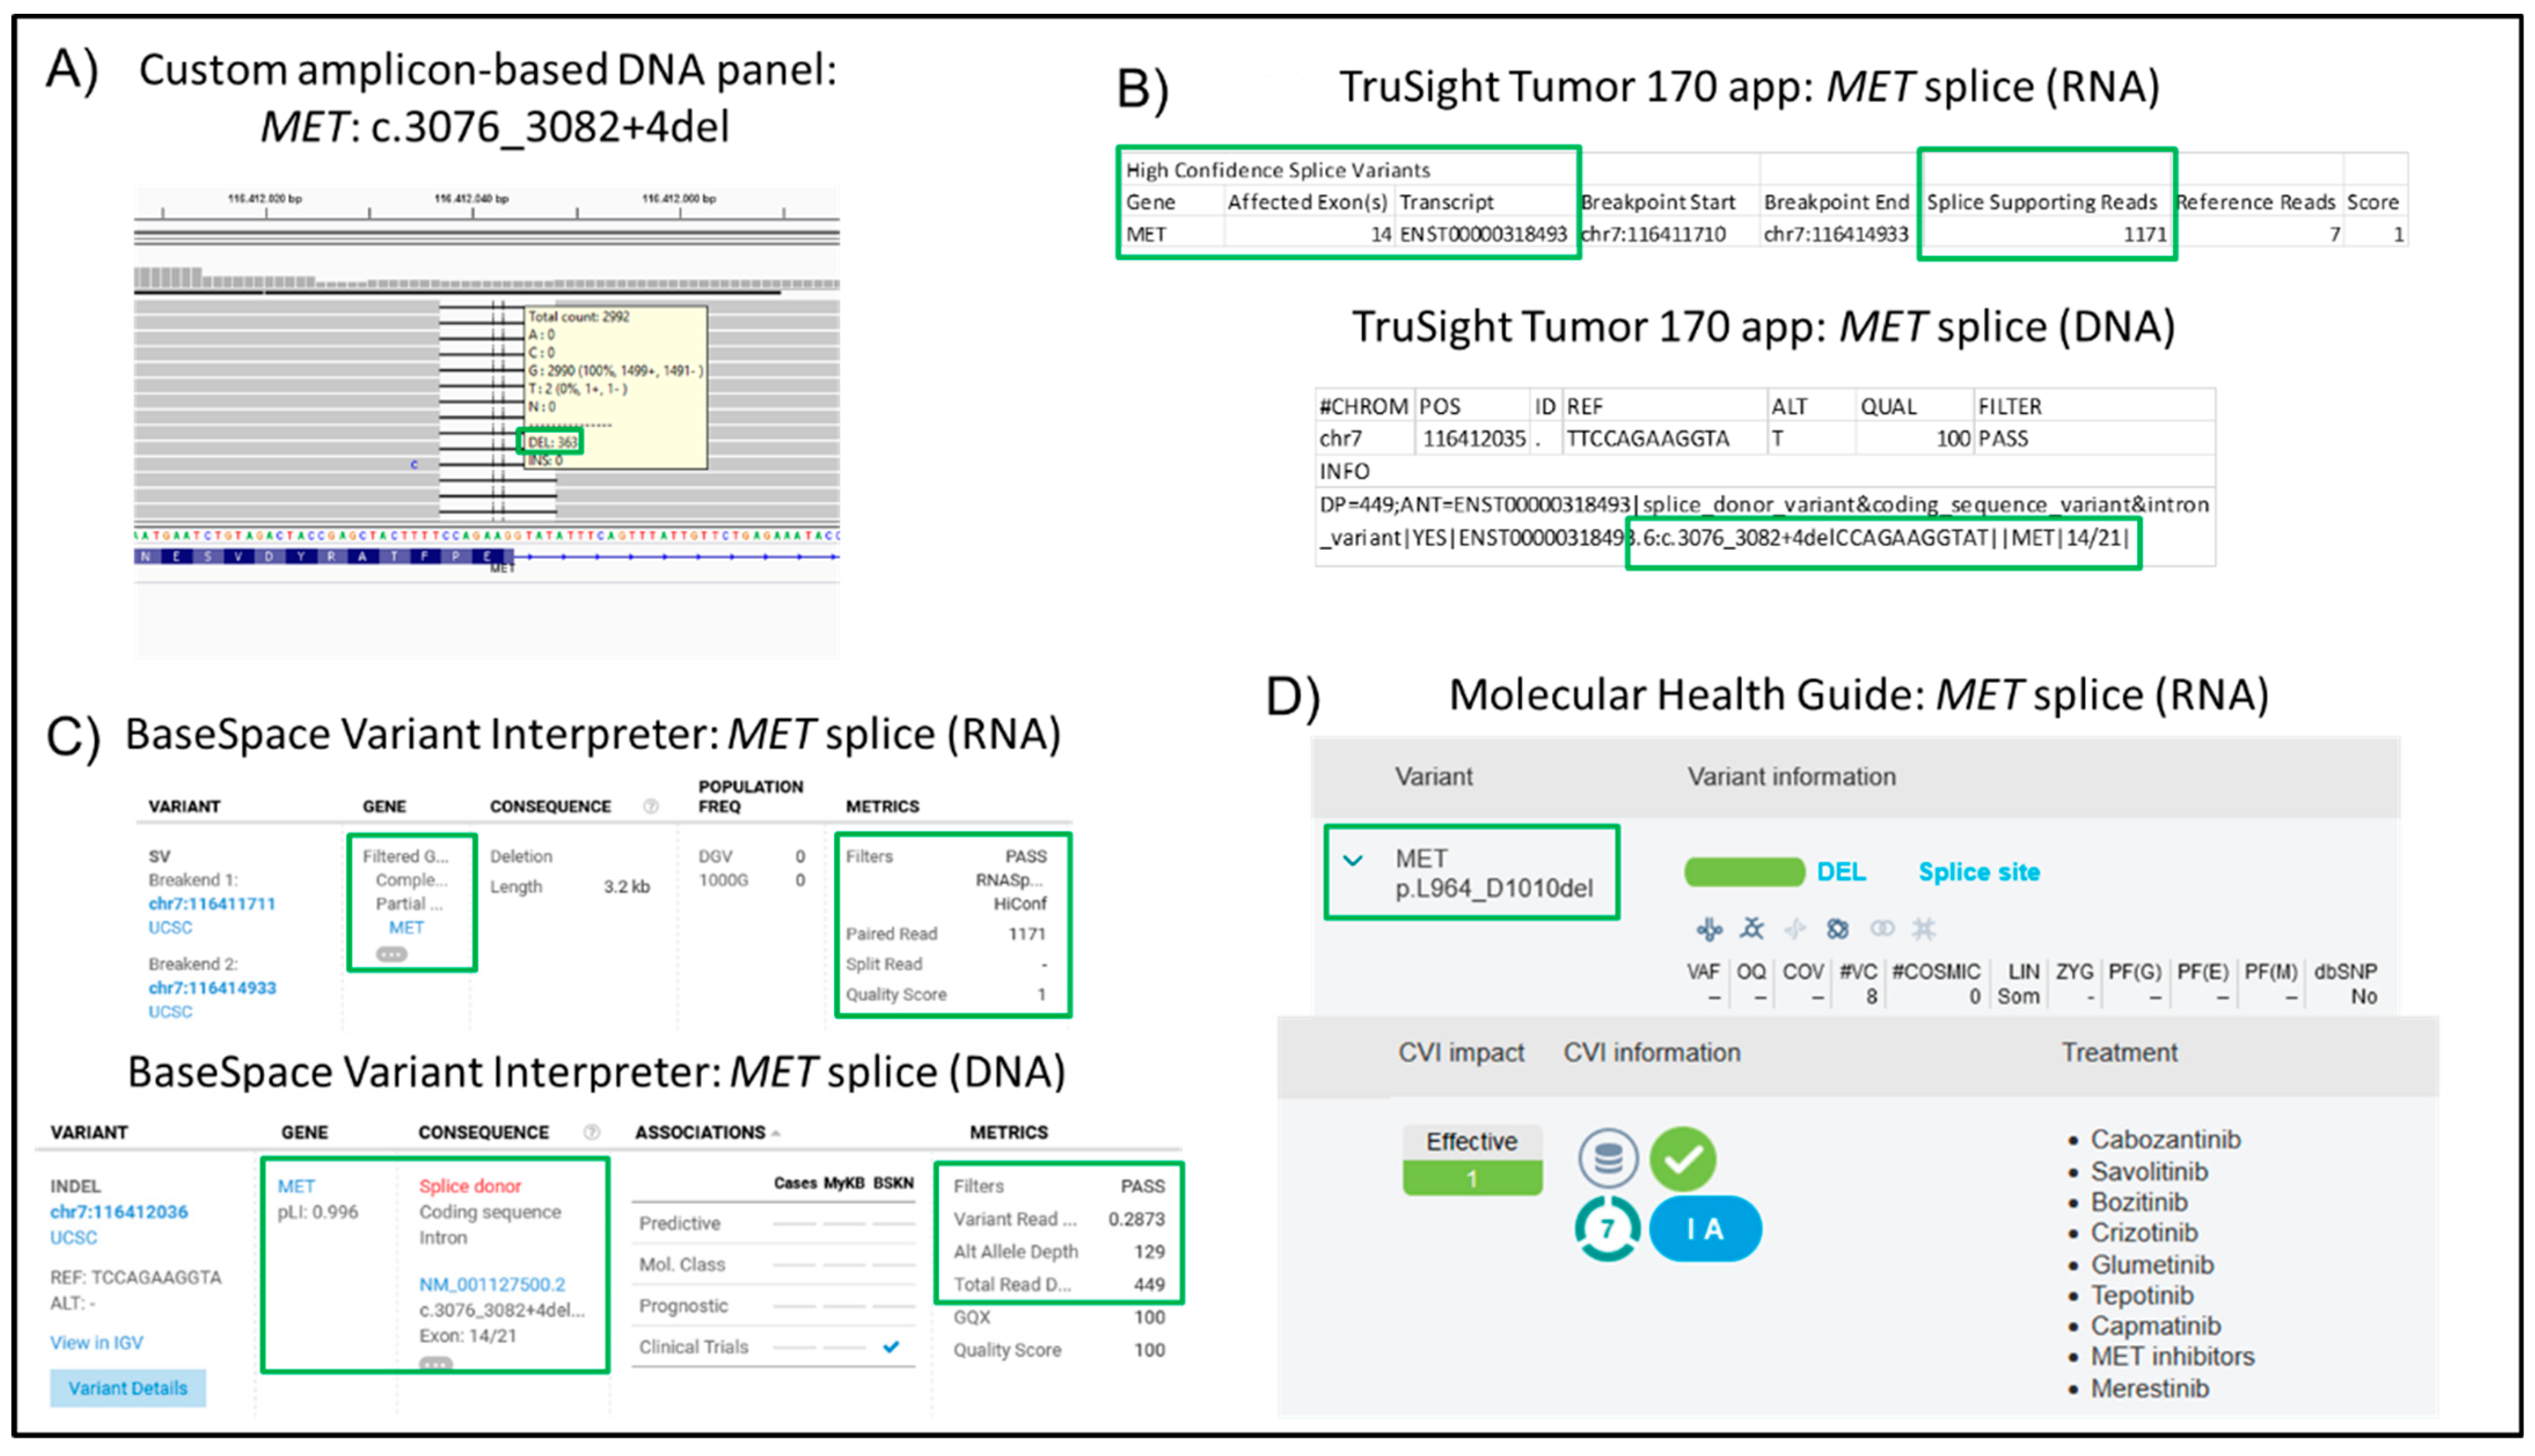
| 27 | NSCLC, Adeno | 25 | 120 | 96 | 99.43 | 0.11 | 4.58 | PIK3CA: c.3145G>C p.G1049R; MET c.3076_3082+4del | √ | |
| 28 | Rhabdomyosarcoma | 25 | 120 | 110 | 70.7 | 0.16 | 1.08 | n/a | n/a | |
| 29 | Cholangio cellular Carcinoma | 50 | 120 | 113 | 99.32 | 0.14 | 6.78 | n/a | n/a | |
| 30 | NSCLC, Adeno | 15 | 120 | 150 | 99.57 | 0.1 | 12.3 | MET: c.3334C>T p.H1112Y | √ | |
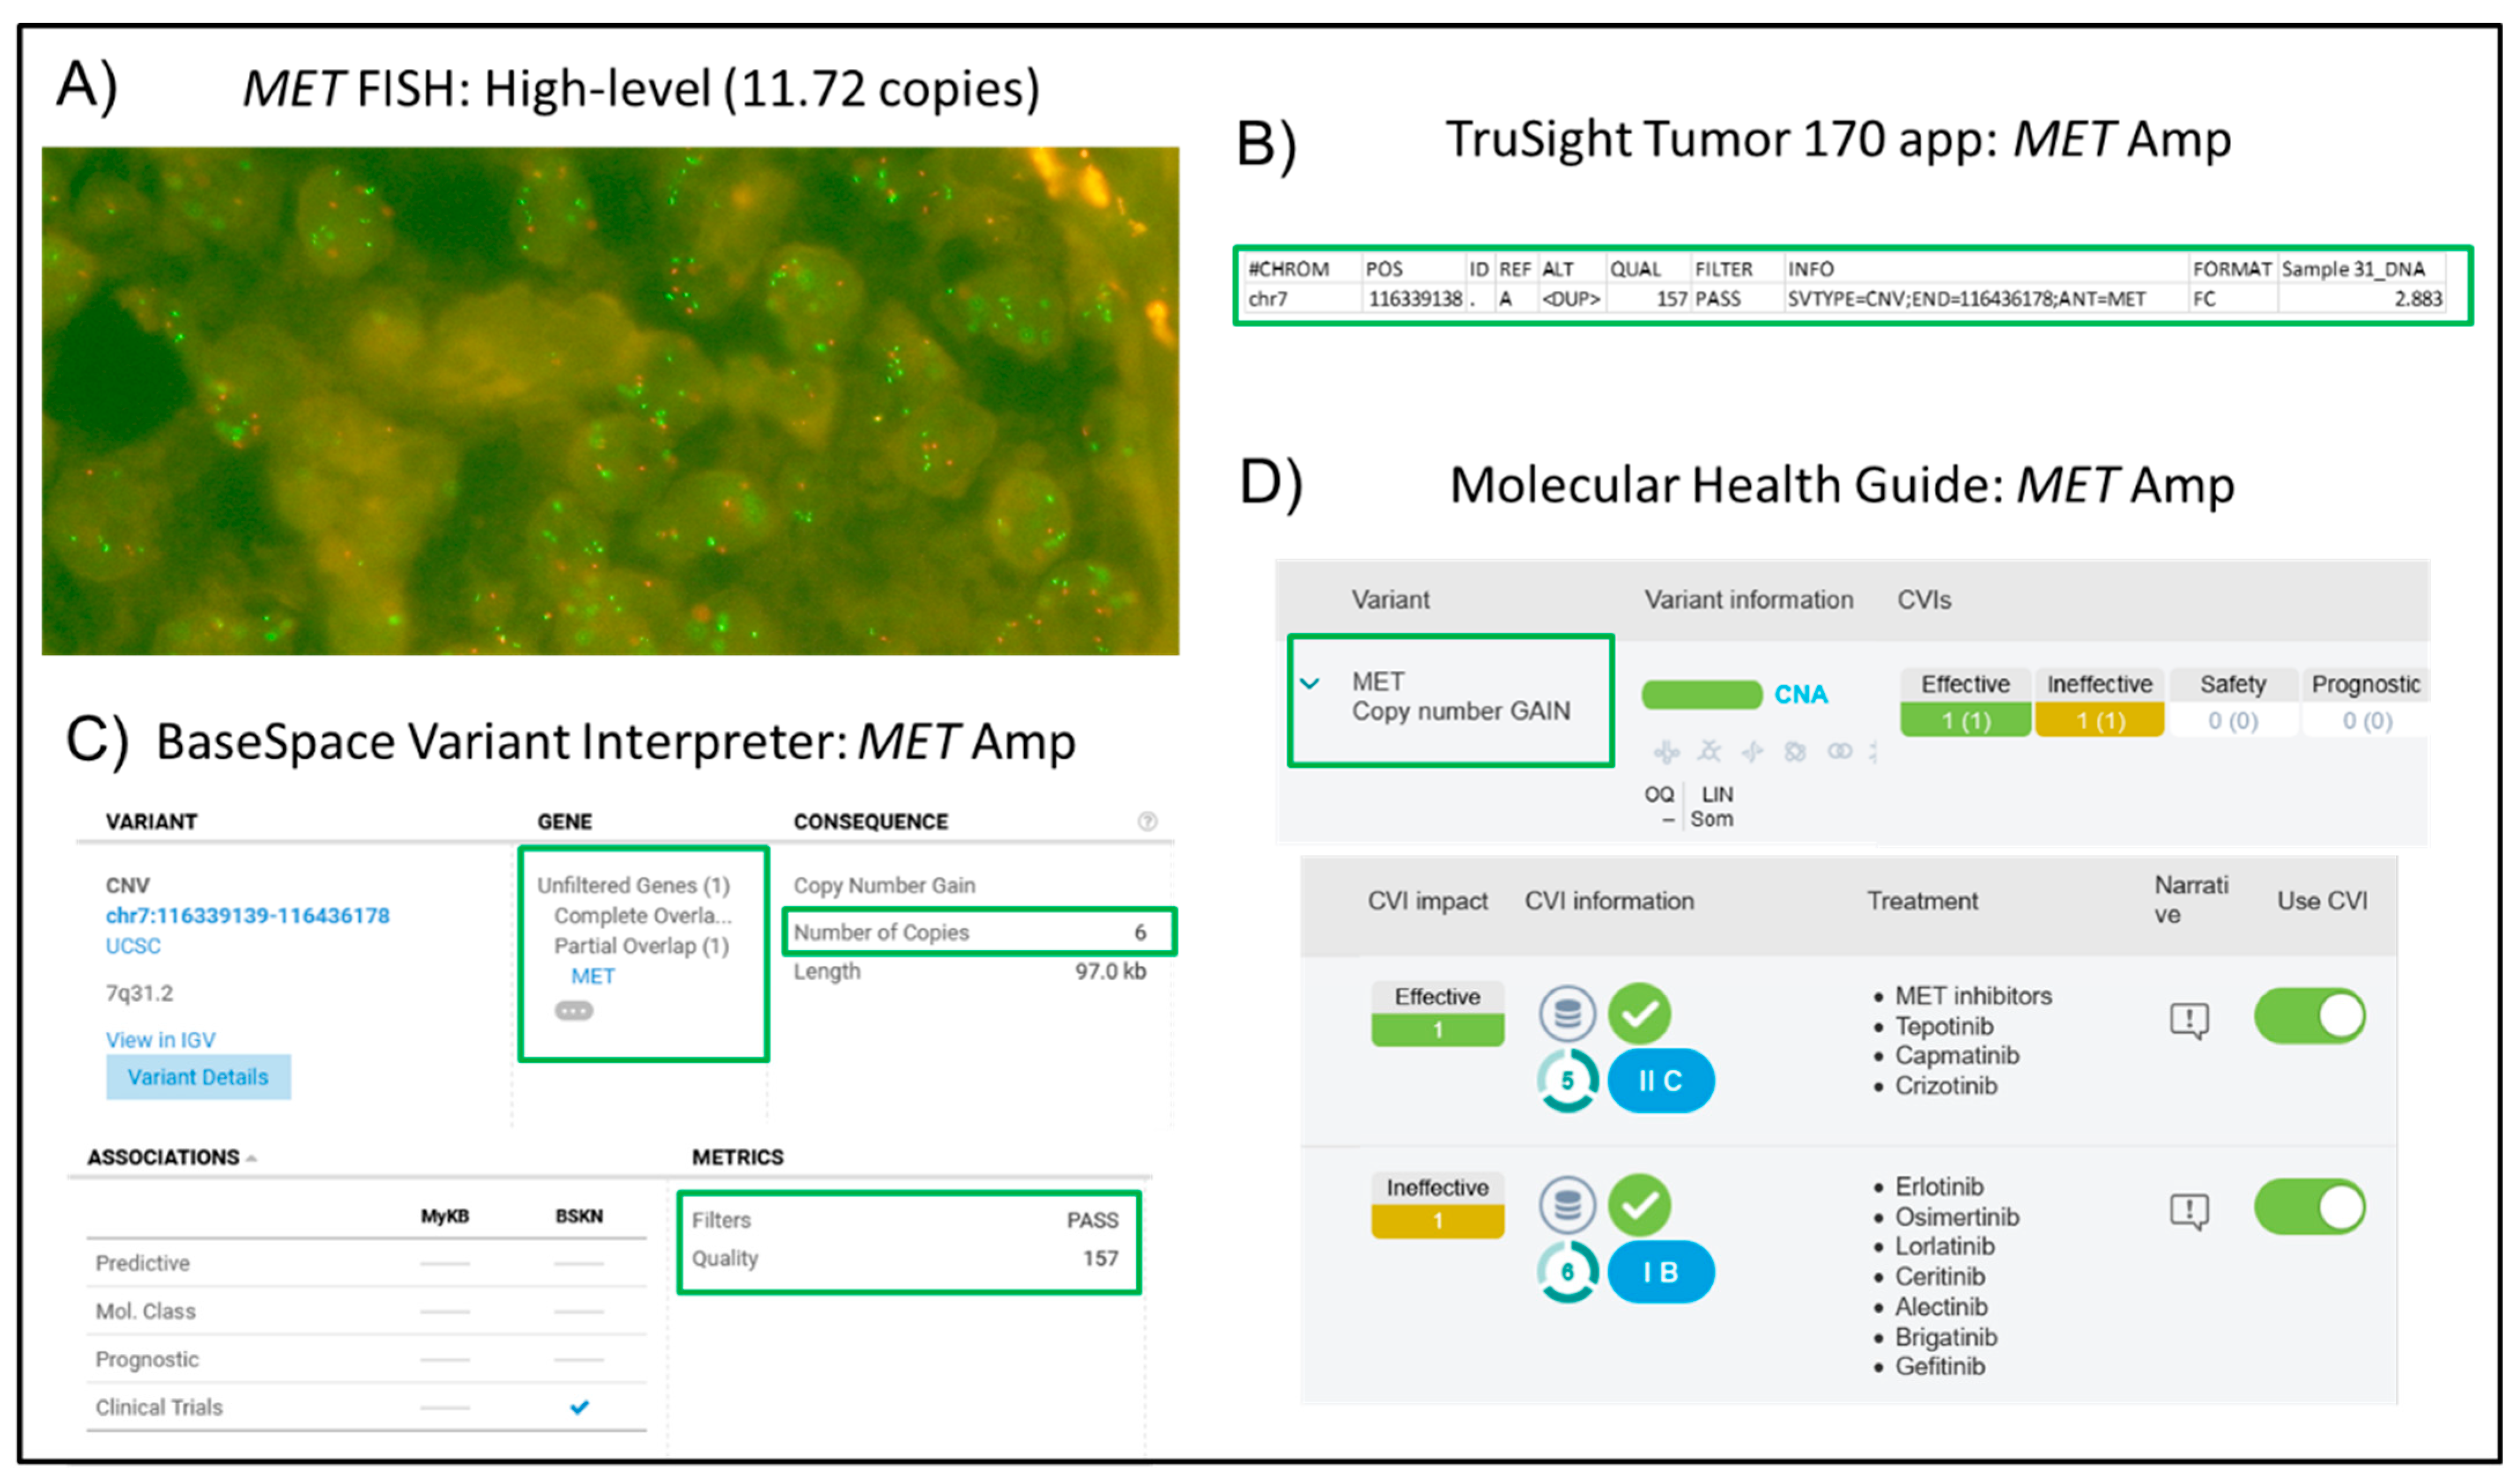
| 31 | NSCLC, Adeno | 30 | 120 | 148 | 99.58 | 0.12 | 13.48 | DDR2: c.2321G>T p.G774V; TP53: c.818G>A p.R273H | MET amplification (11.72 copies) | √ |
| 32 | NSCLC, Adeno | 70 | 120 | 123 | 99.67 | 0.1 | 11.74 | KRAS: c.182A>T p.Q61L | √ | |
| 33 | Glioblastoma | 70 | 120 | 136 | 99.61 | 0.13 | 14.04 | n/a | n/a | |
| 34 | Thyroid | 50 | 120 | 139 | 99.62 | 0.09 | 12.35 | n/a | n/a | |
| 35 | Melanoma | 80 | 120 | 144 | 99.6 | 0.14 | 11.83 | PTEN: c.112C>T p.P38S | √ | |
| 36 | Melanoma | 50 | 52.8 | 121 | 96.99 | 0.09 | 3.43 | n/a | n/a | |
| 37 | Melanoma | 60 | 120 | 114 | 98.83 | 0.11 | 4.95 | n/a | n/a | |
| 38 | Melanoma | 40 | 44 | 123 | 99.09 | 0.1 | 6.21 | n/a | n/a | |
| 39 | Breast | 90 | 120 | 115 | 99.52 | 0.12 | 8.91 | n/a | n/a | |
| 40 | Ovary | 50 | 120 | 120 | 99.39 | 0.2 | 8.11 | n/a | n/a | |
| 41 | NSCLC, Adeno | 60 | 120 | 121 | 99.48 | 0.2 | 9.11 | ROS1: c.5858G>T p.S1953I; TP53: c.463_ 468delACCCGC p.T155_R156del | MET amplification (3.25 Copies) | (√) (MET amplification not detected on DNA-level) |
| 42 | NSCLC, Adeno | 70 | 120 | 130 | 98.79 | 0.19 | 7.35 | n/a | n/a | |
| 43 | Control sample 1 | - | 120 | 138 | 99.74 | 0.13 | 25.49 | See Table 2 | √ | |
| 44 | Control sample 2 | - | 120 | 133 | 99.72 | 0.13 | 25.97 | See Table 2 | √ |
| Gene | Variant | Expected Allelic Frequency (%) | Control Sample 1 | Control Sample 2 | ||
|---|---|---|---|---|---|---|
| Allelic Frequency (%) | Coverage | Allelic Frequency (%) | Coverage | |||
| BRAF | p.V600E | 10.7 | 9.84 | 2013 | 10.88 | 2113 |
| cKIT | p.D816V | 10.0 | 18.50 | 1135 | 23.19 | 1186 |
| EGFR | p.E746-A750del | 1.9 | 1.88 | 5783 | 1.43 | 5678 |
| EGFR | p.L858R | 2.8 | 3.17 | 6243 | 3.48 | 6476 |
| EGFR | p.T790M | 0.9 | 1.04 (IGV) | 6699 (IGV) | 1.46 | 6316 |
| EGFR | p.G719S | 24.5 | 24.08 | 5354 | 22.67 | 5523 |
| KRAS | p.G13D | 15.0 | 14.88 | 1526 | 16.16 | 1547 |
| KRAS | p.G12D | 6.3 | 6.52 | 1502 | 7.41 | 1555 |
| NRAS | p.Q61K | 12.5 | 15.53 | 1951 | 13.98 | 1940 |
| PIK3CA | p.H1047R | 17.5 | 19.05 | 1454 | 16.27 | 1352 |
| PIK3CA | p.E545K | 8.8 | 24.65 | 706 | 22.00 | 710 |
| No. | MET Amplification Status | MET Amplification Detected by TruSight Tumor 170 Assay | Total Mean Coverage | Mean Coverage of MET |
|---|---|---|---|---|
| 3 | MET amplification (4.87 Copies; Ratio 1.87; low-level) | no | 1048.70 | 1615.26 |
| 4 | no MET amplification | no | 2297.26 | 2637.08 |
| 5 | no MET amplification | no | 1767.57 | 2006.12 |
| 8 | MET amplification (6.87 Copies; Ratio 3.30; high-level) | no | 2877.43 | 3911.24 |
| 9 | MET amplification (4.77 Copies; Ratio 1.4; low-level) | no | 0 | 0 |
| 10 | MET amplification (Copies 3.20; Ratio 1.28; low-level) | no | 2340.00 | 3558.57 |
| 11 | MET amplification (Copies 4.47; Ratio 1.35; low-level) | no | 2935.49 | 3621.15 |
| 12 | MET amplification (Copies 3.85; Ratio 1.17; low-level) | no | 1186.01 | 1932.84 |
| 17 | MET amplification (3.85 Copies; Ratio 1.04; low-level) | no | 418.03 | 436.77 |
| 18 | MET amplification (9.23 Copies; Ratio 3.28; high-level) | no | 846.52 | 1281.82 |
| 19 | MET amplification (7.50 Copies; Ratio 1.55; high-level) | yes | 3639.3 | 7673.86 |
| 31 | MET amplification (11.72 copies; Ratio 3.46; high-level) | yes | 1815.54 | 5022.72 |
| 41 | MET amplification (3.25 Copies; Ratio 1.12; low-level) | no | 1357.40 | 1716.84 |
| No. | Tumor Type | TCC (%) | RNA Input (ng) | Median Insert Size (≥63 bp) | Median CV Coverage 1000X (≤0.88) | PCR On Target Reads | Expected Variants RNA | Results RNA Illumina |
|---|---|---|---|---|---|---|---|---|
| 1 | NSCLC, Squamous | 40 | 85 | 127 | 0.53 | 81.89 | n/a | n/a |
| 2 | NSCLC, Adeno | 30 | 85 | 113 | 0.55 | 82.62 | n/a | n/a |
| 3 | NSCLC, Adeno | 50 | 85 | 78 | 0.74 | 91.25 | n/a | n/a |
| 4 | NSCLC, Adeno | 50 | 25.5 | 96 | 0.71 | 83.31 | ROS1 translocation | √ |
| 5 | NSCLC, Adeno | 80 | 85 | 81 | 0.63 | 83.79 | ROS1 translocation | √ (ROS1 FISH false positive) |
| 6 | NSCLC, Adeno | 10 | 27.2 | 98 | 0.58 | 80.05 | ROS1 translocation | √ |
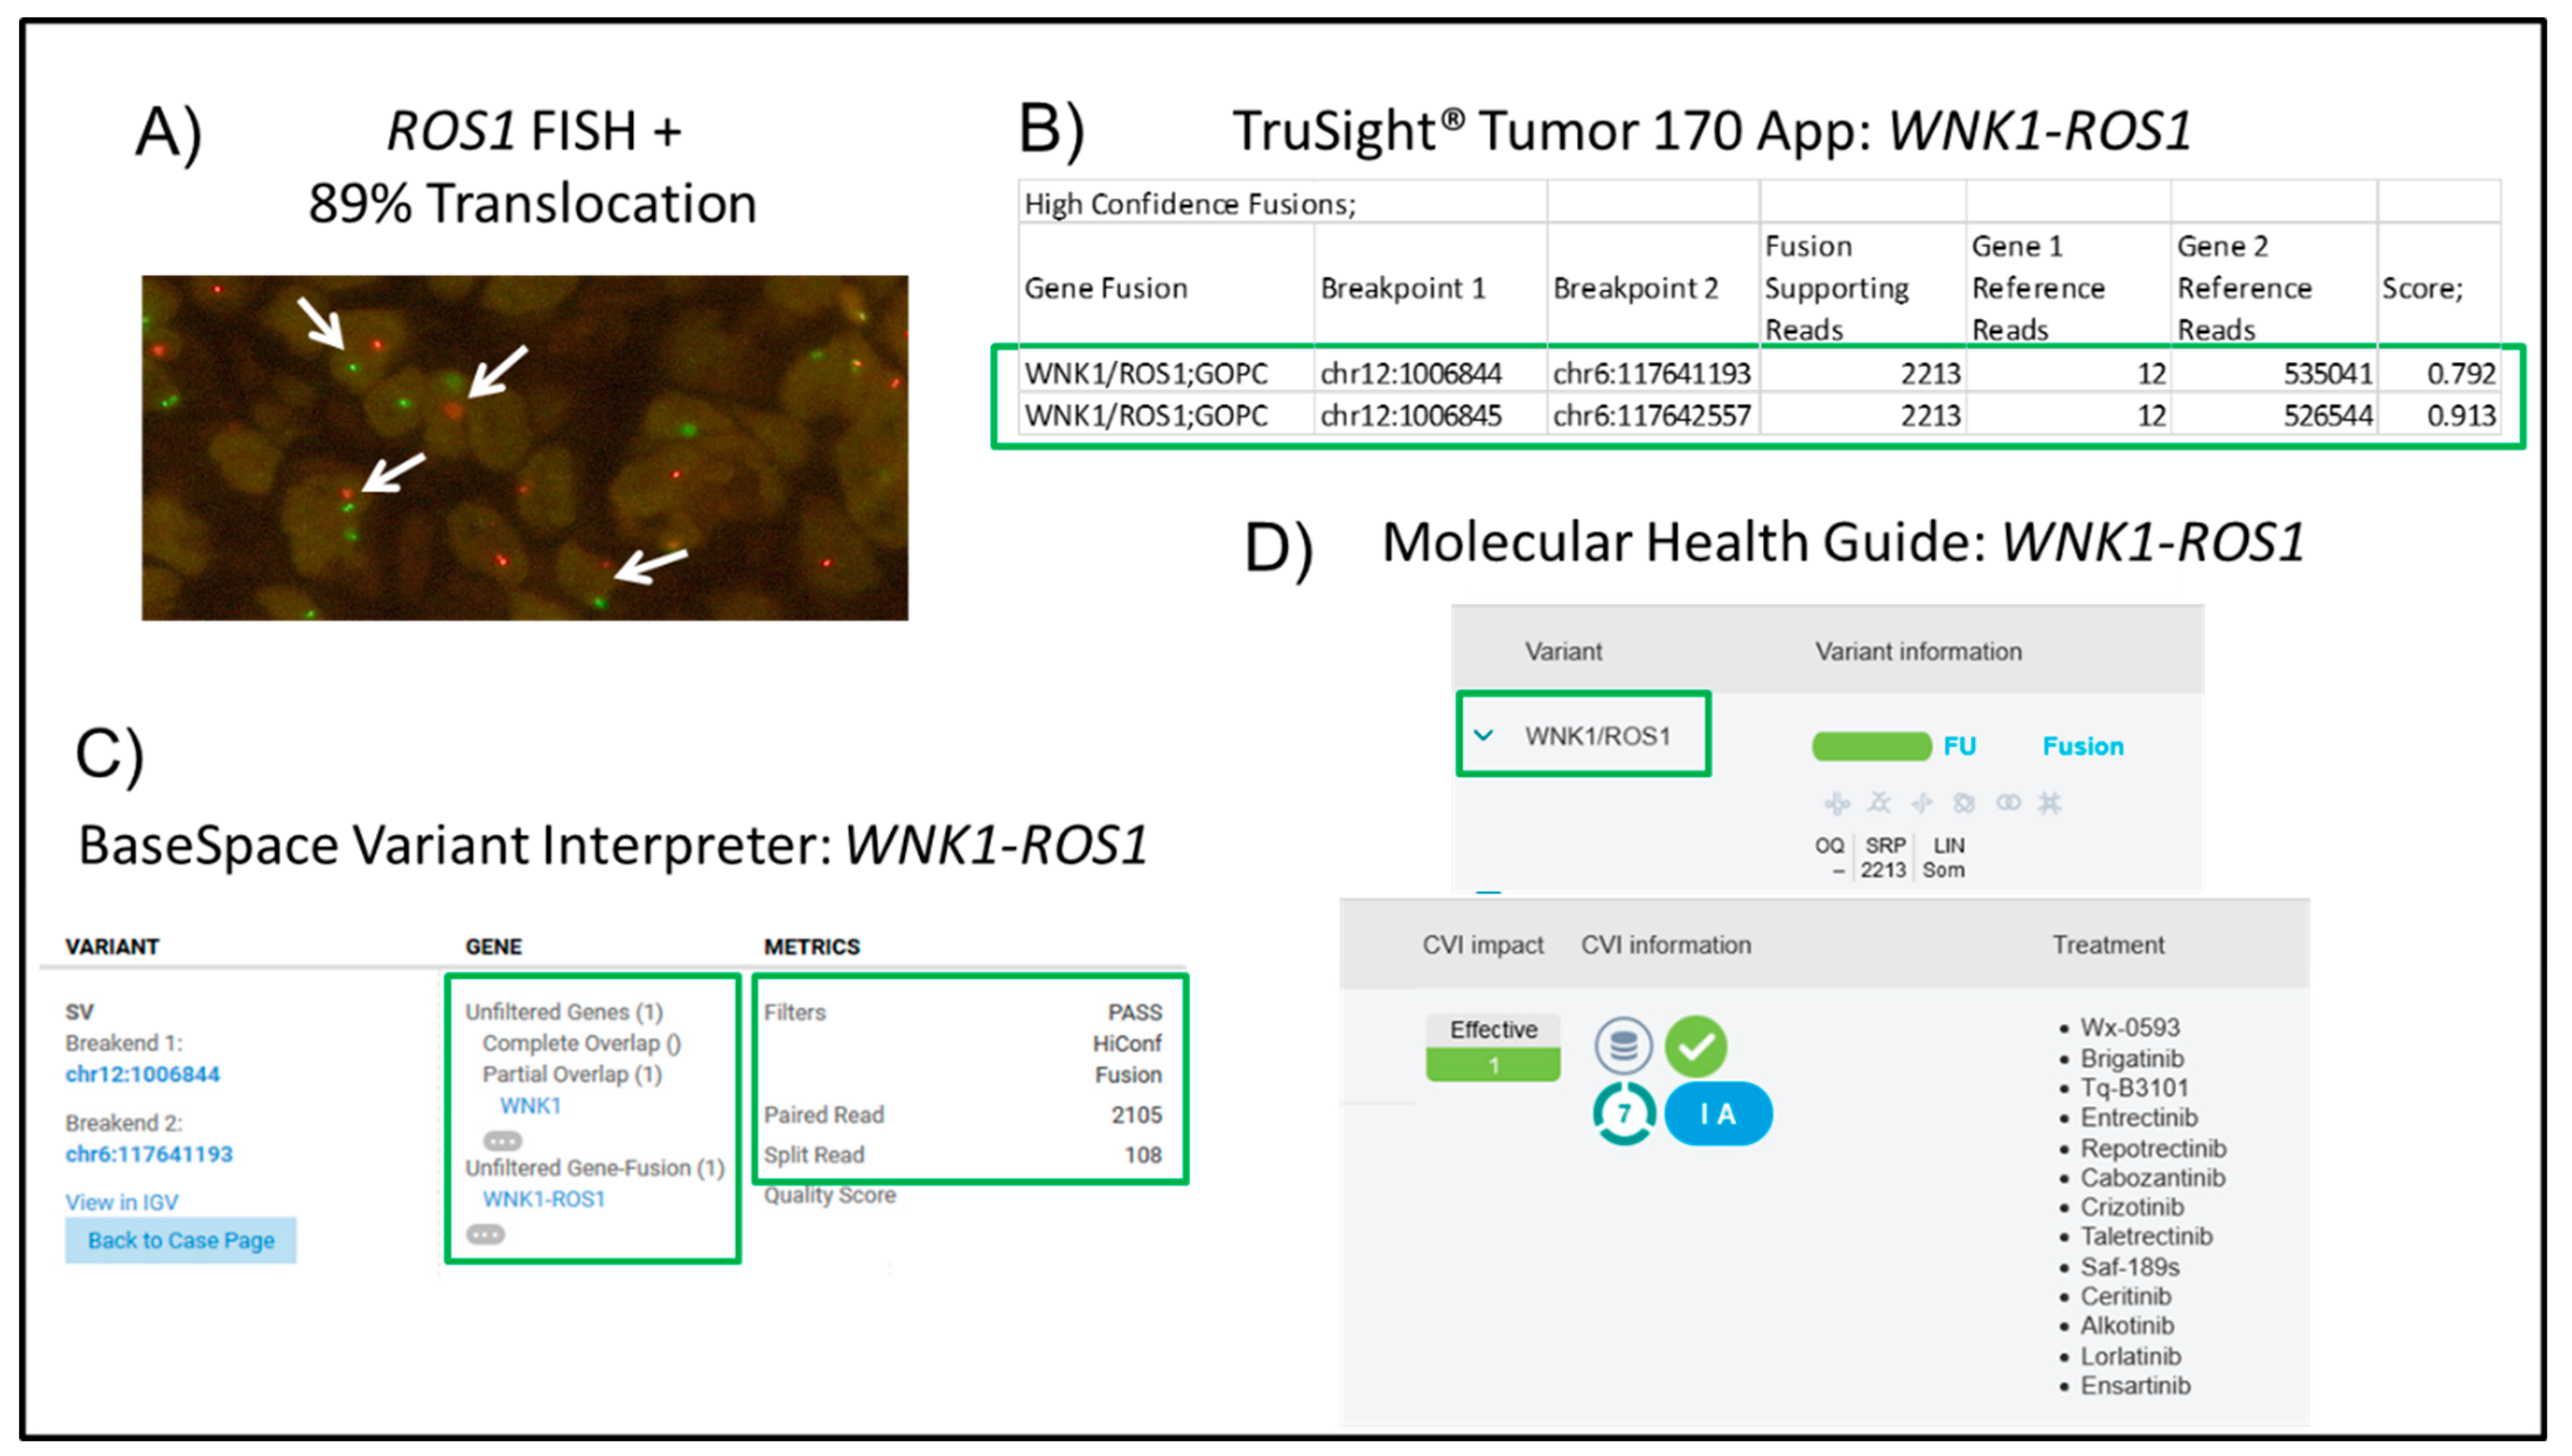
| 7 | NSCLC, Adeno | 50 | 85 | 125 | 0.49 | 87.98 | ROS1 translocation (WNK1-ROS1) | √ |
| 8 | NSCLC, Adeno | 20 | 7.1 | 113 | 0.5 | 81.91 | MET: c.[2942-20_2942-7del];[2942-14_2942-4del] | √ |
| 9 | NSCLC, Adeno | 60 | 85 | 103 | 0.6 | 80.17 | MET: c.3082_3082+23del | √ |
| 10 | NSCLC, Adeno | 80 | 85 | 111 | 0.56 | 88.61 | n/a | n/a |
| 11 | NSCLC, Adeno | 15 | 12.8 | 114 | 0.61 | 81.44 | n/a | n/a |
| 12 | NSCLC, Adeno | 30 | 29.8 | 117 | 0.57 | 83.23 | ROS1 translocation | √ (ROS1 FISH false positive) |
| 13 | Chordoma | 80 | 85 | 116 | 0.54 | 83.66 | BRAF translocation (KIAA1549-BRAF) | √ |
| 14 | NSCLC, Adeno | 30 | 5.8 | 113 | 0.53 | 82.19 | NTRK1 translocation (EPS15L1-NTRK1) | √ |
| 15 | NSCLC, Adeno | 40 | 5 | 89 | 0.53 | 78.81 | ALK translocation (EML4-ALK) | √ |
| 16 | Pancreas | 70 | 85 | 132 | 0.5 | 89.05 | FGFR2 translocation (FGFR2-KIAA1598) | √ |
| 17 | NSCLC, Adeno | 15 | 1.3 | 112 | 0.5 | 80.8 | ROS1 translocation (SLC34A2-ROS1) | √ (RNAseq false positive for ROS1) |
| 18 | NSCLC, Adeno | 10 | 0.8 | 97 | 0.64 | 76.71 | n/a | n/a |
| 19 | NSCLC, Adeno | 70 | 85 | 121 | 0.5 | 84.4 | n/a | n/a |
| 20 | Pancreas | 30 | 85 | 96 | 0.61 | 80.51 | n/a | n/a |
| 21 | Ovary | 60 | 85 | 116 | 0.54 | 85.33 | BRCA2: c.682-9_682-3delinsTTTTGG | X No splicing effect detected |
| 22 | NSCLC, Adeno | 90 | 85 | 97 | 0.68 | 82.55 | MET: c.2942-19_2942-9del | √ |
| 23 | NSCLC, Adeno | 40 | 85 | 109 | 0.66 | 83.22 | MET: c.2942-27_2942-5del | √ |
| 24 | NSCLC, Adeno | 50 | 85 | 107 | 0.64 | 88.87 | MET: c.2942-28_2942-2del | √ |
| 25 | NSCLC, Adeno | 70 | 85 | 100 | 0.66 | 87.07 | MET: c.3070_3082+22del | √ |
| 26 | NSCLC, Adeno | 20 | 85 | 98 | 0.67 | 88.17 | MET: c.3073_3082+21del | √ |
| 27 | NSCLC, Adeno | 25 | 85 | 96 | 0.69 | 84.72 | MET c.3076_3082+4del | √ |
| 28 | Rhabdomyosarcoma | 25 | 85 | 107 | 0.68 | 89.44 | PAK3 translocation (PAK3-FOXO1) | √ |
| 29 | Cholangiocellular Carcinoma | 40 | 85 | 150 | 0.58 | 86.69 | FGFR2 translocation | √ |
| 30 | NSCLC, Adeno | 15 | 37.4 | 111 | 0.78 | 89.81 | n/a | n/a |
| 31 | NSCLC, Adeno | 30 | 85 | 142 | 0.59 | 93.5 | n/a | n/a |
| 32 | NSCLC, Adeno | 70 | 85 | 113 | 0.62 | 84.39 | n/a | n/a |
| 33 | Glioblastoma | 70 | 85 | 135 | 0.55 | 90.73 | EGFR (Exon 1)–EGFR (Exon 8) deletion | √ |
| 34 | Thyroid | 50 | 85 | 146 | 0.53 | 91.06 | RET translocation (NCOA4-RET) | √ |
| 35 | Melanoma | 70 | 85 | 150 | 0.58 | 86.69 | BRAF translocation (NRF1-BRAF) | √ |
| 36 | Melanoma | 50 | 85 | 141 | 0.64 | 87.23 | BRAF translocation | √ (RNAseq false positive for BRAF) |
| 37 | Melanoma | 70 | 76.5 | 131 | 0.55 | 82.26 | BRAF translocation | √ (RNAseq false positive for BRAF) |
| 38 | Melanoma | 10 | 8.5 | 116 | 0.68 | 76.48 | BRAF translocation | √ (RNAseq false positive for BRAF) |
| 39 | Breast | 90 | 67.7 | 104 | 0.62 | 73.52 | BRCA1 (Exon 17) deletion | X Deletion not detected |
| 40 | Ovary | 50 | 85 | 135 | 0.55 | 82.91 | ALK immuno+, ALK-FISH negative | √ (ALK IHC false positive) |
| 41 | NSCLC, Adeno | 60 | 85 | 123 | 0.51 | 80.1 | ROS1 translocation | √ (ROS1 FISH false positive) |
| 42 | NSCLC, Adeno | 70 | 85 | 134 | 0.6 | 82.54 | ROS1 translocation | √ |
| 43 | Control sample 1 | - | 85 | 153 | 0.43 | 89.09 | n/a | n/a |
| 44 | Control sample 2 | - | 85 | 136 | 0.49 | 87.93 | n/a | n/a |
Publisher’s Note: MDPI stays neutral with regard to jurisdictional claims in published maps and institutional affiliations. |
© 2022 by the authors. Licensee MDPI, Basel, Switzerland. This article is an open access article distributed under the terms and conditions of the Creative Commons Attribution (CC BY) license (https://creativecommons.org/licenses/by/4.0/).
Share and Cite
Heydt, C.; Pappesch, R.; Stecker, K.; März, M.; Merkelbach-Bruse, S. Evaluation of the TruSight Tumor 170 Assay and Its Value in Clinical Diagnostics. J. Mol. Pathol. 2022, 3, 53-67. https://doi.org/10.3390/jmp3010006
Heydt C, Pappesch R, Stecker K, März M, Merkelbach-Bruse S. Evaluation of the TruSight Tumor 170 Assay and Its Value in Clinical Diagnostics. Journal of Molecular Pathology. 2022; 3(1):53-67. https://doi.org/10.3390/jmp3010006
Chicago/Turabian StyleHeydt, Carina, Roberto Pappesch, Katrin Stecker, Martin März, and Sabine Merkelbach-Bruse. 2022. "Evaluation of the TruSight Tumor 170 Assay and Its Value in Clinical Diagnostics" Journal of Molecular Pathology 3, no. 1: 53-67. https://doi.org/10.3390/jmp3010006
APA StyleHeydt, C., Pappesch, R., Stecker, K., März, M., & Merkelbach-Bruse, S. (2022). Evaluation of the TruSight Tumor 170 Assay and Its Value in Clinical Diagnostics. Journal of Molecular Pathology, 3(1), 53-67. https://doi.org/10.3390/jmp3010006