Article

An Online Scientific Twitter World: Social Network Analysis of #ScienceTwitter, #SciComm, and #AcademicTwitter

1
Department of Instructional Technology and Learning Sciences, Utah State University, Logan, UT 84322, USA
2
School of Education, University of North Carolina at Chapel Hill, Chapel Hill, NC 27599, USA
*
Author to whom correspondence should be addressed.
Journal. Media 2025, 6(4), 159; https://doi.org/10.3390/journalmedia6040159
Submission received: 28 May 2025 / Revised: 5 August 2025 / Accepted: 17 September 2025 / Published: 23 September 2025

Abstract

Understanding who makes up online affinity spaces as well as how information flows within those spaces is important as more people access news, research topics, collaborate with others, and entertain themselves. During a month-long period in summer 2021, we collected 100,000 tweets from 53,311 Twitter users who used the hashtags #ScienceTwitter, #SciComm, and #AcademicTwitter. We then classified users and determined the type of social network they formed. Scientists, the public, and educators formed this affinity space. They built connections by initiating activities and interacting with others, which created a Community Clusters social network structure, characterized by several medium-sized groups of closely connected users and a fair number of isolates. All three categories of people were in positions of influence in this network leading and controlling the conversations. The results show that scientists, the public, and educators share the space and contribute to communication in this online world. This research is important as it illustrates that online affinity spaces about scientific topics are not solely spaces for scientists to communicate but rather act as spaces where people with varied expertise can exchange ideas and learn from one another.

1. Introduction

Understanding who makes up online social worlds in microblogging spaces such as Twitter (now known as X), as well as how information flows within those communities is important as more people use these platforms to access news, research topics, collaborate with others, and entertain themselves. In recent years, scholars and scientists have used the microblogging service Twitter as a communication platform to share their work and opinions. However, with Twitter’s sale to Elon Musk in 2022, many people, including scientists, journalists, and educators, moved to other platforms in rebuttal of Twitter’s increasing spread of misinformation and limited ability to rectify (or interest in rectifying) such misinformation (Stokel-Walker, 2023; Hickey et al., 2025). Prior to this scientific diaspora, Twitter was a rich vein of research on science communication and education. Since these changes at Twitter, scientists, journalists, and educators have turned to other microblogging platforms, such as Bluesky and Mastodon (Biever, 2025; Mallapaty, 2024). In many ways, these platforms replicate the social, scientific communities that flourished on Twitter, providing people interested in science with the ability to communicate with one another (reply), indicate their support of or interest in content (like or repost), and create their own content (post). Thus, while the platforms themselves change, the affordances of the platforms and reasons people use such platforms remains the same: to quickly acquire, react to, and learn from others, and share knowledge and information (Carpenter et al., 2024; Ebersole et al., 2024). Because of similar usage patterns, reasons for use, and platform affordances, we argue that data sets from Twitter can act as proxies for other social microblogging spaces.
Much of the previous research on Twitter focused on specific user groups and their communication practices. For example, N. M. Lee et al. (2020) analyzed the science communication practices of a for-profit company. Bex and colleagues (2019) attempted to define the members of a paleontological community on Twitter. Researchers have also studied how teachers use Twitter: to teach and share knowledge (Richter et al., 2024; Manca & Ranieri, 2016; Rosenberg et al., 2016), build networks and collaborate (Greenhow & Askari, 2017), and develop their careers (Carpenter & Krutka, 2015; Malik et al., 2019; Prestridge, 2019; Déchène et al., 2024).
While there is a rich vein of literature on the digital social lives of educators, additional research is needed to delineate the composition of the social, scientific world on Twitter across a wide range of scientific topics, and how information is transmitted and controlled in this online world. From a pedagogical perspective, microblogging platforms like Twitter are important. As informal, digital learning spaces, they allow for fast and easy exchange of information amongst people from varied backgrounds, which can lead to increased social ties (Lundgren et al., 2024) as well as learning (Demir, 2024). This study analyzed how people discuss scientific topics on Twitter. We collected tweets about scientific topics under three hashtags, classified the users who created these tweets, and studied these users and the social network they formed. Our study has two main contributions: (1) improving understanding of scientific communication on social media platforms like Twitter and (2) providing evidence of people with varied experiences and expertise interacting within an online affinity space.

2. Conceptual Framework

Affinity spaces are unique spaces that unite people with common interests or passions (Gee, 2004). Unlike communities of practice that emphasize membership or apprenticeship, Gee (2004) uses the term “space” to define another social configuration that focuses on the interaction when people engage and learn. The great majority of research concerning affinity spaces comes from educational research. We see the potential of using affinity spaces as social media sites, as they can act as informal learning spaces (e.g., Lundgren & Couch, 2024; Ocon et al., 2021). We define informal learning based on Rogoff et al.’s (2016) definition of informal learning as “nondidactic, is embedded in meaningful activity, builds on the learner’s initiative or interest or choice, and does not involve assessment external to the activity” (p. 356). Applying the framework of affinity spaces to social media sites like Twitter is useful as people form communities around hashtags, trending topics, or shared interests: Essentially, people are building on their own initiative and choices that are meaningful to them. Twitter and other social networking sites enable informal learning and knowledge exchange and act as fluid, interest-driven spaces where expertise and participation are decentralized. In Gee’s (2012) description of affinity spaces, people gathered to interact with each other, to share practices and ideas based on a common interest. Gee further identified 11 features that can indicate the degree to which a space is an affinity space. Some of these features include the following: A common endeavor is primary, a common space is shared inclusive of different levels of experience and expertise, different kinds of knowledge are encouraged, and different routes and forms of participation exist. Affinity space features are flexible in that some spaces have more of the features than others.
Affinity spaces are common in today’s world. Fans of all things (e.g., movies, comic books, TV shows, video games, various lifestyles) create and maintain affinity spaces (Min et al., 2019; Shafirova et al., 2020; Barany & Foster, 2021; Dynel & Ross, 2022). Many businesses organize such spaces (Gee et al., 1996). Social activists also often organize themselves and others in terms of affinity spaces (Pour-Khorshid, 2018). Scientists from many different disciplines connect with others around the globe in a variety of ways, gradually taking on more of the features of an affinity space (Sharma & Land, 2018; Fontaine et al., 2019). These spaces are not just physical spaces; they can also be virtual spaces on the web.
Neely and Marone (2016) explored the participation of people with similar interests in informal social and learning activities by identifying 11 affinity space features in specific physical spaces: jam band parking lots. Some researchers have explored affinity spaces on social media, such as Twitter and Reddit, and other social networking sites. Greenhalgh et al. (2020) explored a teacher-focused Twitter hashtag, #michED, to determine whether different learning spaces exist in chat and non-chat tweets using the criteria of volume, content, interaction, and portal of the affinity space. Marcelo-Martínez and Marcelo (2025) analyzed how a hashtag on Twitter allows a space of affinity to be created that facilitates teachers’ learning. Na and Staudt Willet (2022) explored teachers’ early career development on Reddit posts. Staudt Willet (2019) explored how and why educators use Twitter affinity space generated by #Edchat. Staudt Willet and Carpenter (2020a, 2020b) also explored the change and continuity of two teaching-related subforums on Reddit and the contributions and interactions of four teaching-related subforums, respectively. Sharma and Land (2018), on the other hand, focused on knowledge sharing and interaction patterns in the discourse of a diabetic online affinity space. These studies suggest that affinity spaces can be identified in social media such as Twitter, and that affinity space features of specific topics will be more pronounced (e.g., groups of fans or groups of educators). For this reason, affinity spaces serve as the conceptual framework to determine the extent to which this online, scientific, social Twitter space can be characterized as an affinity space. Thus, we align with previous educational research into questions to determine who is involved in an online, scientific spaces centered on hashtags.

3. Background

3.1. Science Communication on Twitter

Science communication is multi-faceted, with myriad definitions. For this work concerning social media, we use the definition of science communication laid out by the United States’ National Academy of Science: “the exchange of information and viewpoints about science to achieve a goal or objective…or gaining greater insight into diverse public views and concerns about science” (National Academies of Sciences, 2017, p. 2). Moukarzel et al. (2020) found that Twitter created an opportunity space for science communication in which the scientific community, including researchers, can communicate science to the public and for the public to communicate with scientists. The science community faces a wide range of identified challenges: Influencers have less heterogeneous relations than companies; they engage in more activity but reach fewer unique individuals, and they primarily use networks for research, announcements, and commercial purposes (Moukarzel et al., 2020). Anderson and Huntington (2017) highlighted how social media discussions have the potential to influence the way people engage with science. N. M. Lee et al. (2020) found that companies communicate about various topics related to health and the environment that can have substantial implications at the individual and society levels. McNeil et al. (2024) provided insight into how paleontological art spread among audiences under the Twitter hashtag #SciArt and explored the enduring popularity of dinosaur-themed works in science communication, while Wang et al. (2025) described climate actions and actors. These studies provide a basis for further research into the effects of science communication on social media.
Previous research has shown that educators use social media to teach and share knowledge while building networks and collaboration. Manca and Ranieri (2016) presented potentials and obstacles for higher education teachers using social media in their teaching practices. Greenhow and Askari (2017) pointed out that social media seems to help strengthen interaction and networking among teachers, students, and parents. In particular, teachers have used Twitter in classrooms in various studies, across disciplines and activities with different durations (Tang & Hew, 2017). Rosenberg et al. (2016) found that teachers are highly active on education-specific hashtags. Through knowledge sharing and network building, teachers use Twitter to enhance career development and professional learning (Carpenter & Krutka, 2015; Malik et al., 2019; Prestridge, 2019).
Research on Twitter social networks is most often conducted through the analysis of Twitter users—specifically, their roles and the networks they form. For instance, Bex et al. (2019) defined the members of a paleontology social space from three levels (structure, category, and type) and how members from different categories such as scientist and public were sharing messages. Moukarzel et al. (2020) categorized influencers into three categories: scientific community, interested citizens, and for-profit companies. Studies that examined Twitter through Twitter users found that different categories of users all play a role in information sharing. In examining user networks, Ahmed et al. (2020) found that an isolated group and a broadcast group constituted the two largest social network structures through an analysis of 5G and COVID-19 conspiracy theories on Twitter. Further, Bhandoria et al. (2021) confirmed the network of “#IGCS2020” on Twitter as a community network shape with elements of a broadcast network (Smith et al., 2014). Categorizing and analyzing Twitter users can help understand who the people are in the Twitter online social space.

3.2. Research Questions

Previous research has been conducted on specific scientific topics or users, and user categorization provides insights into who people are within an online social space. Additionally, the analysis of social networks can reveal how the information is transmitted between users. In this research, we analyze scientific topics on Twitter, including who is in the affinity space (Twitter users) and how information spreads through it and influences user activity (social network analysis). We ask the following research questions:
  • RQ1: Who is involved in the affinity space of #ScienceTwitter, #SciComm, and #AcademicTwitter?
  • RQ2: How is scientific information contributed and distributed in this affinity space?
  • RQ3: How is the flow of information in the Twitter network influenced and controlled by different types of users?

4. Materials and Methods

This study aimed to identify members of an affinity space centered on scientific topics and analyze the wider conversations that occurred in social, scientific Twitter spaces to determine the social network structure. In this study, we collected Twitter data between June and July 2021 and then processed it to obtain a new database containing more attributes, including Twitter usernames, biographies, and their relationships. We classified users and visualized the social network based on the new dataset. This process consists of three stages: data collection, data coding, and data analysis.

4.1. Data Collection

Social networks are created whenever people interact directly or indirectly with other people, institutions, or artifacts; social network analysis can visualize complex relationships through graphs (Hansen et al., 2020). Researchers used social network analysis to examine topics around Twitter, identifying the centers of information dissemination and making recommendations for the promotion of scientific knowledge (Ahmed et al., 2020; Brajawidagda, 2012; M. K. Lee et al., 2017; Milani et al., 2020). Smith et al. (2014) suggested mapping social media networks can enable a better understanding of the variety of ways individuals form groups and organize online. They illustrated six different structures of connections around different kinds of topics on Twitter: polarized crowd, tight crowd, brand clusters, community clusters, broadcast network, and support network (Smith et al., 2014). The characteristics of each rely on the ways in which people connect to one another. For instance, in a broadcast network, users mainly connect to one main other user (a hub), while in a community cluster network, users are highly interconnected to one another and do not rely on information or connecting with only one main user.
Researchers have also conducted content analysis, which focuses on tweet categorization and its effect on message dissemination. For example, Bex et al. (2019) and Lundgren et al. (2022) classified five types of messages: Information, News, Opportunity, Research, and Off-Topic, finding that the most successful, engaged with, and far-reaching expression of scientific practice were Information posts. Additionally, Bombaci et al. (2016) defined the type of session in a conservation science conference and found Twitter effectively conveyed conservation science to a diverse and somewhat unexpected audience beyond the conference. Su et al. (2017) divided tweets into three categories based on the communication function: Information, Participant, and Community, and determined what type of communication they were and what their purpose was. Toupin et al. (2022) additionally used machine learning to discover user types who tweeted academic research about climate change. These studies show that defining kinds of information sharing can reveal what kind of content on Twitter is highly effective (i.e., highly shared, liked, retweeted, or replied to).
The original dataset was collected from three hashtags: #ScienceTwitter, #SciComm, and #AcademicTwitter. These hashtags were chosen using a hashtag tracking software called hashtagify.me that allowed for people to identify popular hashtags and track their popularity over time. An additional parameter for choosing hashtags came from our experience as researchers who have used Twitter as academics for the past ten years. Netlytic, a browser-based text and social network analysis service (Gruzd, 2016), was used to schedule a sampling of the Twitter public search API (application programming interface) every 15 min for a one-month period (June–July 2021). This process resulted in a dataset of 100,000 tweets with several attributes, including TweetID. We then imported the TweetIDs from the dataset into NodeXL (Smith et al., 2010), a Microsoft Excel Add-In that allows for researchers to collect and analyze more attributes than Netlytic. Using NodeXL, the original 100,000-tweet dataset was associated with 53,311 Twitter users. This transformed dataset included more attributes, such as username, description, and user relationship (i.e., mentions, retweets, replies to, etc.). The NodeXL dataset was used for social network visualization and analysis.

4.2. Data Coding

Two researchers manually classified 1000 Twitter users to prepare the data for machine learning classification of all users. Based on NodeXL’s feature of randomly sorting usernames, we selected the first 1000 users for classification. We used a taxonomy called paleontological identity taxonomy (PIT) (Lundgren et al., 2018) for our manual coding process. The PIT is a tool that can be used to classify members of digital social spaces. It uses members’ self-descriptions (i.e., Twitter user biographies) to classify them into three different levels: structure, category, and type. The main unit of analysis in this study was at the category level, defined as a general representation of an entity’s identity. The PIT has been validated and used in multiple studies (e.g., Lundgren et al., 2024; Lundgren & Couch, 2024; Lundgren & Crippen, 2024; Lundgren et al., 2022; Ocon et al., 2021); we saw potential to expand its use to wider scientific discourse, instead of focusing on a singular scientific discipline. To code for category, users are divided into Public, Scientists, or Education and Outreach (Table 1). The first and second authors discussed any discrepancies to consensus (Patton, 2002).

4.3. Data Analysis

To answer research question 1 (Who is involved in the affinity space of #ScienceTwitter, #SciComm, and #AcademicTwitter?), all 53,311 users were classified into one of three categories. Due to the large number of Twitter users in the whole dataset, the dataset was deemed appropriate for computational analyses. We first tried two different methods for classification: RapidMiner and building dictionaries. RapidMiner (v. 10.3.1) is software that can call different algorithms for data mining and processing. When we fed the sampled usernames into RapidMiner, it had a high accuracy rate (0.96) in the Scientist category but misclassified users in other categories as Scientist. We also built dictionaries for classification (Côté & Darling, 2018; Li et al., 2019; Toupin et al., 2022; Walter et al., 2019), achieving high accuracy rates for Scientist (0.95) and Education and Outreach (0.87) but not Public (0.46). We postulate that the low accuracy can be accounted for due to the high degree of overlapping words in their dictionaries.
Next, we experimented with multiclass classification for categorization (Grandini et al., 2020). In this, each piece of sampled text can only be labeled as one class. Several researchers have applied the multiclass classification to the analysis of Twitter user content (Balabantaray et al., 2012; Ceron et al., 2015; Bouazizi & Ohtsuki, 2019; Li et al., 2019; AlSomaikhi & Alzamil, 2020). We used the Python library Scikit-Learn (v. 1.4.2) (Pedregosa et al., 2011) to implement the multiclass classification models. We divided the 1000 manually coded users (407 Scientists, 212 Education and Outreach, 381 Public) into training and test sets (80:20 ratio) to evaluate seven models with 5-fold cross-validation. The models included Logistic Regression, Random Forest, Linear Support Vector Machine, Support Vector Machine, Multinomial Naive Bayes, Stochastic Gradient Descent, and Multilayer Perceptron. We extracted features from user bio text using the term frequency–inverse document frequency (TF-IDF, evaluating the importance of different words in a sentence). Performance metrics included accuracy, precision (ratio of true positives and total positives predicted), recall (ratio of true positives to all actual positives), and F1 score (harmonic mean of precision and recall) for each category and macro (arithmetic mean) and weighted values (mean while considering each class’s support). We selected Stochastic Gradient Descent as the best model for classification, due to good performance across metrics in all classification categories (Table 2).
Following the classification of user biographies, we used NodeXL to conduct a social network analysis to visualize the network structure with the Harel–Koren Fast Multiscale algorithm. All users were grouped into clusters using the Clauset–Newman–Moore algorithm (Clauset et al., 2004), which enables the discovery of subgroups within the larger dataset. Nodes represented the users and edges represented five connection types between the users (Table 3). This network visualization helped answer research question 2: How is scientific information contributed and distributed in this affinity space?
To answer research question 3 (How is the flow of information in the Twitter network influenced and controlled?), we used social network graph metrics. Specifically, centrality measures of influence (degree, betweenness, closeness, and eigenvector) were calculated in NodeXL (Smith et al., 2010). Degree centrality measures the number of connections a person has in the network (Hansen et al., 2020). Betweenness centrality helps identify individuals who play a “bridge spanning” role in a network (Hansen et al., 2020, p. 83). Closeness centrality shows that if information needs to flow through the network, a person may need a few or many steps to send messages to all other people (Hansen et al., 2020, p. 83). The eigenvector centrality network metric considers not just “how many people you know” but also “who you know” (Hansen et al., 2020, p. 84). These measures can identify key people in influential locations in the discussion network, highlighting the people leading the conversation. Additional network graph metrics include the numbers of edges and vertices, geodesic distance, and density, as defined in Hansen et al. (2020). Edges represent connections between entities. Entities are referred to as vertices or nodes. The geodesic distance is the length of the shortest path between two people in a network. It gives a sense of how “close” community members are to one another. The graph density is a number between 0 and 1 and is calculated from the number of actual connections in the network and the number of possible connections that are determined by the number of people in the network. It measures how interconnected people are in the network. Hansen et al. (2020) suggest larger social networks tend to have lower graph density. For additional information please see Supplementary Material.

5. Results

This affinity space contains 53,311 members and 136,126 connections (i.e., original tweets, replies, and retweets). Regarding categories, 45% were Scientist (n = 24,125), 32% were Public (n = 16,803), and 23% were Education and Outreach (n = 12,383). While Scientist remained the primary participants in scientific topics on Twitter, the Public and Education and Outreach users also shared in this space to communicate about science.

5.1. Social Network Analysis

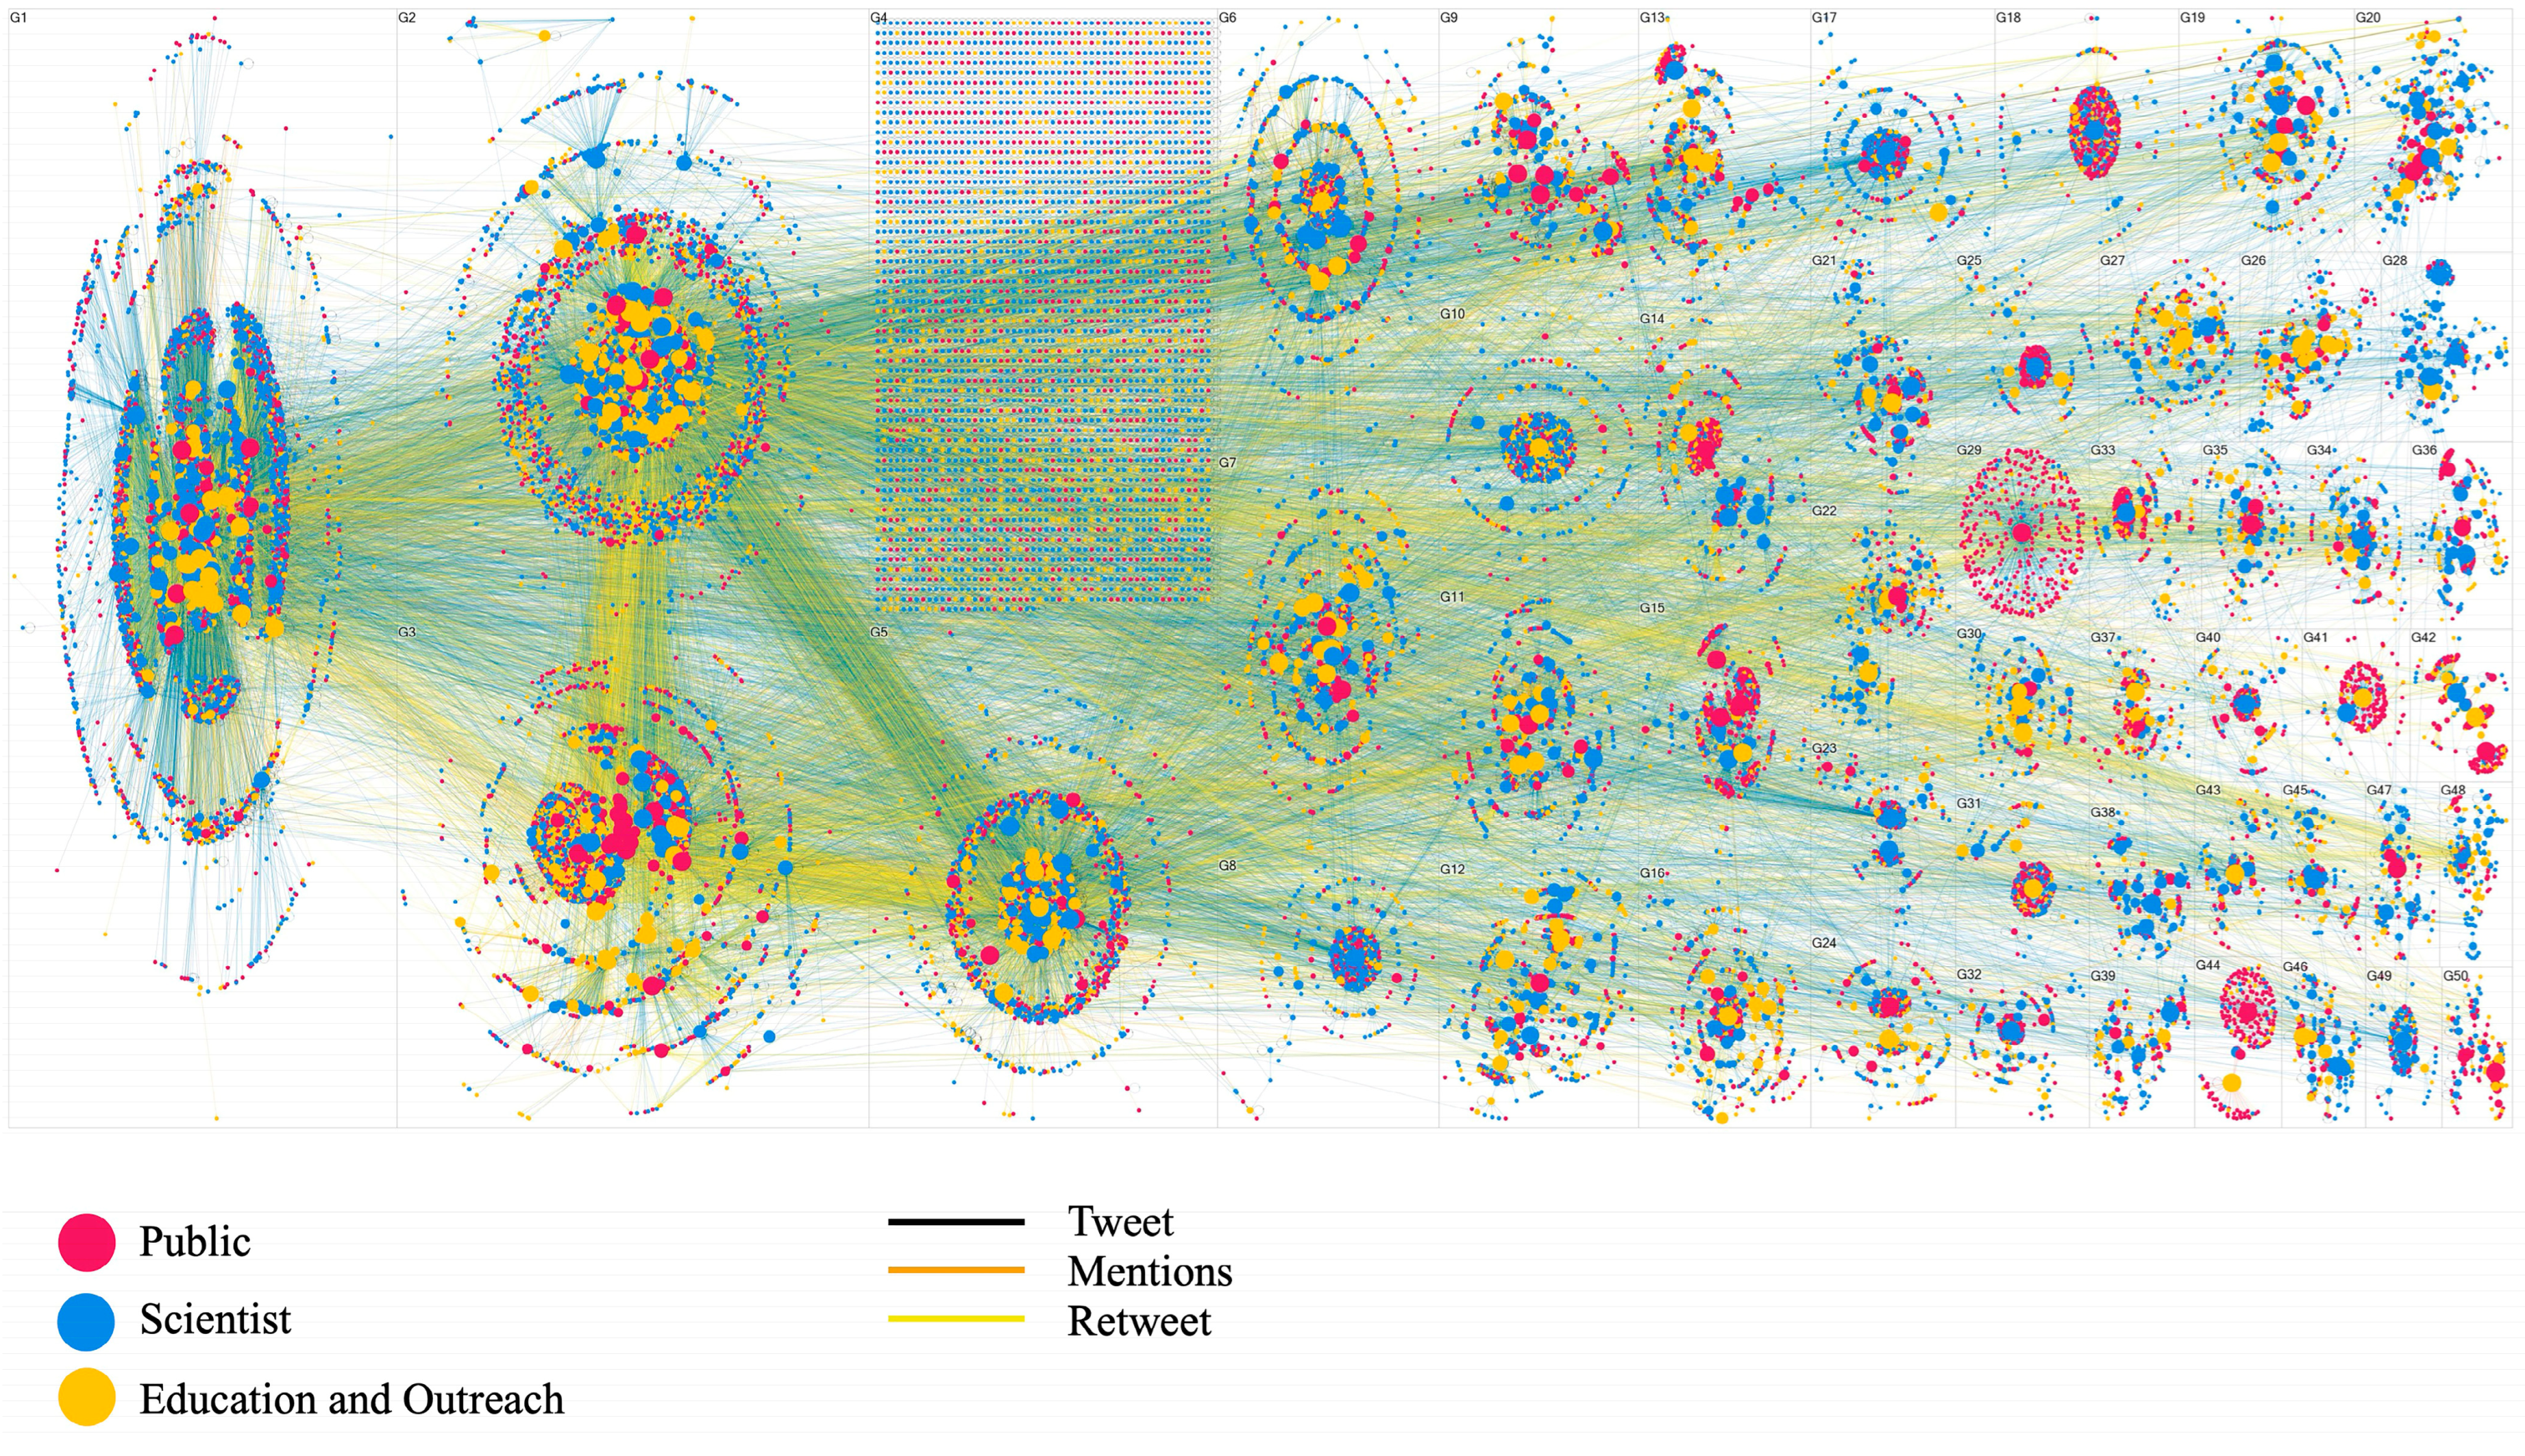
Our analysis of the entire social network showed that the members and their interactions in this affinity space form Community Clusters (Figure 1). According to Smith et al. (2014), the Community Clusters structure is usually formed around some popular topics and may develop multiple smaller groups, which often form around a few hubs, each with its own audience, influencers, and sources of information. These Community Cluster conversations look like bazaars with multiple centers of activity (Smith et al., 2014). This structure creates a collection of medium-sized groups and a fair number of isolates.
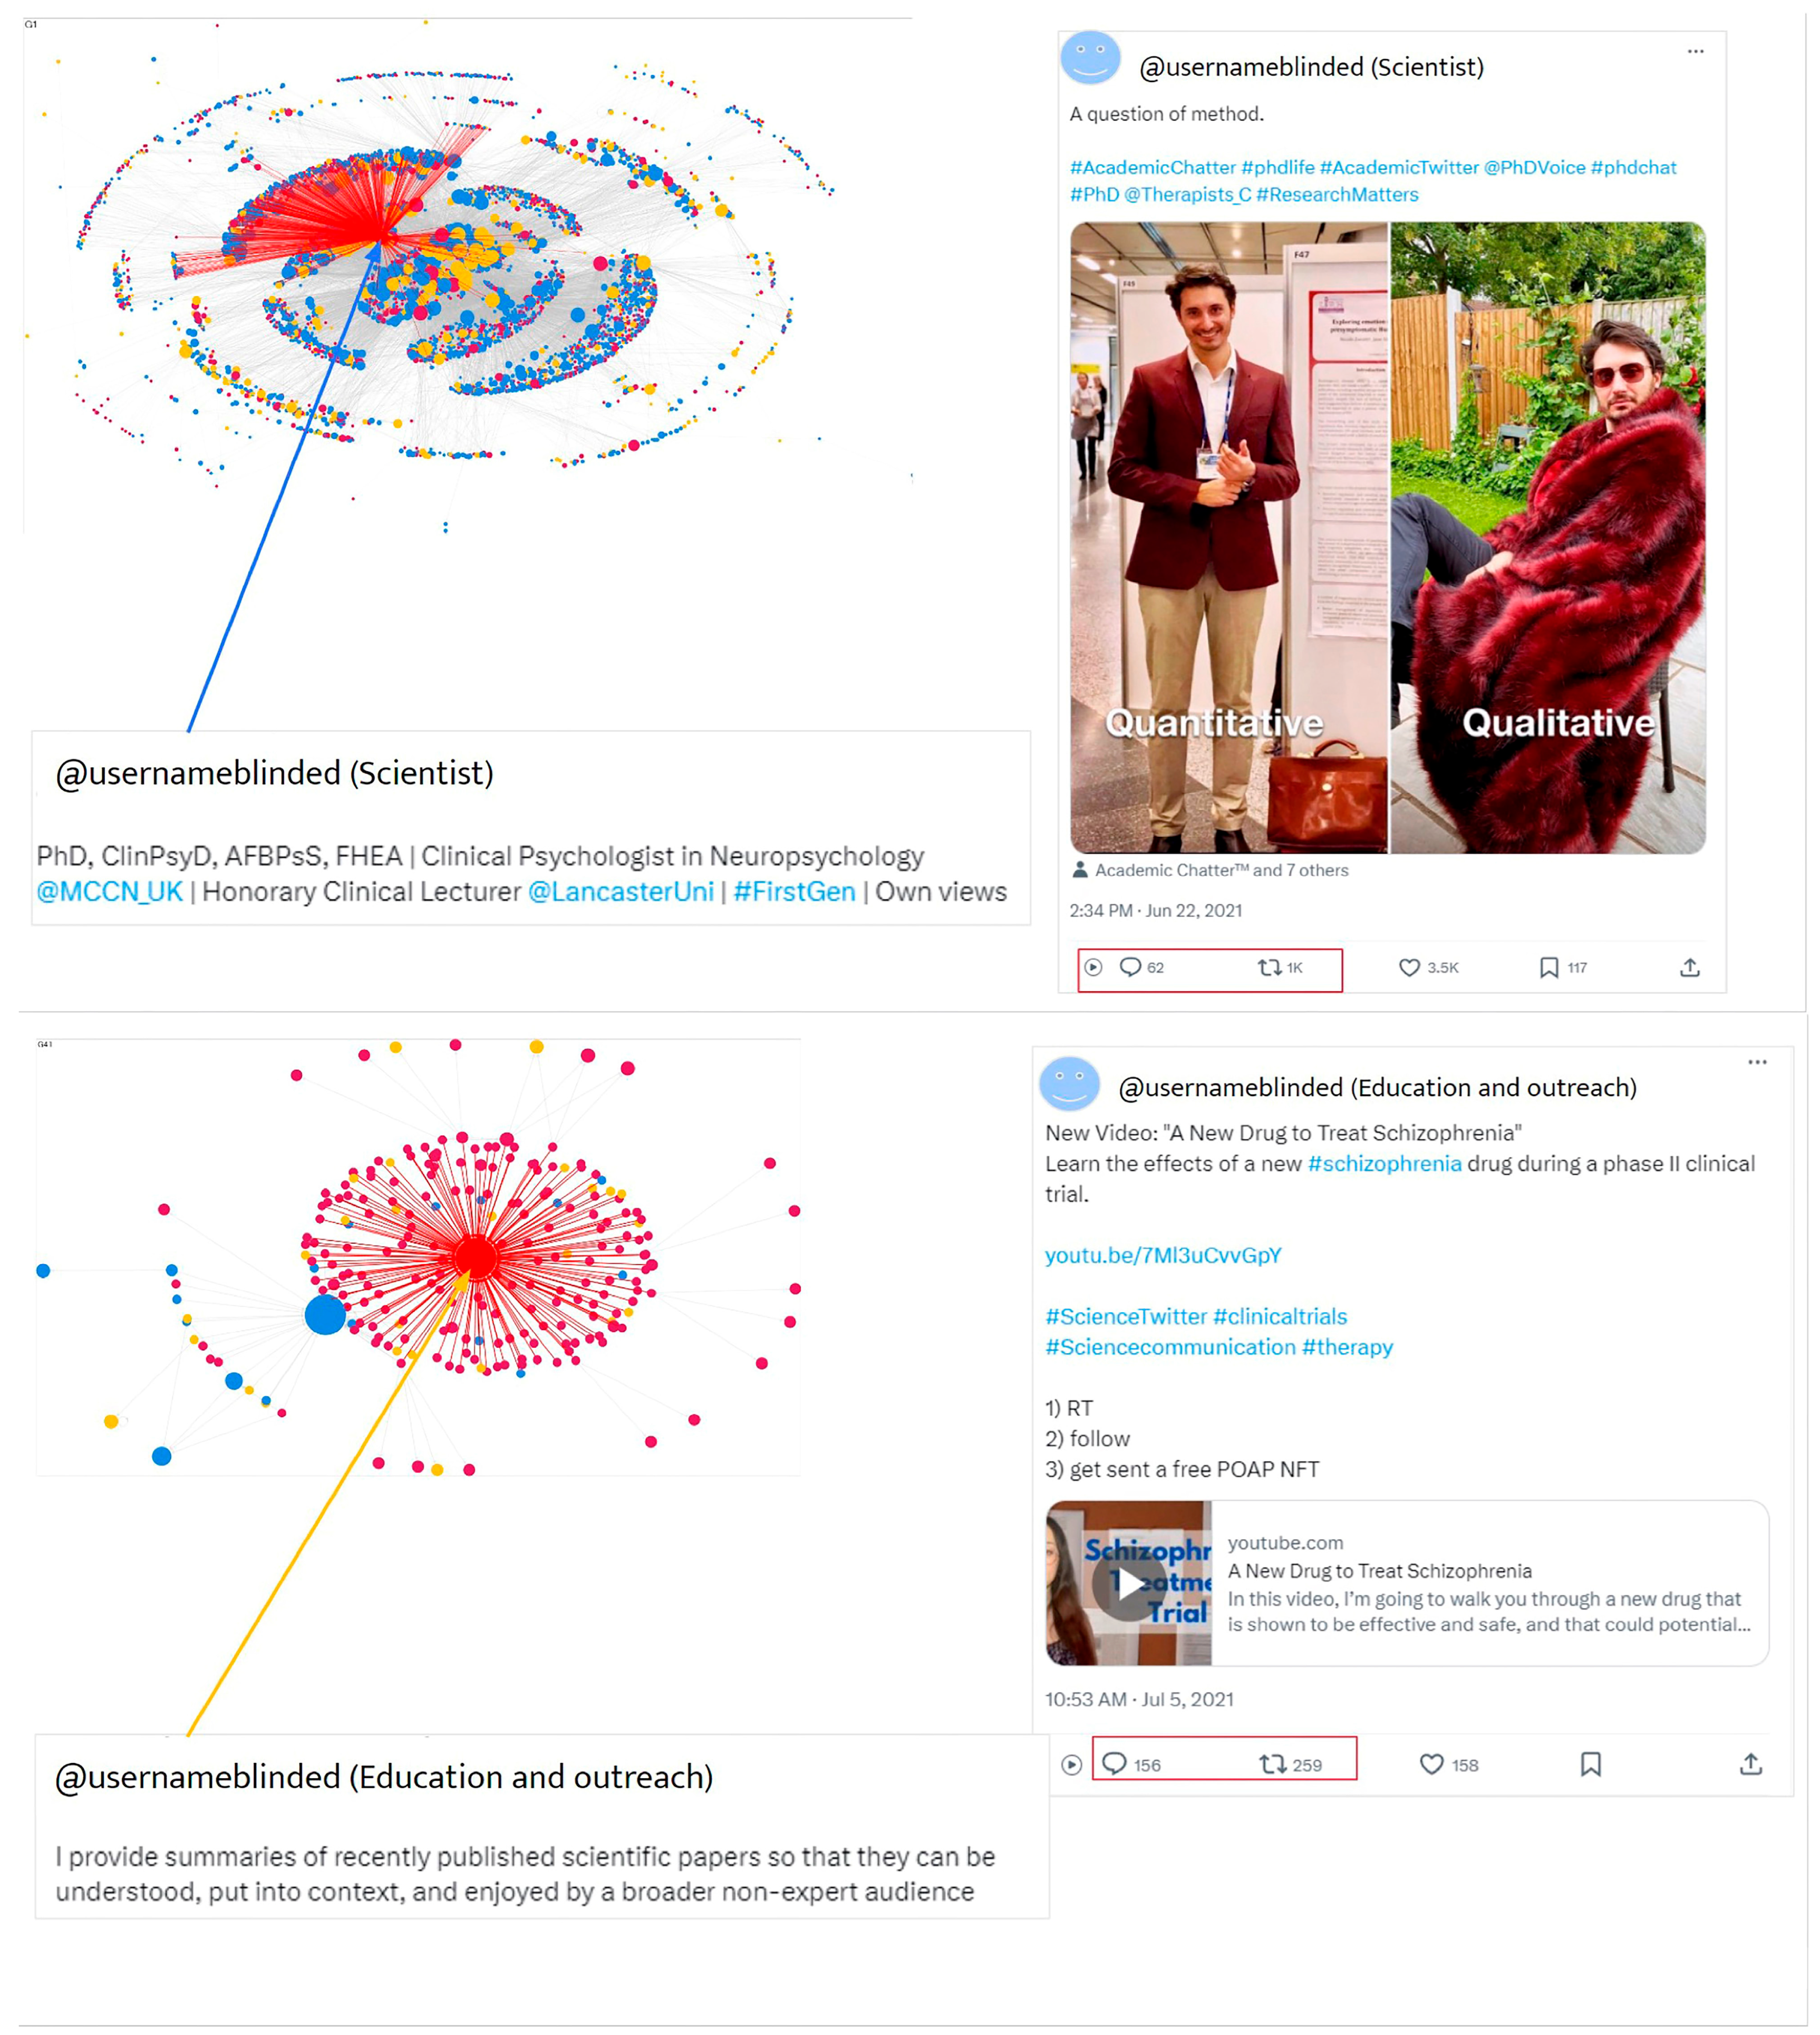
Conversations surrounding the three hashtags of #ScienceTwitter, #SciComm, and #AcademicTwitter consisted of a total of 2240 groups, ranging from 2 to 6247 people. Most groups were medium-sized groups formed around a few central entities. There was also one group containing 3093 individuals, who were isolated, meaning that they did not communicate with anyone else. People built connections with others in groups in four main ways: mentions, retweets, mentions in retweets, and replies to (Table 3). Of the 136,126 connections created by 53,311 users, there were 59,941 mentions in retweets, 49,134 retweets, 17,237 mentions, 7976 tweets, and 1838 replies to (Table 4). The distinct differences in numbers (i.e., 7976 tweets versus 59,941 mentions in retweet) means that most people in this network interact with others in different ways. Figure 2 shows two central users’ self-descriptions and categories, and how their tweets spread across the social network. Measuring how central users are reveals the influential users of this social network and how they are connected to one another.
In this network, the maximum geodesic distance (diameter) is 18 and the average geodesic distance is approximately equal to 4. This suggests that the farthest distance between two people from each other is not too far and the average length of the distance between all pairs of people is small. The graph density is 0.00005. In this affinity space, people form a less tightly connected community structure despite interacting and connecting with other members of the same group or other groups.
We selected the first 50 groups to display the new social network graph using NodeXL’s community detection algorithm, in which groups (i.e., clusters) that are connected to one another are mapped and displayed. The first 50 groups are those that represented larger clusters of entities (Figure 3). It is important to note that for this network, the vast majority of groups (2190) consisted of small groups (i.e., isolates or dyads). These isolates or dyadic groups indicate that most people in this social network did not interact with others or interacted little and were limited to a few people they knew.
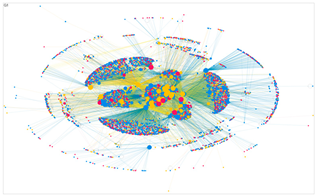
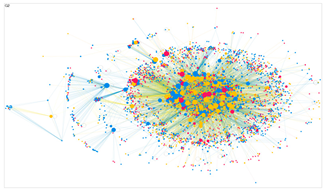
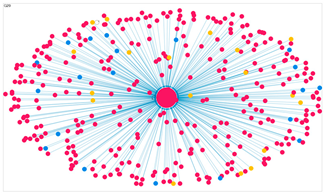
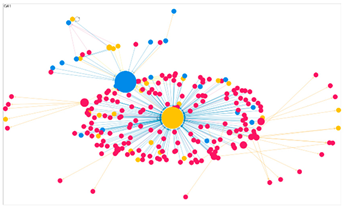
Most of the 50 groups showed shapes of clusters, with a few broadcast networks and one isolated group (Table 5). Group 1 (label G1) exhibited a shape centered on certain people, which indicates that the sources of information and the paths of dissemination were in the hands of Scientist and Education and Outreach users. Group 2 (label G2) showed a group formed by three categories of people in almost equal numbers, which suggests that the Public, Scientist, and Education and Outreach users were discussing scientific topics together. Some groups showed a broadcast network where members were usually connected only to the central user and not to each other. Groups 29 (label G29) and 41 (label G41) showed such a network. Members in these groups replied or retweeted the central member, suggesting that the central member had some influence. These two groups also demonstrated groups where almost only one category (Scientist, Education and Outreach, Public) existed. This indicates that within such groups, people only built connections with people who are close to them in terms of their identity. Group 4 (label G4), on the other hand, was an isolated group. It was made up of independent members of different categories who did not connect with any other groups or persons. This suggests that in this group people posted tweets discussing relevant topics but did not interact with anyone else.

5.2. User Analysis

People within groups interact, and those at the center of influence build bridges of communication externally, allowing different groups to connect and form this large social network. Measuring how central users were reveals influential users and their connections to one another. Influential users were ranked by the score of degree centrality, betweenness centrality, closeness centrality, and eigenvector centrality. Category descriptions were also provided for all users.

5.2.1. Scientists and Educators Held the Sources of Information and Public Disseminated Information

Degree centrality measures the number of connections a user has in the network. In-degree centrality measures the connections others initiate with a user. Users with high in-degree centrality scores can be seen as the center of communication since others mention, reply to, or retweet their posts. Out-degree centrality counts the connections a user initiates with others. A high out-degree centrality score means a user tweets a lot about topics to gain attention by mentioning or replying to others. These two metrics demonstrate which members control the flow of information and the level of engagement among members.
All top ten users in this network of in-degree centrality were Scientist and Education and Outreach users (Table 6). The highest in-degree centrality (3417) was an Education and Outreach user. This means that these users were the center of this affinity space and held the source of information. Their posts received attention and were shared. For example, Scientist 1 tweeted, “Data visualization in R? Here is a great cheat sheet for ggplot2 that hopefully can be useful. Please share #AcademicTwitter #phdchat #Bioinformatics (All accessible PDFs of R-provided cheat sheets can be downloaded here: [HYPERLINK])” and added two images showing a cheat sheet for the ggplot2 package in R, which is useful for data visualization. Another scientist tweeted, “As a postdoc, students sometimes ask me for advice on how they should communicate with their Prof/PI. Having sent and received 1000s of academic emails, here’s what I’ve learned about how to be effective in communication with senior faculty. #phdchat #AcademicTwitter.” A user who was classified into the category of Education and Outreach wrote, “Hey, just don’t forget to start! #AcademicTwitter #phdvoice #phdfriend (An image showing meme for Gru’s plan “come with a research idea, reduce it to a research question, present it to your supervisors, Start!”).” These examples indicate that central, important users in the network were those who shared information, memes, or solutions to problems. However, high in-degree users did not have high measures of out-degree. We postulate that this might demonstrate (a) a focus on others, (b) a focus on themselves, or (c) a user with many followers who has prestige and whose messages are interacted with by followers. In any case, the top ten users embody certain features of affinity spaces, namely, within this common shared space, different kinds of expertise (i.e., categories of users) and expertise (i.e., focusing on different topics) were included.
Six of the top ten users of out-degree centrality were Public, four of which were bots (Table 7), which we ascertained from examining the user biographies. Within the user biographies, these bot accounts indicated that they were bot accounts, such as one that wrote, “friendly bot advocates female empowerment particularly stem, ai & tech” and another that wrote, “[account name] retweets #radiomics tweets tweets random (recent) radiomics paper hour accounts that used automated features instead of posting spam messages.” They forwarded useful information, automatically generated content, or automatically replied to other users. The user with the highest out-degree centrality (4112) was a bot. These bot accounts automatically retweeted tweets with specific hashtags, such as #scicomm, #scipol, #scidip, and #sciart, resulting in high out-degree centrality. There was only one Education and Outreach user who had high in-degree and out-degree scores. This means that this user actively interacted with others while people paid attention to their posts.

5.2.2. Scientists and Educators Connected Other Users

Betweenness centrality helps identify individuals who play a “bridge-spanning” role in a network. In this affinity space, eight of the top ten users of betweenness centrality were composed of Scientist and Education and Outreach categories, and a few were Public (Table 8). The highest betweenness centrality user was from the category of Public, which was also a bot account that had the highest out-degree centrality. All ten users had high in-degree or out-degree centrality scores. This shows that Scientist and Education and Outreach users built connections throughout the social network by acting as a bridge to other users, which is a feature of affinity spaces in that dispersed knowledge is encouraged and that everyone can contribute in some way (producing information or consuming it).

5.2.3. Public and Education Users Spread Information

Closeness centrality shows how closely connected people are in the network. Users with the highest closeness centrality scores were mainly in the Education and Outreach category (Table 9). This affinity space features a poor closeness centrality—0.336 was the highest observed—which indicates that users were relatively distant from each other throughout the entire Twitter network. Users with both a high closeness centrality and a high in-degree centrality were closer to others and could get information to others relatively quickly. Similarly, users with both a high closeness centrality and a high out-degree centrality could share others’ posts relatively quickly. This means that these users were the first to be considered when information needed to be effectively communicated and spread to most people in this affinity space. This is an example of the affinity space feature of different forms and routes to participation: Some people dispersed information while others received it.

5.2.4. Public and Education Users Had Many Influential Connections

Eigenvector centrality helps identify who is the most influential. The users with high eigenvector centrality were mostly those categorized as Public and Education and Outreach (Table 10). This indicates these users had many connections with others while being highly connected to some popular individuals. This might have impacted how information flowed in the affinity space. Information disseminated among these users was more effective relative to others because they were influential and the users they were connected with were equally influential.
Betweenness centrality, closeness centrality, and eigenvector centrality measures help identify who is important or central in this affinity space. They may be important bridge-builders to connect other different parts of the network, or they may be at the center of the network getting attention from or giving attention to other members. These key people are in influential positions and lead the conversations in this affinity space. Without them, messages would be difficult to send and share.

6. Discussion

6.1. Using Social Media Platforms Like Twitter as Tools for Accessing Science Information

The results of this study showed that 53,311 members of the affinity space of #ScienceTwitter, #SciComm, and #AcademicTwitter consisted of three categories: Scientist, Public, and Education and Outreach. All three categories were evenly represented rather than one category having a particularly large or small number of members. Scientists and the public remain an important part of the science-related conversation on Twitter (Bex et al., 2019; Moukarzel et al., 2020; Bhandoria et al., 2021). We found that users who identified as Education and Outreach also made up a significant portion (23%, n = 12,383). This validates that educators were using Twitter as a tool for accessing information, participating in their respective communities of interest, and sharing their insights on specific topics (Malik et al., 2019; Prestridge, 2019). With the scientific exodus from Twitter and the rise of other similar platforms such as Mastodon and Bluesky, we anticipate that such sites encourage users from varied backgrounds to access information, participate in communities, and share insights. Thus, we see potential for reproducing a study like ours on these newer platforms.

6.2. Social Networks Can Be Better Understood Through Indentifying the Users

We found that scientific information was shared among members and formed a social network with a Community Clusters structure. This shows that the affinity space of those who used the hashtags #ScienceTwitter, #SciComm, and #AcademicTwitter was shared regardless of expertise. This study also shows that social network analysis does not have to be limited to structural analysis (Smith et al., 2014); rather, social networks can be better understood by identifying users in the social world. This helps us understand the important and central members in the network—authoritative members who can quickly spread and share information. This is important, especially when specific information needs to be disseminated, and those members who are more connected in the network can help break down information barriers for the purpose of promoting or explaining science (Ahmed et al., 2020). Additionally, similar to many other studies on large social networks, some metrics, such as density, lose their explanatory power (e.g., Darmon et al., 2015). By triangulating other metrics, including centrality measures, we can make more informed decisions as to who is influential within this affinity space.

6.3. Bots Spread Information, but Some Bots Are Malicious and Difficult to Detect

Within this affinity space, Scientist, Public, and Education and Outreach members all had important information dissemination roles. Although the members with high centrality scores contained four bot users, according to their descriptions, they were all accounts that used automated features instead of posting spam messages. They forwarded useful information, automatically generated content, or automatically replied to other users. Their presence made information dissemination faster, and their outward activities (retweets) built more connections in this affinity space. Most research focuses on how to identify Twitter bots rather than discussing how to properly utilize bot accounts for science information campaigns (S. Lee & Kim, 2013; Minnich et al., 2017; Feng et al., 2021). In this study, we found that bots had high centrality scores in the network. In future research, it may be possible to explore how to use bot accounts to collect information, such as forwarding posts from specific accounts and extracting keywords to simplify information and then share the information to the public.

6.4. This Online, Social, Scientific World Fulfilled Certain Aspects of Affinity Spaces

This study demonstrated that the science-based affinity space on Twitter was composed of diverse users attracted to certain hashtags. There were many different forms and routes to participation (Gee, 2012). People participated on Twitter by creating posts, following hashtags, and interacting with others (e.g., retweeting, replying to, mentioning). In addition, this affinity space fulfilled certain features evidenced by the centrality measures, including sharing the space regardless of expertise, providing multiple routes to status, and having a porous leadership structure (Gee, 2012). Affinity spaces are not limited to physical space. With the current development of science and technology, digital space breaks geographical and time constraints, and more interactions and content sharing are taking place. Our research confirms this. In this affinity space, people from diverse backgrounds came together to pursue common endeavors for scientific communication. From scientists to educators to the public, people could be novices or experts, express their opinions, and connect with people they might have known (or not!). Our research promotes the study of affinity spaces by identifying the degree of features. While affinity spaces are conceptualized to have a high degree of interactions, the network density in this study is notably low (0.00005). An implication for improving science communication on similar platforms is to examine ways to improve interactions that occurred in the affinity space. We see similarities in our study to Staudt Willet’s (2019) and Neely and Marone’s (2016) studies with specific user groups in that certain features of the affinity space need to be strengthened. Any space that has more of these features is closer to being a paradigmatic affinity space (Gee, 2012). By improving affinity space degree, users are more engaged, have access to better resources, and can interact more meaningfully with each other. Consequently, they are likely to learn more and develop their skills and knowledge more effectively.

6.5. Limitations and Future Research

Since this study focused on analyzing who the users engaging with scientific topics on Twitter were and how they communicated, we paid less attention to the content of the tweets themselves. Future research, such as content analysis in which researchers classify tweets to learn which types of posts get the most attention and provide practitioners with strategies for writing tweets, would potentially provide new insights to this affinity space. In addition, the data was collected over a period of only one month, and it cannot be ruled out that a specific time or event will affect the density of people’s engagement in the topic. Future work could examine longitudinal studies of science communication, such as changes in how people discuss scientific topics on microblogging platforms over several months or years. These sorts of studies could investigate changes (if any!) that occur in users identified as Scientist, Public, and Education and Outreach. Research into designing affinity spaces that feature information or roles for these groups could also be fruitful. An additional line of research could entail examining the data from an Ego-net analysis in which entities and their connections are more deeply investigated to understand if homophily (i.e., like-minded individuals communicating with one another) played a role in the flow of communication within this affinity space (Moukarzel et al., 2020). We also acknowledge the highly quantitative nature of this work, which can limit in-depth understanding of the context and people whose data we collected and analyzed. Future work could bring deeper understanding through in-depth analysis of representative users’ accounts and social networks followed by interviews with such users.

7. Conclusions

The purpose of this study was to identify the users of the Twitter online world formed by three scientific hashtags. We found three roles: Scientist, Public, and Education and Outreach users. We presented the taxonomy we used, PIT, as a valid and reliable tool that is based on users’ self-identification (Twitter user bio) and how users primarily describe themselves in their scientific practice.
In this online world, all three categories of users were playing key roles, especially educators, who both connected others and spread information. This is important for educators, who may be effective communicators of scientific information without knowing it. In other studies that feature educators on Twitter (e.g., Richter et al., 2024; McNeil et al., 2024), educators learned from other educators. In our study, educators were able to share their knowledge with people outside their circles. This finding provides further evidence for the notion that social media sites such as Twitter allow for learning amongst different kinds of people (Demir, 2024). Our findings are also important for researchers, as they can use this study as a basis for determining how educators contribute to science communication on social media. Further research in this context is highly recommended and essential to promoting how science communication can appeal to the public and reduce misinformation.
Finally, our study enriches the application of affinity space theory. This study, like other studies on teachers (e.g., Marcelo-Martínez & Marcelo, 2025; Na & Staudt Willet, 2022) and chronically ill people (Sharma & Land, 2018), provides evidence that Twitter meets criteria for being a virtual affinity space. Additionally, this study proves that affinity space theory is also applicable to a wider range of science topics.

Supplementary Materials

Supporting information can be downloaded at: https://osf.io/2q86k/?view_only=08ee500681634cbe90234b3beec621cd (created on 30 April 2025).

Author Contributions

Conceptualization, L.L.; methodology, M.Z., L.L. and H.N.; software, M.Z. and L.L.; validation, H.N.; formal analysis, M.Z.; investigation, M.Z. and L.L.; resources, L.L.; data curation, M.Z. and L.L.; writing—original draft preparation, M.Z. and L.L.; writing—review and editing, M.Z., L.L. and H.N.; visualization M.Z.; supervision, L.L.; project administration, L.L.; funding acquisition, None. All authors have read and agreed to the published version of the manuscript.

Funding

This research received no external funding.

Institutional Review Board Statement

This research was approved under Utah State University IRB #13813 and was determined to be “not human subject research” on 30 August 2023.

Informed Consent Statement

Not applicable.

Data Availability Statement

Data is available upon request.

Acknowledgments

The authors would like to acknowledge the Lundgren Learning Lab for their assistance with the development of this manuscript.

Conflicts of Interest

The authors declare no conflicts of interest.

Abbreviations

The following abbreviations are used in this manuscript:
APIApplication programming interface
PITPaleontological Identity Taxonomy
TF-IDFTerm frequency–inverse document frequency

References

  1. Ahmed, W., Vidal-Alaball, J., Downing, J., & López Seguí, F. (2020). COVID-19 and the 5G conspiracy theory: Social network analysis of Twitter data. Journal of Medical Internet Research, 22(5), e19458. [Google Scholar] [CrossRef]
  2. AlSomaikhi, N. A., & Alzamil, Z. A. (2020). Twitter users’ classification based on interest. International Journal of Information Retrieval Research, 10(1), 1–12. [Google Scholar] [CrossRef]
  3. Anderson, A. A., & Huntington, H. E. (2017). Social media, science, and attack discourse: How Twitter discussions of climate change use sarcasm and incivility. Science Communication, 39(5), 598–620. [Google Scholar] [CrossRef]
  4. Balabantaray, R., Mohammad, M., & Sharma, N. (2012). Multi-class Twitter emotion classification: A New Approach. International Journal of Applied Information Systems, 4(1), 48–53. [Google Scholar] [CrossRef]
  5. Barany, A., & Foster, A. (2021). Context, community, and the individual: Modeling identity in a game affinity space. The Journal of Experimental Education, 89(3), 523–540. [Google Scholar] [CrossRef]
  6. Bex, R. T., Lundgren, L., & Crippen, K. J. (2019). Scientific Twitter: The flow of paleontological communication across a social network. PLoS ONE, 14(7), e0219688. [Google Scholar] [CrossRef] [PubMed]
  7. Bhandoria, G. P., Nair, N., Jones, S. E. F., Eriksson, A. G., Hsu, H.-C., Noll, F., Ahmed, W., & International Gynecological Cancer Society. (2021). International Gynaecological Cancer Society (IGCS) 2020 annual global meeting: Twitter activity analysis. International Journal of Gynecological Cancer, 31(11), 1453–1458. [Google Scholar] [CrossRef] [PubMed]
  8. Biever, C. (2025). Bluesky’s science takeover: 70% of Nature poll respondents use platform. Nature. [Google Scholar] [CrossRef]
  9. Bombaci, S. P., Farr, C. M., Gallo, H. T., Mangan, A. M., Stinson, L. T., Kaushik, M., & Pejchar, L. (2016). Using Twitter to communicate conservation science from a professional conference. Conservation Biology, 30(1), 216–225. [Google Scholar] [CrossRef]
  10. Bouazizi, M., & Ohtsuki, T. (2019). Multi-class sentiment analysis on twitter: Classification performance and challenges. Big Data Mining and Analytics, 2(3), 181–194. [Google Scholar] [CrossRef]
  11. Brajawidagda, U. (2012, December 3–5). Twitter tsunami early warning network: A social network analysis of Twitter information flows. Proceedings of 2012 Australasian Conference on Information Systems, Geelong, Deakin. [Google Scholar]
  12. Carpenter, J. P., & Krutka, D. G. (2015). Engagement through microblogging: Educator professional development via Twitter. Professional Development in Education, 41(4), 707–728. [Google Scholar] [CrossRef]
  13. Carpenter, J. P., Rimmereide, H. E., & Turvey, K. (2024). Exploring and comparing teachers’ X/Twitter use in three countries: Purposes, benefits, challenges and changes. British Journal of Educational Technology, 56(4), 1593–1611. [Google Scholar] [CrossRef]
  14. Ceron, A., Curini, L., & Iacus, S. M. (2015). Using sentiment analysis to monitor electoral campaigns. Social Science Computer Review, 33(1), 3–20. [Google Scholar] [CrossRef]
  15. Clauset, A., Newman, M. E. J., & Moore, C. (2004). Finding community structure in very large networks. Physical Review E, 70(6), 066111. [Google Scholar] [CrossRef]
  16. Côté, I. M., & Darling, E. S. (2018). Scientists on Twitter: Preaching to the choir or singing from the rooftops? FACETS, 3(1), 682–694. [Google Scholar] [CrossRef]
  17. Darmon, D., Omodei, E., & Garland, J. (2015). Followers are not enough: A multifaceted approach to community detection in online social networks. PLoS ONE, 10(8), e0134860. [Google Scholar] [CrossRef]
  18. Demir, M. (2024). A taxonomy of social media for learning. Computers & Education, 218, 105091. [Google Scholar] [CrossRef]
  19. Déchène, M., Lesperance, K., Ziernwald, L., & Holzberger, D. (2024). From research to retweets—Exploring the role of educational Twitter (X) communities in promoting science communication and evidence-based teaching. Education Sciences, 14(2), 196. [Google Scholar] [CrossRef]
  20. Dynel, M., & Ross, A. S. (2022). Metarecipient parents’ #Bluey tweets as a distributed fandom affinity space. Poetics, 92, 101648. [Google Scholar] [CrossRef]
  21. Ebersole, L., Foulger, T. S., Jin, Y., & Mourlam, D. J. (2024). Exploring Twitter as a social learning space for education scholars: An analysis of value-added contributions to the #TPACK network. British Journal of Educational Technology, 56(3), 1210–1230. [Google Scholar] [CrossRef]
  22. Feng, S., Wan, H., Wang, N., Li, J., & Luo, M. (2021, November 1–5). TwiBot-20: A comprehensive Twitter bot detection benchmark. Proceedings of 30th ACM International Conference on Information & Knowledge Management (pp. 4485–4494), Virtual Event, QLD, Australia. [Google Scholar] [CrossRef]
  23. Fontaine, G., Maheu-Cadotte, M.-A., Lavallée, A., Mailhot, T., Rouleau, G., Bouix-Picasso, J., & Bourbonnais, A. (2019). Communicating science in the digital and social media ecosystem: Scoping review and typology of strategies used by health scientists. JMIR Public Health and Surveillance, 5(3), e14447. [Google Scholar] [CrossRef]
  24. Gee, J. P. (2004). Affinity Spaces. In Situated language and learning. Routledge. [Google Scholar]
  25. Gee, J. P. (2012). Situated language and learning: A critique of traditional schooling. Routledge. [Google Scholar] [CrossRef]
  26. Gee, J. P., Hull, G., & Lankshear, C. (1996). The new work order: Behind the language of the new capitalism. Westview. [Google Scholar]
  27. Grandini, M., Bagli, E., & Visani, G. (2020). Metrics for multi-class classification: An overview. arXiv. [Google Scholar] [CrossRef]
  28. Greenhalgh, S. P., Rosenberg, J. M., Staudt Willet, K. B., Koehler, M. J., & Akcaoglu, M. (2020). Identifying multiple learning spaces within a single teacher-focused Twitter hashtag. Computers & Education, 148, 103809. [Google Scholar] [CrossRef]
  29. Greenhow, C., & Askari, E. (2017). Learning and teaching with social network sites: A decade of research in K-12 related education. Education and Information Technologies, 22(2), 623–645. [Google Scholar] [CrossRef]
  30. Gruzd, A. (2016). Netlytic: Software for automated text and social network analysis. Available online: https://netlytic.org/home/ (accessed on 30 August 2023).
  31. Hansen, D. L., Shneiderman, B., Smith, M. A., & Himelboim, I. (2020). Analyzing social media networks with NodeXL: Insights from a connected world (2nd ed., pp. 83–84). Morgan. [Google Scholar]
  32. Hickey, D., Fessler, D. M. T., Lerman, K., & Burghardt, K. (2025). X under Musk’s leadership: Substantial hate and no reduction in inauthentic activity. PLoS ONE, 20(2), e0313293. [Google Scholar] [CrossRef]
  33. Lee, M. K., Yoon, H. Y., Smith, M., Park, H. J., & Park, H. W. (2017). Mapping a Twitter scholarly communication network: A case of the association of internet researchers’ conference. Scientometrics, 112(2), 767–797. [Google Scholar] [CrossRef]
  34. Lee, N. M., Abitbol, A., & VanDyke, M. S. (2020). Science communication meets consumer relations: An analysis of Twitter use by 23andMe. Science Communication, 42(2), 244–264. [Google Scholar] [CrossRef]
  35. Lee, S., & Kim, J. (2013). WarningBird: A near real-time detection system for suspicious URLs in Twitter stream. IEEE Transactions on Dependable and Secure Computing, 10(3), 183–195. [Google Scholar] [CrossRef]
  36. Li, G., Zhou, H., Mao, J., & Chen, S. (2019). Classifying social media Users with machine learning. Data Analysis and Knowledge Discovery, 3(8), 1–9. [Google Scholar] [CrossRef]
  37. Lundgren, L., Bex, R. T., Bauer, J., Lam, A., & Slater, E. (2024). Characterizing an online, science-based affinity space using topic modelling, diversity indices, and social network analysis. Cogent Education, 11(1), 1–12. [Google Scholar] [CrossRef]
  38. Lundgren, L., & Couch, B. (2024). Detecting differences in community conversations with epistemic network analysis. In Y. J. Kim, & Z. Swiecki (Eds.), Advances in quantitative ethnography: Sixth international conference, ICQE 2024, Philadelphia, PA, USA, November 3-7, 2024, Proceedings. Springer. [Google Scholar]
  39. Lundgren, L., & Crippen, K. J. (2024). Collections of practice as high-level activity in a digital interest-based science community. Journal of Science Education and Technology, 33, 647–667. [Google Scholar] [CrossRef]
  40. Lundgren, L., Crippen, K. J., Bauer, J. E., & Bex, R. T. (2022). Social paleontology on Twitter: A case study of topic archetypes, network composition, and structure. Social Media + Society, 8(1), 1–18. [Google Scholar] [CrossRef]
  41. Lundgren, L., Crippen, K. J., & Bex, R. T., II. (2018). Digging into the PIT: A new tool for characterizing the social paleontological community. In The proceedings of E-Learn: World conference on E-Learning in corporate, government, healthcare, and higher education 2018 (pp. 76–83). Association for the Advancement of Computing in Education (AACE). [Google Scholar]
  42. Malik, A., Heyman-Schrum, C., & Johri, A. (2019). Use of Twitter across educational settings: A review of the literature. International Journal of Educational Technology in Higher Education, 16(1), 36. [Google Scholar] [CrossRef]
  43. Mallapaty, S. (2024). ‘A place of joy’: Why scientists are joining the rush to Bluesky. Nature, 636(8041), 15–16. [Google Scholar] [CrossRef] [PubMed]
  44. Manca, S., & Ranieri, M. (2016). Facebook and the others. Potentials and obstacles of social media for teaching in higher education. Computers & Education, 95, 216–230. [Google Scholar] [CrossRef]
  45. Marcelo-Martínez, P., & Marcelo, C. (2025). Affinity spaces on a Twitter hashtag for teacher learning. Globalisation, Societies and Education, 23(2), 575–587. [Google Scholar] [CrossRef]
  46. McNeil, L., Barriault, C., Farooqi, B., Black, I., Pegoraro, A., & Merritt, T. J. S. (2024). The power of dinosaurs: Lessons learned from the sharing of #SciArt on Twitter. Journal of Science Communication, 23(05), A05. [Google Scholar] [CrossRef]
  47. Milani, E., Weitkamp, E., & Webb, P. (2020). The visual vaccine debate on twitter: A social network analysis. Media and Communication, 8(2), 364–375. [Google Scholar] [CrossRef]
  48. Min, W., Jin, D. Y., & Han, B. (2019). Transcultural fandom of the Korean wave in Latin America: Through the lens of cultural intimacy and affinity space. Media, Culture & Society, 41(5), 604–619. [Google Scholar] [CrossRef]
  49. Minnich, A., Chavoshi, N., Koutra, D., & Mueen, A. (2017). Botwalk: Efficient adaptive exploration of twitter bot networks. In J. Diesner, E. Ferrari, & G. Xu (Eds.), 2017 IEEE/ACM international conference on advances in social networks analysis and mining 2017, Sydney, Australia, July 31–August 3 (pp. 467–474). ACM. [Google Scholar] [CrossRef]
  50. Moukarzel, S., Rehm, M., Del Fresno, M., & Daly, A. J. (2020). Diffusing science through social networks: The case of breastfeeding communication on Twitter. PLoS ONE, 15(8), e0237471. [Google Scholar] [CrossRef]
  51. Na, H., & Staudt Willet, K. B. (2022). Affinity and anonymity benefitting early career teachers in the r/teachers subreddit. Journal of Research on Technology in Education, 56(4), 392–409. [Google Scholar] [CrossRef]
  52. National Academies of Sciences, Engineering, and Medicine, Division of Behavioral and Social Sciences and Education & Committee on the Science of Science Communication: A Research Agenda. (2017). Communicating science effectively: A research agenda. National Academies Press (US). [Google Scholar] [CrossRef]
  53. Neely, A. D., & Marone, V. (2016). Learning in parking lots: Affinity spaces as a framework for understanding knowledge construction in informal settings. Learning, Culture and Social Interaction, 11, 58–65. [Google Scholar] [CrossRef]
  54. Ocon, S., Lundgren, L., Bex, R. T., Bauer, J., Hughes, M., & Mills, S. (2021). Follow the fossils: Developing metrics for Instagram as a natural science communication tool (Elements of Paleontology) (pp. 1–26). Cambridge University Press. [Google Scholar] [CrossRef]
  55. Patton, M. Q. (2002). Qualitative research and evaluation methods (3rd ed.). Sage. [Google Scholar]
  56. Pedregosa, F., Varoquaux, G., Gramfort, A., Michel, V., Thirion, B., Grisel, O., Blondel, M., Prettenhofer, P., Weiss, R., Dubourg, V., Vanderplas, J., Passos, A., Cournapeau, D., Brucher, M., Perrot, M., & Duchesnay, É. (2011). Scikit-learn: Machine Learning in Python. Journal of Machine Learning Research, 12, 2825–2830. [Google Scholar]
  57. Pour-Khorshid, F. (2018). Cultivating sacred spaces: A racial affinity group approach to support critical educators of color. Teaching Education, 29(4), 318–329. [Google Scholar] [CrossRef]
  58. Prestridge, S. (2019). Categorising teachers’ use of social media for their professional learning: A self-generating professional learning paradigm. Computers & Education, 129, 143–158. [Google Scholar] [CrossRef]
  59. Richter, E., Carpenter, J. P., Meyer, A., & Richter, D. (2024). Digital social support among educators in social media: An international comparative study of tweets and replies in #teachertwitter and #twlz. Computers & Education, 221, 105137. [Google Scholar] [CrossRef]
  60. Rogoff, B., Callanan, M., Gutiérrez, K. D., & Erickson, F. (2016). The organization of informal learning. Review of Research in Education, 40(1), 356–401. [Google Scholar] [CrossRef]
  61. Rosenberg, J. M., Greenhalgh, S. P., Koehler, M. J., Hamilton, E. R., & Akcaoglu, M. (2016). An investigation of State Educational Twitter Hashtags (SETHs) as affinity spaces. E-Learning and Digital Media, 13(1–2), 24–44. [Google Scholar] [CrossRef]
  62. Shafirova, L., Cassany, D., & Bach, C. (2020). From “newbie” to professional: Identity building and literacies in an online affinity space. Learning, Culture and Social Interaction, 24, 100370. [Google Scholar] [CrossRef]
  63. Sharma, P., & Land, S. (2018). Patterns of knowledge sharing in an online affinity space for diabetes. Educational Technology Research and Development, 67(2), 247–275. [Google Scholar] [CrossRef]
  64. Smith, M., Ceni, A., Milic-Frayling, N., Shneiderman, B., Mendes Rodrigues, E., Leskovec, J., & Dunne, C. (2010). NodeXL: A free and open network overview, discovery and exploration add-in for Excel 2007/2010/2013/2016. Social Media Research Foundation. Available online: https://www.smrfoundation.org/ (accessed on 30 August 2023).
  65. Smith, M., Rainie, L., Shneiderman, B., & Himelboim, I. (2014). Mapping Twitter topic networks: From polarized crowds to community clusters. PEW Research Report. Available online: https://www.pewinternet.org/2014/02/20/mapping-twitter-topic-networks-from-polarized-crowds-to-community-clusters/ (accessed on 30 August 2023).
  66. Staudt Willet, K. B. (2019). Revisiting how and why educators use twitter: Tweet types and purposes in #edchat. Journal of Research on Technology in Education, 51(3), 273–289. [Google Scholar] [CrossRef]
  67. Staudt Willet, K. B., & Carpenter, J. P. (2020a). A tale of two subreddits: Change and continuity in teaching-related online spaces. British Journal of Educational Technology: Journal of the Council for Educational Technology, 52(2), 714–733. [Google Scholar] [CrossRef]
  68. Staudt Willet, K. B., & Carpenter, J. P. (2020b). Teachers on Reddit? Exploring contributions and interactions in four teaching-related subreddits. Journal of Research on Technology in Education, 52(2), 216–233. [Google Scholar] [CrossRef]
  69. Stokel-Walker, C. (2023). Twitter changed science—What happens now it’s in turmoil? Nature, 613(7942), 19–21. [Google Scholar] [CrossRef]
  70. Su, L. Y., Scheufele, D. A., Bell, L., Brossard, D., & Xenos, M. A. (2017). Information-sharing and community-building: Exploring the use of Twitter in science public relations. Science Communication, 39(5), 569–597. [Google Scholar] [CrossRef]
  71. Tang, Y., & Hew, K. F. (2017). Using Twitter for education: Beneficial or simply a waste of time? Computers & Education, 106, 97–118. [Google Scholar] [CrossRef]
  72. Toupin, R., Millerand, F., & Larivière, V. (2022). Who tweets climate change papers? investigating publics of research through users’ descriptions. PLoS ONE, 17(6), e0268999. [Google Scholar] [CrossRef] [PubMed]
  73. Walter, S., Lörcher, I., & Brüggemann, M. (2019). Scientific networks on Twitter: Analyzing scientists’ interactions in the climate change debate. Public Understanding of Science, 28(6), 696–712. [Google Scholar] [CrossRef]
  74. Wang, X., Judge, M., & Steg, L. (2025). Climate action on Twitter: Perceived barriers for actions and actors, and sentiments during COP26. Environmental Research Communications, 7(1), 015032. [Google Scholar] [CrossRef]
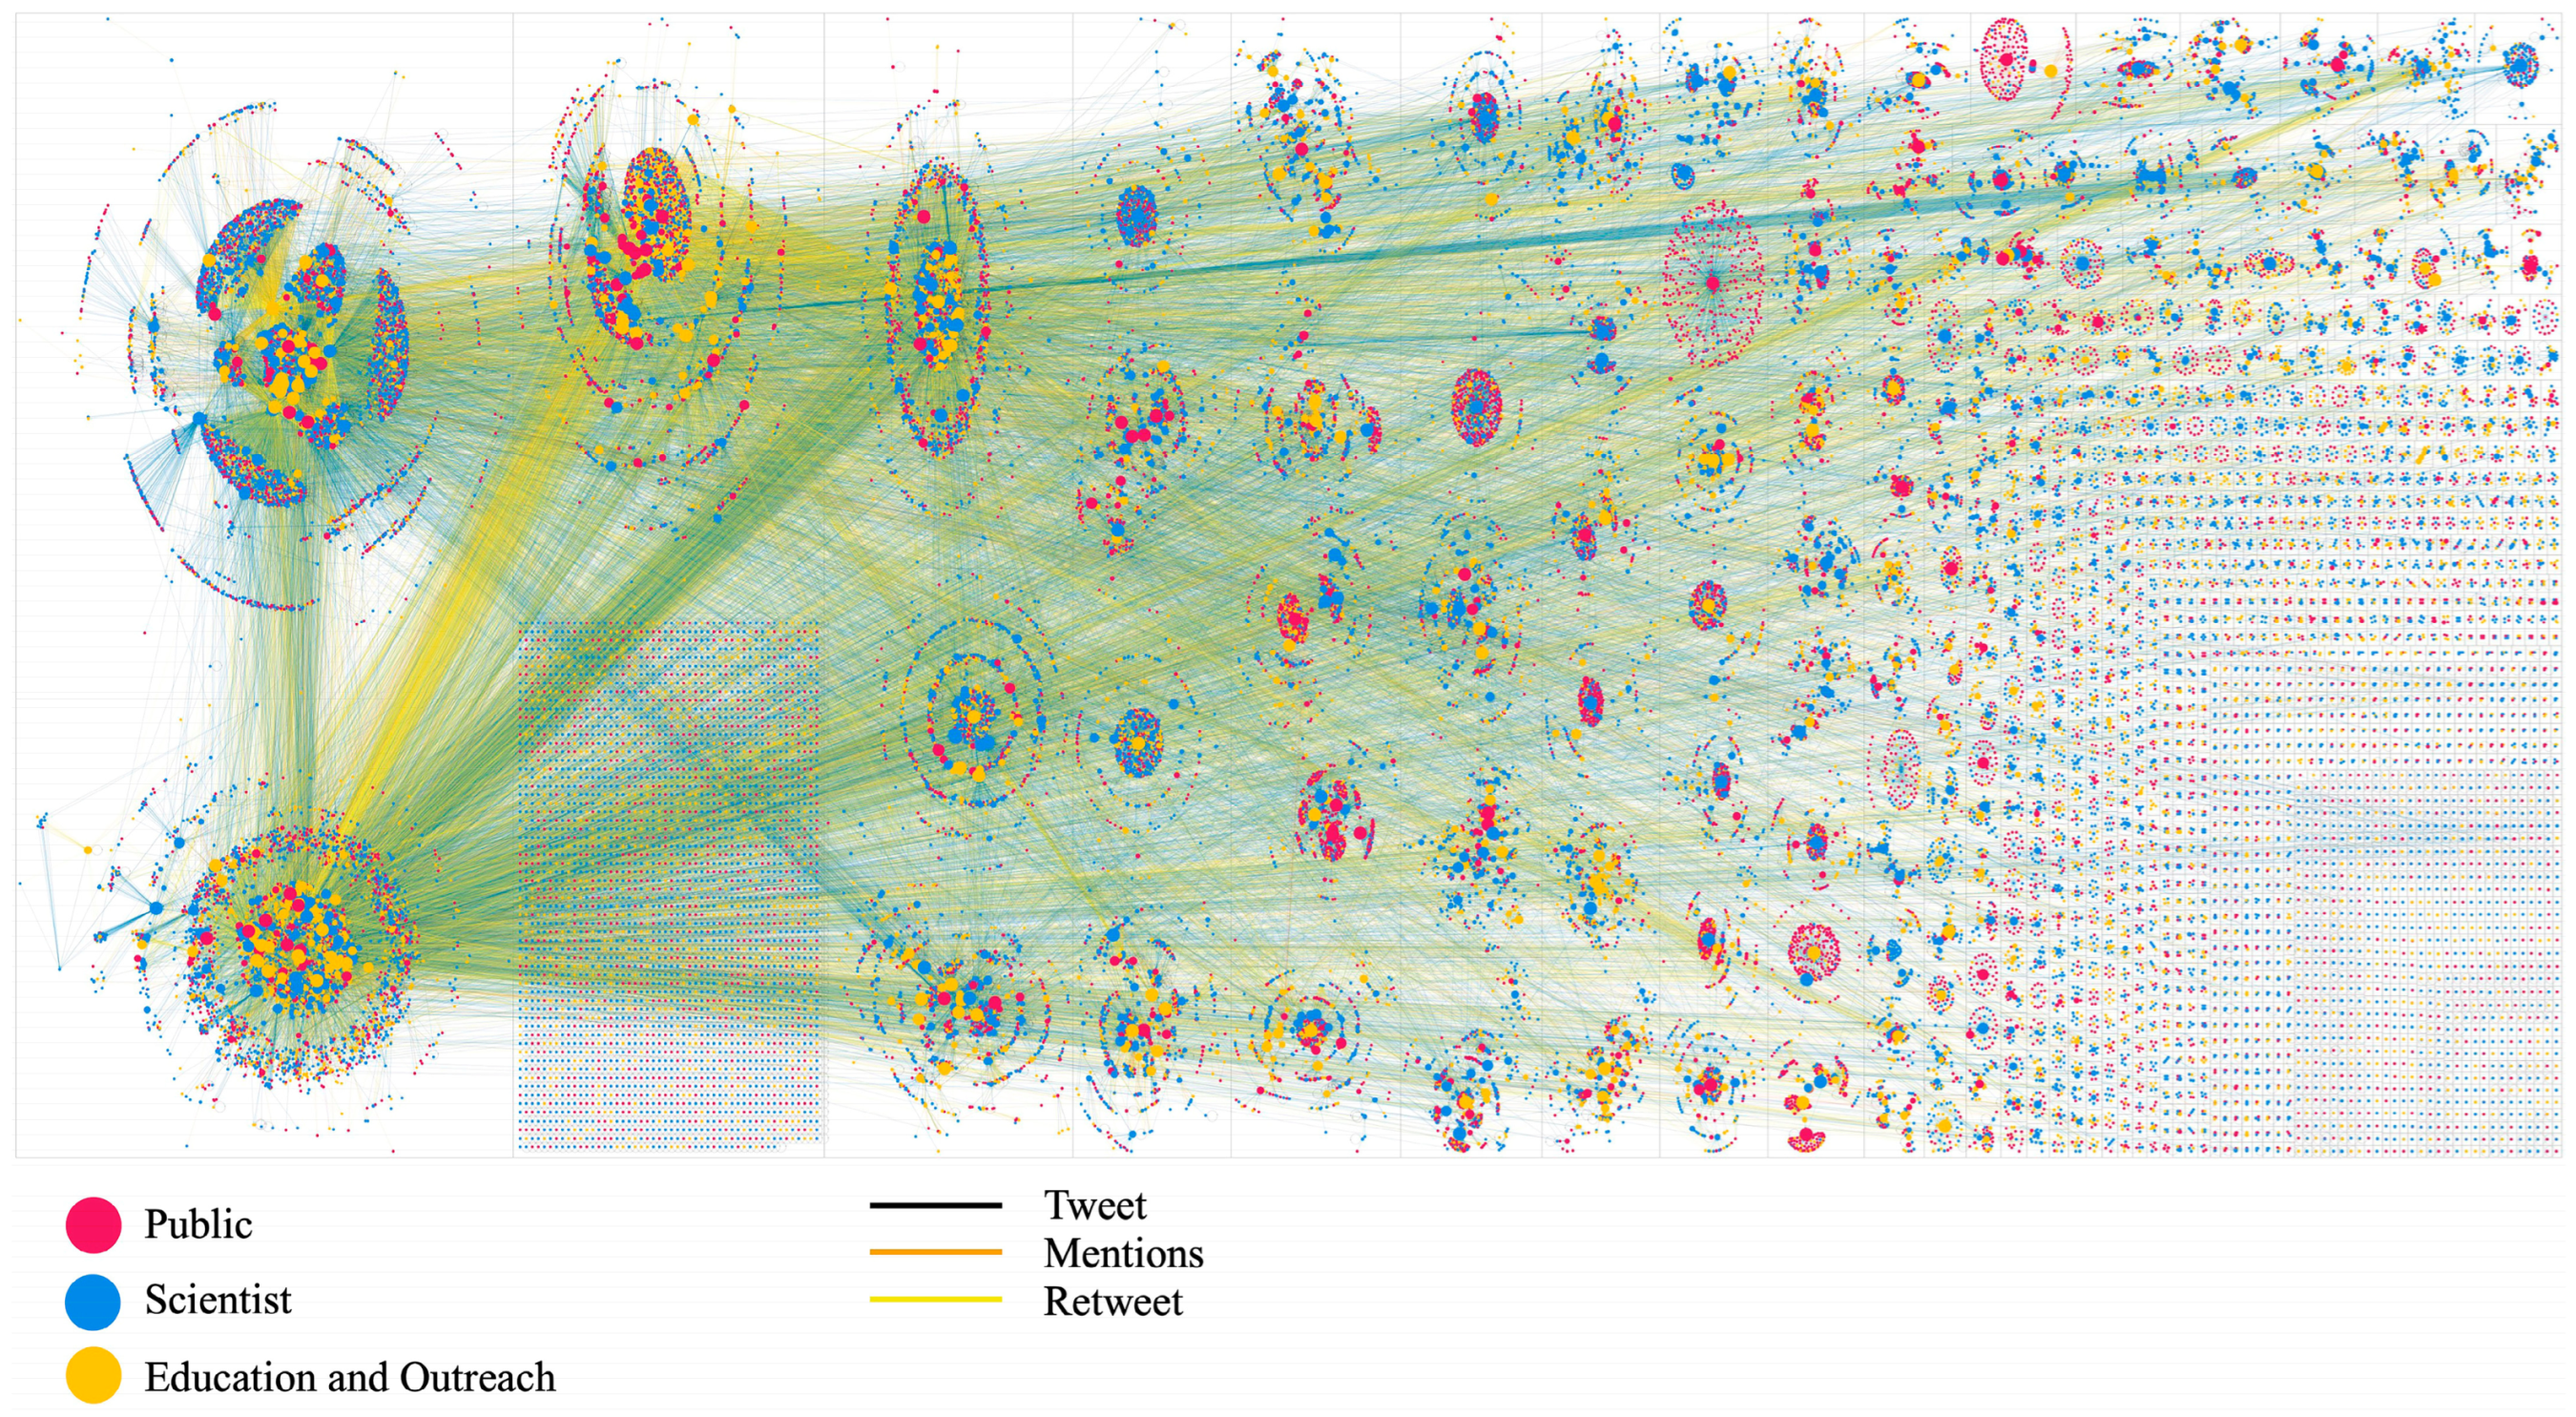
Figure 1. Social network of #ScienceTwitter, #SciComm, and #AcademicTwitter. Note: Red disks represent Public, blue disks represent Scientist, and yellow disks represent Education and Outreach. The size of users corresponds to betweenness centrality. Lines of different colors represent connection events between two people, i.e., mentions, retweets, mentions in retweets, and replies to. Self-loops, indicated by a black circular loop, represent the same user linking back to themselves, i.e., a tweet with no other interaction.
Journalmedia 06 00159 g001
Figure 2. Social network of two users. The blue and yellow arrows point to the two users’ positions in the social network, and the red arrows indicate the connections they built.
Journalmedia 06 00159 g002
Figure 3. Social network analysis of the first 50 groups. Red disks represent Public, blue disks represent Scientist, and yellow disks represent Education and Outreach. The size of users corresponds to betweenness centrality. Lines of different colors represent connection events between two people, i.e., mentions, retweets, mentions in retweets, and replies to. Self-loops, indicated by a black circular loop, represent the same user linking back to themselves, i.e., a tweet with no other interaction.
Journalmedia 06 00159 g003
Table 1. Categories within the paleontological identity taxonomy (PIT).
CategoryDefinition
Education and OutreachAny entity reference to working in a K-12 setting; as a teacher, lecturer, or in a classroom; in/as a museum or the main focus of the account is education; reference to providing some kind of advocacy or promotion of diversity, equity, and inclusion efforts or providing services to populations that might not otherwise have access to those services (i.e., outreach)
ScientistAny entity that uses a scientific domain to classify themselves, use of “-ist”; students (graduate or undergraduate) using their major; centers, institutes, and research groups are included if they indicate their audience to be other scientists.
PublicAny entity that does not meet the definition of Scientist or Education and Outreach.
Table 2. Classification model performance evaluation.
ModelCategoryPrecisionRecallF1-ScoreSupport
Logistic RegressionPublic0.850.530.6574
Scientist0.520.960.6781
Education and Outreach1.000.070.1245
AccuracyN/AN/A0.60200
Macro avg0.790.520.48200
Weighted avg0.750.600.54200
Random ForestPublic1.000.190.3274
Scientist0.441.000.6181
Education and Outreach0.000.000.0045
AccuracyN/AN/A0.48200
Macro avg0.480.400.31200
Weighted avg0.550.470.36200
Linear Support Vector MachinePublic0.740.820.7874
Scientist0.660.840.7481
Education and Outreach0.730.240.3745
AccuracyN/AN/A0.70200
Macro avg0.710.640.63200
Weighted avg0.710.700.67200
Support Vector Machine (SVC)Public1.000.220.3674
Scientist0.441.000.6181
Education and Outreach1.000.020.0445
AccuracyN/AN/A0.49200
Macro avg0.810.410.34200
Weighted avg0.770.490.39200
Multinomial Naive BayesPublic0.700.690.6974
Scientist0.560.860.6881
Education and Outreach1.000.020.0445
AccuracyN/AN/A0.61200
Macro avg0.750.530.47200
Weighted avg0.710.610.54200
Stochastic Gradient Descent (SGD)Public0.780.640.7074
Scientist0.710.800.7681
Education and Outreach0.550.600.5745
AccuracyN/AN/A0.69200
Macro avg0.680.680.68200
Weighted avg0.700.690.69200
Multilayer Perceptron (MLP)Public0.600.860.7174
Scientist0.730.650.6981
Education and Outreach0.760.360.4845
AccuracyN/AN/A0.64200
Macro avg0.700.620.63200
Weighted avg0.690.670.65200
Table 3. Connection types in the Twitter network.
TypeDefinitionAppearance in Network Diagrams
MentionsA user creates a Tweet containing another user’s name, indicated by the “@” character preceding the other user’s name.A line from the user to another mentioned user.
RetweetA user reposts or forwards a Tweet written by someone else.A line from the user to another retweeted user.
Mentions in retweetA user is mentioned in the original post when the other user retweeted the Tweet.A line from the user to the mentioned user.
Replies toA user responds to another user’s Tweet.A line from the user to the user being replied to.
TweetA user posts an original message without any other user’s information.A self-loop.
Table 4. Overall network graph metrics.
Graph MetricValue
Graph typeDirected
Vertices53,311
Total edges136,136
Number of edge types5
Mentions17,237
Tweets7976
Retweets49,134
Mentions in retweet59,941
Replies to1838
Self-loops8210
Reciprocated vertex pair ratio0.03613
Reciprocated edge ratio0.06975
Connected components4700
Single-vertex connected components3093
Maximum vertices in a connected component44,955
Maximum edges in a connected component127,042
Maximum geodesic distance (diameter)18
Average geodesic distance4.42965
Graph density0.00005
Modularity0.71383
Groups 2240
Table 5. Social network structures.
Network NameGraph
Community Clusters
Group 1Journalmedia 06 00159 i001
Group 2Journalmedia 06 00159 i002
Broadcast network
Group 29Journalmedia 06 00159 i003
Group 41Journalmedia 06 00159 i004
Isolated group
Group 4Journalmedia 06 00159 i005
Table 6. Top ten users by in-degree centrality.
RankCategoryIn-Degree CentralityOut-Degree CentralityNetwork Group
1Education and Outreach341773G1
2Scientist2984177G1
3Education and Outreach2175492G1
4Scientist8931G8
5Education and Outreach7831G10
6Scientist70233G1
7Scientist6104G18
8Scientist57712G1
9Education and Outreach575132G1
10Scientist5654G17
Table 7. Top ten users by out-degree centrality.
RankCategoryIn-Degree CentralityOut-Degree CentralityNetwork GroupNote
1Public24112G5bot
2Education and Outreach13631G2
3Public293132G2bot
4Scientist551658G3
5Education and Outreach351493G3
6Public0508G3bot
7Education and Outreach2175492G1
8Public14480G3
9Public13476G3bot
10Public105253G14
Table 8. Top ten users by betweenness centrality.
RankCategoryBetweenness CentralityIn-Degree CentralityOut-Degree CentralityNetwork GroupNote
1Public487,998,649.04424112G5bot
2Education and Outreach380,847,553.17213631G2
3Education and Outreach361,239,568.951341773G1
4Public357,300,566.203293132G2bot
5Scientist254,143,564.5222984177G1
6Education and Outreach175,013,982.0372175492G1
7Education and Outreach75,409,275.1807831G10
8Scientist72,572,046.7168931G8
9Scientist55,259,967.550551658G3
10Scientist50,486,043.8666104G18
Table 9. Top ten users by closeness centrality.
RankCategoryCloseness CentralityIn-Degree CentralityOut-Degree CentralityNetwork GroupNote
1Public0.33624112G5bot
2Public0.328293132G2bot
3Education and Outreach0.32513631G2
4Education and Outreach0.316341773G1
5Scientist0.3102984177G1
6Education and Outreach0.3042175492G1
7Scientist0.293551658G3
8Education and Outreach0.289351493G3
9Education and Outreach0.2879088G1
10Public0.28713476G3bot
Table 10. Top ten users by eigenvector centrality.
RankCategoryEigenvector CentralityIn-Degree CentralityOut-Degree CentralityNetwork GroupNote
1Public0.40124112G5bot
2Public0.331293132G2bot
3Education and Outreach0.30913631G2
4Scientist0.168551658G3
5Education and Outreach0.152351493G3
6Education and Outreach0.130341773G1
7Scientist0.1222984177G1
8Education and Outreach0.1062175492G1
9Public0.07914480G3
10Public0.07213476G3bot
Disclaimer/Publisher’s Note: The statements, opinions and data contained in all publications are solely those of the individual author(s) and contributor(s) and not of MDPI and/or the editor(s). MDPI and/or the editor(s) disclaim responsibility for any injury to people or property resulting from any ideas, methods, instructions or products referred to in the content.