
Analyzing Communication and Migration Perceptions Using Machine Learning: A Feature-Based Approach

 , , , , , and
Abstract
1. Introduction
1.1. Motivation and Contributions
- RQ1: How are different types of media coverage and social environments associated with emotional responses towards immigrants in Spain?
- RQ2: What emotional reactions are most commonly associated with media portrayals of Arab and African immigrants?
- RQ3: In what ways do individual characteristics, such as political affiliation and previous media exposure, influence shifts in attitudes towards immigrants following media consumption?
Conceptual Framework: Media Framing, Context, and Individual Traits
1.2. Related Works
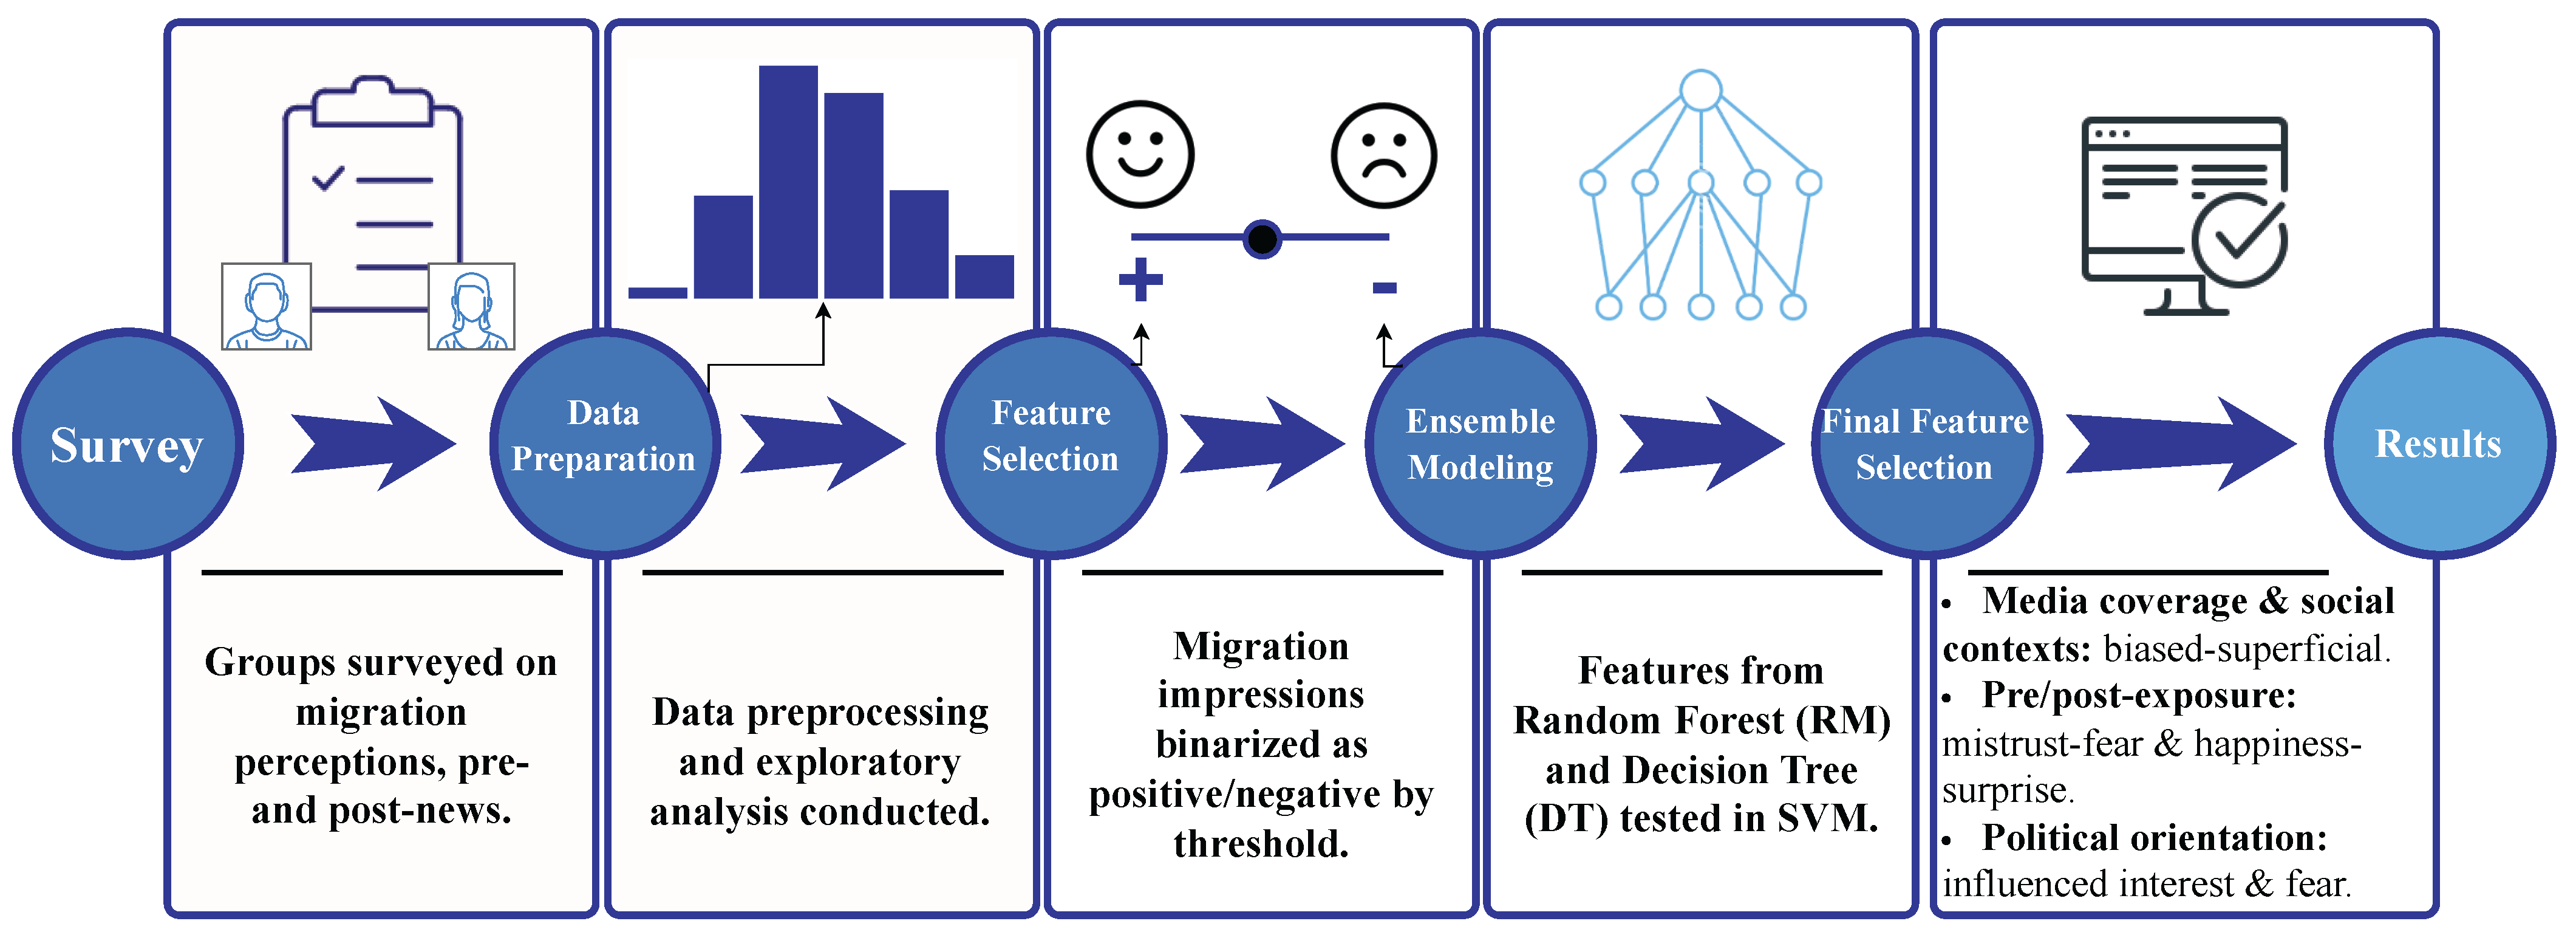
2. Methodology for Survey-Based Classification and Feature Analysis
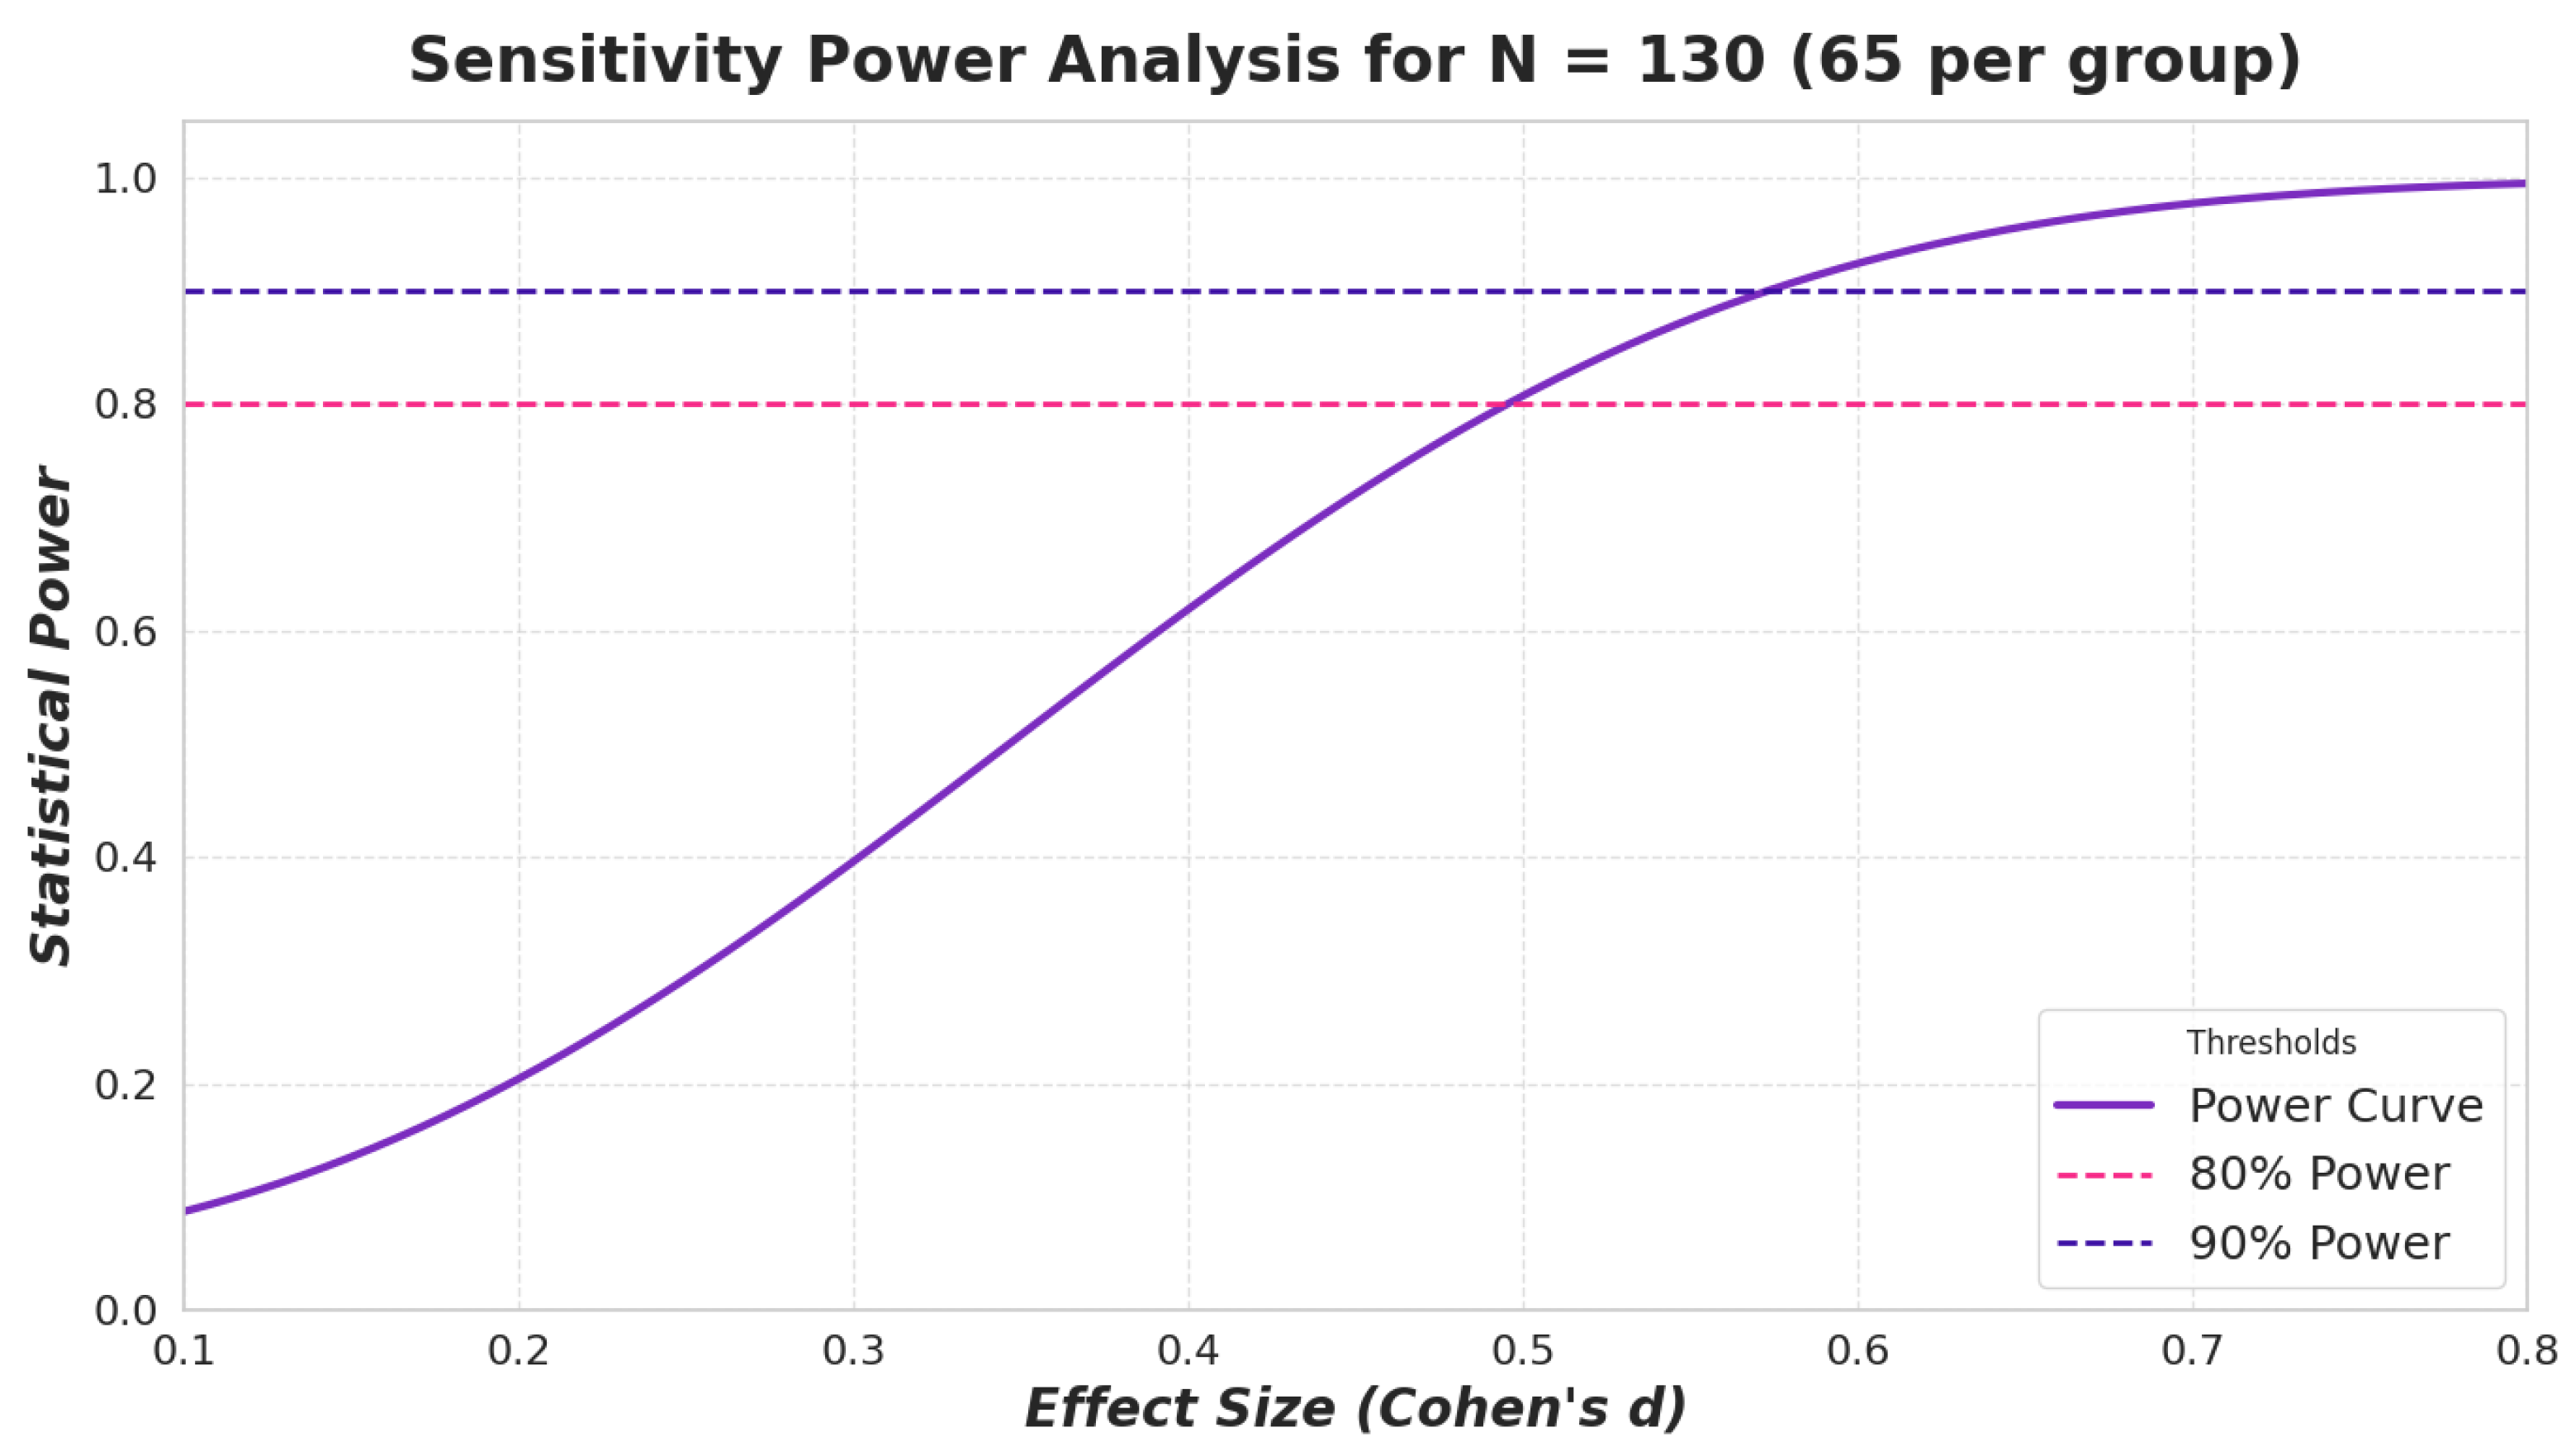
2.1. Dataset
2.2. Data Preprocessing
2.3. Exploratory Data Analysis
2.4. Feature Selection and Binarization
2.5. Classification Models
3. Results
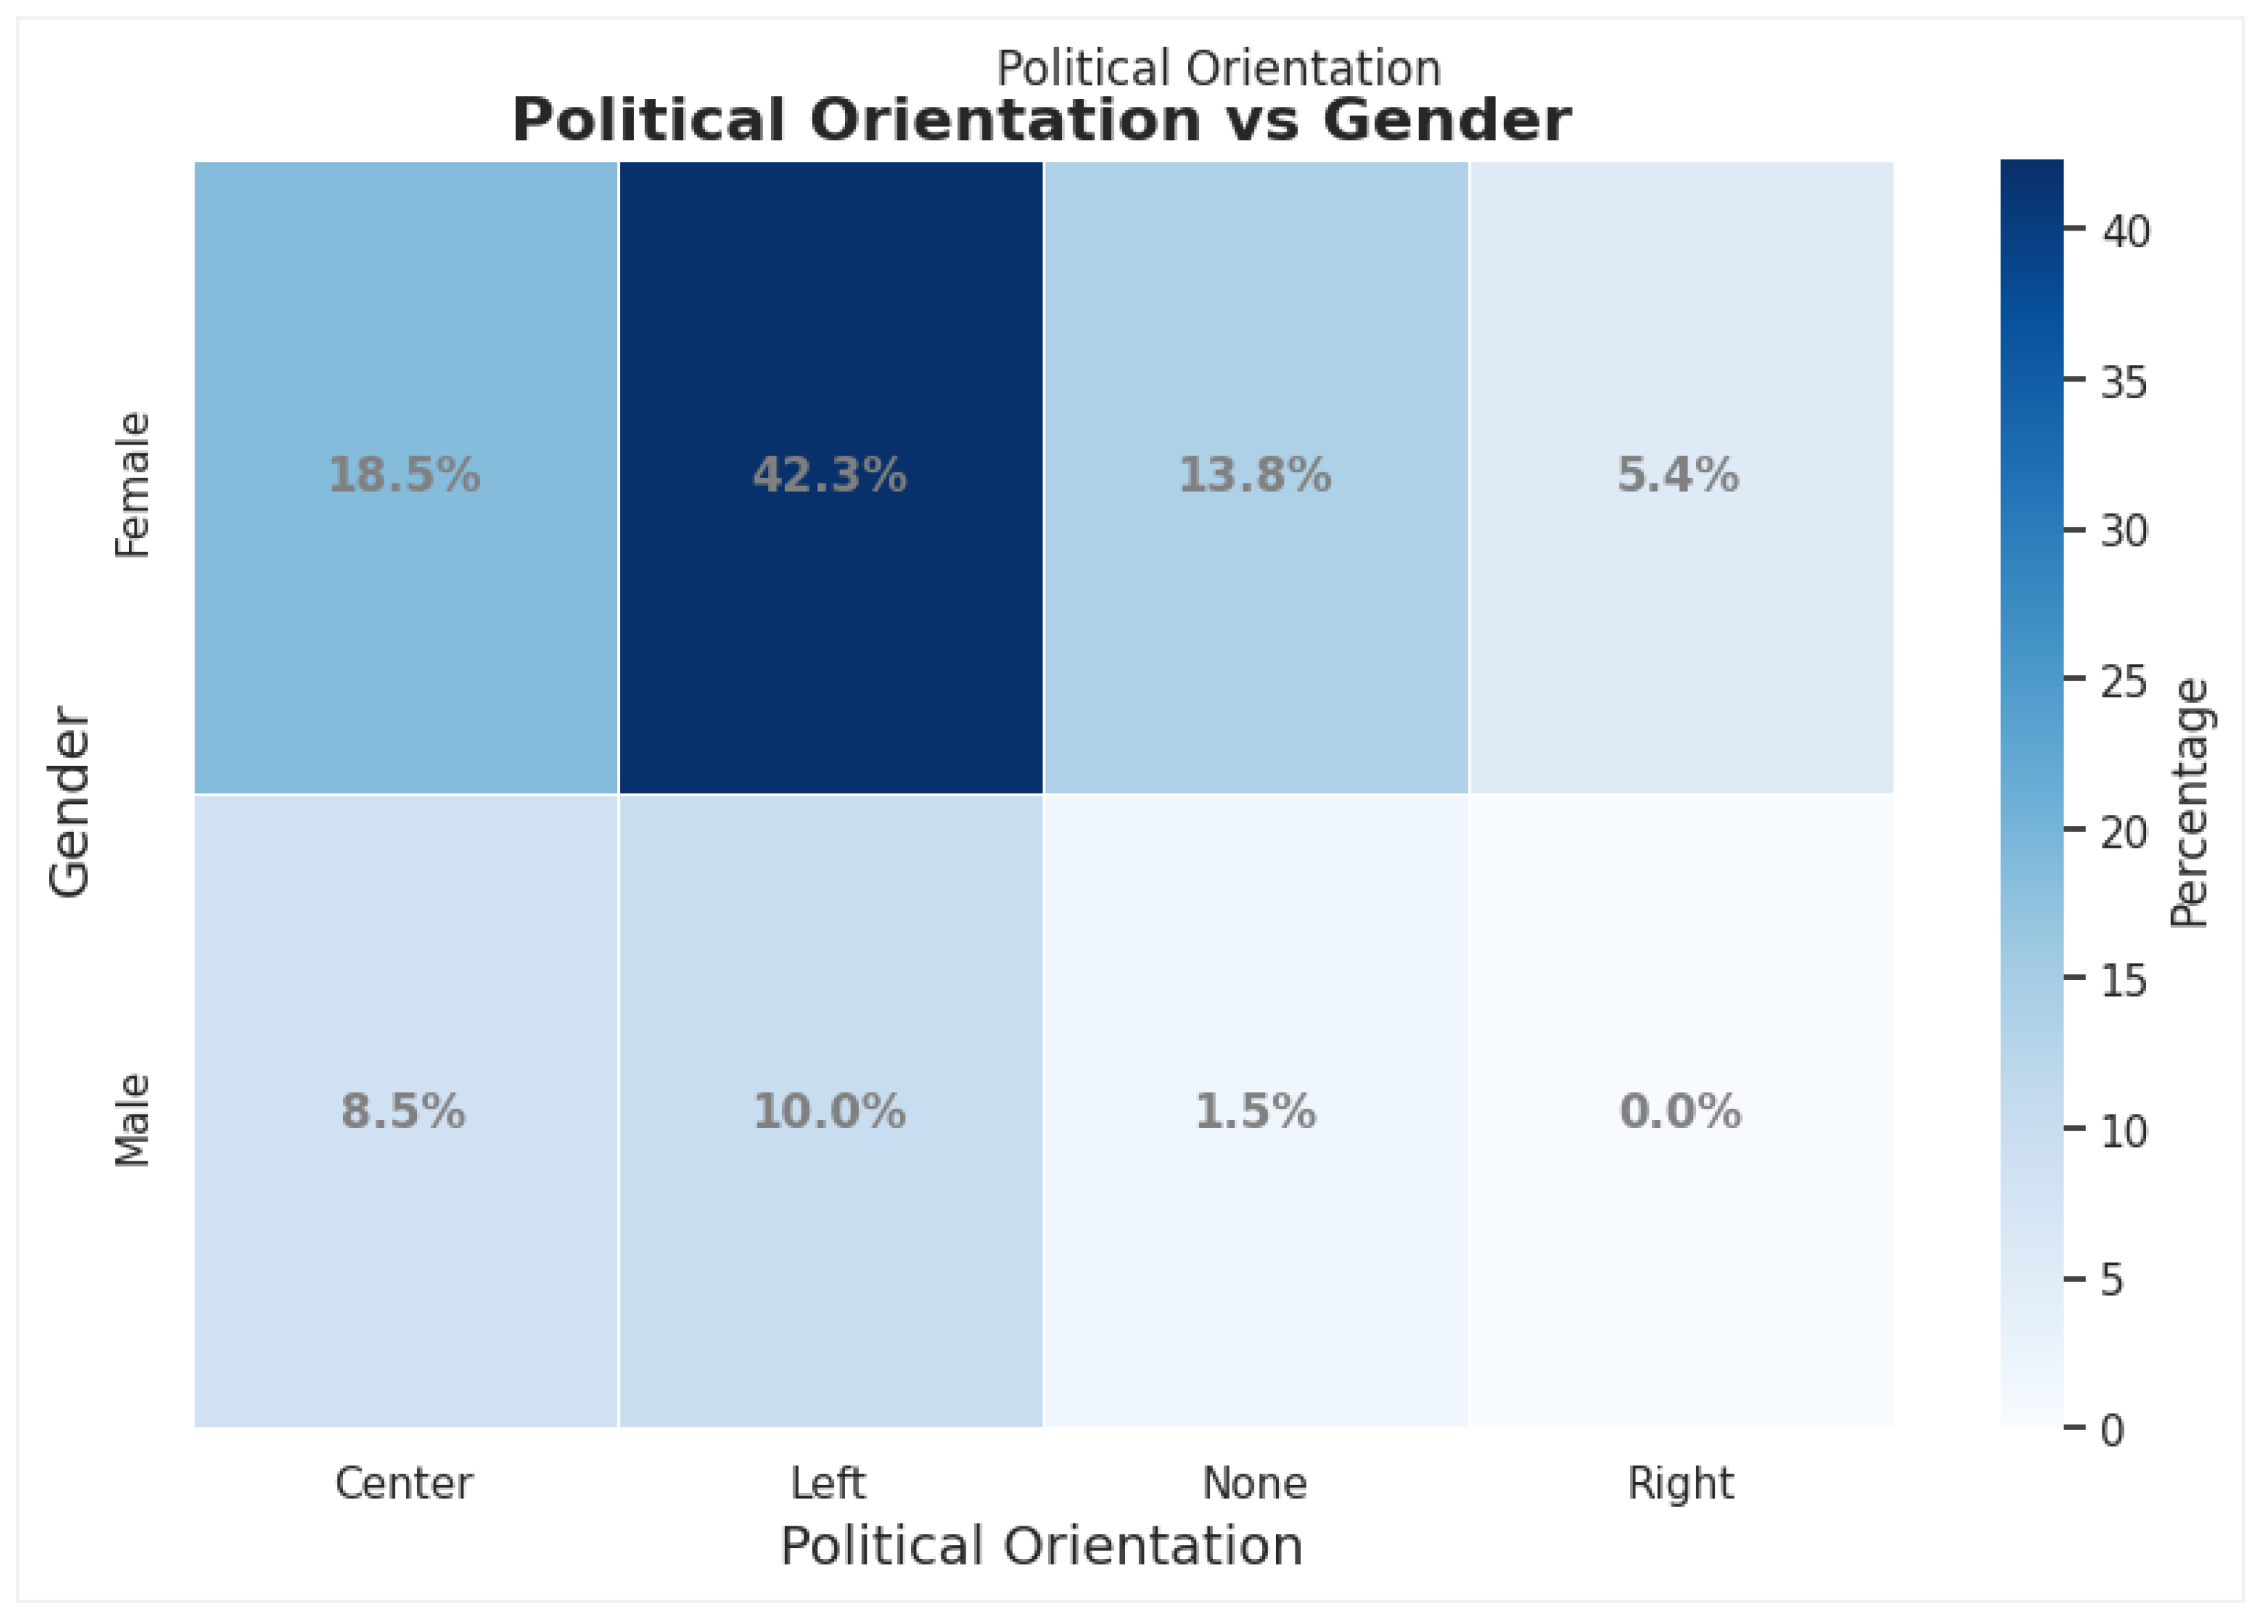
3.1. Descriptive Statistical Analysis and Graphics
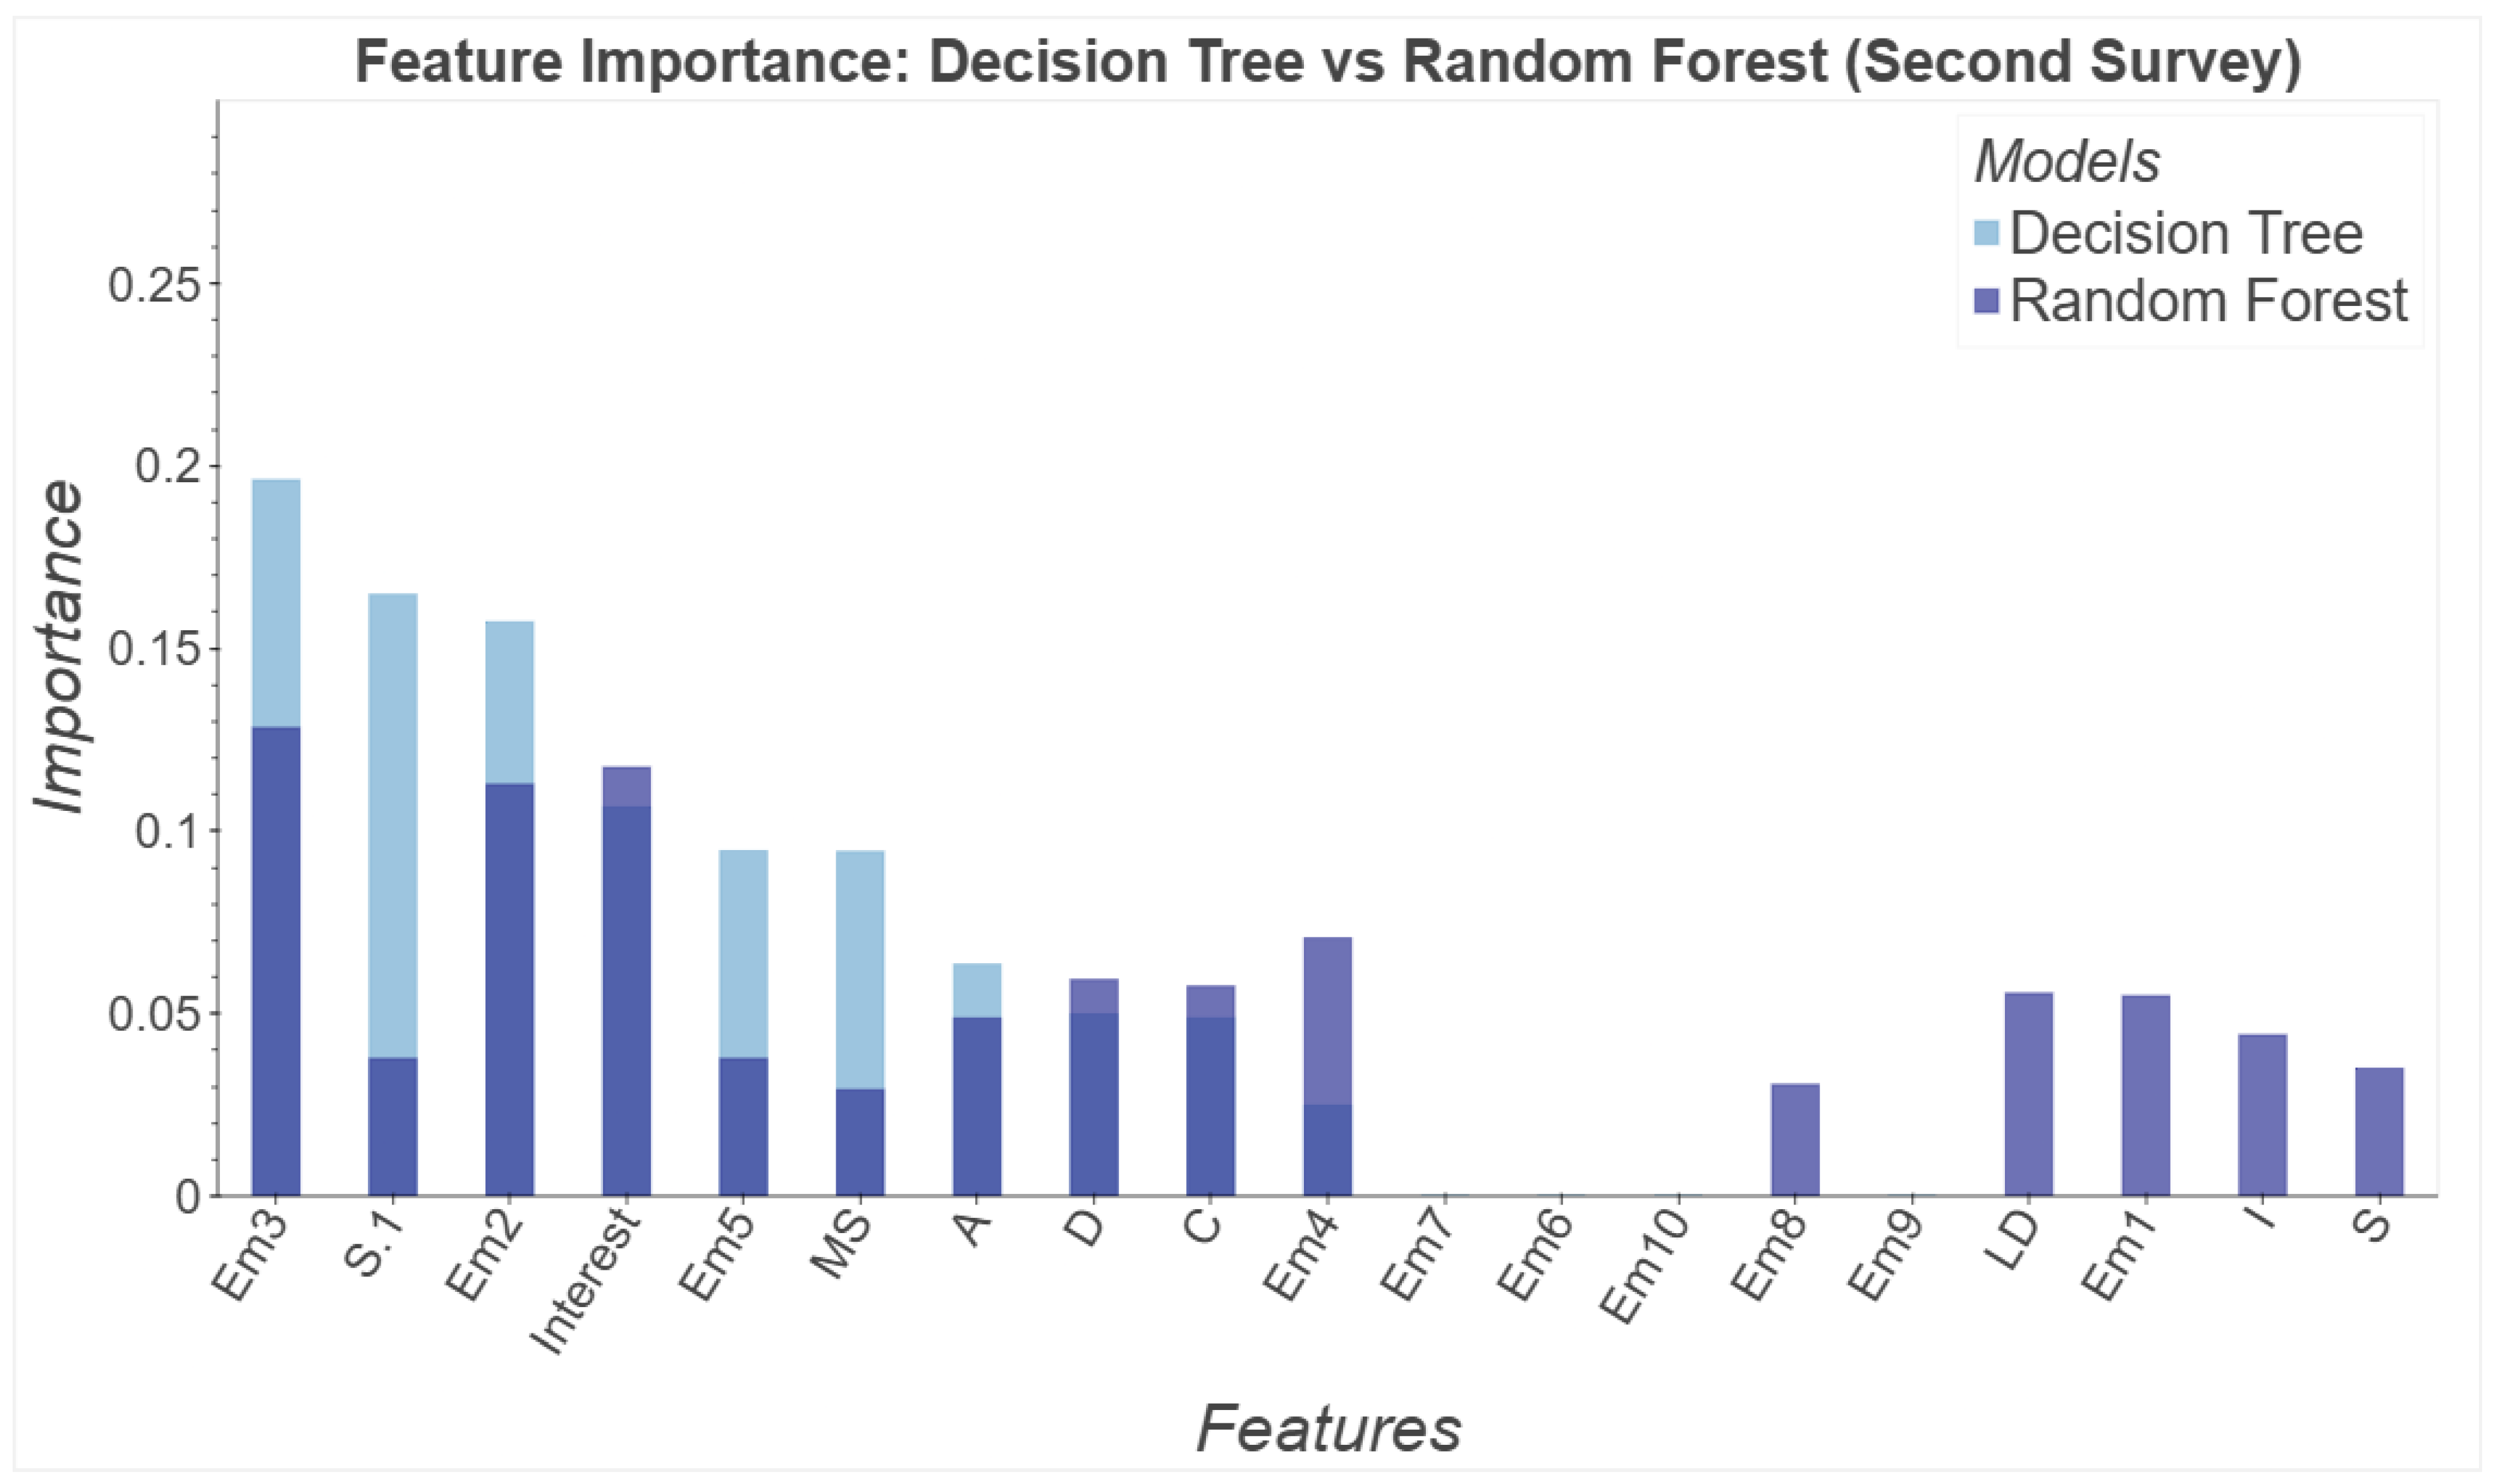
3.2. Feature Analysis in Random Forest and Decision Tree Models Based on Gini Index, Before and After Exposure
3.3. Model Performance and Metrics Obtained
3.4. Cross-Validation and Metric Stability
4. Discussion
4.1. RQ1: Impact of Media Coverage and Social Environments on Emotional Responses
4.2. RQ2: Common Emotional Reactions Related to Arab and African Immigration
4.3. RQ3: Influence of Individual Characteristics on Attitude Shifts
4.4. General Discussion and Contributions to the Field
4.5. Limitations
5. Conclusions
Author Contributions
Funding
Institutional Review Board Statement
Informed Consent Statement
Data Availability Statement
Conflicts of Interest
References
- Ali Abd Al-Hameed, K. (2022). Spearman’s correlation coefficient in statistical analysis. International Journal of Nonlinear Analysis and Applications, 13(1), 3249–3255. [Google Scholar]
- Almutiri, T., & Saeed, F. (2022). A hybrid feature selection method combining Gini index and support vector machine with recursive feature elimination for gene expression classification. International Journal of Data Mining, Modelling and Management, 14(1), 41–62. [Google Scholar] [CrossRef]
- Amsalem, E., & Zoizner, A. (2022). Real, but limited: A meta-analytic assessment of framing effects in the political domain. British Journal of Political Science, 52(1), 221–237. [Google Scholar] [CrossRef]
- Anuar, A., Mohd Hussain, N. H., & Byrd, H. (2023). Tree-based machine learning in classifying reverse migration. Mathematical Sciences and Informatics Journal (MIJ), 4(1), 49–56. [Google Scholar]
- Ardèvol-Abreu, A. (2015). Framing o teoría del encuadre en comunicación. Orígenes, desarrollo y panorama actual en España. Revista Latina de Comunicación Social, 70, 423–450. [Google Scholar] [CrossRef]
- Arjona, Á., & Checa, J. C. (2011). Españoles ante la inmigración: El papel de los medios de comunicación = Spaniards’ perspective of immigration: The role of the Media. Comunicar: Revista Científica Iberoamericana de Comunicación y Educación = Scientific Journal of Media Education, 37(2), 1–17. [Google Scholar]
- Aydar, Z. (2022). The life opportunities of young refugees: Understanding the role, function and perceptions of local Stakeholders. Social Sciences, 11(11), 527. [Google Scholar] [CrossRef]
- Becker, T., Rousseau, A.-J., Geubbelmans, M., Burzykowski, T., & Valkenborg, D. (2023). Decision trees and random forests. American Journal of Orthodontics and Dentofacial Orthopedics, 164(6), 894–897. [Google Scholar] [CrossRef] [PubMed]
- Bekteshi, V., & Bellamy, J. L. (2024). Adapting for Well-Being: Examining acculturation strategies and Mental Health among Latina immigrants. Social Sciences, 13(3), 138. [Google Scholar] [CrossRef]
- Best, K., Gilligan, J., Baroud, H., Carrico, A., Donato, K., & Mallick, B. (2022). Applying machine learning to social datasets: A study of migration in southwestern Bangladesh using random forests. Regional Environmental Change, 22(2), 52. [Google Scholar] [CrossRef]
- Best, K. B., Gilligan, J. M., Baroud, H., Carrico, A. R., Donato, K. M., Ackerly, B. A., & Mallick, B. (2021). Random forest analysis of two household surveys can identify important predictors of migration in Bangladesh. Journal of Computational Social Science, 4, 77–100. [Google Scholar] [CrossRef]
- Boateng, F. D., Pryce, D. K., & Chenane, J. L. (2021). I may be an immigrant, but I am not a criminal: Examining the association between the presence of immigrants and crime rates in Europe. Journal of International Migration and Integration, 22, 1105–1124. [Google Scholar] [CrossRef]
- Bouke, M. A., Abdullah, A., ALshatebi, S. H., Abdullah, M. T., & El Atigh, H. (2023). An intelligent DDoS attack detection tree-based model using Gini index feature selection method. Microprocessors and Microsystems, 98, 104823. [Google Scholar] [CrossRef]
- Breiman, L., Friedman, J., Olshen, R. A., & Stone, C. J. (2017). Classification and regression trees. Routledge. [Google Scholar]
- Canchen, L. (2019). Preprocessing methods and pipelines of data mining: An overview. arXiv. [Google Scholar] [CrossRef]
- Caro-Carretero, R., Fernández, M., & Valbuena, C. (2024). Advancing the knowledge of Spaniards’ attitudes towards immigration. SAGE Open, 14(3), 21582440241271912. [Google Scholar] [CrossRef]
- Casarin, R., Facchinetti, A., Sorice, D., & Tonellato, S. (2021). Decision trees and random forests. In The essentials of machine learning in finance and accounting (pp. 7–36). Routledge. [Google Scholar]
- Ceylan, M., & Hayran, C. (2021). Message framing effects on individuals’ social distancing and helping behavior during the COVID-19 pandemic. Frontiers in Psychology, 12, 579164. [Google Scholar] [CrossRef] [PubMed]
- Chasciar, V., Chasciar, D. R., Coman, C., Toderici, O. F., Toader, L., & Bularca, M. C. (2024). Post-detention migration in Romania: Reasons, challenges and solutions for preventing recidivism and ensuring reintegration into society. Societies, 14(11), 213. [Google Scholar] [CrossRef]
- Chong, D., & Druckman, J. N. (2007). Framing theory. Annu. Rev. Polit. Sci., 10(1), 103–126. [Google Scholar] [CrossRef]
- Christoph, M. (2020). Interpretable machine learning: A guide for making black box models explainable. Independently Published. [Google Scholar]
- De-Lima-Santos, M., & Ceron, W. (2022). Artificial intelligence in news media: Current perceptions and future outlook. Journalism and Media, 3(1), 13–26. [Google Scholar] [CrossRef]
- Ekman, M. (2019). Anti-immigrant sentiments and mobilization on the Internet. In SAGE handbook of media and migration (pp. 551–562). SAGE. [Google Scholar]
- Enríquez, C. G. (2019). Inmigración en España: Una nueva fase de llegadas. Análisis del Real Instituto Elcano (ARI), 28, 1. [Google Scholar]
- Entman, R. M. (1993). Framing: Toward clarification of a fractured paradigm. Journal of Communication, 43(4), 51–58. [Google Scholar] [CrossRef]
- Esses, V. M., Medianu, S., & Lawson, A. S. (2013). Uncertainty, threat, and the role of the media in promoting the dehumanization of immigrants and refugees. Journal of Social Issues, 69(3), 518–536. [Google Scholar] [CrossRef]
- European Commission. (2024). Migration and migrant population statistics. Available online: https://ec.europa.eu/eurostat/statistics-explained/index.php?title=Migration_and_migrant_population_statistics (accessed on 1 October 2024).
- Formoso-Suárez, A. M., Saiz, J., Chopra, D., & Mills, P. J. (2022). The impact of religion and social support on self-reported happiness in latin american immigrants in spain. Religions, 13(2), 122. [Google Scholar] [CrossRef]
- Galvañ, A. N., & Giménez, C. O. (2020). Discurso del odio en radio: Análisis de los editoriales de las cadenas COPE y SER tras la llegada del Aquarius a España. Miguel Hernández Communication Journal, 11(1), 117–138. [Google Scholar] [CrossRef]
- García-Cid, A., Gómez-Jacinto, L., Hombrados-Mendieta, I., Millán-Franco, M., & Moscato, G. (2020). Discrimination and psychosocial well-being of migrants in Spain: The moderating role of sense of community. Frontiers in Psychology, 11, 2235. [Google Scholar] [CrossRef] [PubMed]
- Gutiérrez-Rodríguez, N., Álvarez Lorenzo, M., & Rodrigo López, M. J. (2024). Variability of social inclusion patterns involving personal, family and social characteristics in Latino Migrant families in Spain. Child & Family Social Work, 30(3), 410–422. [Google Scholar] [CrossRef]
- Hastie, T. (2009). The elements of statistical learning: Data mining, inference, and prediction. Springer. [Google Scholar]
- Hombrados-Mendieta, I., Millán-Franco, M., Gómez-Jacinto, L., Gonzalez-Castro, F., Martos-Méndez, M. J., & García-Cid, A. (2019). Positive influences of social support on sense of community, life satisfaction and the health of immigrants in Spain. Frontiers in Psychology, 10, 2555. [Google Scholar] [CrossRef] [PubMed]
- Indelicato, A. (2022). Quantitative methods to measure attitudes toward immigrants and national identity Unpublished doctoral dissertation (Unpublished doctoral dissertation, Las Palmas, Spain, Universidad de Las Palmas de Gran Canaria).
- Indelicato, A., & Martín, J. C. (2024). The effects of three facets of national identity and other socioeconomic traits on attitudes towards immigrants. Journal of International Migration and Integration, 25(2), 645–672. [Google Scholar] [CrossRef]
- Indelicato, A., Martín, J. C., & Scuderi, R. (2022). Comparing regional attitudes toward immigrants in six European countries. Axioms, 11(7), 345. [Google Scholar] [CrossRef]
- Instituto Nacional de Estadística. (2020a). Cifras de Población (CP) a 1 de enero de 2020. Estadística de Migraciones (EM). Año 2019. Datos provisionales (Tech. Rep. No. 981). Available online: https://www.ine.es/prensa/cp_e2020_p.pdf (accessed on 2 September 2024).
- Instituto Nacional de Estadística. (2020b). Cifras de Población (CP) a 1 de julio de 2019. Estadística de Migraciones (EM). Primer semestre de 2019. Datos provisionales (Vol. 80; Tech. Rep.). Available online: https://www.ine.es/prensa/cp_j2019_p.pdf (accessed on 2 September 2024).
- Kalfeli, P. N., Angeli, C., & Frangonikolopoulos, C. (2024). Victims of a human tragedy or “Objects” of migrant smuggling? Media framing of Greece’s deadliest migrant shipwreck in Pylos’ dark waters. Journalism and Media, 5(2), 537–551. [Google Scholar] [CrossRef]
- Khai, T. S. (2025). Unsafe at home and vulnerable abroad: The struggle of forgotten myanmar asylum seekers and migrants in thailand post-coup D’état. Social Sciences, 14(4), 245. [Google Scholar] [CrossRef]
- King, R. (2019). Diverse, fragile and fragmented: The new map of European migration. Central and Eastern European Migration Review, 8(1), 9–32. [Google Scholar]
- Kline, R. B. (2023). Principles and practice of structural equation modeling. Guilford Publications. [Google Scholar]
- Kollias, A., Kountouri, F., & Kalamanti, S. (2025). Framing migration through the Crisis Era 2015–2022: A content and semantic network analysis of the Greek press. Journalism and Media, 6(1), 4. [Google Scholar] [CrossRef]
- Komendantova, N., Erokhin, D., & Albano, T. (2023). Misinformation and its impact on contested policy issues: The example of migration discourses. Societies, 13(7), 168. [Google Scholar] [CrossRef]
- Lakens, D. (2022). Sample size justification. Collabra: Psychology, 8(1), 33267. [Google Scholar] [CrossRef]
- Lu, Q., Lun, D., Dawkins-Moultin, L., Li, Y., Chen, M., Giordano, S. H., Pennebaker, J. W., Young, L., & Wang, C. (2024). Study protocol for writing to heal: A culturally based brief expressive writing intervention for Chinese immigrant breast cancer survivors. PLoS ONE, 19(9), e0309138. [Google Scholar] [CrossRef] [PubMed]
- Magazzini, T. (2021). Antidiscrimination meets integration policies: Exploring new diversity-related challenges in Europe. Social Sciences, 10(6), 221. [Google Scholar] [CrossRef]
- Manthei, G. (2020). The effects of refugee immigration on income inequality in germany: A case study. Technical Report. Diskussionsbeiträge.
- Martínez-Martínez, L., Cambra, U. C., & Espín, C. A. T. (2018). Las noticias de inmigración en redes sociales y sus efectos sobre los jóvenes. Análisis descriptivo de las investigaciones en revistas científicas desde 2012 a 2017. In Comunicación, paz y conflictos (pp. 173–182). Dykinson, S.L. [Google Scholar] [CrossRef]
- McCann, K., Sienkiewicz, M., & Zard, M. (2023). The role of media narratives in shaping public opinion toward refugees: A comparative analysis. International Organization for Migration Geneva. [Google Scholar]
- Mendelsohn, J., Budak, C., & Jurgens, D. (2021). Modeling framing in immigration discourse on social media. arXiv. [Google Scholar] [CrossRef]
- Michalovich, A. (2021). Digital media production of refugee-background youth: A scoping review. Journalism and Media, 2(1), 30–50. [Google Scholar] [CrossRef]
- Mienye, I. D., & Sun, Y. (2022). A survey of ensemble learning: Concepts, algorithms, applications, and prospects. IEEE Access, 10, 99129–99149. [Google Scholar] [CrossRef]
- Muraina, I. (2022, December 10–12). Ideal dataset splitting ratios in machine learning algorithms: General concerns for data scientists and data analysts. 7th International Mardin Artuklu Scientific Research Conference (pp. 496–504), Online. [Google Scholar]
- Negi, H. S., Dimri, S. C., Kumar, B., & Ram, M. (2024). Support vector machine and classification, kernel trick for separating of data points. Mathematics in Engineering, Science & Aerospace (MESA), 15(2), 401–409. [Google Scholar]
- Ozaydin, Y. S. (2018, October 9–11). The right of vote to syrian migrants: The rise and fragmentation of anti-migrant sentiments in Turkey. Asian Conference on Media, Communication & Film, Tokyo, Japan. [Google Scholar]
- Pérez Fructuoso, M. J., García Revilla, R., Martinez Moure, O., & Cea Moure, R. (2025). Analysis of aging in Spain: Contemporary sociological and demographic implications. Societies, 15(2), 46. [Google Scholar] [CrossRef]
- Piccialli, V., & Sciandrone, M. (2022). Nonlinear optimization and support vector machines. Annals of Operations Research, 314(1), 15–47. [Google Scholar] [CrossRef]
- Robutti, R. (2024). Comparison of the living conditions of the immigrant population in major European countries. Societies, 14(9), 179. [Google Scholar] [CrossRef]
- Roman Etxebarria, G., Berasategi Sancho, N., Idoiaga-Mondragon, N., & Legorburu Fernandez, I. (2024). Migrant perceptions of their social inclusion, social networks, and satisfaction with life in northern Spain. Societies, 14(1), 3. [Google Scholar] [CrossRef]
- Roy, A., & Chakraborty, S. (2023). Support vector machine in structural reliability analysis: A review. Reliability Engineering & System Safety, 233, 109126. [Google Scholar] [CrossRef]
- Sánchez-Holgado, P., Amores, J. J., & Blanco-Herrero, D. (2022). Online hate speech and immigration acceptance: A study of Spanish provinces. Social Sciences, 11(11), 515. [Google Scholar] [CrossRef]
- Sbaa, M., Donati, S., & Zappalà, S. (2025). Not all migrants are the same: Decent work and pre-and post-migration experiences of economic migrants. Social Sciences, 14(3), 1–23. [Google Scholar] [CrossRef]
- Tirado-Espín, A., Cuesta, U., Martínez-Martínez, L., & Almeida-Galárraga, D. (2020). Agenda-setting and immigration: Critical analysis of discourse and frequency in the media. Descriptive analysis of research in scientific journals from 2015 to 2020. RISTI-Revista Iberica de Sistemas e Tecnologias de Informacao, 2020(E35), 289–301. [Google Scholar]
- Tirado-Espín, A., Cuesta, U., Martínez-Martínez, L., & Almeida-Galárraga, D. (2021, September 1–3). Framing and immigration: New frames in media and social networks. International Conference on Communication and Applied Technologies (pp. 140–152), Bogotá, Colombia. [Google Scholar]
- Tirado-Espín, A., Cuesta, U., Martínez-Martínez, L., Ramos-Gil, Y., & Almeida-Galárraga, D. (2022). News frames in the media and social networks: Prejudices and stereotypes towards immigrants in Spain. In Marketing and smart technologies: Proceedings of icmarktech 2021 (Volume 2, pp. 363–373). Springer. [Google Scholar]
- Valkenborg, D., Rousseau, A.-J., Geubbelmans, M., & Burzykowski, T. (2023). Support vector machines. American Journal of Orthodontics and Dentofacial Orthopedics, 164(5), 754–757. [Google Scholar] [CrossRef] [PubMed]
- Verleyen, E., & Beckers, K. (2023). European refugee crisis or European migration crisis? How words matter in the news framing (2015–2020) of asylum seekers, refugees, and migrants. Journalism and Media, 4(3), 727–742. [Google Scholar] [CrossRef]
- Xie, X., Yuan, M.-J., Bai, X., Gao, W., & Zhou, Z.-H. (2023). On the Gini-impurity preservation for privacy random forests. Advances in Neural Information Processing Systems, 36, 45055–45082. [Google Scholar]
- Yang, M., Hagenauer, J., Dijst, M., & Helbich, M. (2021). Assessing the perceived changes in neighborhood physical and social environments and how they are associated with Chinese internal migrants’ mental health. BMC Public Health, 21, 1240. [Google Scholar] [CrossRef] [PubMed]
- Yemane, R., & Fernández-Reino, M. (2021). Latinos in the United States and in Spain: The impact of ethnic group stereotypes on labour market outcomes. Journal of Ethnic and Migration Studies, 47(6), 1240–1260. [Google Scholar] [CrossRef]
- Ziegler, J., & Fiedler, K. (2024). Small Sample Size and Group Homogeneity: A Crucial Ingredient to Inter-Group Bias. Personality and Social Psychology Bulletin, 1461672231223335. [Google Scholar] [CrossRef] [PubMed]


| Article | Nationalities of Immigrants | Sample Size | Age Range | Quantitative Methodology | Scales Used | Quantitative Results |
|---|---|---|---|---|---|---|
| Hombrados-Mendieta et al. (2019) | Ukraine, Romania, Bulgaria, Russia, Maghreb (Africa), Paraguay, Argentina, Colombia, Venezuela | 1131 immigrants (49% men, 51% women) | 18 to 70 years | Structural equation modeling (SEM) | GHQ-12, SWLS, social support questionnaire, SCI-2, illness questionnaire (INE) | Native friends’ support and SOC: 0.131; SOC and SWL: 0.648. SWL and mental health symptoms: −0.012; SWL and diseases: −0.171. |
| García-Cid et al. (2020) | Eastern Europe (31.6%), Africa (33.2%), Latin America (35.2%) | 1714 immigrants (48.7% M, 51.3% F) | 16 to 74 years | Multiple regression analysis (PROCESS tool in SPSS 20) | Perceived discrimination questionnaire, Brief Sense of Community Scale, GHQ-12, SWLS, social exclusion feelings scale | Perceived discrimination: SOC (−0.29), life satisfaction (−0.36); psychological distress (+0.33), social exclusion (+0.43). SOC: satisfaction (+0.44); distress (−0.27), exclusion (−0.28). Discrimination: distress (+0.275), satisfaction (−0.244), exclusion (+0.375). |
| Caro-Carretero et al. (2024) | Various origins (no specific nationalities mentioned) | 2470 in 2015, 2460 in 2016, 2455 in 2017 (Spanish participants, gender not specified) | Over 18 years | Hybrid wrapper algorithm and clustering techniques | Attitude questionnaire towards immigration, Likert scales (0–10) covering symbolic racism, aversive racism, and subtle prejudice | Symbolic racism: 38% (2015); resource competition: 20% (2017). Aversive racism persisted. Multicultural attitudes: 2015: 36.9% non, 29.2% multicultural; 2016: 10.3% non, 55.4% multicultural; 2017: 40.1% non, 19.5% multicultural. Latent racism: 38%, subtle racism: 80%. Health system abuse perception: 36% (2015), 41% (2016). Unequal scholarship access: 10.1% (2015). |
| Gutiérrez-Rodríguez et al. (2024) | Latin Americans (Venezuela, Cuba, Colombia, Argentina) | 263 migrant families (79.8% F) | Mean age 40.5 years | Cluster analysis, multinomial logistic regression | Economic Hardship Questionnaire, Medical Outcomes Study Social Support Survey (MO-SS), Neighborhood Cohesion Instrument | Inclusion profiles: High (32%), Partial (35%), Low (33%); predictors: family, social services, residence length. Unemployment: 56.7%. Income: 64.6% <500 €, 0.4% >2000 €. Difficulty: 2.9/5. Support: instrumental 3.71, emotional 3.87, affectionate 4.14. Cohesion: attraction 3.48, relationships 2.91, belonging 3.19. |
| Yang et al. (2021) | Chinese internal migrants from various provinces | 591 migrants (56% M, 44% F) | 17 to 68 years | Random forest model for nonlinear associations between neighborhood changes and mental health | GHQ-12, Neighborhood Environment Walkability Scale (NEWS-A) | GHQ-12: 6.610. Aesthetics: −0.132; safety: −0.029; accessibility: 0.174; green space: 0.240; cohesion: −0.052. Age: 31.374 years. Fair/poor health: 35%. Non-Shenzhen Hukou: 69%; inter-provincial migrants: 68%. Income: 23% ≤4000 CNY, 43% 4001–8000 CNY, 34% >8000 CNY. Employment: 77% employed, 23% unemployed. |
| Indelicato et al. (2022) | Belgium, Germany, Spain, France, the UK, and Portugal | 9066 | 24 years old or younger (7.70%) up to 75 years old or older (10.38%) | TOPSIS | 5-point Likert scale | Iberian Peninsula most open (20% immigrants in Balearic Islands); UK and Belgium most anti-immigrant (<10% in Corsica); far-right regions oppose due to economy, crime, and culture; Muslims most pro-immigrant, Catholics more negative. |
| Sánchez-Holgado et al. (2022) | No specific nationalities mentioned | 97,710 geolocated tweets | - | Twitter API and deep learning for hate speech detection; INE and CIS data on migration attitudes and foreign population | Hate speech scale (0–1); proportion of foreign citizens (0–1); migration attitude scale (CIS 2017, recoded 0–1 from Likert 1–4) | Analyzed 97,710 geolocated tweets (2015–2020); no significant correlation between foreign population, hate speech, or immigration attitudes. |
| Formoso-Suárez et al. (2022) | Latin American immigrants, mainly Venezuelans, plus others from 13 countries. | 206 | 18 to 74 years | Correlational design with convenience sampling; data collected via Google Forms and analyzed in SPSS V.25 | EAS for social support, R-COPE for religious coping, DUREL for religiosity, and an acculturation questionnaire | Happiness correlated positively with religiosity, social support, and positive coping; negatively with negative coping. Regression showed these factors, plus gender, predicted happiness, with men explaining 1% more variance. |
| Roman Etxebarria et al. (2024) | Latin America (48.3%), Eastern Europe (24.1%), Africa (20.9%), Asia (3.8%), and Central Europe (2.9%). | 373 | 18 to 65 years | Quantitative study using ANOVAs, correlations, and SPSS 24 to analyze inclusion, life satisfaction, and social networks by demographics | Used Woosnam’s Inclusion Scale, SWLS (5 items) for life satisfaction, and LSNS for social networks. Reliability: = 0.693–0.914 | Women had higher life satisfaction and social network scores. Younger migrants (18–35) scored higher in friendship networks. Central Europeans had the highest scores, while African and Asian migrants had the lowest. Broad social networks correlated with life satisfaction (r = 0.334) and inclusion (r = 0.564). |
| Indelicato (2022) | Data came from the ESS, ISSP, Eurostat, Economist Intelligence Unit, and electoral records. Immigrant nationalities were unspecified, with comparisons based on country-specific factors. | - | - | The study applied DEA to examine indicators like national identity and migration, and used fuzzy set theory (FST) in an effort to shed light on Likert-scale responses for analysis | Likert scales, converted to fuzzy numbers | Most accepting were northern and eastern Europe as well as the Iberian Peninsula. Young, wealthy, non-Catholic, and foreign dwellers were more tolerant, and the capital areas and vacation islands had higher ATI scores. In the US and Russia, stricter standards of identity were detected, and leftists were more supportive of civic as opposed to ethnic national identity. |
| Question | Variable | Description | Scale/Observation |
|---|---|---|---|
| Survey 1: Evaluation of Arab and African Migration | |||
| – | ID | Unique identifier for each participant. | Categorical |
| – | Edad | Age group (1: 18–22, 2: 23–27, 3: 28–31, 4: 32+). | Ordinal |
| – | Sexo | Gender (1: Male, 2: Female). | Binary |
| – | Nacionalidad | Nationality (1: Spanish, 2: Spanish and other, 3: Other). | Categorical |
| P1. General evaluation | (P1) | Overall perception of Arab and African migration. | Likert 1–7 |
| P2. Respond to the following statements: | A1 | Immigrants take jobs Spaniards don’t want. | Likert 1–7 |
| A2 | Immigrants are still needed in Spain. | Likert 1–7 | |
| A3 | Immigration may increase crime. | Likert 1–7 | |
| A4 | Society cannot function without immigrants. | Likert 1–7 | |
| A5 | Immigration is linked to insecurity. | Likert 1–7 | |
| A6 | Immigration can benefit the economy. | Likert 1–7 | |
| A7 | Immigrants cause problems. | Likert 1–7 | |
| A8 | Immigrants contribute to national development. | Likert 1–7 | |
| P3. What emotions do immigrants provoke in you? | E1 | Interest. | Likert 1–7 |
| E2 | Joy. | Likert 1–7 | |
| E3 | Surprise. | Likert 1–7 | |
| E4 | Sadness. | Likert 1–7 | |
| E5 | Anger. | Likert 1–7 | |
| E6 | Disgust. | Likert 1–7 | |
| E7 | Contempt. | Likert 1–7 | |
| P4. Imagine the following scenarios: | (P4.1) | Living near many Arab or African immigrants. | Likert 1–7 |
| (P4.2) | Working/studying with Arab or African immigrants. | Likert 1–7 | |
| P5. Attacks by immigrants | (P5) | Concern about immigrant attacks on Spaniards. | Likert 1–7 |
| P6. Attacks by Spaniards | (P6) | Concern about Spaniard attacks on immigrants. | Likert 1–7 |
| P7. Sources of opinion | CA | Friends. | Binary (1 = selected) |
| CF | Family. | Binary (1 = selected) | |
| TV | Television. | Binary (1 = selected) | |
| PR | Radio. | Binary (1 = selected) | |
| R | Press or magazines. | Binary (1 = selected) | |
| I | Internet. | Binary (1 = selected) | |
| CT | School or workplace. | Binary (1 = selected) | |
| Otro | Other source. | Binary (1 = selected) | |
| NR | No response. | Binary (1 = selected) | |
| NC | Don’t know. | Binary (1 = selected) | |
| P8. Media attention | TV.1 | TV attention to migration. | Likert 1–7 |
| PD | Digital press attention. | Likert 1–7 | |
| RS | Social media attention. | Likert 1–7 | |
| P9. Media portrayal | TV.2 | TV image of immigrants. | Likert 1–7 |
| PD.1 | Digital press image. | Likert 1–7 | |
| RS.1 | Social media image. | Likert 1–7 | |
| P10. Time spent on media | (P10) | Time spent on media. | Likert 1–7 |
| P11. Political orientation | I.1 | Left-wing. | Binary (1 = selected) |
| C.1 | Center. | Binary (1 = selected) | |
| D | Right-wing. | Binary (1 = selected) | |
| P12. Voting | (P12) | Political party voted for in the last election. | Open-ended |
| Survey 2: Reaction to Migration News | |||
| – | ID | Unique identifier for each participant. | Categorical |
| P1. What emotions did the news provoke in you? | Em1 | Fear. | Likert 1–7 |
| Em2 | Admiration. | Likert 1–7 | |
| Em3 | Distrust. | Likert 1–7 | |
| Em4 | Insecurity. | Likert 1–7 | |
| Em5 | Sympathy. | Likert 1–7 | |
| Em6 | Discomfort. | Likert 1–7 | |
| Em7 | Indifference. | Likert 1–7 | |
| Em8 | Shame. | Likert 1–7 | |
| Em9 | Contempt. | Likert 1–7 | |
| Em10 | Guilt. | Likert 1–7 | |
| P2. Rate your interest in the news | INTERÉS NOTICIA | Overall interest. | Likert 1–7 |
| P3. How did you perceive the news? | C | Confusing. | Likert 1–7 |
| LD | Difficult to read. | Likert 1–7 | |
| S | Superficial. | Likert 1–7 | |
| S.1 | Biased. | Likert 1–7 | |
| MS | Too simple. | Likert 1–7 | |
| D | Decontextualized. | Likert 1–7 | |
| I | Imprecise. | Likert 1–7 | |
| A | Boring. | Likert 1–7 | |
| Model | Features | Class | Acc. | Prec. | Recall | F1 | Bal. Acc. | Macro F1 | Cohen’s |
|---|---|---|---|---|---|---|---|---|---|
| First Survey | |||||||||
| SVM (DT) | A6, A3, A7, CA, C | Negativa | 0.8846 | 1.00 | 0.81 | 0.90 | 0.9062 | 0.8831 | 0.7692 |
| SVM (DT) | A6, A3, A7, CA, C | Positiva | 0.8846 | 0.77 | 1.00 | 0.87 | 0.9062 | 0.8831 | 0.7692 |
| SVM (RF) | A6, A3, A7, E2, P5, E1, A5, E3, E4, A4, A8, E7, P6, E5 | Negativa | 0.8462 | 1.00 | 0.75 | 0.86 | 0.8750 | 0.8452 | 0.6977 |
| SVM (RF) | A6, A3, A7, E2, P5, E1, A5, E3, E4, A4, A8, E7, P6, E5 | Positiva | 0.8462 | 0.71 | 1.00 | 0.83 | 0.8750 | 0.8452 | 0.6977 |
| Second Survey | |||||||||
| SVM (DT) | Em3, P2, A, C | Negativa | 0.8077 | 0.86 | 0.80 | 0.83 | 0.8091 | 0.8051 | 0.6108 |
| SVM (DT) | Em3, P2, A, C | Positiva | 0.8077 | 0.75 | 0.82 | 0.78 | 0.8091 | 0.8051 | 0.6108 |
| SVM (RF) | Em3, Em2, D, C, LD, S1, S | Negativa | 0.9231 | 0.93 | 0.93 | 0.93 | 0.9212 | 0.9212 | 0.8424 |
| SVM (RF) | Em3, Em2, D, C, LD, S1, S | Positiva | 0.9231 | 0.91 | 0.91 | 0.91 | 0.9212 | 0.9212 | 0.8424 |
| Dataset | Model | Accuracy | Balanced Acc. | Macro F1 | Kappa | ROC AUC |
|---|---|---|---|---|---|---|
| Pre-exposure | Decision Tree | 0.6231 ± 0.0510 | 0.6250 ± 0.0509 | 0.6129 ± 0.0678 | 0.2488 ± 0.1018 | 0.7049 ± 0.0425 |
| Random Forest | 0.7154 ± 0.0713 | 0.7179 ± 0.0693 | 0.7140 ± 0.0719 | 0.4340 ± 0.1400 | 0.7902 ± 0.0554 | |
| SVM (DT Features) | 0.7385 ± 0.1341 | 0.7383 ± 0.1340 | 0.7362 ± 0.1349 | 0.4766 ± 0.2679 | 0.8295 ± 0.0970 | |
| SVM (RF Features) | 0.6462 ± 0.0662 | 0.6474 ± 0.0649 | 0.6452 ± 0.0660 | 0.2943 ± 0.1303 | 0.7345 ± 0.0576 | |
| Post-exposure | Decision Tree | 0.6126 ± 0.0399 | 0.6141 ± 0.0410 | 0.6092 ± 0.0396 | 0.2273 ± 0.0813 | 0.6863 ± 0.0477 |
| Random Forest | 0.6831 ± 0.0869 | 0.6833 ± 0.0873 | 0.6820 ± 0.0874 | 0.3663 ± 0.1741 | 0.7340 ± 0.0625 | |
| SVM (DT Features) | 0.6742 ± 0.0478 | 0.6737 ± 0.0482 | 0.6670 ± 0.0494 | 0.3476 ± 0.0962 | 0.7016 ± 0.0489 | |
| SVM (RF Features) | 0.6889 ± 0.0821 | 0.6891 ± 0.0818 | 0.6867 ± 0.0814 | 0.3781 ± 0.1638 | 0.7655 ± 0.0861 |
| Article | Sample size | Quantitative Methodology | Quantitative Results |
|---|---|---|---|
| Our study | 130 surveys | Ensemble learning: DT, RF with SVM | DT-RF key features before exposure: A6, A3, A7; after: Em3, Em2, P2, D, C. DT accuracy: 88.46%→80.77%, RF: 84.62%→92.31%. Key coefficients: DT (Em3 −0.4168, A −0.4260, P2 0.3056, C 0.1760), RF (Em3 −0.4896, LD −0.2781, Em2 0.5531, S.1 0.3316). |
| Hombrados-Mendieta et al. (2019) | 1131 immigrants | Structural equation modeling (SEM) | SOC and SWL: 0.648; SWL and diseases: −0.171; SWL and mental health symptoms: −0.012. |
| García-Cid et al. (2020) | 1714 immigrants | Multiple regression analysis (PROCESS tool in SPSS 20) | SOC-Sat: 0.44; SOC-Dist: −0.27; SOC-Excl: −0.28; Sat-Dist: −0.36; Disc-Dist: +0.28; Disc-Sat: −0.24; Disc-Excl: +0.38. |
| Caro-Carretero et al. (2024) | 2470 in 2015, 2460 in 2016, 2455 in 2017 | Hybrid wrapper algorithm and clustering techniques | Symbolic racism: 38% (2015); resource competition: 20% (2017); multicultural attitudes: 2015: 36.9% non, 29.2% multicultural; 2017: 40.1% non, 19.5% multicultural; latent racism: 38%; subtle racism: 80%; health abuse: 36% (2015), 41% (2016); unequal scholarship: 10.1%. |
| Gutiérrez-Rodríguez et al. (2024) | 263 migrant families | Cluster analysis, multinomial logistic regression | Inclusion: high 32%, partial 35%, low 33%; predictors: family, services, residence. Unemployment 56.7%, income: 64.6% <500 €. Difficulty: 2.9/5. Support: instrumental 3.71, emotional 3.87, affectionate 4.14. Cohesion: attraction 3.48, relationships 2.91. |
| Indelicato et al. (2022) | 9066 surveys | TOPSIS | Iberian Peninsula most open (20% immigrants in Balearic Islands); UK and Belgium most anti-immigrant (<10% in Corsica); far-right oppose due to economy, crime, culture; Muslims pro-immigrant, Catholics more negative. |
| Sánchez-Holgado et al. (2022) | 97,710 geolocated tweets | Twitter API and deep learning | No correlation between foreign population, hate speech, or immigration in 97K tweets (2015–2020). |
| Formoso-Suárez et al. (2022) | 206 surveys | Correlational design with convenience sampling | Happiness linked to religiosity, support, and coping; gender explained 1% more variance. |
| Roman Etxebarria et al. (2024) | 373 surveys | ANOVAs, correlations, and SPSS 24 | Women had higher life satisfaction and social networks; younger migrants had larger friendship networks; Central Europeans scored highest, others lowest; social networks linked to life satisfaction and inclusion. |
| Indelicato (2022) | - | DEA and fuzzy set theory (FST) | Northern, eastern Europe, Iberian Peninsula most tolerant; youth, high-income, non-Catholics, foreigners more open; capital regions, tourist islands higher ATI; US, Russia stricter on identity; left-wing favored civic identity |
Disclaimer/Publisher’s Note: The statements, opinions and data contained in all publications are solely those of the individual author(s) and contributor(s) and not of MDPI and/or the editor(s). MDPI and/or the editor(s) disclaim responsibility for any injury to people or property resulting from any ideas, methods, instructions or products referred to in the content. |
© 2025 by the authors. Licensee MDPI, Basel, Switzerland. This article is an open access article distributed under the terms and conditions of the Creative Commons Attribution (CC BY) license (https://creativecommons.org/licenses/by/4.0/).
Share and Cite
Tirado-Espín, A.; Marcillo-Vera, A.; Cáceres-Benítez, K.; Almeida-Galárraga, D.; Orozco Garzón, N.; Moreno Guaicha, J.A.; Carvajal Mora, H. Analyzing Communication and Migration Perceptions Using Machine Learning: A Feature-Based Approach. Journal. Media 2025, 6, 112. https://doi.org/10.3390/journalmedia6030112
Tirado-Espín A, Marcillo-Vera A, Cáceres-Benítez K, Almeida-Galárraga D, Orozco Garzón N, Moreno Guaicha JA, Carvajal Mora H. Analyzing Communication and Migration Perceptions Using Machine Learning: A Feature-Based Approach. Journalism and Media. 2025; 6(3):112. https://doi.org/10.3390/journalmedia6030112
Chicago/Turabian StyleTirado-Espín, Andrés, Ana Marcillo-Vera, Karen Cáceres-Benítez, Diego Almeida-Galárraga, Nathaly Orozco Garzón, Jefferson Alexander Moreno Guaicha, and Henry Carvajal Mora. 2025. "Analyzing Communication and Migration Perceptions Using Machine Learning: A Feature-Based Approach" Journalism and Media 6, no. 3: 112. https://doi.org/10.3390/journalmedia6030112
APA StyleTirado-Espín, A., Marcillo-Vera, A., Cáceres-Benítez, K., Almeida-Galárraga, D., Orozco Garzón, N., Moreno Guaicha, J. A., & Carvajal Mora, H. (2025). Analyzing Communication and Migration Perceptions Using Machine Learning: A Feature-Based Approach. Journalism and Media, 6(3), 112. https://doi.org/10.3390/journalmedia6030112