
Influence of Level of Detail (LOD) in Hydraulic Model Geometry with Demand Allocation by Voronoi Polygon Method on Chosen Parameters †


Abstract
:1. Introduction
2. Methodology
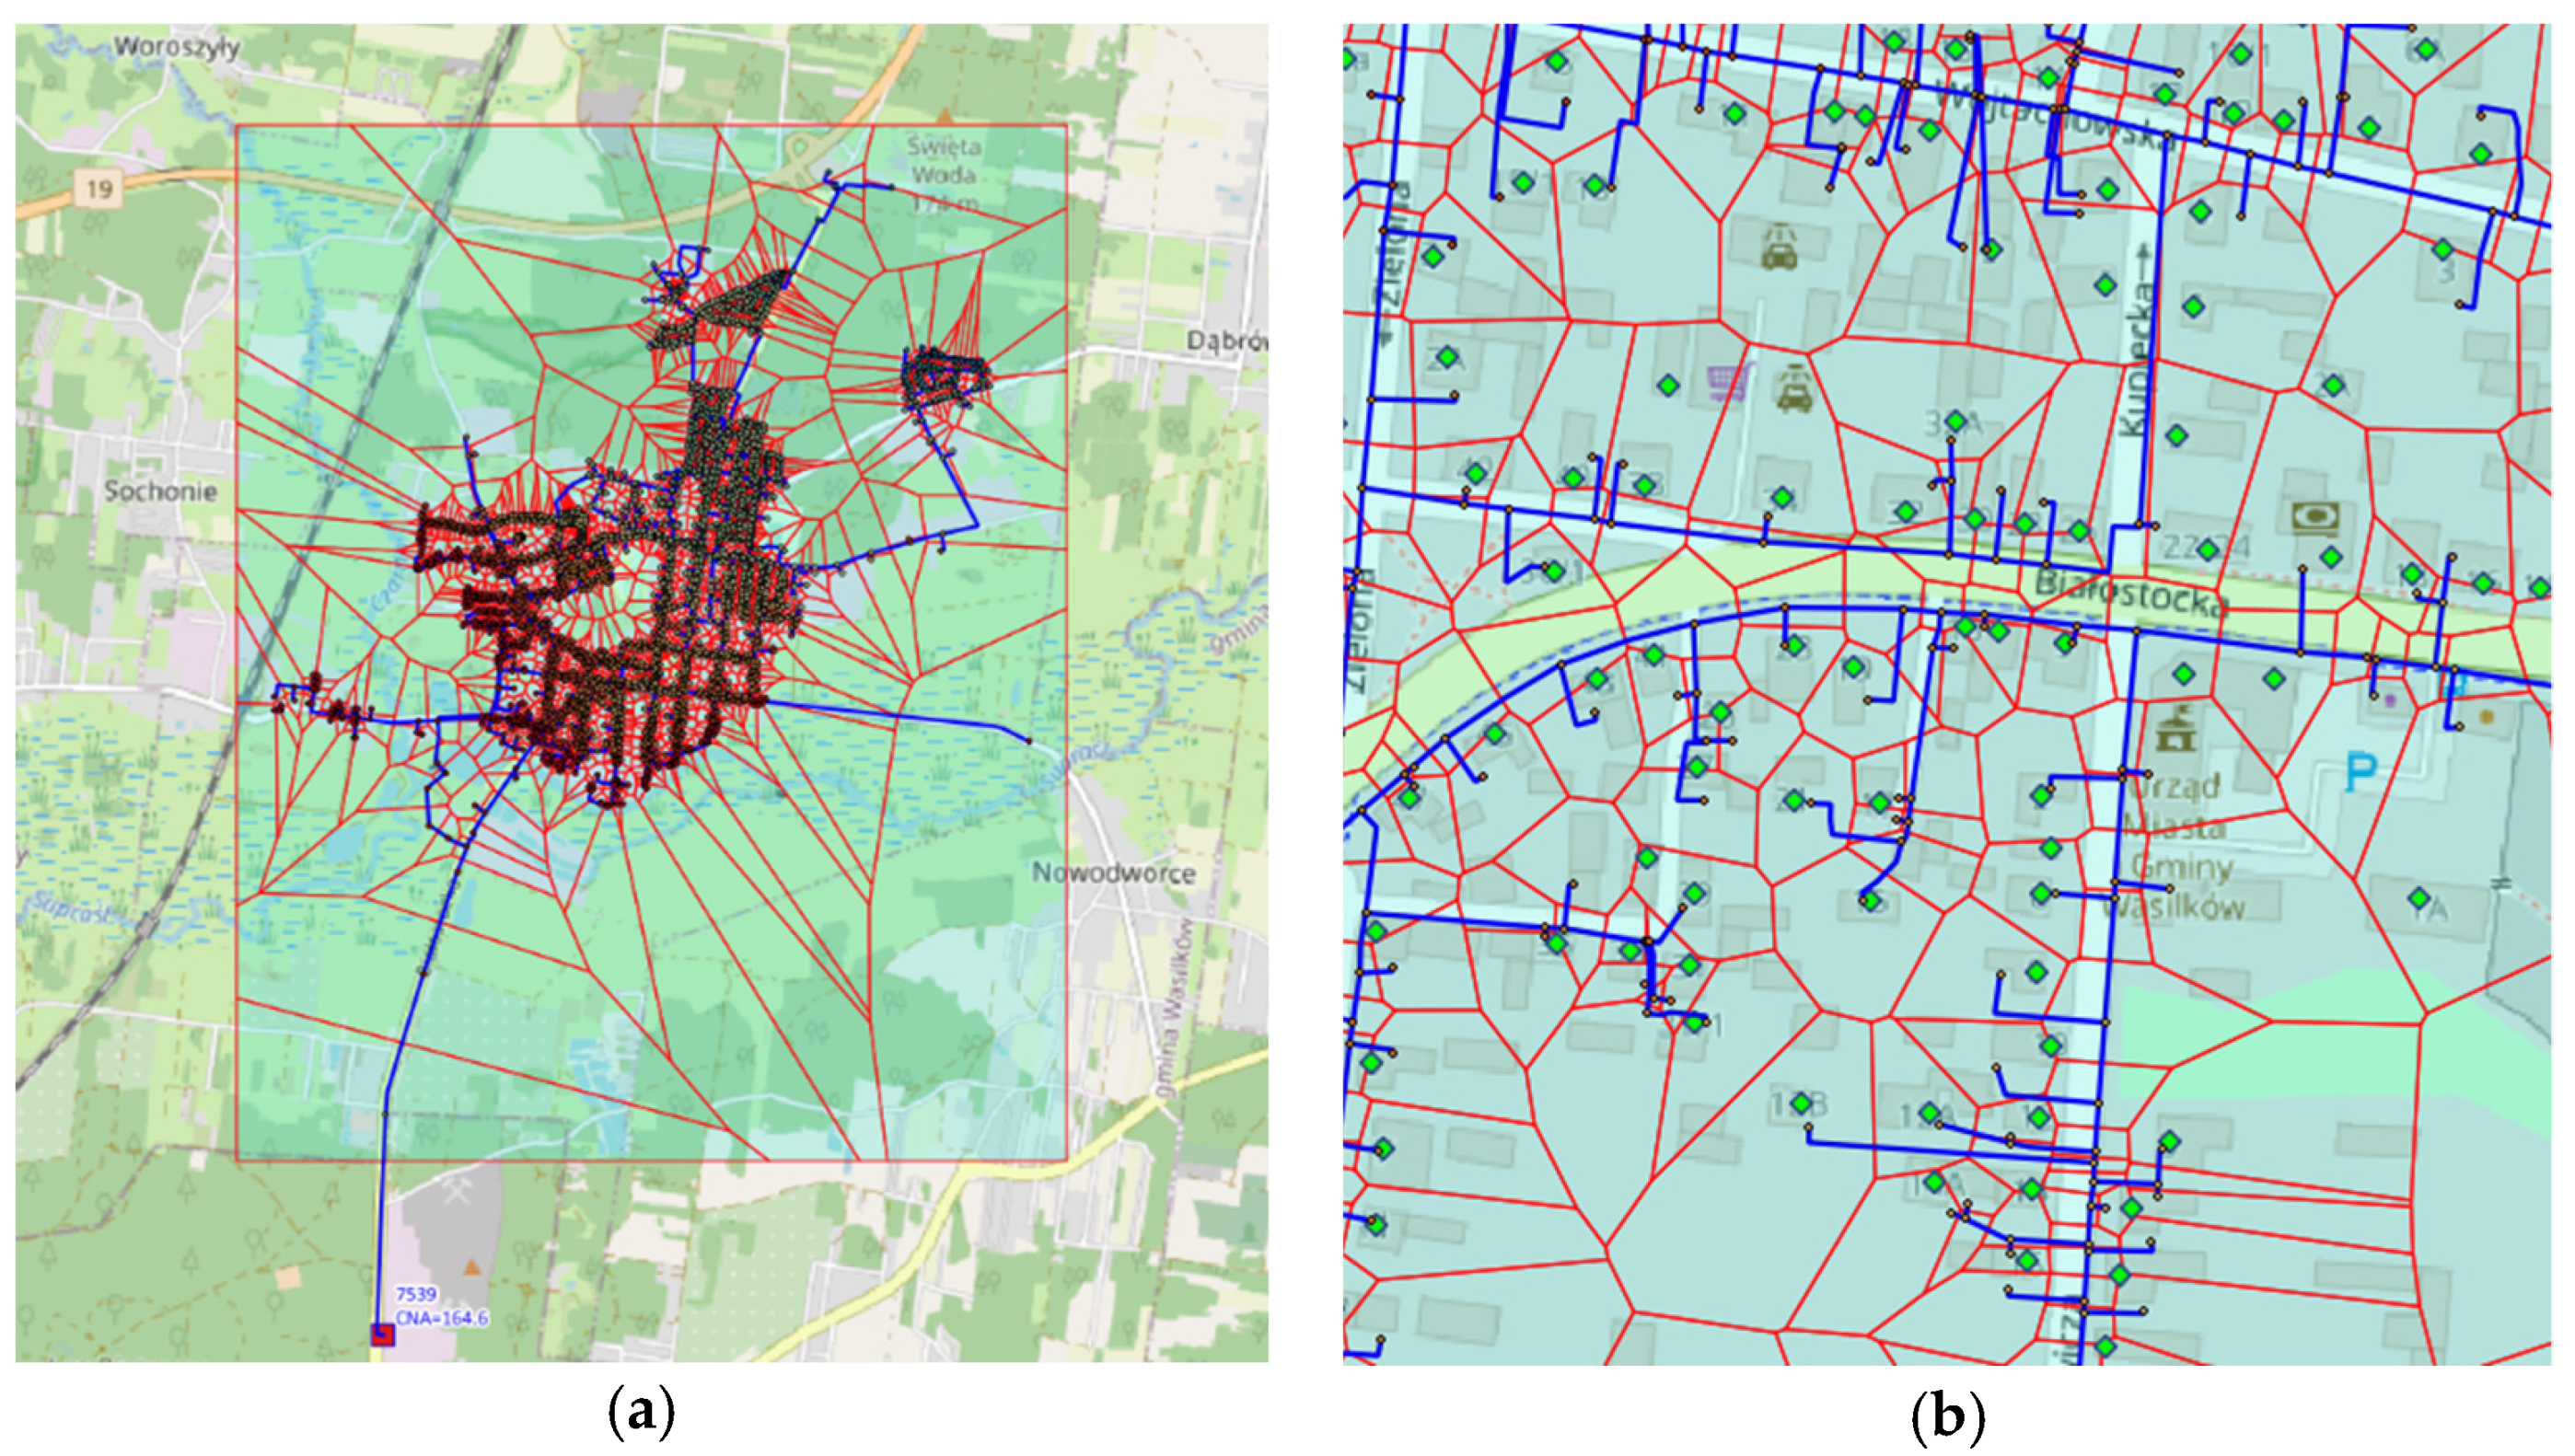
2.1. Complex Model
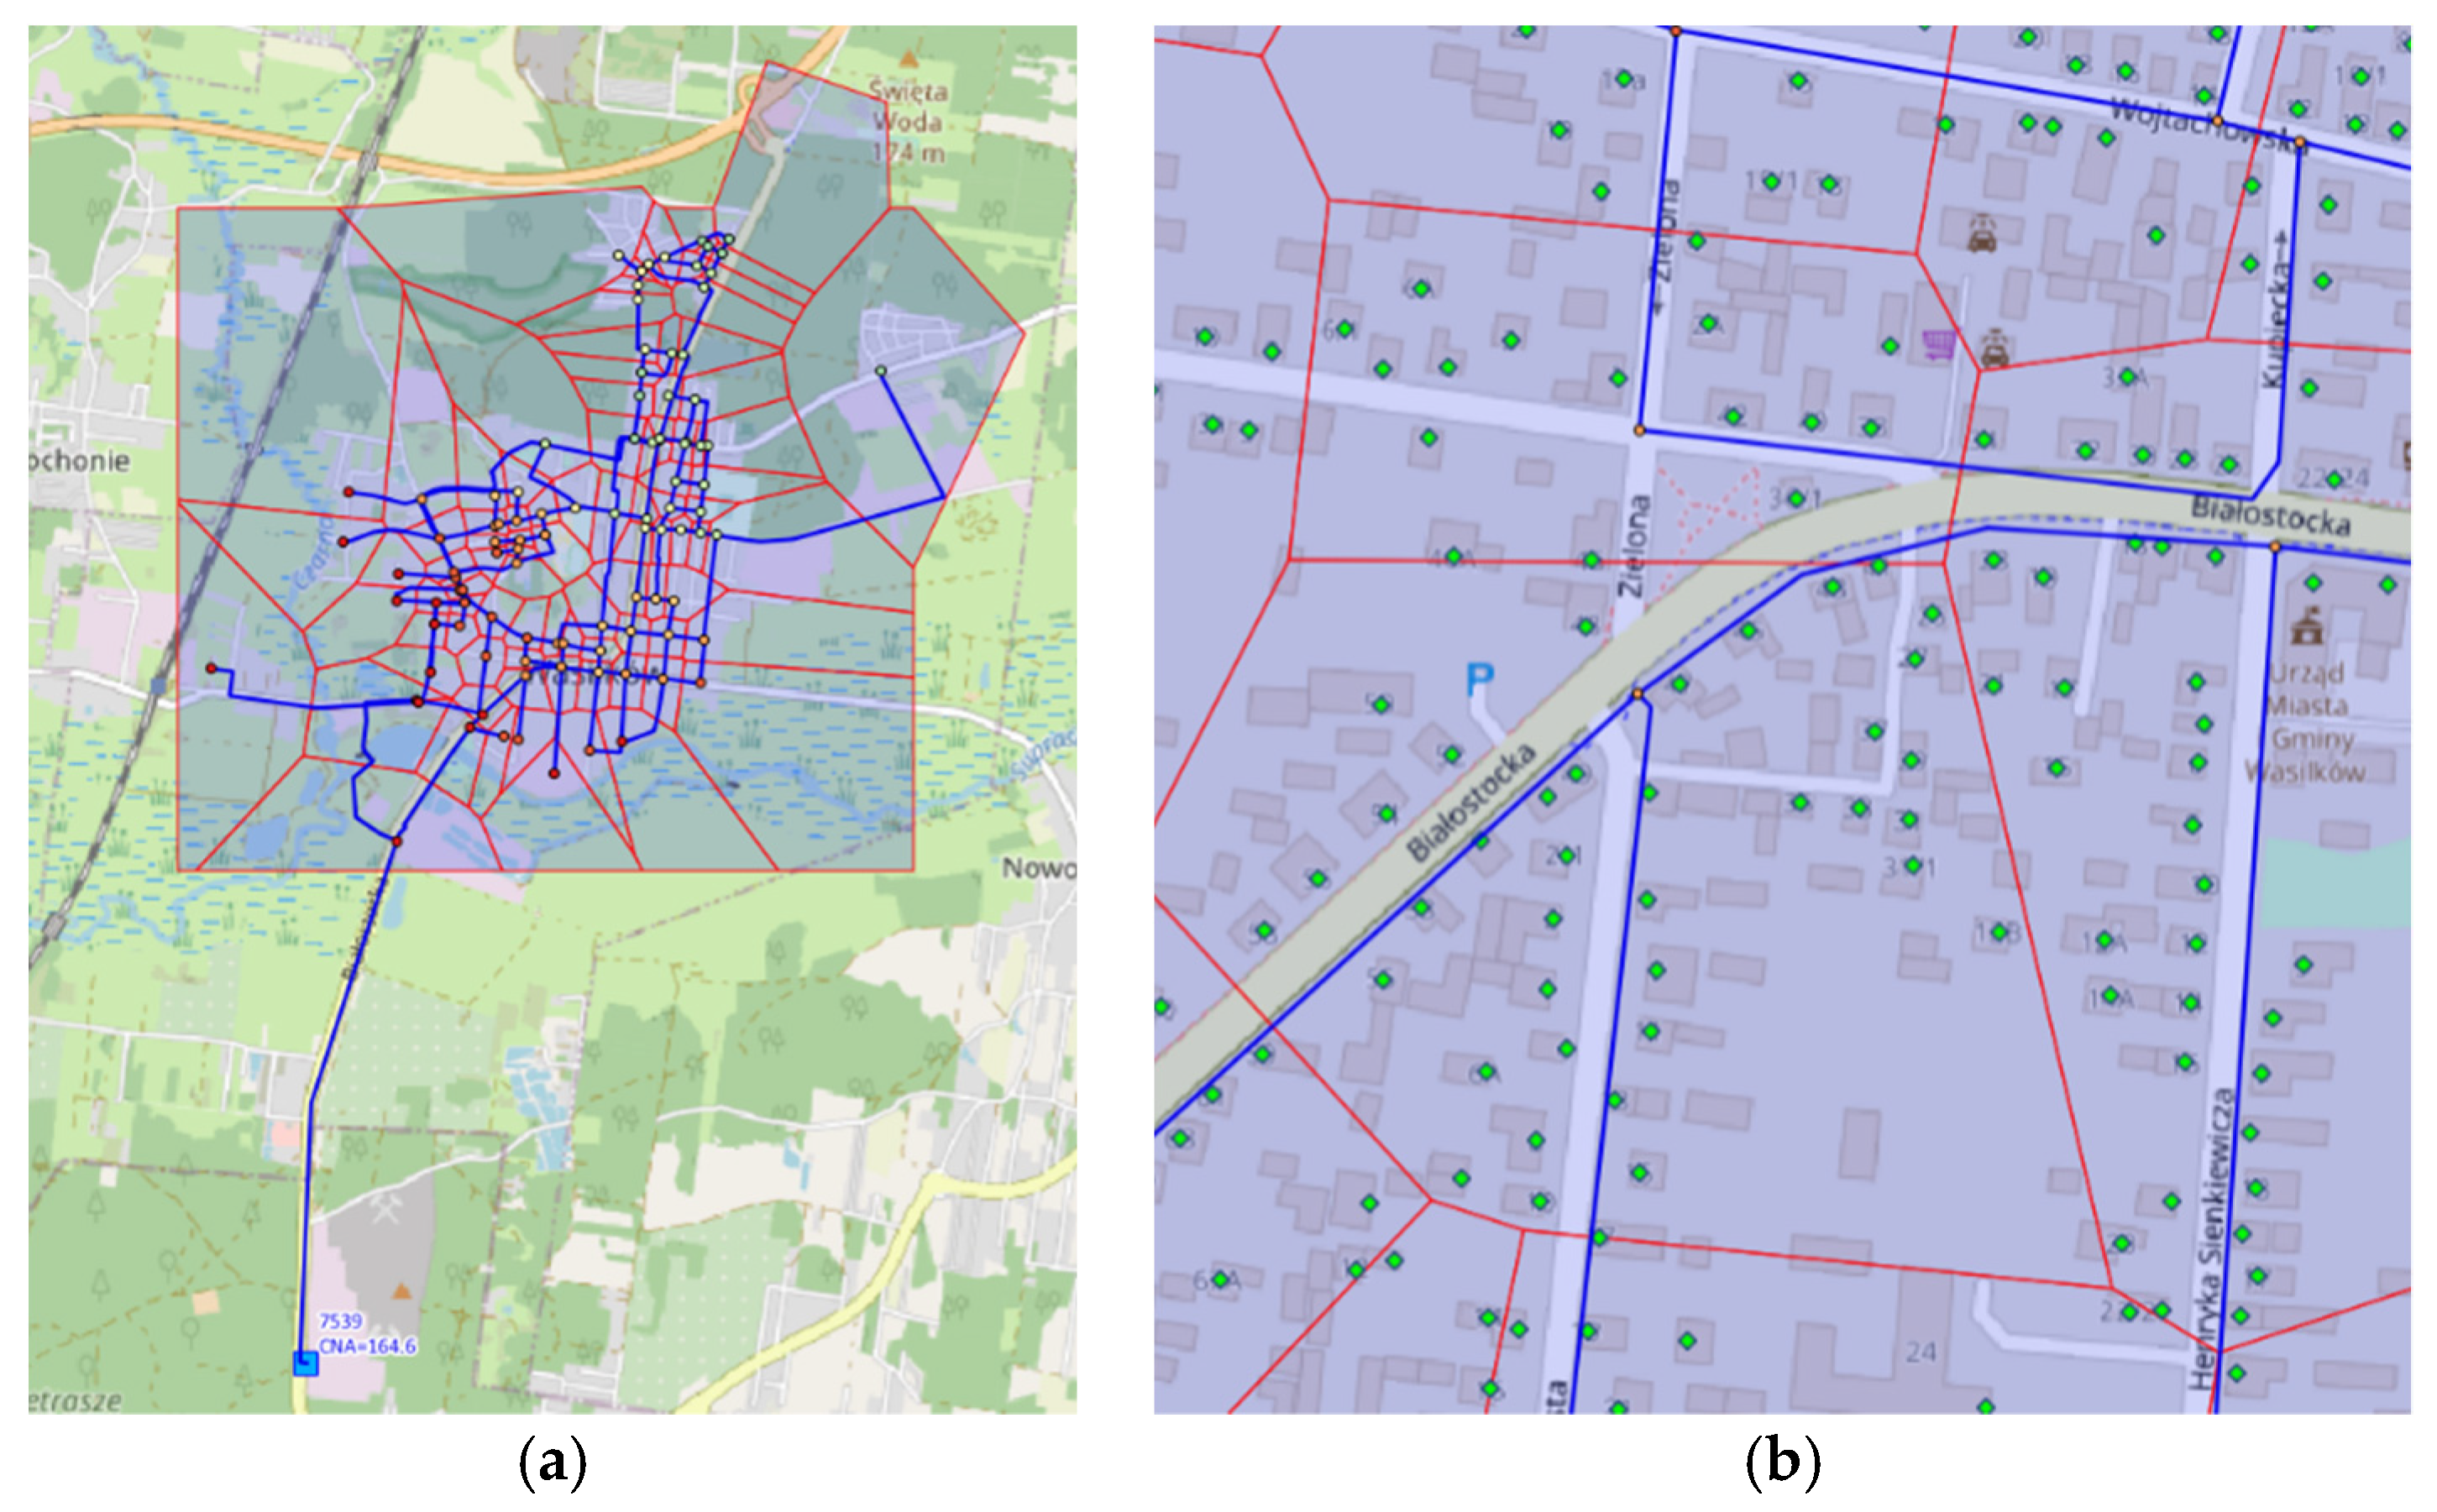
2.2. Simplified Model
2.3. Comparative Points
3. Conclusions
Author Contributions
Institutional Review Board Statement
Informed Consent Statement
Data Availability Statement
Acknowledgments
Conflicts of Interest
References
- Kruszyński, W.; Dawidowicz, J.C.D. Computer Modeling of Water Supply and Sewerage Networks as a Tool in an Integrated Water and Wastewater Management System in Municipal Enterprises. J. Ecol. Eng. 2020, 21, 261–266. Available online: http://www.jeeng.net/Computer-modeling-of-water-supply-and-sewerage-networks-as-a-tool-in-an-integrated,117533,0,2.html (accessed on 15 March 2021). [CrossRef]
- Walski, T.M.; Chase, D.V.; Savic, D.A.; Grayman, W.; Beckwith, S.; Koelle, E.B. Advanced Water Distribution Modeling and Management; Haestad Press: San Francisco, CA, USA, 2003; Chapter 10; pp. 417–497. [Google Scholar]
- Aurenhammer, F.C.D. Voronoi Diagrams—A Survey of a Fundamental Geometric Data Structure. ACM Comput. Surv. 1991, 23, 345–405. Available online: https://www.cs.jhu.edu/~misha/Spring16/Aurenhammer91.pdf (accessed on 15 March 2021). [CrossRef]
- Okabe, A.; Boots, B.; Sugihara, K.; Nok Chiu, S.B. Algorithms for Computing Voronoi Diagrams. In Spatial Tessellations; John Wiley & Sons, Ltd.: Hoboken, NJ, USA, 2000; Chapter 4; pp. 229–290. [Google Scholar]
- Guth, N.; Klingel, P.B. Demand Allocation in Water Distribution Network Modelling—A GIS-Based Approach Using Voronoi Diagrams with Constraints. In Application of Geographic Information Systems; Monwar Alam, B., Ed.; IntechOpen: London, UK, 2012; Chapter 15; pp. 283–302. Available online: https://www.intechopen.com/books/application-of-geographic-information-systems/demand-allocation-in-water-distribution-network-modelling-a-gis-based-approach-using-voronoi-diagram (accessed on 15 March 2021).
- Izquierdo, J.; L´opez, P.A.; Mart´ınez, F.J.; P´erez, R.C.D. Fault Detection in Water Supply Systems Using Hybrid (Theory and Data-Driven) Modelling. Math. Comput. Model. 2007, 46, 341–350. Available online: https://www.sciencedirect.com/science/article/pii/S0895717706004006 (accessed on 15 March 2021). [CrossRef]

| Type of Demand | Total Demand [CMH] | Number of Demand Points |
|---|---|---|
| Single-family housing | 1066.00 | 1923 |
| Multi-family housing | 249.98 | 58 |
| Industry | 240.04 | 1 |
Publisher’s Note: MDPI stays neutral with regard to jurisdictional claims in published maps and institutional affiliations. |
© 2021 by the authors. Licensee MDPI, Basel, Switzerland. This article is an open access article distributed under the terms and conditions of the Creative Commons Attribution (CC BY) license (https://creativecommons.org/licenses/by/4.0/).
Share and Cite
Kruszyński, W.; Zajkowski, A. Influence of Level of Detail (LOD) in Hydraulic Model Geometry with Demand Allocation by Voronoi Polygon Method on Chosen Parameters. Environ. Sci. Proc. 2021, 9, 35. https://doi.org/10.3390/environsciproc2021009035
Kruszyński W, Zajkowski A. Influence of Level of Detail (LOD) in Hydraulic Model Geometry with Demand Allocation by Voronoi Polygon Method on Chosen Parameters. Environmental Sciences Proceedings. 2021; 9(1):35. https://doi.org/10.3390/environsciproc2021009035
Chicago/Turabian StyleKruszyński, Wojciech, and Artur Zajkowski. 2021. "Influence of Level of Detail (LOD) in Hydraulic Model Geometry with Demand Allocation by Voronoi Polygon Method on Chosen Parameters" Environmental Sciences Proceedings 9, no. 1: 35. https://doi.org/10.3390/environsciproc2021009035
APA StyleKruszyński, W., & Zajkowski, A. (2021). Influence of Level of Detail (LOD) in Hydraulic Model Geometry with Demand Allocation by Voronoi Polygon Method on Chosen Parameters. Environmental Sciences Proceedings, 9(1), 35. https://doi.org/10.3390/environsciproc2021009035