Proceeding Paper

Modelling in Human Biometeorology: Spatial-Temporal Analysis of Thermal Indices †

1
Research Centre Human Biometeorology, German Meteorological Service, Stefan-Meier-Str. 4, D-79104 Freiburg, Germany
2
Institute of Earth and Environmental Sciences, Faculty of Environment and Natural Resources, University of Freiburg, D-79085 Freiburg, Germany
*
Author to whom correspondence should be addressed.
Presented at the 4th International Electronic Conference on Atmospheric Sciences, 16–31 July 2021; Available online: https://ecas2021.sciforum.net.
Environ. Sci. Proc. 2021, 8(1), 28; https://doi.org/10.3390/ecas2021-10297
Published: 1 June 2021
(This article belongs to the Proceedings of The 4th International Electronic Conference on Atmospheric Sciences)

Abstract

:
The issue of the quantification of thermal comfort or heat stress on humans is in vogue nowadays. This is evident for indices, which are trying to quantify these effects. Most known indices are PET, modified PET, SET*, PT and UTCI. All thermal indices require the same thermo-physiological and meteorological parameters. Air temperature, air humidity, wind speed, and short and long wave radiation fluxes in terms of mean radiant temperature are the required meteorological parameters. For human thermo-physiology, information about heat production and clothing are required. The meteorological parameters have to be available in appropriate spatial and temporal scales depending on the target and the specific issues demanded. The appropriate spatial and temporal resolution data cannot only be delivered by measurement stations. Meso and micro scale models, which compute meteorological parameter and thermal indices, can be helpful in the development of mitigation and adaptation strategies in the era of climate change.

1. Introduction

For the selection of appropriate measures against climate change, municipalities and architects require quantitative information about the effect of urban design and the planning of open spaces and reconstructions. While this kind of information was hard to obtain in the past, numerical models can now easily generate it. The models should be fast and easy to use by nonexperts so the respective planners in charge can apply them. At the same time, they need to generate all required information in an integral and intuitively understandable way [1,2]. For the case of thermal comfort and thermal stress, the latter can be best fulfilled by the application of thermal indices [3]. Sophisticated modern thermal indices consider the integral effect of environment in terms of the meteorological parameters air temperature ( T a ), vapor pressure ( V P ), wind velocity ( v ) and different radiation fluxes in terms of the mean radiant temperature ( T m r t ) [3,4]. In addition, these indices incorporate personal parameters such as weight, height, workload, metabolism, posture and clothing of a sample person and approximate thermal perception by solving human energy balance or respective energy fluxes [5]. The result should be presented in a unit that can be judged sufficiently by nonexperts, e.g., SI-unit “°C” based on the concept of an equivalent temperature [6,7].

2. Methods

2.1. Thermal Indices

The application of thermal indices based on human energy balance provides detailed information on the effect of complex thermal environments on humans [3,8]. Commonly used thermal indices, based on the human energy balance [5], are Physiologically Equivalent Temperature [6,7], Perceived Temperature [9], Universal Thermal Climate Index [10] and modified Physiologically Equivalent Temperature [11]. All the thermal indices mentioned above require the same meteorological input parameters: air temperature, air humidity, wind speed, and short and long wave radiation fluxes considered by their integral effect as mean radiant temperature. These input parameters have a temporal and spatial variability that has a huge influence on the thermal indices. Wind speed and mean radiant temperature have the highest variability, and are greatly modified by surroundings and obstacles in complex urban areas [12].

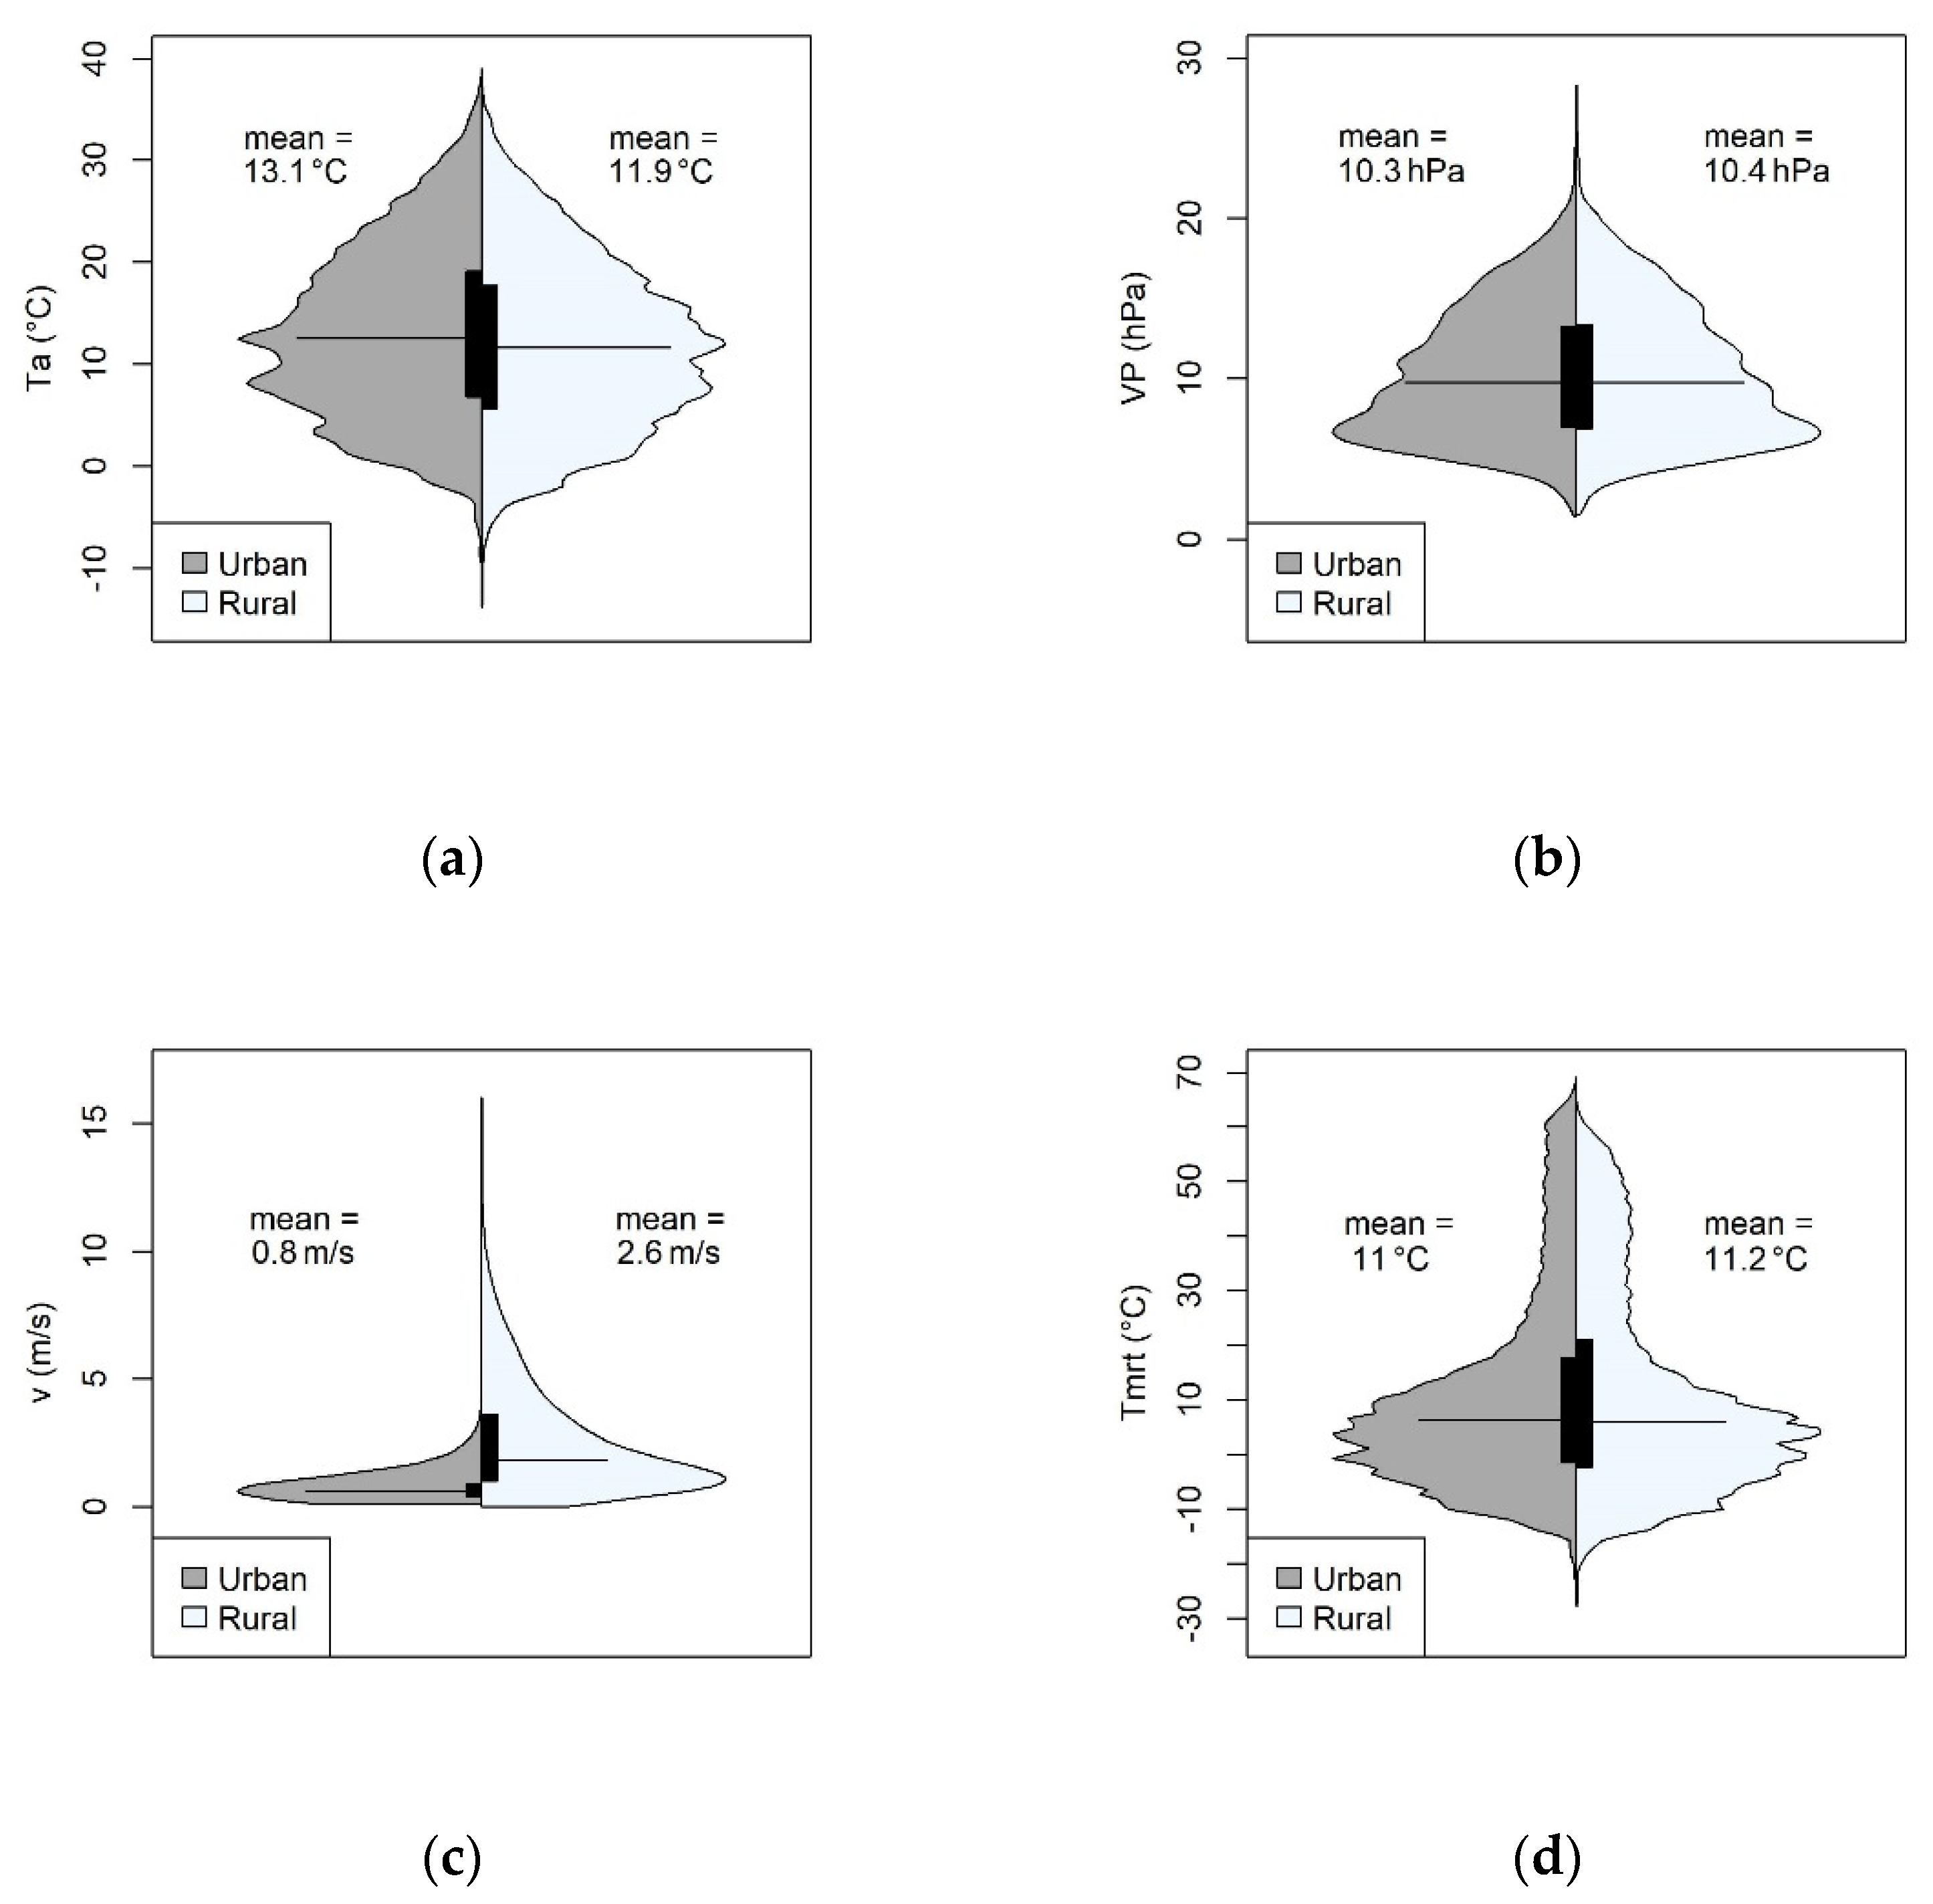
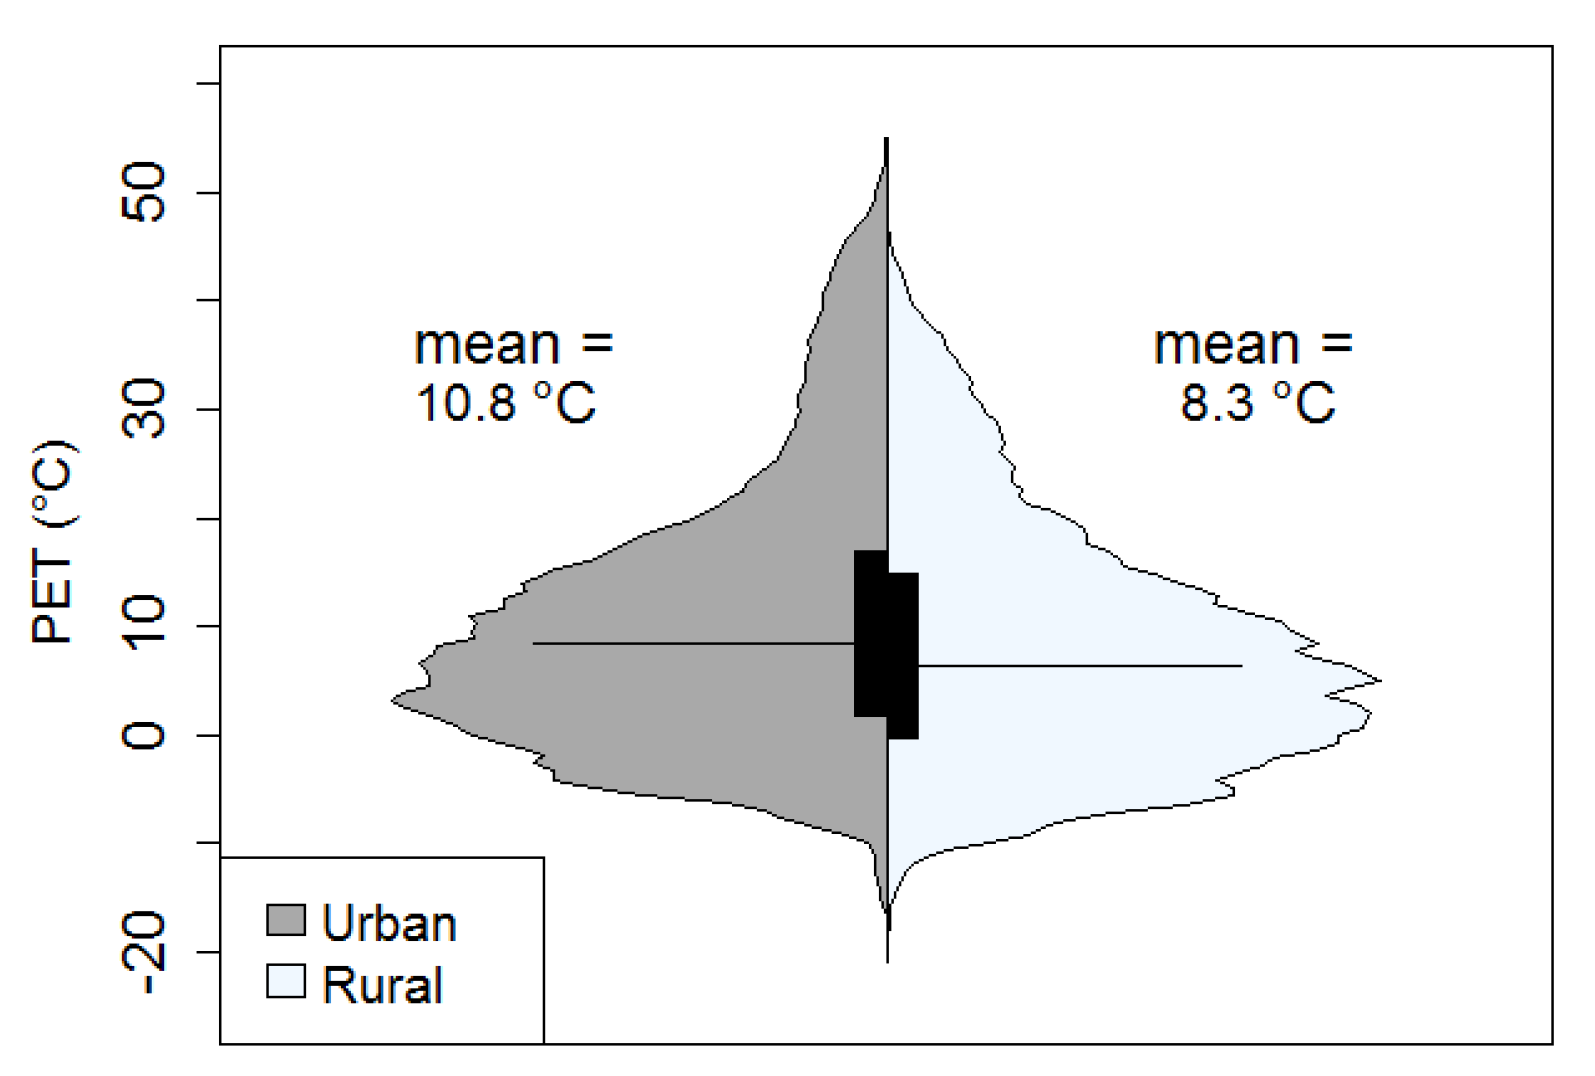
2.2. Descriptive Analysis of the Urban Heat Island Effects on Meteorological Conditions Based on Beanplots

For the comparison of an urban and a rural site, in the interest of the analysis of an urban heat island (UHI), two meteorological stations of the German Meteorological Service in Freiburg, Germany were analyzed. One station is located in a rural area, close to the airport of Freiburg, and the urban station is located in the city center of Freiburg, which is affected by surrounding buildings and trees. Freiburg is situated in the southwest of Germany. The analysis covered the period from July 2018 to February 2021 using a temporal resolution of 10 min for each measurement.
Boxplots have been a widely used technique for descriptive statistics for many years. They have the advantage of being easy to compute and display five important values that summarize the data under investigation (Min, Max, Mean, Median and Quantiles). However, earlier studies revealed some problems in the interpretation of boxplots by nonscientific observers. Nevertheless, with today’s computation possibilities, more information can be displayed in the same space. Therefore, an alternative to the boxplot, beanplots according to [13], is presented by means of a typical example from urban climatological data [14].
A dataset was imported into the RayMan-Model in order to calculate PET, as well as T m r t . The dataset contained the values of air temperature ( T a ), relative humidity (RH), global radiation (G) and the transformed wind velocity (v) at a height of 1.1 m.
Wind velocity was transformed in accordance with the following altitude correction after [15,16,17]:
v 1.1 = v h 1.1 h α   and   α = 0.12 z 0 + 0.18
For the simulation of the two stations the surroundings were not considered. In the final step the received output was processed and visualized [18].

2.3. RayMan Model

A RayMan model was developed to calculate short and long wave radiation fluxes affecting the human body. The model considers complex building structures and is suitable for the analysis of the effect of various planning scenarios in different micro to regional scales. The model calculates the mean radiant temperature, which is required for the human energy balance model and, thus, for the assessment of human thermal bioclimate [12,19,20,21]. The thermal indices Standard Effective Temperature (SET), PET, UTCI, PT and mPET can be calculated [12,19,20,21]. In addition, information about urban structures (buildings, deciduous and coniferous trees) can be generated or imported. Based on the input possibilities, sunshine duration with or without sky view factor (SVF), estimation of the daily mean, max or sum of global radiation or shadow for existing or future complex environments can be calculated. For the estimation of thermal indices, meteorological data can be entered through manual input or by loading custom data files with time series data. The output is provided as graphs and comma separated text files (CSV). RayMan offers the opportunity of importing long-term data sets of meteorological parameters allowing for statistical assessments [21].

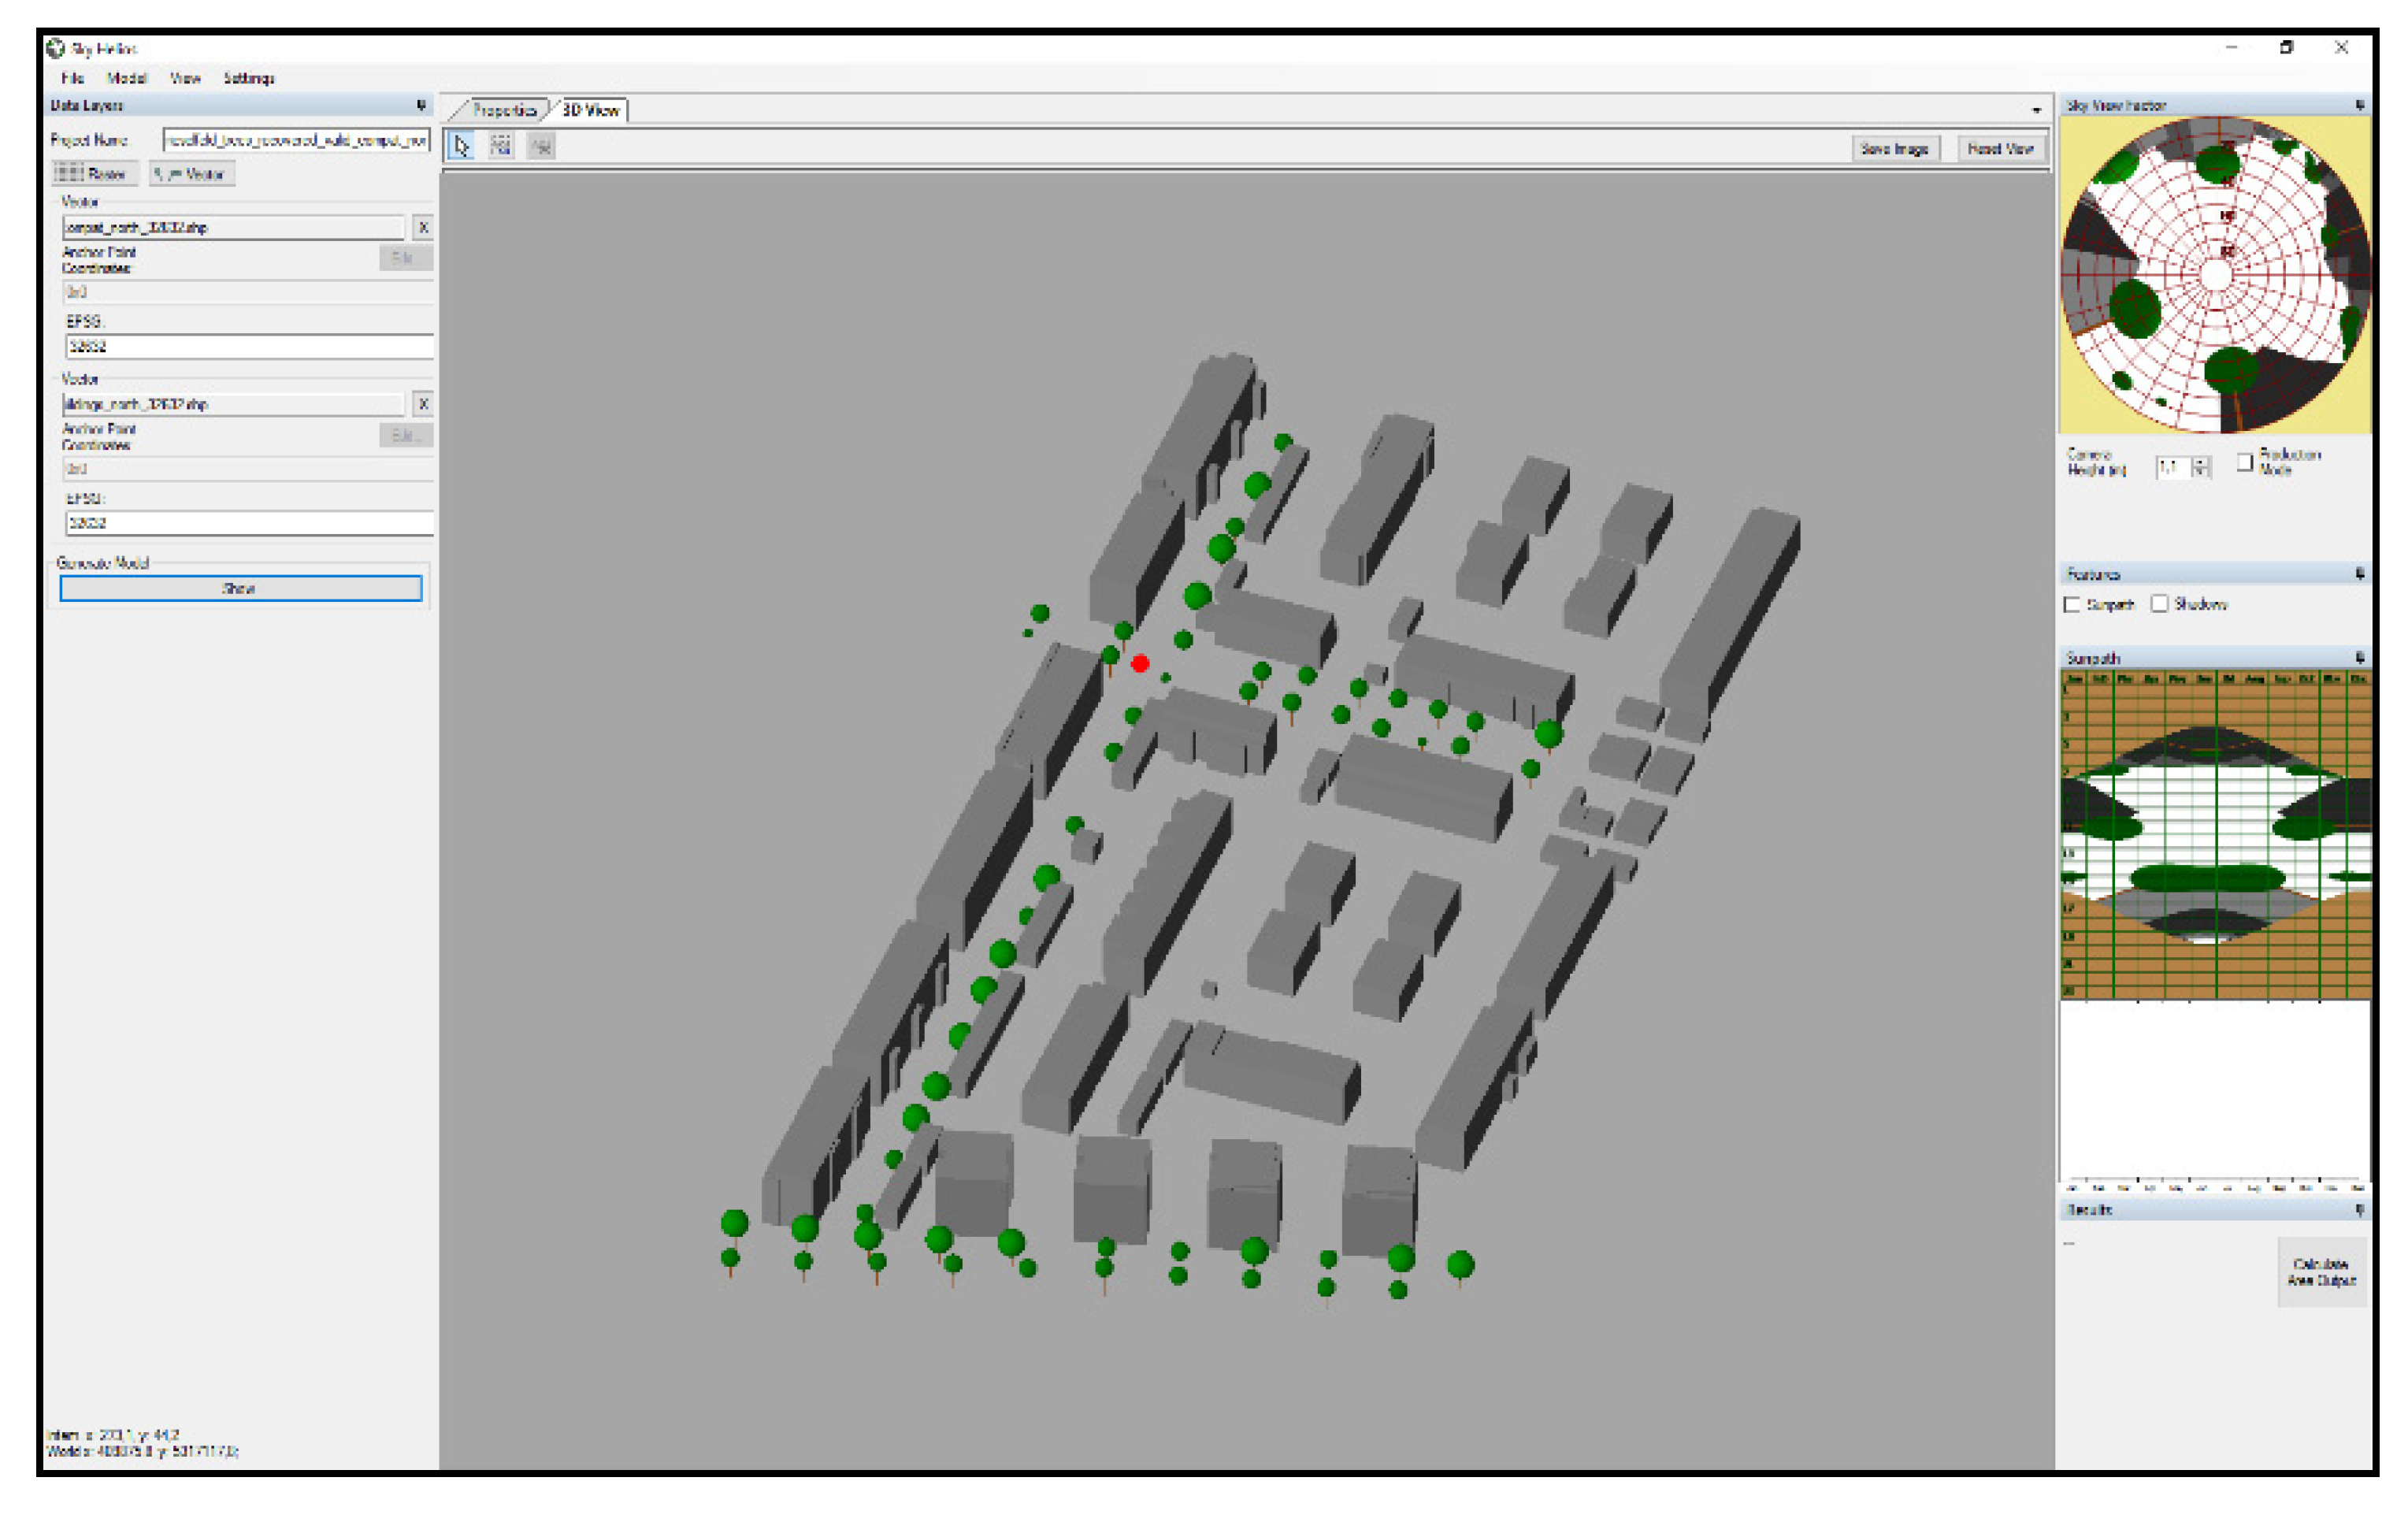
2.4. SkyHelios Model

SkyHelios [21,22,23,24] is an urban micro scale model, having the ability to estimate crucial parameters of the urban environment spatially resolved (Figure 1). It is a steady-state, time-independent model, capable of estimating several thermal indices [12]: PET, UTCI, PT and mPET. Furthermore, SkyHelios is able to compute different environmental factors: sunshine duration, shading, wind speed and direction for areas of interest (AOIs), as well as points of interest (POIs). By creating virtual, three-dimensional (3D) scenes from 3D urban geoinformation (e.g., CityGML LOD 0, 1 and 3D-Shapefiles), SkyHelios can be classified as a 3D city model. All 3D entities in the 3D scene are based on vectorial geodata, allowing for the specification of spatial resolution for all results on demand. The 3D scene is managed by the Object-Oriented Graphics Rendering Engine [25]. The surfaces of the entities in the 3D scene are rendered according to the surface radiational material properties: shortwave transparency, shortwave albedo and longwave emission coefficient. SkyHelios comprises a diagnostic wind model after [26] with modifications after [27] to estimate wind velocity and direction (WD). Using all this information together, SkyHelios is capable of estimating the thermal indices PET, PT and UTCI spatially resolved in high spatial resolution of, e.g., 1 m on 1 m [21].

2.5. Application of the Urban Microscale Models for the Study Area Rieselfeld in Freiburg, Germany

A study area in the West of Freiburg, the urban quarter Rieselfeld, was selected for this study. Detailed spatial inputs of the buildings in terms of a level of detail (LOD) 1, as well as a LOD 2 city model (based on the CityGML data format [28] and an urban tree cadaster, were provided by the municipality of Freiburg. The model was applied for a specified spatial resolution of 1 m, resulting in a discrete model domain of 1054 on 916 grid cells. All results were assessed for the target height of 1.1 m as the center of gravity of the human body. As a sample dataset, records of the official weather station: Freiburg airport of the German Meteorological Service were selected, providing the data via the Climate Data Center (CDC).
The meteorological input comprised the parameters air temperature ( ° C ), relative humidity ( % ), air pressure ( hPa ), wind speed ( m s 1 ) and direction ( ° ), as well as global radiation ( W m 2 ) for the whole day in 10-min temporal resolution.

3. Results

3.1. Evaluation of Beanplots for the Assessment of the Bioclimate in Freiburg, Germany

The meteorological input parameters ( T a , R H , v , T m r t ) and the thermal index PET are shown in Figure 2 and Figure 3 with the aid of the statistical R programming language.
The air temperature distribution of both stations is shown in Figure 2a with the absolute frequency on the x-axis. The mean condition shows that for the examined period the urban location had a mean air temperature of 13.1 °C and the rural 11.9 °C, respectively. The shape of the bean differs, indicating that for cold conditions the station in the city was warmer and represents, therefore, the mean intensity of the urban heat island throughout this period.
The distribution of vapor pressure in the city is in the same order of magnitude as at the rural station. The mean conditions are 10.3 hPa for the urban and 10.4 hPa for the rural station (Figure 2b), respectively.
Mean wind speed at the rural station (2.6 m/s) was significantly greater compared to the urban station (0.8 m/s) (Figure 2c). This can be explained by the increased aerodynamic roughness of the surroundings urban structures in the city center.
The distribution of mean radiant temperature (Figure 2d) is slightly different between the rural and urban station. Due to shading from surrounding buildings, high values for T m r t (in the range of 30 °C to 55 °C) are more common at the rural station. The sky view factor here is close to 1. Conversely, low values for T m r t also occur more frequently at the rural station. Depending on the surface properties of the surrounding buildings (albedo and emissivity), long-wave radiation, as well as the reflections of the buildings, influence the measured mean radiation temperature.
The mean value of PET (Figure 3) in urban areas is 10.8 °C and for rural areas 8.3 °C. The distribution is similar, but in comparison to air temperature (urban 13.1 °C and rural 11.9 °C) the shape of the distribution is different with a higher range of PET for both stations. The shape is dissimilar because the most influencing factors are those with the highest variability, which are wind speed and mean radiant temperature. The highest values can be found in the urban area and the minimum conditions are slightly warmer in the city.

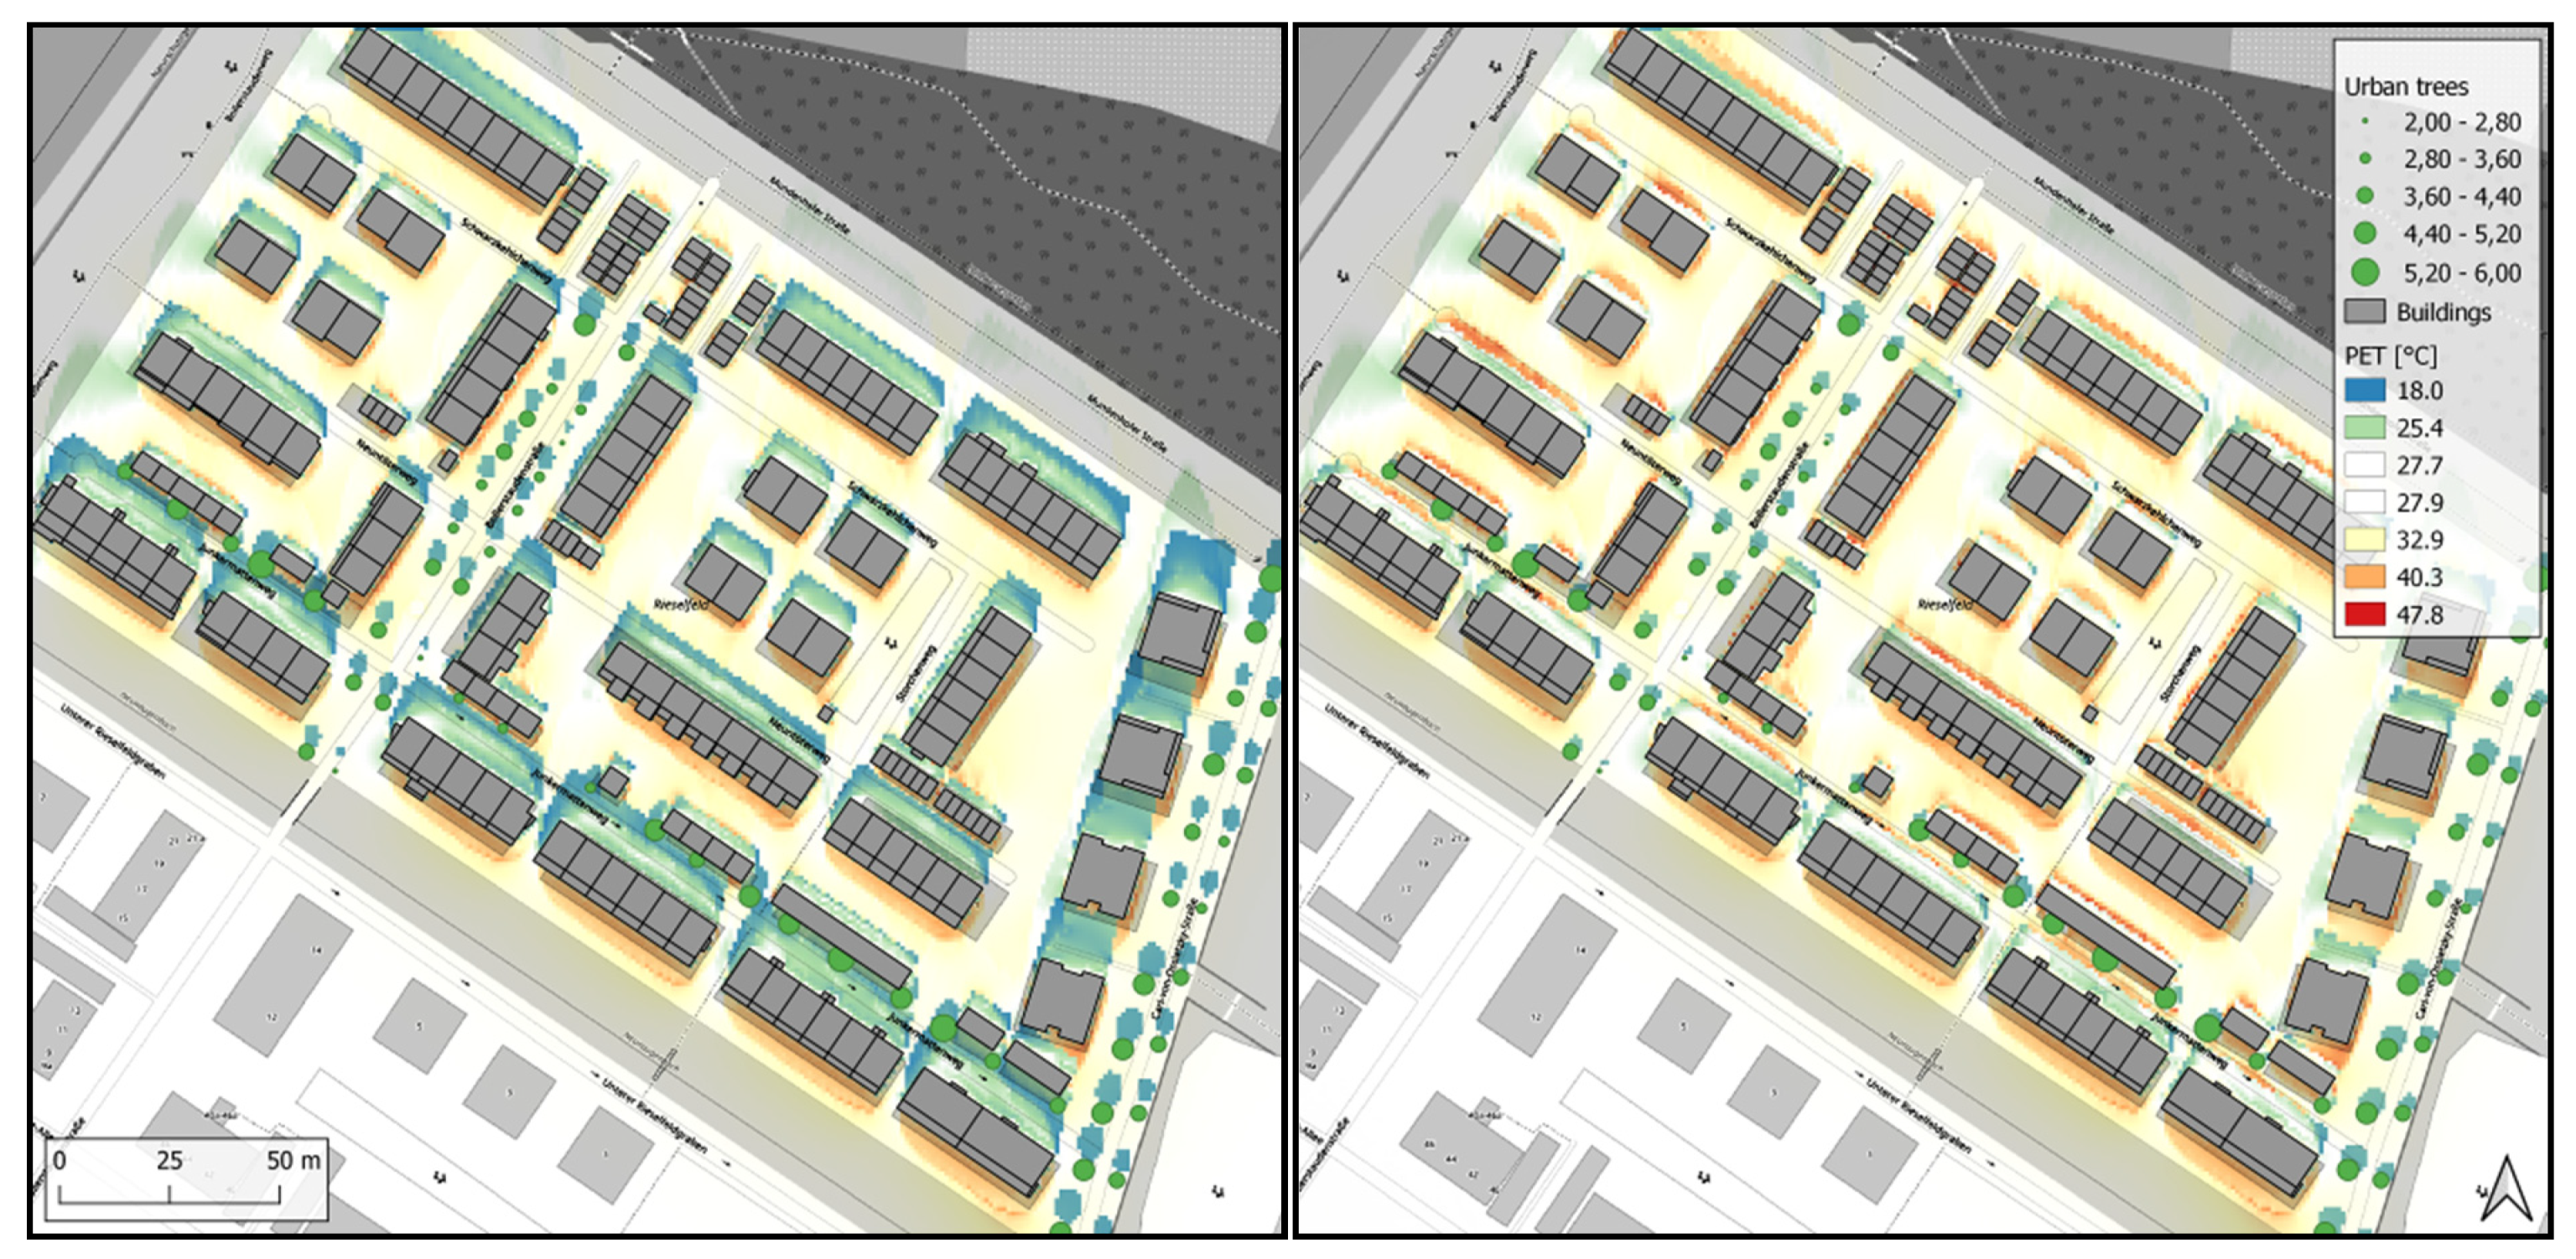
3.2. Assessment of Spatially Resolved Thermal Indices in Freiburg, Germany

Spatially resolved PET varied in April between 18.7 °C and 44.6 °C with an average of 29.2 °C, and in July between 19.6 °C and 47.6 °C with an average of 30.0 °C (Figure 4). The effect of shading and the impact of decreased wind speed on PET is observable on the lee side of each building.
In April, an area of 9796.19 m2 of 78,659.98 m2 was shaded (12.45%, 1052.06 m2 by trees (1.33%) and 8744.13 m2 by buildings (11.11%)). In July, an area of 5430.05 m2 of 78,659.98 m2 was shaded (6.90%, 981.36 m2 by trees (1.24%) and 4448.69 m2 by buildings (5.65%)). The shaded area by trees was decreased by 70.70 m2 (6.72%) and by buildings by 4295.44 m2 (49.12%), due to increased solar altitude angle from April to July.

4. Discussion

The beanplots are useful for the comparison of urban rural station and the distribution of the results. Differences are clearly seen in the different meteorological input parameters and their effect on thermal indices. Spatially resolved thermal indices visualized as thermal comfort maps can help to identify areas that need to be improved in terms of thermal comfort and heat stress, thereby providing relevant information concerning climate change and for the development of adaptation possibilities at the micro scale in urban environments. As thermal comfort conditions can be calculated and visualized very fast by the SkyHelios model, several scenarios can be analyzed to support urban planning, as shown in this study. The rapid assessment method also allows for the calculation of long time series, especially with the RayMan model.
The results of the case study presented here indicate that thermal (heat) stress can be reduced most effectively by providing shade [29]. Shaded areas can be generated by buildings, as well as by urban trees. While both are shown to reduce PET quite effectively, areas shaded by trees were found to be slightly more comfortable in terms of PET in this case study. This is in very good agreement with various other studies investigating the impact of urban green on heat stress represented by some thermal index, e.g., [30,31]. It must be noted, that the SkyHelios model currently does not consider spatial variations in Ta and VP for the calculation of thermal indices. Surfaces in the model domain are not coupled to the atmosphere with respect to heat transfer and mass transfer, or the cooling effect by transpiration on leaf surface temperature [32].

5. Conclusions

Using all supplied information to, RayMan and SkyHelios are capable of estimating the thermal indices PET, PT and UTCI spatially resolved in high spatial resolution of, e.g., 1 m on 1 m with consideration of the physiological processes of urban vegetation and building configurations. Overall, it is shown that micro scale models like SkyHelios and RayMan can provide valuable information for architects, and land and urban planners.

Author Contributions

Conceptualization, A.M.; methodology, A.M.; software, T.H. and M.G.; validation, M.G. and T.H.; formal analysis, M.G.; investigation, T.H.; resources, A.M.; data curation, T.H.; writing—original draft preparation, A.M.; writing—review and editing, A.M., M.G. and T.H.; visualization, T.H. and M.G.; supervision, A.M. All authors have read and agreed to the published version of the manuscript.

Conflicts of Interest

The author declare no conflict of interest.

References

  1. Matzarakis, A. A Note on the Assessment of the Effect of Atmospheric Factors and Components on Humans. Atmosphere 2020, 11, 1283. [Google Scholar] [CrossRef]
  2. Matzarakis, A. Comments about Urban Bioclimate Aspects for Consideration in Urban Climate and Planning Issues in the Era of Climate Change. Atmosphere 2021, 12, 546. [Google Scholar] [CrossRef]
  3. Staiger, H.; Laschewski, G.; Matzarakis, A. Selection of appropriate thermal indices for applications in human biometeorological studies. Atmosphere 2019, 10, 18. [Google Scholar] [CrossRef] [Green Version]
  4. VDI Guideline 3787/Part 2. Environmental meteorology, Methods for the human biometeorological evaluation of climate and air quality for urban and regional planning at regional level: Part I: Climate. In VDI/DIN Handbuch Reinhaltung der Luft, Band 1B: Umweltmeteorologie; Beuth-Verlag: Berlin, Germany, 2008; Volume 2, pp. 1–32. [Google Scholar]
  5. Fanger, P.O. Thermal Comfort. Analysis and Applications in Environmental Engineering; Danish Technical Press: Copenhagen, Denmark, 1970; p. 244. [Google Scholar]
  6. Matzarakis, A.; Mayer, H.; Iziomon, M.G. Applications of a universal thermal index: Physiological equivalent temperature. Int. J. Biometeorol. 1999, 43, 76–84. [Google Scholar] [CrossRef] [PubMed]
  7. Höppe, P. The physiological equivalent temperature—A universal index for the biometeorological assessment of the thermal environment. Int. J. Biometeorol. 1999, 43, 71–75. [Google Scholar] [CrossRef] [PubMed]
  8. Potchter, O.; Cohen, P.; Lin, T.-P.; Matzarakis, A. Outdoor human thermal perception in various climates: A comprehensive review of approaches, methods and quantification. Sci. Total Environ. 2018, 631–632, 390–406. [Google Scholar] [CrossRef]
  9. Staiger, H.; Laschewski, G.; Gratz, A. The perceived temperature—A versatile index for the assessment of the human thermal environment. Part A: Scientific basics. Int. J. Biometeorolgy 2012, 56, 165–176. [Google Scholar] [CrossRef]
  10. Jendritzky, G.; de Dear, R.; Havenith, G. UTCI--why another thermal index? Int. J. Biometeorol. 2012, 56, 421–428. [Google Scholar] [CrossRef] [Green Version]
  11. Chen, Y.-C.; Matzarakis, A. Modified physiologically equivalent temperature—Basics and applications for western European climate. Theor. Appl. Climatol. 2018, 132, 1275–1289. [Google Scholar] [CrossRef]
  12. Fröhlich, D.; Matzarakis, A. Spatial Estimation of Thermal Indices in Urban Areas—Basics of the SkyHelios Model. Atmosphere 2018, 9, 209. [Google Scholar] [CrossRef] [Green Version]
  13. Kampstra, P. Beanplot: A boxplot alternative for visual comparison of distributions. J. Stat. Softw. 2008, 28, 1–9. [Google Scholar] [CrossRef] [Green Version]
  14. Muthers, S.; Matzarakis, A. Use of beanplots in applied climatology A comparison with boxplots. Meteorol. Z. 2010, 19, 641–644. [Google Scholar] [CrossRef]
  15. Köpke, P.; Schönwiese, C.-D.; Heimann, M.; Kuttler, W. Auswirkungen atmosphärischer Spurenstoffe auf Strahlung und Klima. In Handbuch der Umweltveränderungen und Ökotoxikologie; Springer: Berlin/Heidelberg, Germany, 2000; pp. 297–470. [Google Scholar]
  16. Matzarakis, A.; De Rocco, M.; Najjar, G. Thermal bioclimate in Strasbourg—the 2003 heat wave. Theor. Appl. Climatol. 2009, 98, 209–220. [Google Scholar] [CrossRef]
  17. Ketterer, C.; Gangwisch, M.; Frohlich, D.; Matzarakis, A. Comparison of selected approaches for urban roughness determination based on voronoi cells. Int. J. Biometeorol. 2017, 61, 189–198. [Google Scholar] [CrossRef] [PubMed]
  18. R Core Team. R: A Language and Environment for Statistical Computing; Version 3.5.2; R Foundation for Statistical Computing: Vienna, Austria, 2018. [Google Scholar]
  19. Matzarakis, A.; Rutz, F.; Mayer, H. Modelling radiation fluxes in simple and complex environments--application of the RayMan model. Int. J. Biometeorol. 2007, 51, 323–334. [Google Scholar] [CrossRef]
  20. Matzarakis, A.; Rutz, F.; Mayer, H. Modelling radiation fluxes in simple and complex environments: Basics of the RayMan model. Int. J. Biometeorol. 2010, 54, 131–139. [Google Scholar] [CrossRef] [PubMed] [Green Version]
  21. Matzarakis, A.; Gangwisch, M.; Fröhlich, D. RayMan and SkyHelios Model. In Urban Microclimate Modelling for Comfort and Energy Studies; Palme, M., Salvati, A., Eds.; Springer International Publishing: Berlin/Heidelberg, Germany, 2021; pp. 339–361. [Google Scholar]
  22. Matuschek, O.; Matzarakis, A. Estimation of sky view factor in complex environment as a tool for applied climatological studies. Ber. Des Meteorol. Inst. Der Albert-Ludwigs-Univ. Freibg. 2010, 20, 534–539. [Google Scholar]
  23. Matzarakis, A.; Matuschek, O. Sky view factor as a parameter in applied climatology rapid estimation by the SkyHelios model. Meteorol. Z. 2011, 20, 39–45. [Google Scholar] [CrossRef]
  24. Matzarakis, A.; Fröhlich, D. Influence of urban green on human thermal bioclimate-application of thermal indices and micro-scale models. In Proceedings of the International Symposium on Greener Cities for More Efficient Ecosystem Services in a Climate Changing World, Bologna, Italy, 12–15 September 2017; pp. 1–10. [Google Scholar]
  25. Ogre Development Team. OGRE–Open Source 3D Graphics Engine. Available online: https://www.ogre3d.org/ (accessed on 27 September 2021).
  26. Röckle, R. Bestimmung der Strömungsverhältnisse im Bereich komplexer Bebauungsstrukturen. Doctoral Thesis, Technische Universität Darmstadt, Darmstadt, Germany, 1990. [Google Scholar]
  27. Singh, B.; Hansen, B.S.; Brown, M.J.; Pardyjak, E.R. Evaluation of the QUIC-URB fast response urban wind model for a cubical building array and wide building street canyon. Environ. Fluid Mech. 2008, 8, 281–312. [Google Scholar] [CrossRef]
  28. Gröger, G.; Kolbe, T.H.; Nagel, C.; Häfele, K.-H. OGC City Geography Markup Language (CityGML) Encoding Standard; Institut für Angewandte Informatik (IAI): Eggenstein-Leopoldshafen, Germany, 2012. [Google Scholar]
  29. Hwang, R.-L.; Lin, T.-P.; Matzarakis, A. Seasonal effects of urban street shading on long-term outdoor thermal comfort. Build. Environ. 2011, 46, 863–870. [Google Scholar] [CrossRef]
  30. de Abreu-Harbich, L.V.; Labaki, L.C.; Matzarakis, A. Effect of tree planting design and tree species on human thermal comfort in the tropics. Landsc. Urban Plan. 2015, 138, 99–109. [Google Scholar] [CrossRef]
  31. Santos Nouri, A.; Fröhlich, D.; Matos Silva, M.; Matzarakis, A. The Impact of Tipuana tipu Species on Local Human Thermal Comfort Thresholds in Different Urban Canyon Cases in Mediterranean Climates: Lisbon, Portugal. Atmosphere 2018, 9, 12. [Google Scholar] [CrossRef] [Green Version]
  32. Fröhlich, D.; Gangwisch, M.; Matzarakis, A. Effect of radiation and wind on thermal comfort in urban environments—Application of the RayMan and SkyHelios model. Urban Clim. 2019, 27, 1–7. [Google Scholar] [CrossRef]
Figure 1. Main window of SkyHelios showing a 3D-scene of Rieselfeld, an urban district in Freiburg, Germany. The scene covers the footprint of all buildings in combination with urban trees.
Environsciproc 08 00028 g001
Figure 2. Beanplots for the meteorological input parameter for thermal indices calculation. (a) Air temperature ( ° C ); (b) relative humidity ( % ); (c) wind speed ( m s 1 ); (d) mean radiant temperature ( ° C ). The black horizontal line represents the median. Period of time: 1 July 2018 to 28 February 2021. The distance between the rural and urban station in Freiburg is about four kilometers.
Environsciproc 08 00028 g002
Figure 3. Beanplot for Physiologically Equivalent Temperature ( ° C ). Time period: 1 July 2018 to 28 February 2021 in Freiburg. The distance between the rural and urban station in Freiburg is about four kilometers.
Environsciproc 08 00028 g003
Figure 4. Thermal comfort, based on PET in 1.1 m above ground level for a residential neighborhood in Freiburg, Germany at 13:00 LST, 1st of April (left) and 1st of July (right).
Environsciproc 08 00028 g004
Publisher’s Note: MDPI stays neutral with regard to jurisdictional claims in published maps and institutional affiliations.

