Proceeding Paper

Moisture Sources for the Explosive Cyclogenesis of Extratropical Cyclone Miguel (2019) through a Lagrangian Approach †

by
Patricia Coll-Hidalgo
1,2,*,
Albenis Pérez-Alarcón
1,3,
José Carlos Fernández-Alvarez
1,3,
Raquel Nieto
1 and
Luis Gimeno
1
1
Centro de Investigación Mariña, Universidade de Vigo, Environmental Physics Laboratory (EPhysLab), Campus As Lagoas s/n, 32004 Ourense, Spain
2
Empresa Cubana de Navegación Aérea, La Habana 10800, Cuba
3
Departmento de Meteorología, Instituto Superior de Tecnologías y Ciencias Aplicadas, Universidad de La Habana, La Habana 10400, Cuba
*
Author to whom correspondence should be addressed.
Presented at the 4th International Electronic Conference on Atmospheric Sciences, 16–31 July 2021; Available online: https://ecas2021.sciforum.net.
Environ. Sci. Proc. 2021, 8(1), 19; https://doi.org/10.3390/ecas2021-10331
Published: 22 June 2021
(This article belongs to the Proceedings of The 4th International Electronic Conference on Atmospheric Sciences)

Abstract

:
In this study, the moisture sources for the explosive cyclogenesis Miguel that occurred during 4–9 June 2019 in the North Atlantic were investigated. To determine the moisture sources, the Lagrangian FLEXPART particle dispersion model was used. The moisture uptake pattern revealed the western North Atlantic Ocean extending to north-western North America, the south-eastern coast of Greenland, and the central North Atlantic Ocean around 45° N and 50°–20° W as the main moisture sources for Miguel explosive cyclogenesis. Furthermore, the moisture uptake from these regions was higher than the climatology. During the intensification of Miguel, the moisture contribution from oceanic sources was higher than terrestrial sources. Although the total amount of atmospheric moisture achieved during the explosive intensification was similar to that absorbed the 24 h prior, they changed in intensity geographically, being more intense the local support over central and northern North Atlantic basin.

1. Introduction

Extratropical cyclones (ECs) are a synoptic phenomenon that typically cause severe weather in midlatitudes, including heavy rainfall and strong winds [1,2,3,4,5,6]. Chang et al. [7] showed that ECs play an important role in the poleward transport of heat and momentum. In the North Atlantic and Northern Europe, rainfall associated with cyclones account for 70–80% of total precipitation [8].
ECs intensity and the amount of precipitation are linked to the processes of transport and distribution of moisture during their development phases [9]. Moreover, it has been accepted that the moisture transport intensity is significantly different at different times, mainly depending on the location and intensity of the cyclone [10]. Regarding moisture transport mechanisms in ECs, Sodemann and Stohl [11] showed that individual cyclones were responsible for the formation and maintenance of atmospherics rivers (ARs). However, very long ARs require more than one cyclone to be maintained before the moisture is released as precipitation [9]. Some studies consider that ARs are portions of the EC system [12,13,14,15]. Furthermore, Gimeno et al. [16] pointed out that ARs are associated with the pre-cold frontal region and the warm conveyor belt [17] of ECs.
ECs transport and distribution processes have been broadly discussed, as well as the origin of their moisture. Stohl and James [18] investigated an extreme precipitation event over Europe associated with an EC, identifying the Mediterranean Sea as the major evaporation source region of the water that became precipitation. These authors, also, identified that the trajectories of the particles involved in the EC describe pathways from North Africa, which gained moisture over Argelia and Mediterranean Sea. Dacre et al. [15] used the water vapor budget of 200 ECs to determine that tropical moisture reaching the extratropics only contributes to mid-level moisture, above the boundary layer. Additionally, Zhao et al. [10], for a heavy snowstorm over northeastern China, caused by an EC featuring a back-bent warm front structure, found that the moisture mainly comes from the middle and lower troposphere.
Specifically, in the Iberian Peninsula (IP), where 85% of recorded precipitation and wind-extreme events are clearly associated with ECs [19], western IP coasts are the areas most exposed to ECs [20]. According to the results in Hénin et al. [19], in this region the winter climatological is mostly driven by the North Atlantic flux and moisture transport. Moreover, Eiras-Barca et al. [21] studied an explosive cyclogenesis occurring in October 1987 northwest to the IP. The related AR event resulted in record winds of 100 km h−1 and daily precipitation of over 100 mm day−1 in Galicia (on the northwestern corner of the IP) and Portugal. The authors discovered, for this event, that more than 60% of the resulting precipitation was of tropical origin.
To estimate moisture sources and sinks, several authors have used Lagrangian and Eulerian moisture tracking models extensively. The Lagrangian technique is able to track the particle transport routes and moisture gain/loss along the trajectories, while Eulerian ones have limitations to clarify the moisture sources and processes affecting moisture accumulation (see Gimeno et al. [22] and references therein). The Lagrangian approach has been widely applied to understand the hydrological cycle in more than a few regions around the world, e.g., [10,18,23,24,25,26,27,28,29,30,31,32].
Considering that the origin of moisture in ECs is still an important discussion, the aim of this work was to investigate the moisture sources for the explosive cyclogenesis Miguel developed over the North Atlantic on 4–9 June 2019 through a Lagrangian backward-trajectory technique. We selected the EC Miguel as the case of study due to its significant impact in the region [33], and the alarming projections of natural hazards attributed to these types of meteorological systems [34,35,36,37].
According to the Spanish Agency of Meteorology (AEMET, spanish acronym) [33], when Miguel moving towards the east, in the North Atlantic, it underwent an explosive cyclogenesis near the Galicia coast. Later, Miguel moved quickly towards France and the British Isles. Finally, it continued moving to the northwest until it reached Scandinavia, where it completed its life cycle. Among the ECs that have affected Europe in the May–June period from 1979 to 2019, Miguel is considered peculiar because it exhibits an unusual explosive cyclogenesis and a very exceptional track record for this type of event during this period of the year [38].

2. Materials and Methods

2.1. Data

In this study, we used the European Center for Medium-Range Weather Forecasts (ECMWF) ERA-5 reanalysis [39] and ERA-Interim reanalysis [40]. The FLEXPART model [41] was forced by ERA-Interim data with horizontal grid spacing of 1° of latitude by longitude and 61 vertical levels, from 1000 to 0.1 hPa. From ERA-5, we extracted the geopotential height data at the constant pressure level of 1000 hPa (z1000), Vertically Integrated Moisture Flux divergence (VIMF), and the sea-level pressure every 6 h (0000, 0600, 1200, and 1800 UTC), on a regular latitude longitude grid 0.25° in horizontal resolution.

2.2. FLEXPART Simulations

To investigate the moisture sources for EC Miguel, the outputs from the Lagrangian particle dispersion model FLEXPART v9.0 [41] were used from 0000 UTC 4 June to 1800 UTC 9 June. The global model simulated the trajectory of approximately 2.0 million particles homogeneously distributed in the atmosphere. Particles were then allowed to move freely with the winds for the duration of the simulation [18]. Model global outputs were obtained every 6 h on the initial grid resolution (1° × 1°).

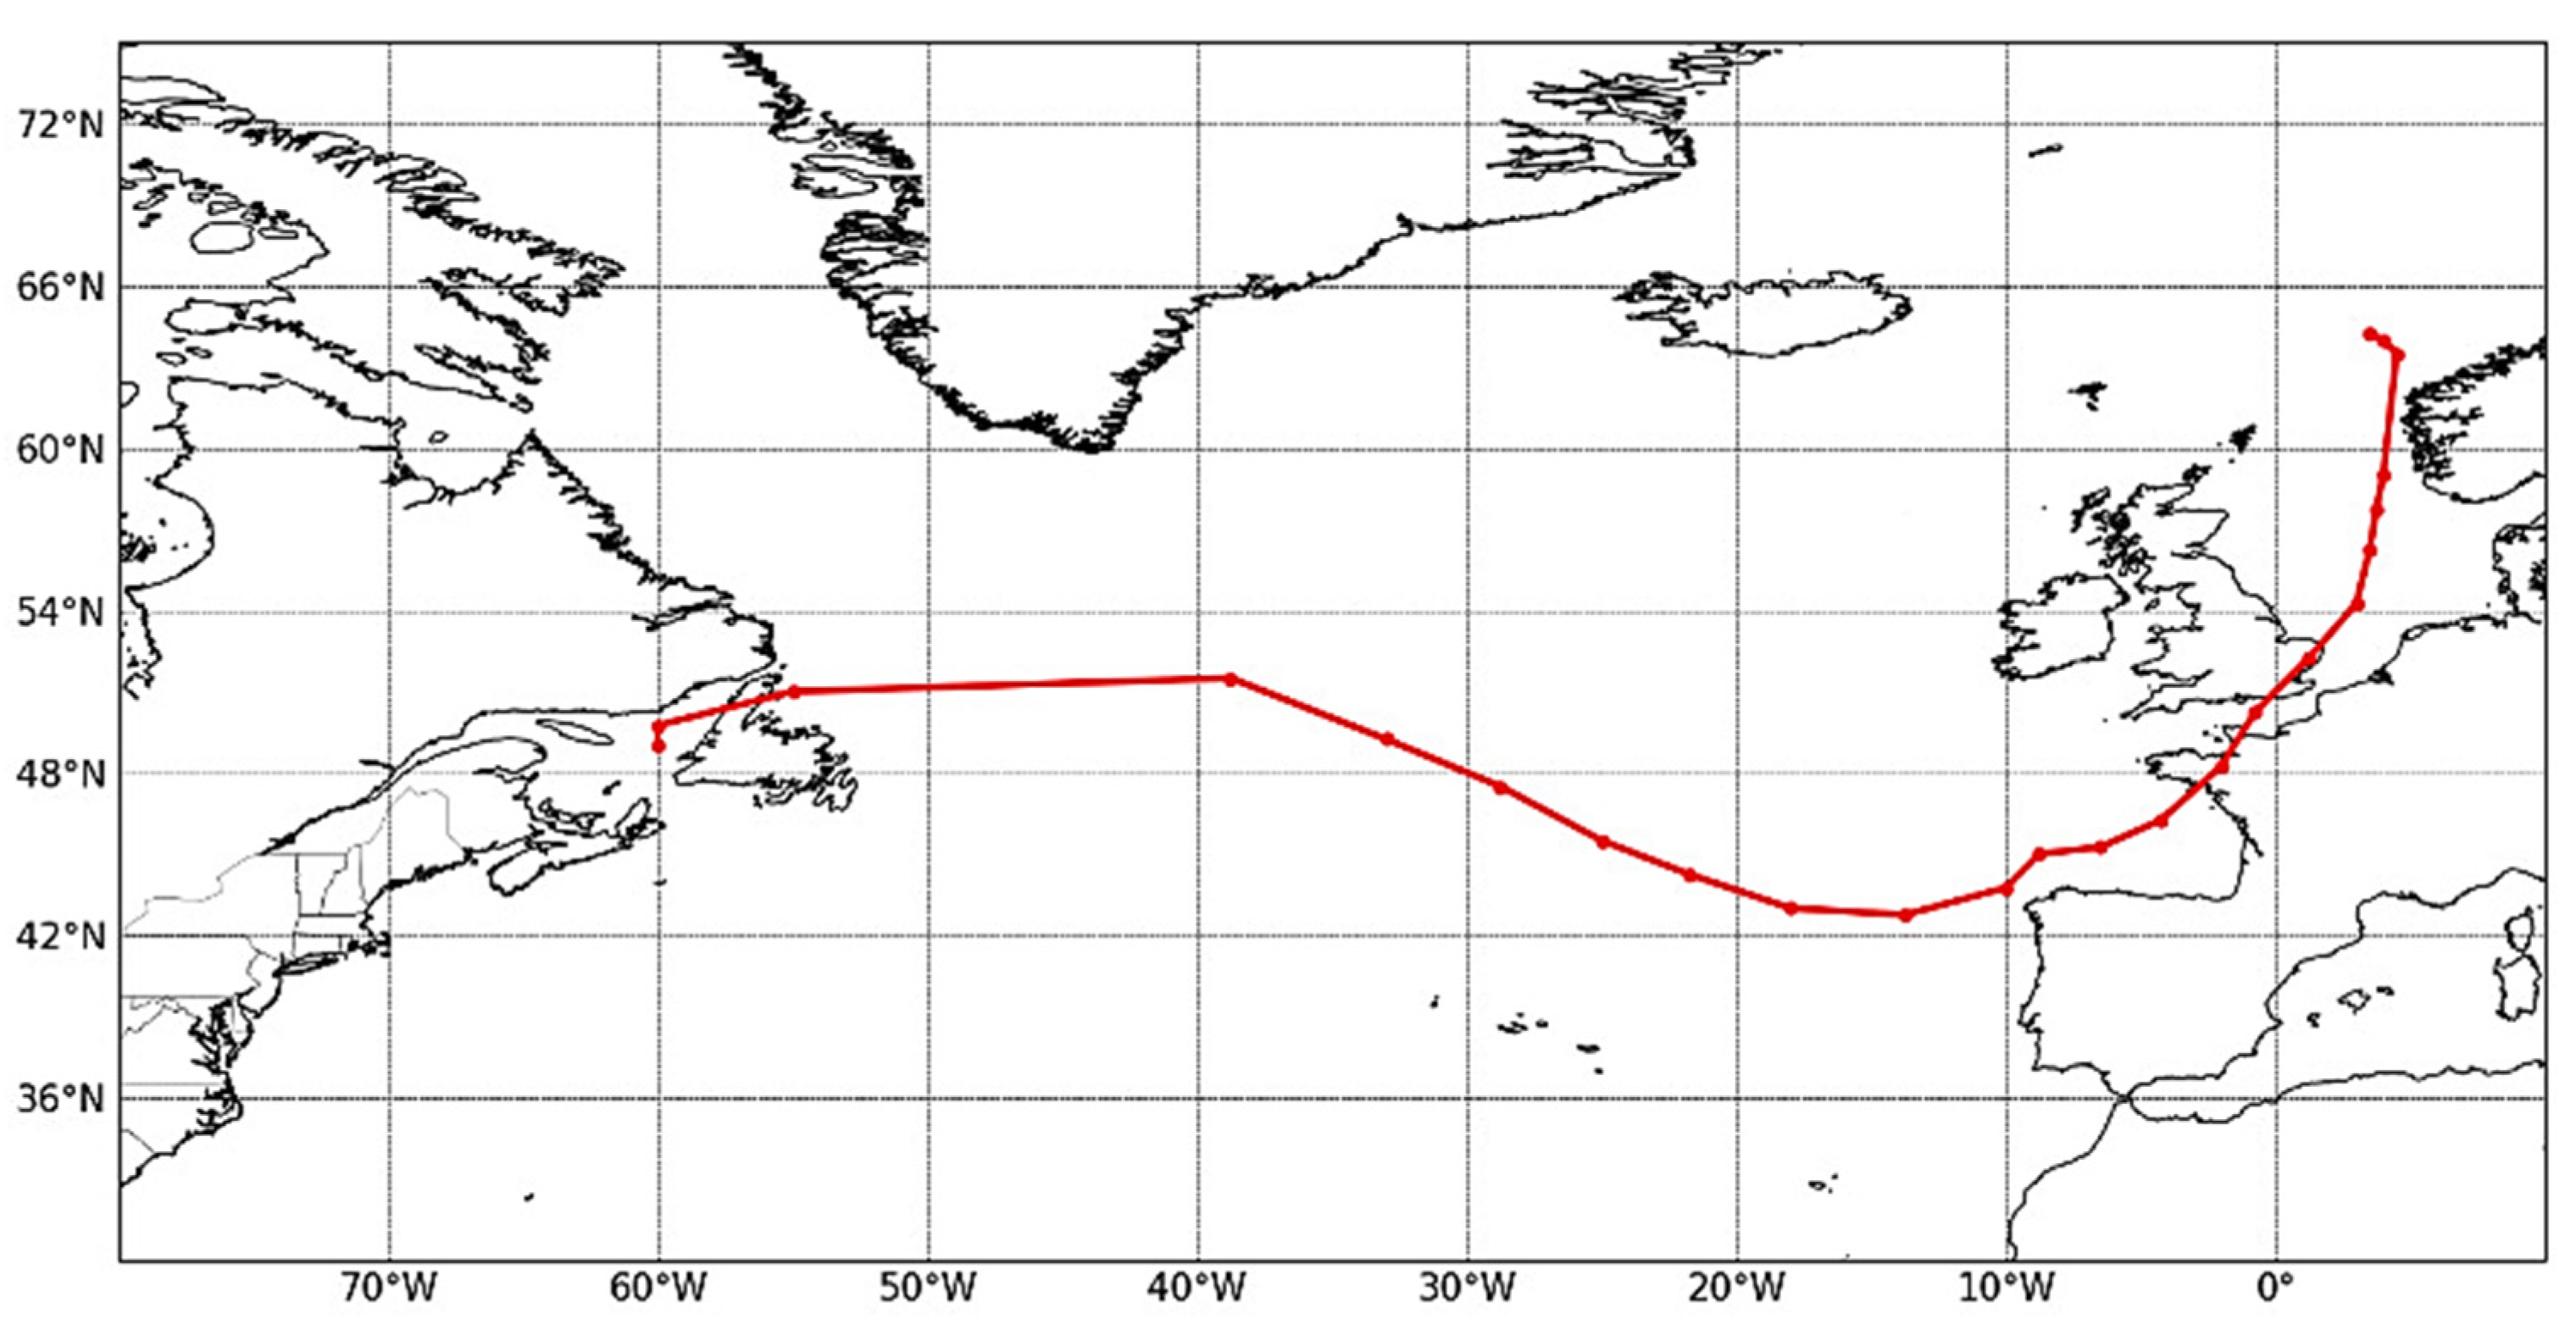
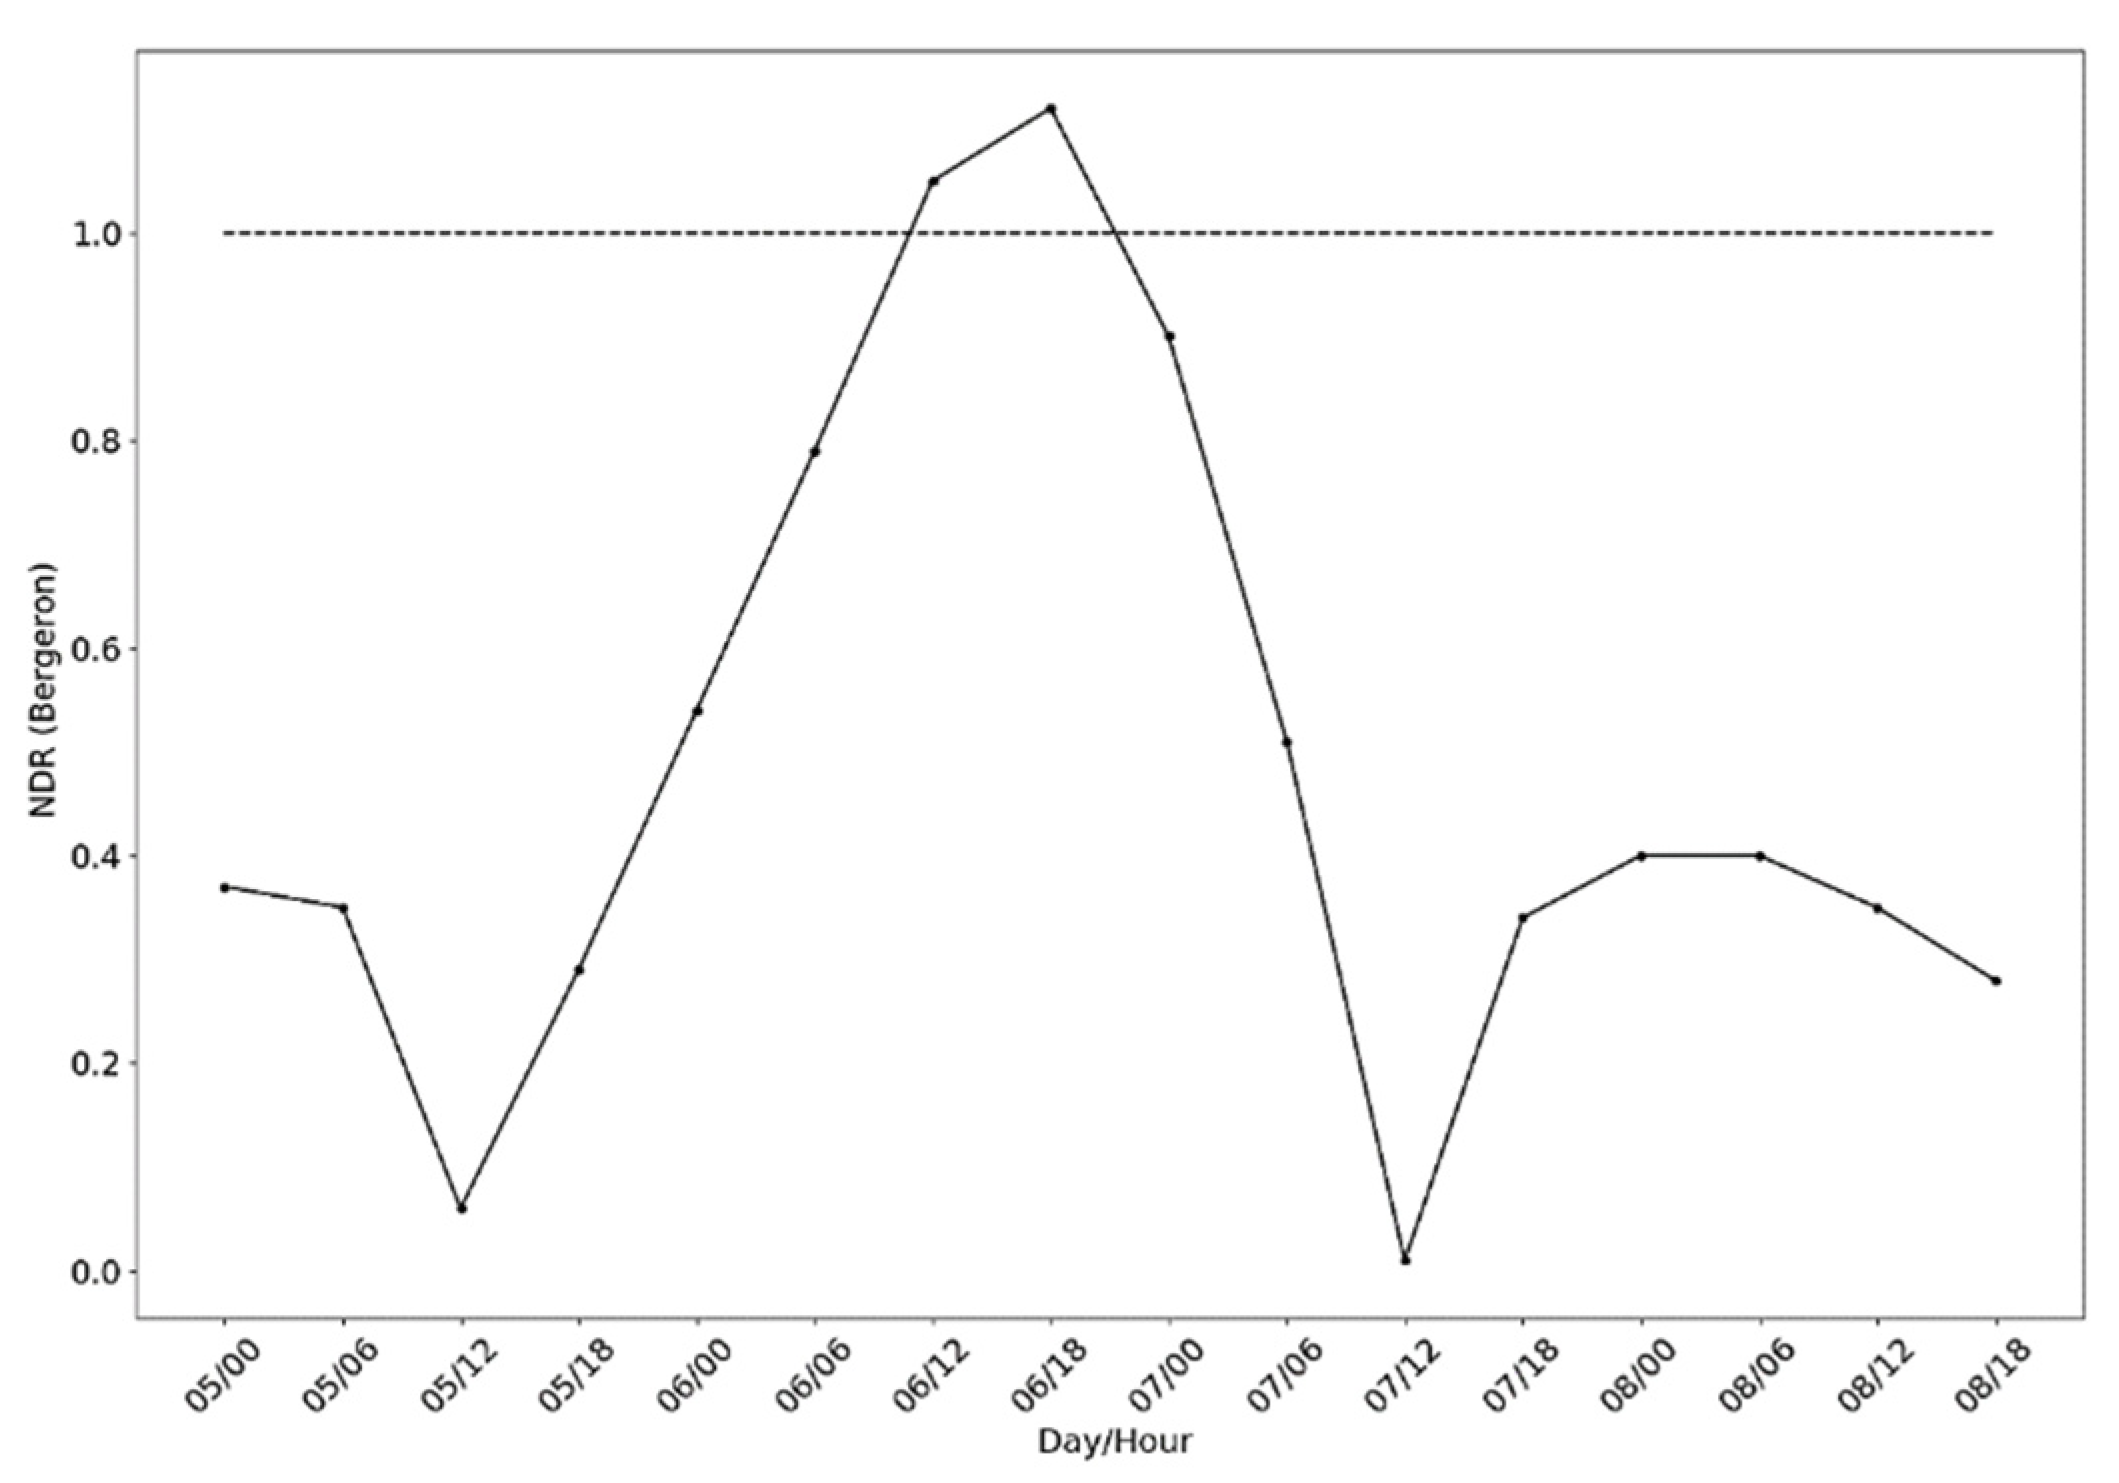
2.3. Trajectory of the Explosive Cyclogenesis Miguel and Characteristic

Using the University of Hamburg approach [42], the EC center was determined as local minima in the geopotential 1000 hPa field. The radius from Miguel center was set to 400 km, in accordance with the results of Pepler and Dowdly [43]. Figure 1 shows the trajectory of Miguel from 0000 UTC 5 June to 1800 UTC 9 June.
To estimate the period of explosive cyclogenesis, the normalized deepening rate (NDR) criterion of Sanders and Gyakum [44] was applied. These authors proposed an EC as explosive cyclogenesis when the surface pressure drop in the center of the low was higher than 24 hPa in 24 h, at a normalized latitude of 60° N, following Equation (1):
N D R = Δ p 24 · sin 60 sin φ > 1   B e r g e r o n
where Δ p is the pressure drop in hPa in 24 h; and   φ is the mean latitude (in degrees) of the center of the cyclone during the 24 h period.
Figure 2 shows that the NDR exceeded, by the first time, the limit value of 1 at 1200 UTC on 6 June. This suggests that the explosive cyclogenesis started from 5 June at 1200 UTC, intensifying even more still 18 UTC 6 June, and it occurred over the North Atlantic Ocean near northwest IP, as is shown in Figure 3b. Naray [38] showed that the intensification of Miguel was favored by the presence at low levels of a baroclinic region and an intense AR. At high levels, atmospheric conditions were characterized by a local intensification of the Jet Streak in western Europe, and a possible downstream development caused by the existence of a quasi-stationary Rossby wave in the North Atlantic.

2.4. Lagrangian Moisture Budget Diagnostic

Following Stohl and James [18], from the FLEXPART output, changes in specific humidity over time (dq/dt) were used to diagnose the moisture budget of a particle. The net rate of change of the water vapor content of a particle was estimated as:
e p = m d q d t
where (ep) represents the freshwater flux in the parcel.
The sum of all the (ep) values for all particles residing in a specific atmospheric column over an area A represents the surface freshwater flux over   A . It was computed as:
E P k = 1 K ( e p ) A
where E is the evaporation rate per unit area and P is the precipitation rate per unit area. It is possible to identify the regions where particles either gained (E − P > 0) or lost (E − P < 0) moisture along their path towards the selected area. The enclosed area by the radius of each EC Miguel track position was selected as the target region for the analysis of their moisture sources. Thus, the particles within this contour were tracked backward in time up to 10 days, which is typically used in the Lagrange approach as the estimated residence time of the water vapor in the atmosphere [45,46].

3. Results and Discussion

Figure 3a shows the moisture uptake 24 h previous to the explosive cyclogenesis phase. The E − P > 0 field shows that the western North Atlantic Ocean (close to the Bahamas Archipelago), the south-eastern coast of Greenland, and the North Atlantic Ocean around 45° N of latitude were the main moisture sources for the EC. Moreover, a weak contribution was identified in the continental United States of. The moisture uptake from oceanic moisture sources (50.25%) was almost similar to terrestrial sources’ contribution (49.74%) in the 24 h previous to Miguel’s explosive cyclogenesis. Nevertheless, during the intensification, the oceanic moisture contribution was 13% higher than terrestrial one. Moreover, the North Atlantic Subtropical High-Pressure system (NASH) circulation was identified as the moisture-transport mechanism from the lower latitudes, as reinforced the VIMF for both periods, 24 h previous explosive cyclogenesis (Figure 3a) and during the intensification (Figure 3b).
Furthermore, during the explosive cyclogenesis time, the moisture uptake composite pattern from 1200 UTC 5 June to 1200 UTC 6 June (Figure 3b) exhibited local evaporation and water vapor coming from the north near Greenland as stronger sources, although it the moisture contribution from the southeast USA and the western North Atlantic is notable. In general, the Lagrangian analysis suggested that a local intensification of moisture uptake was an important moisture source during this period. Similarly, Eiras-Barca et al. [21] suggested that the vast majority of the moisture in an extratropical explosive cyclogenesis which occurred just off the coast of Galicia had its origin in the tropical regions and local sources occurring along the frontal region.
Figure 4a shows moisture uptake anomalies 24 h before the explosive cyclogenesis. It is important to note that more atmospheric humidity amount was absorbed before intensification. This moisture uptake pattern is also observed along Greenland’s coast, the western North Atlantic, the Gulf of Mexico, and over continental North America during EC intensification.
During the intensification of Miguel (Figure 4b), an increase in positive moisture uptake anomalies was observed along the southeast coast of Greenland, in the Atlantic Ocean under Miguel’s circulation, and a decrease in positive moisture uptake anomalies in the western Atlantic, the Gulf of Mexico, and over North America. According to Naray [38], the cyclone traveled through a jet stream crossing Greenland in a Northwest-Southeast direction. At the end of the intensification process, Miguel was inside a trough at high levels. This trough originated from the rupture of extensive cyclonic waves that caused the intensification of the jet stream and his movement towards the Equator [38], probably starting a higher transport of moisture from the southeastern Greenland coast region.

4. Conclusions

In this study, the moisture sources for the explosive cyclogenesis of the extratropical cyclone (EC) Miguel developed over the North Atlantic on 4–9 June 2019 were investigated through a Lagrangian backward-trajectory technique. From computing the normalized deepening rate (NDR), it was identified that the explosive cyclogenesis occurred from 5 June at 1200 UTC to 6 June at 1200 UTC, but the intensification process continued still to 6 June at 1800 UTC. Moreover, we investigated moisture sources regions from the composite of (EP) > 0 during EC Miguel’s explosive cyclogenesis and 24 h beforehand.
The Lagrangian analysis revealed the western North Atlantic Ocean, close to the Bahamas Archipelago, the south-eastern coast of Greenland, and the North Atlantic Ocean around 45° N of latitude as the main moisture sources for Miguel’s development. Additionally, our results suggested that the local intensification region was an important moisture source during Miguel’s intensification. Furthermore, the positive moisture uptake anomalies in the southeast of Greenland’s coasts during explosive cyclogenesis are notable, and probably linked to the intensification of the jet stream and Miguel’s movement towards the Equator. Furthermore, a distinctive feature during Miguel’s explosive cyclogenesis was the moisture contribution from oceanic sources.

Author Contributions

P.C.-H., A.P.-A., R.N. and L.G. conceived the idea of the study; P.C.-H., J.C.F.-A., and A.P.-A. processed the data and created the figures. P.C-.H. carried out the formal analysis and wrote the first draft of the manuscript. All authors have read and agreed to the published version of the manuscript.

Funding

The LAGRIMA project (grant no. RTI2018-095772-B-I00) was funded by the Ministerio de Ciencia, Innovación y Universidades, Spain. Partial support was also obtained from the Xunta de Galicia under the project “Programa de Consolidación e Estructuración de Unidades de Investigación Competitivas (Grupos de Referencia Competitiva)” (no. ED431C 2017/64-GRC). Both programs are co-funded by FEDER (European Regional Development Fund (ERDF)) by the European Union.

Institutional Review Board Statement

Not applicable.

Informed Consent Statement

Not applicable.

Data Availability Statement

The datasets used in this study are freely available on internet. The ERA-5 reanalysis datasets were extracted from ECMWF web, available online: https://www.ecmwf.int/en/forecasts/datasets/reanalysis-datasets/era5 (accessed on 21 March 2021) and the ERA-Interim are public at ECMWF datasets, available online: https://www.ecmwf.int/en/forecasts/datasets/reanalysis-datasets/era-interim. The FLEXPART outputs to reproduce our results are available upon request.

Acknowledgments

Authors would like to thank Copernicus for freely available ERA5 and ERA-Interim reanalysis datasets. A.P.-A. acknowledges support from UVigo PhD grants. J.C.F.-A. acknowledge support from the Xunta de Galicia (Galician Regional Government) under the grants No. ED481A-2020/193. We also thank Xunta de Galicia under the Project ED431C 2021/44 (Programa de Consolidación e Estructuración de Unidades de Investigación Competitivas (Grupos de Referencia Competitiva) and Consellería de Cultura, Educación e Universidade).

Conflicts of Interest

The authors declare no conflict of interest.

References

  1. Leckebusch, G.C.; Ulbrich, U. On the relationship between cyclones and extreme windstorm events over Europe under climate change. Glob. Planet. Chang. 2004, 44, 181–193. [Google Scholar] [CrossRef]
  2. Pfahl, S.; Wernli, H. Quantifying the Relevance of Cyclones for Precipitation Extremes. J. Clim. 2012, 25, 6770–6780. [Google Scholar] [CrossRef]
  3. Reale, M.; Lionello, P. Synoptic climatology of winter intense precipitation events along the Mediterranean coasts. Nat. Hazards Earth Syst. Sci. 2013, 13, 1707–1722. [Google Scholar] [CrossRef]
  4. Pfahl, S. Characterising the relationship between weather extremes in Europe and synoptic circulation features. Nat. Hazards Earth Syst. Sci. 2014, 14, 1461–1475. [Google Scholar] [CrossRef] [Green Version]
  5. Raveh-Rubin, S.; Catto, J.L. Climatology and dynamics of the link between dry intrusions and cold fronts during winter, Part II: Front-centred perspective. Clim. Dyn. 2019, 53, 1893–1909. [Google Scholar] [CrossRef] [PubMed] [Green Version]
  6. Dowdy, A.J.; Catto, J.L. Extreme weather caused by concurrent cyclone, front and thunderstorm occurrences. Sci. Rep. 2017, 7, 1–8. [Google Scholar] [CrossRef] [Green Version]
  7. Chang, E.K.M.; Lee, S.; Swanson, K.L. Storm Track Dynamics. J. Clim. 2002, 15, 2163–2183. [Google Scholar] [CrossRef] [Green Version]
  8. Hawcroft, M.K.; Shaffrey, L.C.; Hodges, K.I.; Dacre, H.F. How much Northern Hemisphere precipitation is associated with extratropical cyclones? Geophys. Res. Lett. 2012, 39. [Google Scholar] [CrossRef] [Green Version]
  9. Ekrem, P.A. NAWDEX Case Study: Water Vapor Transport in Atmospheric Rivers and Quantifying Hand Over of Moisture between Extratropical Cyclones. Master’s Thesis, University of Bergen, Bergen, Norway, 25 September 2020. [Google Scholar]
  10. Zhao, Y.; Fu, L.; Yang, C.-F.; Chen, X.-F. Case Study of a Heavy Snowstorm Associated with an Extratropical Cyclone Featuring a Back-Bent Warm Front Structure. Atmosphere 2020, 11, 1272. [Google Scholar] [CrossRef]
  11. Sodemann, H.; Stohl, A. Moisture Origin and Meridional Transport in Atmospheric Rivers and Their Association with Mul-tiple Cyclones. Mon. Wea. Rev. 2013, 141, 2850–2868. [Google Scholar] [CrossRef] [Green Version]
  12. Ralph, F.M.; Neiman, P.J.; Wick, G.A. Satellite and CALJET aircraft observations of atmospheric rivers over the eastern North Pacific Ocean during the winter of 1997/98. Mon. Wea. Rev. 2004, 132, 1721–1745. [Google Scholar] [CrossRef] [Green Version]
  13. Bao, J.W.; Michelson, S.A.; Neiman, P.J.; Ralph, F.M.; Wilczak, J.M. Interpretation of Enhanced Integrated Water Vapor Bands Associated with Extratropical Cyclones: Their Formation and Connection to Tropical Moisture. Mon. Weather. Rev. 2006, 134, 1063–1080. [Google Scholar] [CrossRef]
  14. Neiman, P.J.; Ralph, F.M.; Wick, G.A.; Lundquist, J.D.; Dettinger, M.D. Meteorological Characteristics and Overland Precipitation Impacts of Atmospheric Rivers Affecting the West Coast of North America Based on Eight Years of SSM/I Satellite Observations. J. Hydrometeorol. 2008, 9, 22–47. [Google Scholar] [CrossRef]
  15. Dacre, H.F.; Clark, P.A.; Martínez-Alvarado, O.; Stringer, M.A.; Lavers, D.A. How Do Atmospheric Rivers Form? Bull. Am. Meteorol. Soc. 2015, 96, 1243–1255. [Google Scholar] [CrossRef]
  16. Gimeno, L.; Dominguez, F.; Nieto, R.; Trigo, R.; Drumond, A.; Reason, C.J.; Taschetto, A.S.; Ramos, A.M.; Kumar, R.; Marengo, J. Major Mechanisms of Atmospheric Moisture Transport and Their Role in Extreme Precipitation Events. Annu. Rev. Environ. Resour. 2016, 41, 117–141. [Google Scholar] [CrossRef] [Green Version]
  17. Wernli, B.H.; Davies, H.C. A Lagrangian-based analysis of extratropical cyclones. I: The method and some applications. Q. J. R. Meteorol. Soc. 1997, 123, 467–489. [Google Scholar] [CrossRef]
  18. Stohl, A.; James, P.A. Lagrangian analysis of the atmospheric branch of the global water cycle. Part I: Method description, validation, and demonstration for the August 2002 flooding in central Europe. J. Hydrometeorol. 2004, 5, 656–678. [Google Scholar] [CrossRef]
  19. Hénin, R.; Ramos, A.M.; Pinto, J.G.; Liberato, M.L.R. A ranking of concurrent precipitation and wind events for the Iberian Peninsula. Int. J. Clim. 2021, 41, 1421–1437. [Google Scholar] [CrossRef]
  20. Eiras-Barca, J.; Lorenzo, N.; Taboada, J.; Robles, A.; Miguez-Macho, G. On the relationship between atmospheric rivers, weather types and floods in Galicia (NW Spain). Nat. Hazards Earth Syst. Sci. 2018, 18, 1633–1645. [Google Scholar] [CrossRef] [Green Version]
  21. Eiras-Barca, J.; Dominguez, F.; Hu, H.; Garaboa-Paz, D.; Miguez-Macho, G. Evaluation of the moisture sources in two extreme landfalling atmospheric river events using an Eulerian WRF tracers tool. Earth Syst. Dyn. 2017, 8, 1247–1261. [Google Scholar] [CrossRef] [Green Version]
  22. Gimeno, L.; Stohl, A.; Trigo, R.; Dominguez, F.; Yoshimura, K.; Yu, L.; Drumond, A.; Durán-Quesada, A.M.; Nieto, R. Oceanic and terrestrial sources of continental precipitation. Rev. Geophys. 2012, 50. [Google Scholar] [CrossRef]
  23. Nieto, R.; Trigo, R.M.; Gimeno, L. A Lagrangian identification of major sources of Sahel moisture. Geophys. Res. Lett. 2006, 33. [Google Scholar] [CrossRef]
  24. Drumond, A.; Nieto, R.; Gimeno, L.; Ambrizzi, T. A Lagrangian identification of major sources of moisture over Central Brazil and La Plata Basin. J. Geophys. Res. Space Phys. 2008, 113. [Google Scholar] [CrossRef] [Green Version]
  25. Gimeno, L.; Drumond, A.; Nieto, R.; Trigo, R.; Stohl, A. On the origin of continental precipitation. Geophys. Res. Lett. 2010, 37, 13804. [Google Scholar] [CrossRef]
  26. Durán-Quesada, A.; Reboita, M.; Gimeno, L. Precipitation in tropical America and the associated sources of moisture: A short review. Hydrol. Sci. J. 2012, 57, 612–624. [Google Scholar] [CrossRef]
  27. Gimeno, L.; Nieto, R.; Drumond, A.; Castillo, R.; Trigo, R. Influence of the intensification of the major oceanic moisture sources on continental precipitation. Geophys. Res. Lett. 2013, 40, 1443–1450. [Google Scholar] [CrossRef]
  28. Drumond, A.; Marengo, J.; Ambrizzi, T.; Nieto, R.; Moreira, L.; Gimeno, L. The role of the Amazon Basin moisture in the atmospheric branch of the hydrological cycle: A Lagrangian analysis. Hydrol. Earth Syst. Sci. 2014, 18, 2577–2598. [Google Scholar] [CrossRef] [Green Version]
  29. Ramos, A.M.; Nieto, R.; Tomé, R.; Gimeno, L.; Trigo, R.; Liberato, M.L.R.; Lavers, D.A. Atmospheric rivers moisture sources from a Lagrangian perspective. Earth Syst. Dyn. 2016, 7, 371–384. [Google Scholar] [CrossRef] [Green Version]
  30. Gozzo, L.F.; Da Rocha, R.P.; Gimeno, L.; Drumond, A. Climatology and numerical case study of moisture sources associated with subtropical cyclogenesis over the southwestern Atlantic Ocean. J. Geophys. Res. Atmos. 2017, 122, 5636–5653. [Google Scholar] [CrossRef]
  31. Ordoñez, P.; Nieto, R.; Gimeno, L.; Ribera, P.; Gallego, D.; Ochoa-Moya, C.A.; Quintanar, A. Climatological moisture sources for the Western North American Monsoon through a Lagrangian approach: Their influence on precipitation intensity. Earth Syst. Dyn. 2019, 10, 59–72. [Google Scholar] [CrossRef] [Green Version]
  32. Zhao, N.; Manda, A.; Guo, X.; Kikuchi, K.; Nasuno, T.; Nakano, M.; Zhang, Y.; Wang, B. A Lagrangian View of Moisture Transport Related to the Heavy Rainfall of July 2020 in Japan: Importance of the Moistening Over the Subtropical Regions. Geophys. Res. Lett. 2021, 48, e2020GL091441. [Google Scholar] [CrossRef]
  33. Agencia Estatal de Meteorología. Available online: https://www.aemet.es/es/web/conocermas/borrascas/2018-2019/estudios_e_impactos/miguel (accessed on 12 March 2021).
  34. Pinto, J.G.; Zacharias, S.; Fink, A.H.; Leckebusch, G.C.; Ulbrich, U. Factors contributing to the development of extreme North Atlantic cyclones and their relationship with the NAO. Clim. Dyn. 2009, 32, 711–737. [Google Scholar] [CrossRef] [Green Version]
  35. Ulbrich, U.; Leckebusch, G.C.; Pinto, J.G. Extra-tropical cyclones in the present and future climate: A review. Theor. Appl. Clim. 2009, 96, 117–131. [Google Scholar] [CrossRef] [Green Version]
  36. Raible, C.C.; Messmer, M.; Lehner, F.; Stocker, T.F.; Blender, R. Extratropical cyclone statistics during the last millennium and the 21st century. Clim. Past 2018, 14, 1499–1514. [Google Scholar] [CrossRef] [Green Version]
  37. Catto, J.L.; Ackerley, D.; Booth, J.; Champion, A.J.; Colle, A.B.; Pfahl, S.; Pinto, J.; Quinting, J.; Seiler, C. The future of mid-latitude cyclones. Curr. Clim. Change Rep. 2019, 5, 407–420. [Google Scholar] [CrossRef] [Green Version]
  38. Naray, A. Estudio de la Excepcionalmente Tardía e Inusual Ciclogénesis Explosiva Miguel. Master’s Thesis, Universidad Com-plutense de Madrid, Madrid, Spain, 13 June 2020. [Google Scholar]
  39. Hersbach, H.; Bell, B.; Berrisford, P.; Hirahara, S.; Horányi, A.; Muñoz-Sabater, J.; Nicolas, J.; Peubey, C.; Radu, R.; Schepers, D.; et al. The ERA5 global reanalysis. Q. J. R. Meteorol. Soc. 2020, 146, 1999–2049. [Google Scholar] [CrossRef]
  40. Dee, D.P.; Uppala, S.M.; Simmons, A.J.; Berrisford, P.; Poli, P.; Kobayashi, S.; Andrae, U.; Balmaseda, M.A.; Balsamo, G.; Bauer, P.; et al. The ERA-Interim reanalysis: Configuration and performance of the data assimilation system. Q. J. R. Meteorol. Soc. 2011, 137, 553–597. [Google Scholar] [CrossRef]
  41. Stohl, A.; Forster, C.; Frank, A.; Seibert, P.; Wotawa, G. Technical note: The Lagrangian particle dispersion model FLEXPART version 6.2. Atmos. Chem. Phys. Discuss. 2005, 5, 2461–2474. [Google Scholar] [CrossRef] [Green Version]
  42. Blender, R.; Fraedrich, K.; Lunkeit, F. Identification of cyclone-track regimes in the North Atlantic. Q. J. R. Meteor. Soc. 1997, 123, 727–741. [Google Scholar] [CrossRef]
  43. Pepler, A.; Dowdy, A. A Three-Dimensional Perspective on Extratropical Cyclone Impacts. J. Clim. 2020, 33, 5635–5649. [Google Scholar] [CrossRef] [Green Version]
  44. Sanders, F.; Gyakum, J.R. Synoptic-Dynamic Climatology of the “Bomb”. Mon. Wea. Rev. 1980, 108, 1589–1606. [Google Scholar] [CrossRef] [Green Version]
  45. Numaguti, A. Origin and recycling processes of precipitating water over the Eurasian continent: Experiments using an at-mospheric general circulation model. J. Geophys. Res. 1999, 104, 1957–1972. [Google Scholar] [CrossRef]
  46. van der Ent, R.J.; Tuinenburg, O.A. The residence time of water in the atmosphere revisited. Hydrol. Earth Syst. Sci. 2017, 21, 779–790. [Google Scholar] [CrossRef] [Green Version]
Figure 1. Trajectory of the extratropical cyclone Miguel (2019) estimated as the minimum z1000 from 0000 UTC 4 June to 1800 UTC 9 June.
Environsciproc 08 00019 g001
Figure 2. The normalized deepening rate (NDR) computed every 6 h during EC Miguel’s (2019) life cycle.
Environsciproc 08 00019 g002
Figure 3. Composite of (EP) > 0 (blues) during (a) 24 h before EC Miguel’s explosive cyclogenesis, and (b) EC Miguel’s explosive cyclogenesis, from 1200 UTC 5 June to 1200 UTC 6 June. Arrows show the vertical integrated moisture flux (VIMF) from ERA-5. The orange line denotes the complete Miguel trajectory and the green line represents the analyzed Miguel track.
Environsciproc 08 00019 g003
Figure 4. Moisture uptake anomalies for EC Miguel (a) 24 h before the explosive cyclogenesis, and (b) during the explosive cyclogenesis, from 1200 UTC 15 June to 1200 UTC 6 June. The black line denotes Miguel’s trajectory and the green line represents the analyzed Miguel Track.
Environsciproc 08 00019 g004
Publisher’s Note: MDPI stays neutral with regard to jurisdictional claims in published maps and institutional affiliations.

