Proceeding Paper

Estimating the Exposure Levels of Quercus Pollen: A Case Study in the Greater Area of Thessaloniki, Greece †

Laboratory of Atmospheric Physics, School of Physics, Aristotle University of Thessaloniki, 54124 Thessaloniki, Greece
*
Author to whom correspondence should be addressed.
Presented at the 4th International Electronic Conference on Atmospheric Sciences, 16–31 July 2021; Available online https://ecas2021.sciforum.net/.
Environ. Sci. Proc. 2021, 8(1), 15; https://doi.org/10.3390/ecas2021-10326
Published: 22 June 2021
(This article belongs to the Proceedings of The 4th International Electronic Conference on Atmospheric Sciences)

Abstract

:
In this study the exposure levels from Quercus pollen in the greater area of Thessaloniki are estimated. The estimation is implemented with a modeling system, comprising the meteorological model WRF, the Natural Emissions Model (NEMO) for the calculation of the Quercus pollen emissions and the chemistry-transport model CAMx for the advection and the deposition of the pollen particles. The period of 2016 with the highest potential is selected, based on the available measurements for the area of interest. The modeling system is evaluated with meteorological and pollen measurements, as well on the expected exposure levels, indicating a satisfactory overall performance. The modeling system is finally utilized for the estimation of exposure levels in the greater area of Thessaloniki, showing that the city of is not going to experience significant number of days with high Quercus pollen concentrations, although other, smaller cities and towns might be affected.

1. Introduction

Pollen has a significant impact on human health, because of its allergenic subsistence [1]. They trigger a plethora of clinical diseases, such as hay fever and asthma [2]. Several epidemiological studies have shown that aeroallergen pollen can sensitize up to 50% of the population, especially in westernized societies [3,4,5,6,7]. Current estimations in Europe indicate that 170 million citizens suffer from asthma and allergenic rhinitis, with more than half of Europe’s population to expected to suffer from asthma by 2025 [8], while more than 300 million suffer from asthma and around half a billion from allergenic rhinitis [9]. The above emphasize the need for the monitoring and the forecasting of allergenic pollen, in order to protect the population and to improve the quality of life.
Several attempts have been made to monitor and forecast the pollen concentrations for various taxa. The approaches that followed are either observation or process-based models. The methods utilized are usually observation-based, correlating daily meteorological and pollen concentrations [10,11] in order to forecast the pollen intensity and the pollen concentrations. The process-based models, on the other hand, incorporate the physics of pollen emissions, as well their advection and deposition [12,13,14,15,16,17,18]. Although such models are more suitable for the estimation of the pollen, since observation-based are prone to problems related with the variable meteorological fields, their exploitation has started just recently.
In Europe, a significant effort is undertaken by the Copernicus Atmospheric Monitoring Service, utilizing several models that estimate the surface pollen concentrations from specific taxa, with as the aim the protection of the population of the EU [19,20]. Although useful, these products have three disadvantages: (1) they do not provide pollen for taxa that might be significant for a specific area; one such case is Quercus, which is abundant in the Mediterranean countries, such as Spain and Greece [21], (2) the models provide fields at 10 km spatial resolution, which might suffer from local meteorological conditions, such as mountain breezes [20], and (3) they do not provide exposure maps, an information easily understood by non-scientists.
The aim of this study is the creation of a high-resolution modeling system, which will be able to predict with accuracy the Quercus surface pollen concentrations and the respective exposure levels. The greater area of Thessaloniki in Greece has been selected for this purpose for the year 2016. The modeling system consists of three models in series: (a) the meteorological model WRF, which will drive the pollen emissions as well the advection of pollen [22], (b) the Natural Emissions MOdel (NEMO) for the Quercus pollen emissions [23,24,25] and (c) the photochemical model CAMx for the advection and the deposition [26]. The next section describes the modeling system, the measurements and the evaluation method. Section 3 presents the evaluation of the modeling systems’ output for the meteorological fields, the Quercus pollen concentrations and the exposure levels of the selected period. In Section 4, the spatial distribution of the exposure levels is discussed, while in Section 5, the main conclusions are summarized.

2. Materials and Methods

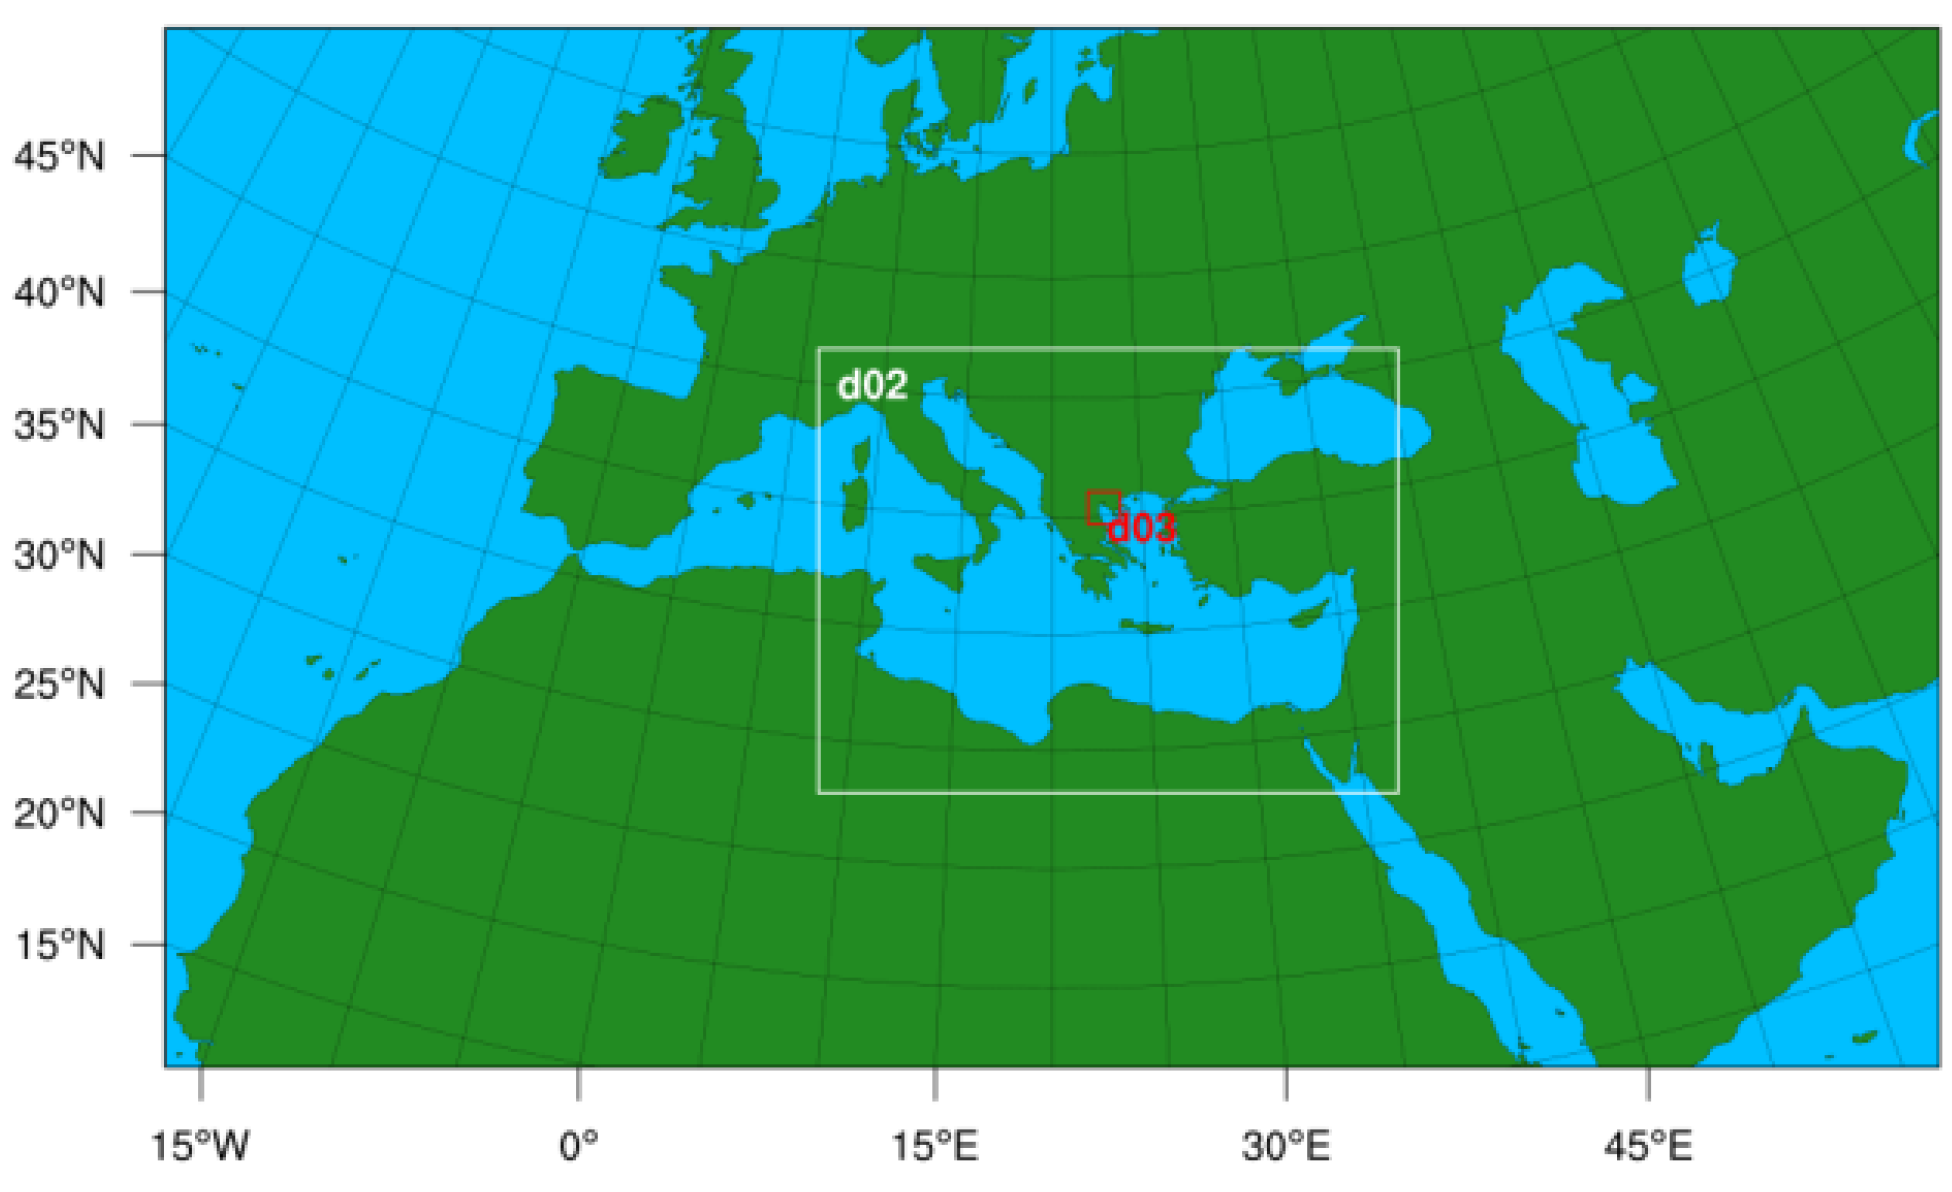
2.1. Modeling System

The meteorological conditions for the studied period over the greater area of Thessaloniki are produced with WRF v4.1 [22]. Three domains are incorporated in a nested way, as seen in Figure 1. The first domain (d01) covers the largest part of Europe, with a spatial resolution of 18 km, the second (d02) covers the southeastern Mediterranean, with a spatial resolution of 6 km, and the third (d03) covers the studied area, with a spatial resolution of 2 km. The ERA-5 are utilized for the initial and boundary conditions [27]. The simulations with WRF are performed in 4-day intervals, with a 12-h spin-up, producing hourly meteorological fields. The physics schemes used for these simulations are based on previous validated set up for the greater area of Thessaloniki [28].
For the calculation of the Quercus pollen emissions, the Natural Emissions MOdel (NEMO) will be used [23,24,25]. NEMO is driven by WRF meteorological fields, producing biogenic, sea salt and desert dust emissions on an hourly basis. In the framework of this study, NEMO is updated to include Quercus pollen emissions. The modifications made within NEMO include two components: a) the yearly available pollen grains/m2, here referred to as the pollen emission potential (PEP), and b) the physical mechanisms describing the pollen emissions. The derivation of the available Quercus pollen grains is realized with the aid of Quercus area fractions, provided by the European Forest Inventory [29] at a spatial resolution of 1 km. The area fractions of the Quercus taxa are then multiplied by 457 × 107 pollen grains/crown m2, deriving the final yearly available pollen grains. Then, the resultant PEP is reprojected to the three domains using the first-order area weighting method of CDO [30].
Concerning the physical mechanisms which will describe the pollen emissions, the scheme of Helbig [12] was chosen, with the inhibition factors of precipitation, wind and relative humidity from Sofiev [16]. The fraction of PEP for each day is calculated through a Gaussian distribution, following the phenology of Quercus from the available observations in Thessaloniki [17]. For the latter, the starting date, the date of maximum values and the ending date of Quercus pollen season is needed. Based on the observations and the 95% method for the derivation of phenology [31], the starting date corresponds to 23th of March, the maximum to 17th of April and the ending date to 15th of May for the year 2016. Bearing in mind the Quercus phenology, this period (23 March–15 May) was selected to perform the simulations with the modeling system.
The equation of pollen emissions within NEMO is as follows:
E p o l l e n ( x , y , t ) = c b f w f r f h γ P E P Δ z u *
where γ is the daily fraction of PEP, u* is the friction velocity, fw, fr and fh are the inhibition factors for wind, rain and humidity, respectively, as described in [16], Δz the first layer of the modeling system, equal to 28 m in this study, and cb is a constant equal to 10−4 [12].
For the simulation period mentioned above, the meteorological fields derived with WRF are introduced in the updated NEMO, and the Quercus pollen emission fields are produced. Then, the chemistry-transport model CAMx [26] is utilized for the estimation of the surface pollen concentration in the greater area of Thessaloniki. The simulations are performed with CAMx at INERT mode (no chemistry), using a particles’ diameter of 28 μm and density of 1040 kg/m3 [32]. The advection scheme of the Bott [33], the dry deposition of Zhang [34] and the wet deposition of Seinfeld and Pandis [35] were selected for this study, while zero initial and boundary conditions were applied. CAMx produces 3D hourly concentrations of the applied substances (i.e., pollen), and these will also be used for the evaluation of the modeling system, as well for the derivation of the exposure maps.

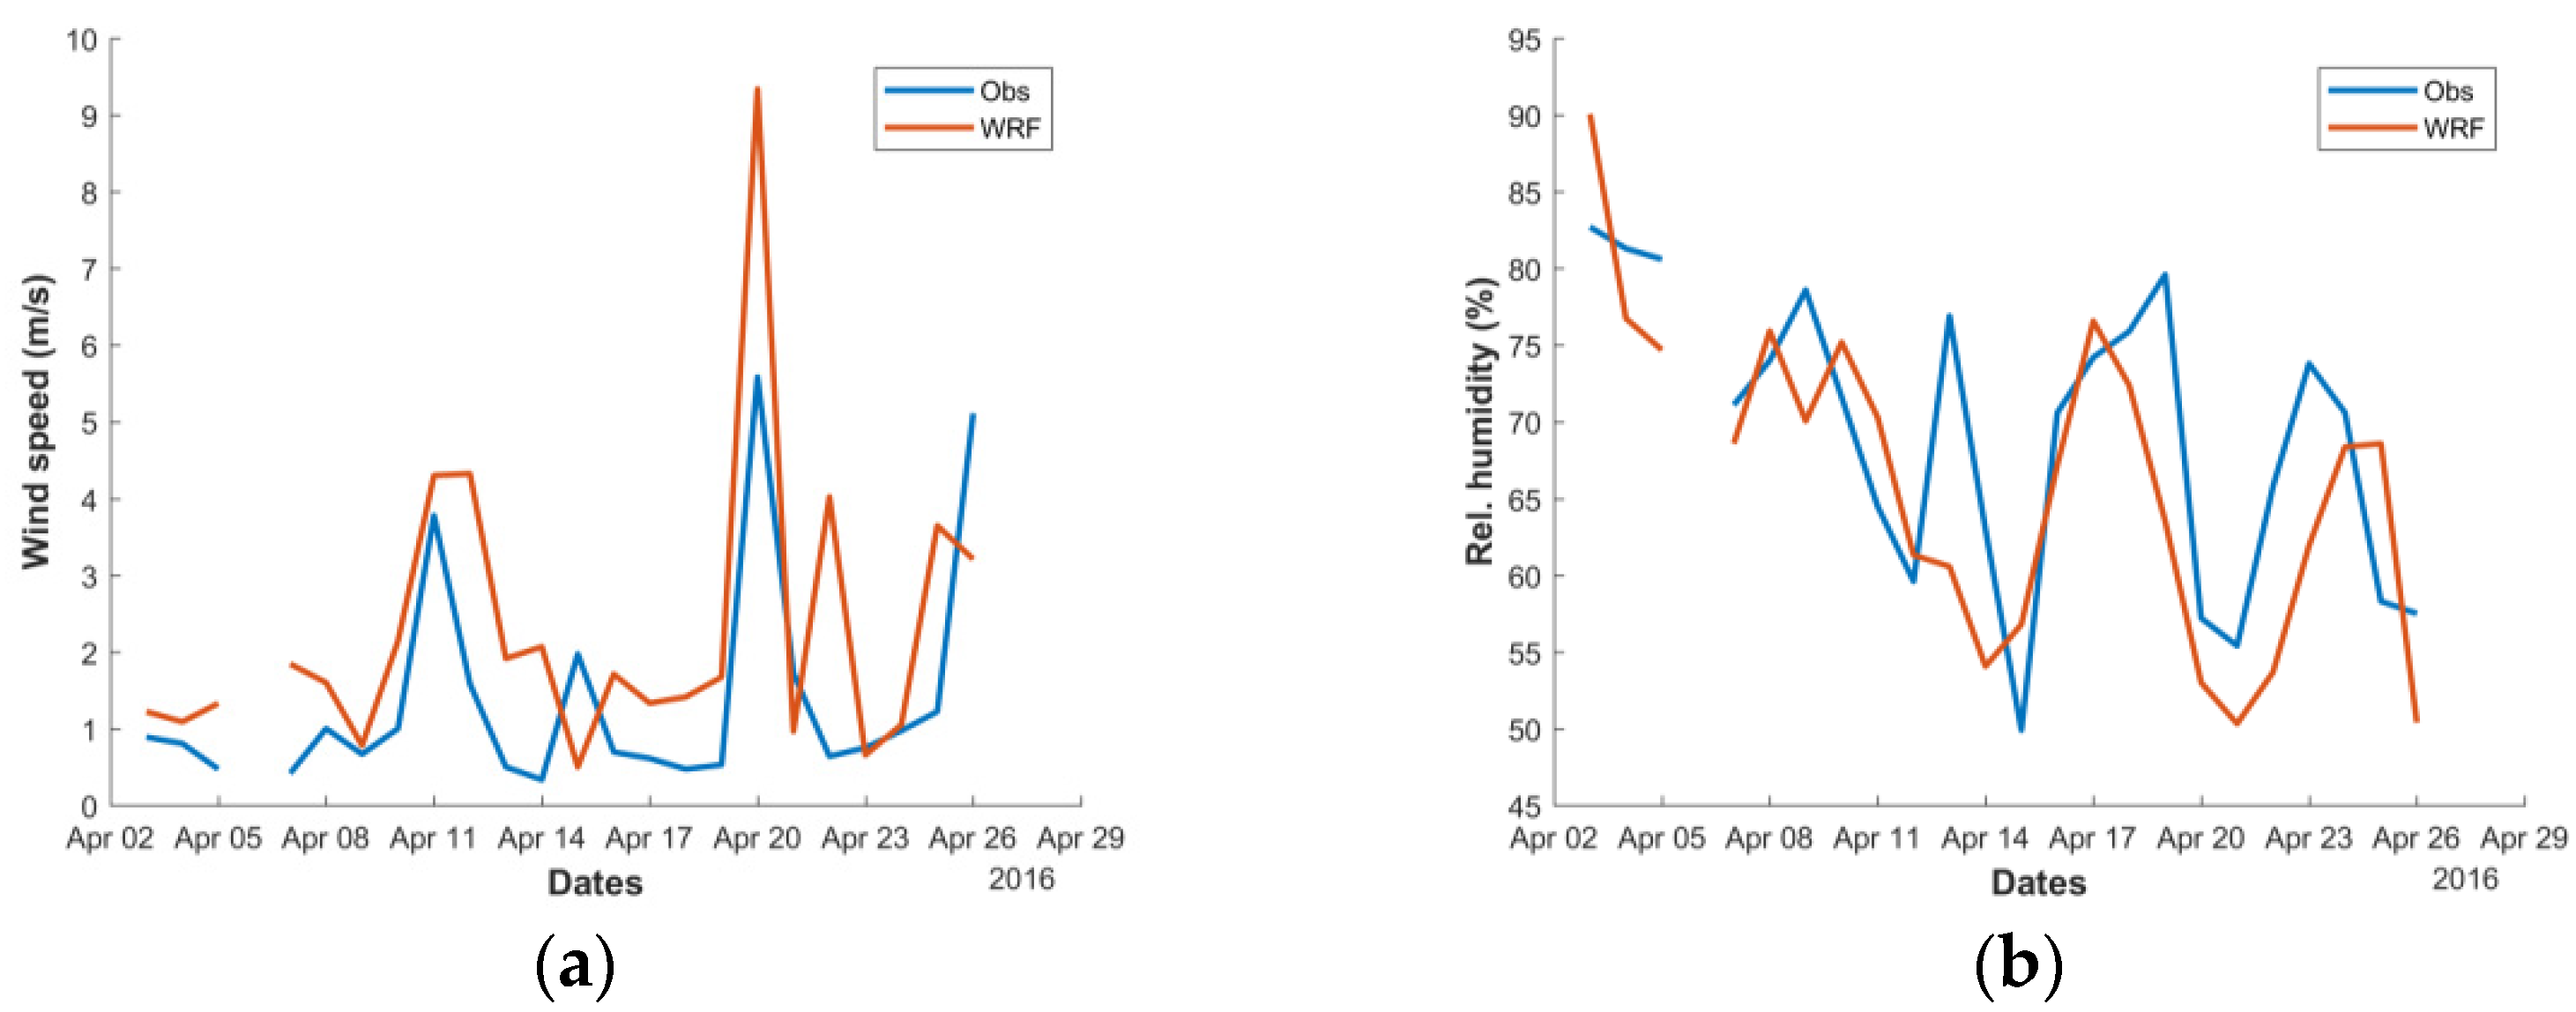
2.2. Measurements and Evaluation
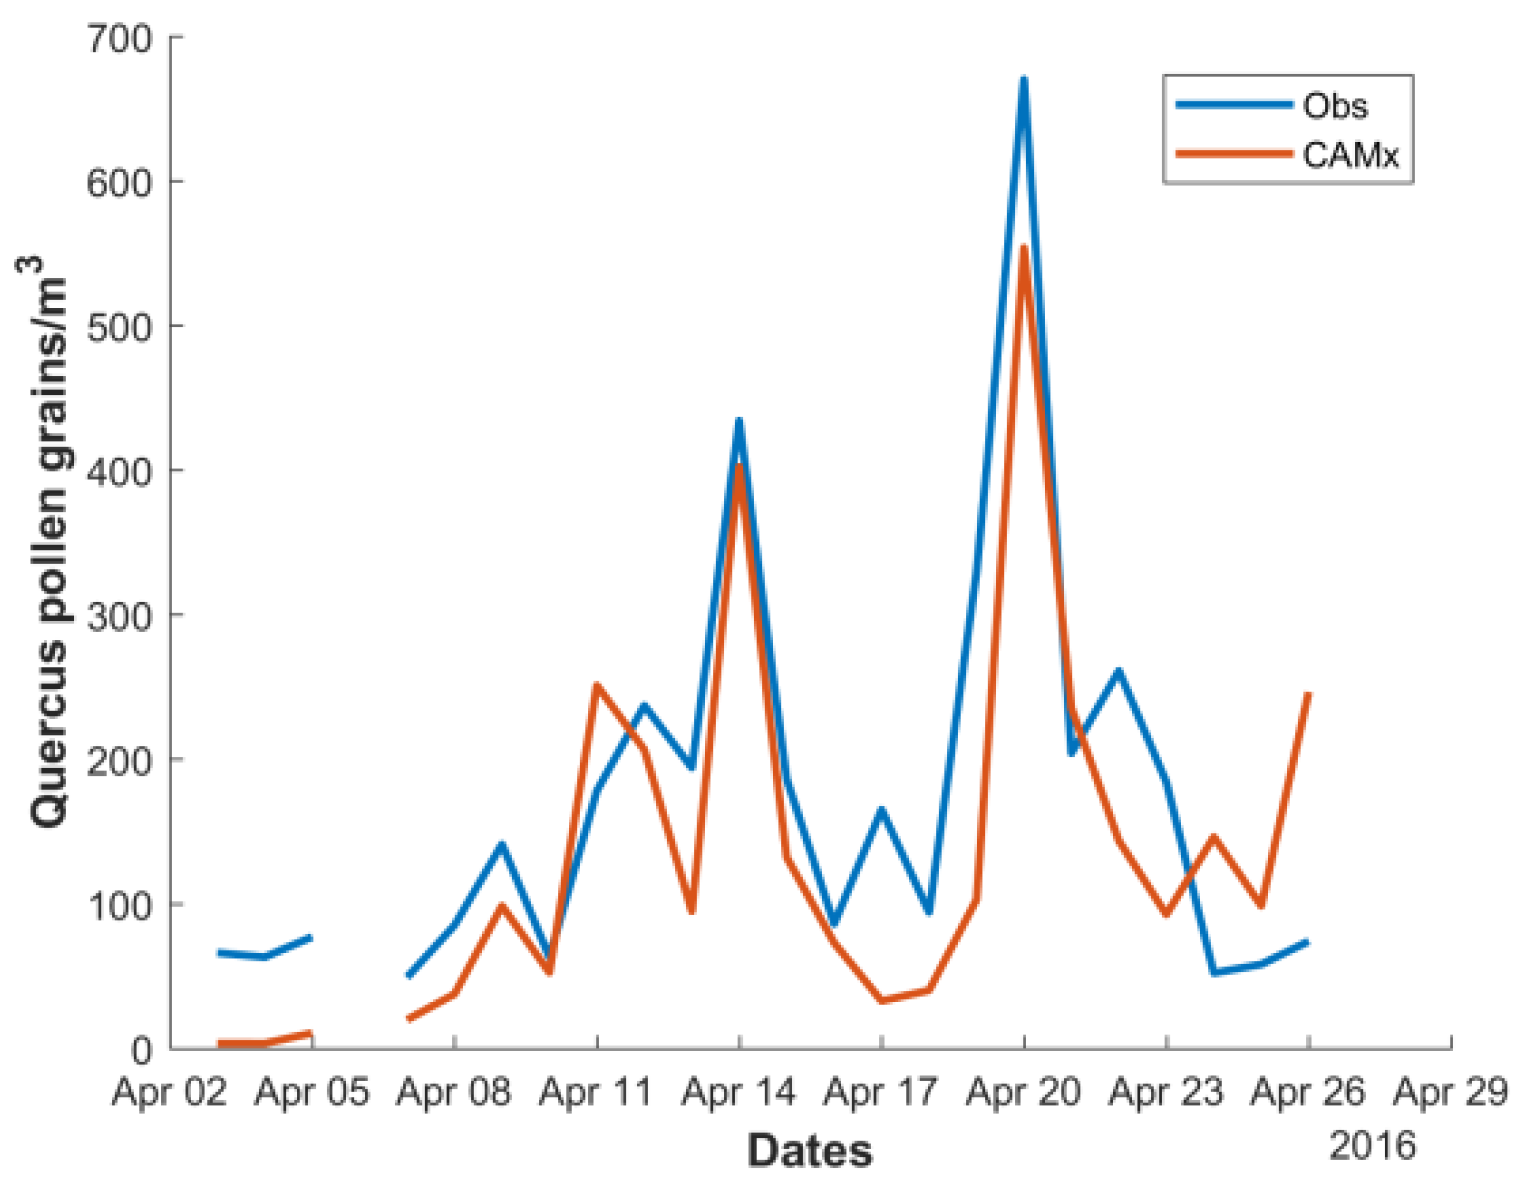
In order to test the reliability of the modeling system and the resultant exposure levels, we evaluated the meteorology, Quercus pollen concentrations and the exposure levels. Available daily measurements of meteorological parameters and concentration levels will be utilized near the urban areas of Thessaloniki. Concerning the meteorology, the station of the National Observatory of Athens (NOA) in Thessaloniki is used (40°35′07.9″ N 22°56′15.2″ E), provided by the CLIMPACT project [36]. The available meteorological variables used for the evaluation are the wind speed and the relative humidity, since these can promote or inhibit the pollen emission.
The respective daily Quercus pollen concentrations are taken from a station located at the Department of Biology at the Aristotle University of Thessaloniki (40°38′00.2″ N 22°57′27.0″ E), at 30 m a.g.l. This station operates continuously for more than 30 years [37,38], using a Bukard sampler, the standard pollen monitoring method [21,39]. Data from this station are also used to evaluate the exposure levels associate with the Quercus concentrations.
The derivation of the exposure levels from Quercus pollen is implemented with the aid of the method proposed by the Spanish aerobiology network (REA) [40], an area with a similar Mediterranean climate, considering that there is a lack of similar information for the Greek population in Thessaloniki. This method defines three exposure levels for Quercus pollen: (a) Low, with concentrations between 1–50 grains/m3, (b) Medium, with concentrations between 51–200 grains/m3, and (c) High, for concentrations greater than 200 grains/m3.
In light of the potential human health impact, the evaluation should be performed for the days where the pollen concentrations are significant. Although a threshold of more than 5% of the pollen intensity has been proposed for Thessaloniki [21], preliminary tests for the studied period showed that a value of 1% is more suitable, at least for Quercus pollen, reflecting the most significant concentrations (see also Figure 2). Thus, the evaluation will be performed for the simulation period for the daily pollen concentrations exceeding 1% of the total pollen intensity. Standard statistical metrics are utilized for the evaluation of the two meteorological variables and the Quercus pollen concentrations, namely the mean bias (MB), mean absolute error (MAE), Pearson correlation (R) and the Index of Agreement (IOA), which gives the overall performance. For the evaluation of exposure levels, the multi-categorical confusion matrix is used, as well the sensitivities and specificities for each exposure level.

3. Results

The timeseries of the two meteorological variables are illustrated in Figure 2. For both variables, WRF is capable of simulating the patterns in Thessaloniki stations. Although the model captures the maxima, WRF shows a tendency to overestimate the wind speed, especially on the 20th of April (Figure 2a). On the other hand, the relative humidity is well captured by the modeling system, both in terms of pattern as well as magnitude. The statistical metrics depicts similar results, as seen in Table 1. The wind speed is overestimated by 0.89 m/s (MB), with a MAE of 1.25 m/s, while WRF is slightly underestimated by 3%, with the respective MAE at ~6.4%. The satisfactory correlation for both meteorological variables pinpoints exactly the capturing of their daily variability. Concerning the evaluated meteorological variables, the modeling system performs well overall, with an IOA at 0.77 and 0.83 for wind speed and relative humidity, respectively.
Figure 3 present the timeseries of the observed and simulated Quercus pollen concentrations. The modeling system closely follows the pattern of the observed concentrations, reproducing the peaks of 14th and 20th of April. In general, the modeling system shows a slight underestimation, especially for the cases where the concentrations are lower, such as the 17th of April and between the 2nd–5th of April. This might be due to the overestimation of the wind speed shown before, eventually leading to lower concentrations. The previous results are also evident in the statistical metrics in Table 1. The modeling system underestimates the pollen concentrations by 38 grains/m3, with an MAE of ~72 grains/m3. The satisfactory pattern in the timeseries of Figure 3 is also depicted by the good correlation in Table 1. Overall, in terms of pollen concentrations, the modeling system performs very well, as also indicated by the IOA (0.9).
Table 2 presents the multi-categorical confusion matrix, the sensitivities and the specificities for the exposure levels, as attributed by the modeling system for the Thessaloniki station. It can be seen from the sensitivities that the modeling system is able to reproduce the Low and High exposure levels. The latter is of great importance, since the most severe allergenic reactions are expected at this level [21]. For the case of the Medium exposure level, the modeling system underestimates it, where in seven cases, the model predicted Low exposure levels instead of Medium. The source of this error is associated with the respective underestimation of the Quercus pollen concentrations (MB) and the magnitude of the error (MAE) found previously, which is comparable with the Low exposure level interval (1–50 grains/m3). The overall sensitivity was found to be ~0.71 and the specificity ~0.77, showing that the modeling system satisfactorily attributes the exposure levels for Quercus.

4. Discussion

The evaluated modeling system can be used to investigate the expected exposure levels in the greater area of Thessaloniki, through the percentage of days for one. Figure 4a–c show the days of each exposure level for the studied year. Low exposure levels in the greater area, as well in the city of Thessaloniki, are present on 5–7% of days of the year (Figure 4a). The respective percentages for the Medium level in the city are found to be 2–2.5%, while the largest percentages (more than 4%) are present in the Khalkidhiki and Larisa provinces in the eastern and southwestern of the domain, respectively.
The High exposure levels for Quercus in Figure 4c present the highest percentages in the western flank of the domain, exceeding 5% in areas where several smaller cities and towns are located, with a population between 5000 and 30,000. These people might be expected to have allergic symptoms and reactions for a significant amount of time during the spring, only because of Quercus pollen. In Thessaloniki, the percentages are lower (1–2%), which is consistent with the results of a campaign that took place during 2012–2013 [21]. Comparing the previous result with other cities, it can be found that the percentage is region-dependent. For example, in Guadalajara of Spain and in Funchal of Portugal [41,42], the number of high exposure days was less than 5% of the year, while in Toledo in Spain [43] and in Montpelier in France (https://www.pollens.fr, accessed on 13 September 2021), this was more than 5%, all having in common the Mediterranean climate. Thus, city-specific research is needed when the assessment of the pollen exposure levels are of interest.

5. Conclusions

In this study, a modeling system has been constructed, aiming to accurately predict the Quercus pollen concentrations as well the exposure levels. The modeling system was evaluated over certain meteorological variables, related to the pollen production/inhibition, the Quercus pollen concentrations and the expected exposure levels for the phonological period of the year 2016. Concerning the evaluated meteorological variables, the modeling system showed a satisfactory overall performance for both wind speed and relative humidity, with a slight overestimation and underestimation, respectively. The performance of the attributed exposure was also satisfactory for the Low and especially for the High level, which causes the most severe allergenic reactions, with an overall satisfactory performance. For the Medium level, the modeling system showed an underestimation, attributing seven cases to Low, as a result of an underestimation of the pollen concentrations. The days of the year for each exposure level was also studied, in order to investigate the locations where the Quercus pollen might have a human health impact. In accordance with a previous campaign for the city of Thessaloniki, the days of the year with high risk were less than 5%, but smaller cities and towns westwards might be affected for more than 5% of the year by high Quercus pollen concentrations. Intercomparison with previous studies indicate that city-specific research might be needed when the assessment of the exposure levels is of interest.

Author Contributions

Conceptualization, S.K.; methodology, S.K.; software, S.K.; validation, S.K., D.P. and S.P.; formal analysis, S.K.; investigation, S.K.; writing—original draft preparation, S.K.; writing—review and editing, D.P., S.P. and D.M.; visualization, S.K.; supervision, D.M. All authors have read and agreed to the published version of the manuscript.

Funding

This research was co-funded by the Greek government and the European Union (European Social Fund-ESF) through the Operational Programme “Human Resources Development, Education and Lifelong Learning 2014–2020” in the context of the project “Study of the Aeroallergen Pollen in the Atmosphere (MAGYA)” (MIS 5047904).

Informed Consent Statement

Informed consent was obtained from all subjects involved in the study.

Data Availability Statement

The pollen observations of the Department of Biology of the Aristotle University of Thessaloniki are provided from the Municipality of Thessaloniki at https://opendata.thessaloniki.gr/el/dataset, accessed on 13 September 2021.

Acknowledgments

We would like to acknowledge the Municipality of Thessaloniki for the aerobiological information from the Department of Biology of the Aristotle University of Thessaloniki (https://opendata.thessaloniki.gr/el/dataset, accessed on 13 September 2021), which is made available here under the Open Database License (ODbL).

Conflicts of Interest

The authors declare no conflict of interest.

References

  1. D’amato, G.; Cecchi, L.; Bonini, S.; Nunes, C.; Annesi-Maesano, I.; Behrendt, H.; Liccardi, G.; Popov, T.; Van Cauwenberge, P. Allergenic pollen and pollen allergy in Europe. Allergy 2007, 62, 976–990. [Google Scholar] [CrossRef] [PubMed]
  2. Taylor, P.E.; Flagan, R.C.; Valenta, R.; Glovsky, M.M. Release of allergens as respirable aerosols: A link between grass pollen and asthma. J. Allergy Clin. Immunol. 2002, 109, 51–56. [Google Scholar] [CrossRef]
  3. Bachert, C.; Van Cauwenberge, P.; Olbrecht, J.; Van Schoor, J. Prevalence, classification and perception of allergic and nonallergic rhinitis in Belgium. Allergy 2006, 61, 693–698. [Google Scholar] [CrossRef]
  4. Bauchau, V.; Durham, S. Prevalence and rate of diagnosis of allergic rhinitis in Europe. Eur. Respir. J. 2004, 24, 758–764. [Google Scholar] [CrossRef] [PubMed]
  5. Bousquet, J.; Khaltaev, N.; Cruz, A.A.; Denburg, J.; Fokkens, W.; Togias, A.; Zuberbier, T.; Baena-Cagnani, C.E.; Canonica, G.; Van Weel, C. Allergic rhinitis and its impact on asthma (ARIA) 2008. Allergy 2008, 63, 8–160. [Google Scholar]
  6. Katelaris, C.H.; Lee, B.W.; Potter, P.C.; Maspero, J.F.; Cingi, C.; Lopatin, A.; Saffer, M.; Xu, G.; Walters, R.D.J.C.; Allergy, E. Prevalence and diversity of allergic rhinitis in regions of the world beyond E urope and N orth A merica. Clin. Exp. Allergy 2012, 42, 186–207. [Google Scholar] [CrossRef]
  7. Long, A.; McFadden, C.; DeVine, D.; Chew, P.; Kupelnick, B.; Lau, J. Management of allergic and nonallergic rhinitis. Evid. Rep. Technol. Assess. 2002, 54, 1–6. [Google Scholar]
  8. Manifesto, A. Tackling the Allergy Crisis in Europe-Concerted Policy Action Needed. 2015. Available online: https://www.eaaci.org/ (accessed on 13 September 2021).
  9. James, S.L.; Abate, D.; Abate, K.H.; Abay, S.M.; Abbafati, C.; Abbasi, N.; Abbastabar, H.; Abd-Allah, F.; Abdela, J.; Abdelalim, A. Global, regional, and national incidence, prevalence, and years lived with disability for 354 diseases and injuries for 195 countries and territories, 1990–2017: A systematic analysis for the Global Burden of Disease Study 2017. Lancet 2018, 392, 1789–1858. [Google Scholar] [CrossRef] [Green Version]
  10. Charalampopoulos, A.; Damialis, A.; Tsiripidis, I.; Mavrommatis, T.; Halley, J.M.; Vokou, D.J.A. Pollen production and circulation patterns along an elevation gradient in Mt Olympos (Greece) National Park. Aerobiologia 2013, 29, 455–472. [Google Scholar] [CrossRef]
  11. Damialis, A.; Fotiou, C.; Halley, J.M.; Vokou, D. Effects of environmental factors on pollen production in anemophilous woody species. Trees 2011, 25, 253–264. [Google Scholar] [CrossRef]
  12. Helbig, N.; Vogel, B.; Vogel, H.; Fiedler, F.J.A. Numerical modelling of pollen dispersion on the regional scale. Aerobiologia 2004, 20, 3–19. [Google Scholar] [CrossRef]
  13. Hidalgo, P.J.; Mangin, A.; Galán, C.; Hembise, O.; Vázquez, L.M.; Sanchez, O. An automated system for surveying and forecasting Olea pollen dispersion. Aerobiologia 2002, 18, 23–31. [Google Scholar] [CrossRef]
  14. Liu, L.; Solmon, F.; Vautard, R.; Hamaoui-Laguel, L.; Torma, C.Z.; Giorgi, F.J.B. Ragweed pollen production and dispersion modelling within a regional climate system, calibration and application over Europe. Biogeosciences 2015, 13, 2769–2786. [Google Scholar] [CrossRef] [Green Version]
  15. Sofiev, M.; Berger, U.; Prank, M.; Vira, J.; Arteta, J.; Belmonte, J.; Bergmann, K.-C.; Chéroux, F.; Elbern, H.; Friese, E. MACC regional multi-model ensemble simulations of birch pollen dispersion in Europe. Atmos. Chem. Phys. 2015, 15, 8115–8130. [Google Scholar] [CrossRef] [Green Version]
  16. Sofiev, M.; Siljamo, P.; Ranta, H.; Linkosalo, T.; Jaeger, S.; Rasmussen, A.; Rantio-Lehtimaki, A.; Severova, E.; Kukkonen, J. A numerical model of birch pollen emission and dispersion in the atmosphere. Description of the emission module. Int. J. Biometeorol. 2013, 57, 45–58. [Google Scholar] [CrossRef] [PubMed] [Green Version]
  17. Wozniak, M.C.; Steiner, A.L. A prognostic pollen emissions model for climate models (PECM1. 0). Geosci. Model Dev. 2017, 10, 4105. [Google Scholar] [CrossRef] [Green Version]
  18. Zhang, R.; Duhl, T.; Salam, M.T.; House, J.M.; Flagan, R.C.; Avol, E.L.; Gilliland, F.D.; Guenther, A.; Chung, S.H.; Lamb, B.K. Development of a regional-scale pollen emission and transport modeling framework for investigating the impact of climate change on allergic airway disease. Biogeosciences 2014, 10, 3977. [Google Scholar] [CrossRef] [Green Version]
  19. Marécal, V.; Peuch, V.-H.; Andersson, C.; Andersson, S.; Arteta, J.; Beekmann, M.; Benedictow, A.; Bergström, R.; Bessagnet, B.; Cansado, A. A regional air quality forecasting system over Europe: The MACC-II daily ensemble production. Geosci. Model Dev. 2015, 8, 2777–2813. [Google Scholar] [CrossRef] [Green Version]
  20. Sofiev, M.; Ritenberga, O.; Albertini, R.; Arteta, J.; Belmonte, J.; Bernstein, C.G.; Bonini, M.; Celenk, S.; Damialis, A.; Douros, J.; et al. Multi-model ensemble simulations of olive pollen distribution in Europe in 2014: Current status and outlook. Atmos. Chem. Phys. 2017, 17, 12341–12360. [Google Scholar] [CrossRef] [Green Version]
  21. Charalampopoulos, A.; Damialis, A.; Lazarina, M.; Halley, J.M.; Vokou, D. Spatiotemporal assessment of airborne pollen in the urban environment: The pollenscape of Thessaloniki as a case study. Atmos. Environ. 2021, 247, 118185. [Google Scholar] [CrossRef]
  22. Dudhia, J. Numerical study of convection observed during the winter monsoon experiment using a mesoscale two-dimensional model. J. Atmos. Sci. 1989, 46, 3077–3107. [Google Scholar] [CrossRef]
  23. Kontos, S.; Liora, N.; Giannaros, C.; Kakosimos, K.; Poupkou, A.; Melas, D. Modeling natural dust emissions in the central Middle East: Parameterizations and sensitivity. Atmos. Environ. 2018, 190, 294–307. [Google Scholar] [CrossRef]
  24. Liora, N.; Markakis, K.; Poupkou, A.; Giannaros, T.M.; Melas, D. The natural emissions model (NEMO): Description, application and model evaluation. Atmos. Environ. 2015, 122, 493–504. [Google Scholar] [CrossRef]
  25. Liora, N.; Poupkou, A.; Giannaros, T.M.; Kakosimos, K.E.; Stein, O.; Melas, D. Impacts of natural emission sources on particle pollution levels in Europe. Atmos. Environ. 2016, 137, 171–185. [Google Scholar] [CrossRef]
  26. ENVIRON: User’s Guide to the Comprehensive Air Quality Model with Extensions (CAMx) Version 5.20; Ramboll Environment and Health: Copenhagen, Denmark, 2009; Available online: https://www.camx.com (accessed on 13 September 2021).
  27. Hersbach, H.; Bell, B.; Berrisford, P.; Hirahara, S.; Horányi, A.; Muñoz-Sabater, J.; Nicolas, J.; Peubey, C.; Radu, R.; Schepers, D. The ERA5 global reanalysis. Q. J. R. Meteorol. Soc. 2020, 146, 1999–2049. [Google Scholar] [CrossRef]
  28. Giannaros, C. Sensitivity Analysis and Optimization of a Mesoscale Atmospheric Model. Ph.D. Thesis, Aristotle University of Thessaloniki, Thessaloniki, Greece, 2018. Available online: http://ikee.lib.auth.gr/record/296971 (accessed on 13 September 2021).
  29. Brus, D.; Hengeveld, G.; Walvoort, D.; Goedhart, P.; Heidema, A.; Nabuurs, G.; Gunia, K. Statistical mapping of tree species over Europe. Eur. J. For. Res. 2012, 131, 145–157. [Google Scholar] [CrossRef]
  30. Schulzweida, U. Climate Data Operators (CDO) User Guide; Max-Planck-Institut für Meteorologie (MPI-M): Hamburg, Germany, 2020; Available online: https://code.mpimet.mpg.de/projects/cdo/embedded/cdo.pdf (accessed on 13 September 2021).
  31. Andersen, T.B. A model to predict the beginning of the pollen season. Grana 1991, 30, 269–275. [Google Scholar] [CrossRef] [Green Version]
  32. Durham, O.C. The volumetric incidence of atmospheric allergens: III. Rate of fall of pollen grains in still air. J. Allergy Clin. Immunol. 1946, 17, 70–78. [Google Scholar]
  33. Bott, A. A positive definite advection scheme obtained by nonlinear renormalization of the advective fluxes. Mon. Weather Rev. 1989, 117, 1006–1016. [Google Scholar] [CrossRef]
  34. Zhang, L.; Brook, J.; Vet, R. A revised parameterization for gaseous dry deposition in air-quality models. Atmos. Chem. Phys. 2003, 3, 2067–2082. [Google Scholar] [CrossRef] [Green Version]
  35. Seinfeld, J.H.; Pandis, S.N. Atmospheric Chemistry and Physics: From Air Pollution to Climate Change; John Wiley & Sons: Hoboken, NJ, USA, 2016. [Google Scholar]
  36. Lagouvardos, K.; Kotroni, V.; Bezes, A.; Koletsis, I.; Kopania, T.; Lykoudis, S.; Mazarakis, N.; Papagiannaki, K.; Vougioukas, S. The automatic weather stations NOANN network of the National Observatory of Athens: Operation and database. Geosci. Data J. 2017, 4, 4–16. [Google Scholar] [CrossRef]
  37. Gioulekas, D.; Papakosta, D.; Damialis, A.; Spieksma, F.; Giouleka, P.; Patakas, D.J.A. Allergenic pollen records (15 years) and sensitization in patients with respiratory allergy in Thessaloniki, Greece. Allergy 2004, 59, 174–184. [Google Scholar] [CrossRef]
  38. Damialis, A.; Halley, J.M.; Gioulekas, D.; Vokou, D.J.A.E. Long-term trends in atmospheric pollen levels in the city of Thessaloniki, Greece. Atmos. Environ. 2007, 41, 7011–7021. [Google Scholar] [CrossRef]
  39. Damialis, A.; Kaimakamis, E.; Konoglou, M.; Akritidis, I.; Traidl-Hoffmann, C.; Gioulekas, D.J.S.r. Estimating the abundance of airborne pollen and fungal spores at variable elevations using an aircraft: How high can they fly? Sci. Rep. 2017, 7, 44535. [Google Scholar] [CrossRef] [Green Version]
  40. Soldevilla, C.G.; González, P.C.; Teno, P.A.; Vilches, E.D. Spanish Aerobiology Network (REA): Management and Quality Manual; Servicio de Publicaciones Universidad de Córdoba: Córdoba, Spain, 2007; Volume 184, pp. 1–300. [Google Scholar]
  41. Camacho, I.C. Airborne pollen in Funchal city, (Madeira Island, Portugal)-First pollinic calendar and allergic risk assessment. Ann. Agric. Environ. Med. 2015, 22, 608–613. [Google Scholar] [CrossRef] [PubMed] [Green Version]
  42. Rojo, J.; Rapp, A.; Lara, B.; Sabariego, S.; Fernandez-Gonzalez, F.; Perez-Badia, R. Characterisation of the airborne pollen spectrum in Guadalajara (central Spain) and estimation of the potential allergy risk. Environ. Monit. Assess. 2016, 188, 130. [Google Scholar] [CrossRef] [PubMed]
  43. Pérez-Badia, R.; Rapp, A.; Morales, C.; Sardinero, S.; Galán, C.; García-Mozo, H. Pollen spectrum and risk of pollen allergy in central Spain. Ann. Agric. Environ. Med. 2010, 17, 139–151. [Google Scholar] [PubMed]
Figure 1. Modeling domains of the study.
Environsciproc 08 00015 g001
Figure 2. Timeseries of the daily mean observed and simulated WRF: (a) wind speed (in m/s); (b) relative humidity (in %).
Environsciproc 08 00015 g002
Figure 3. Timeseries of the observed and simulated Quercus pollen concentrations.
Environsciproc 08 00015 g003
Figure 4. Percentage of days of the year with (a) Low; (b) Medium and (c) High exposure level in the greater area of Thessaloniki.
Environsciproc 08 00015 g004
Table 1. Metrics for the evaluation of the modeling system with the on-site daily measured wind speed, relative humidity and Quercus pollen concentrations. The statistics used are the Mean Bias (MB), Pearson correlation coefficient (R), Mean Absolute Error (MAE) and the Index of Agreement (IOA).
VariableMBMAERIOA
Wind speed (m/s)0.891.250.770.77
Rel. humidity (%)−3.006.370.720.83
Quercus conc. (pollen grains/m3)−37.8972.140.830.90
Table 2. Multi-categorical confusion matrix and calculated sensitivities and specificities for the three exposure levels.
Predicted LowPredicted MediumPredicted HighSensitivitySpecificity
Actual Low1001.000.70
Actual Medium7820.470.71
Actual High0240.670.89
Publisher’s Note: MDPI stays neutral with regard to jurisdictional claims in published maps and institutional affiliations.

