Proceeding Paper

What Can Be Learned about the Relationships between Water Discharge and Composition during Flood Events in a Forested Karstic Catchment from the Pyrenees Mountains (Southwestern France)? †

by
Francesco Ulloa-Cedamanos
1,2,3,*,
Anne Probst
1,2,3,
Vanessa Dos-Santos
1,2,3 and
Jean-Luc Probst
1,2,3,*
1
Laboratoire Écologie Fonctionnelle et Environnement, Université de Toulouse, CNRS, Auzeville Tolosane, 31326 Castanet Tolosan, France
2
LTSER Zone Atelier Pyrénées-Garonne, Université de Toulouse, CNRS, 31326 Castanet Tolosan, France
3
LTER Bassin Versant du Baget, SNO Karst, IR OZCAR, Université de Toulouse, CNRS, 31326 Castanet Tolosan, France
*
Authors to whom correspondence should be addressed.
Presented at the 5th International Electronic Conference on Water Sciences, 16–30 November 2020; Available online: https://ecws-5.sciforum.net/.
Environ. Sci. Proc. 2021, 7(1), 9; https://doi.org/10.3390/ECWS-5-08058
Published: 13 November 2020
(This article belongs to the Proceedings of 5th International Electronic Conference on Water Sciences)

Abstract

:
Hydrological variations hold a significant influence over the water chemistry in the karst systems within the critical zone. In this context, the Baget Catchment (BC) was monitored at high-resolution over 2 hydrological years. The high-frequency survey at the outlet of BC displayed multiple hydrochemical patterns in response to hydrological variations, mixing water sources, and biogeochemical processes. Among the major elements, sulfate exhibited the widest relative variation during flooding and showed a significant dilution, whereas calcium and bicarbonate revealed a chemostatic behavior as a result of carbonate dissolution in the karst. Hysteretic analysis evidenced the control of different hydrological reservoirs over the stream transport processes of dissolved elements. The concentration of dissolved organic carbon increased during the hydrograph rising limb and was controlled by surface runoff. The relationships between Ca2+ and HCO3 concentrations and stream discharge exhibited hysteresis patterns with counterclockwise loops, unlike all other elements, due to the carbonate weathering by biogenic CO2-rich water. Finally, high-frequency sampling during storm events improved the understanding of the factors controlling the hydrochemical dynamic of the Baget stream water. The relative contributions of the karst and epikarst zones, of rainwater, as well as the role of different biogeochemical processes and the hydrological conditions were highlighted.

1. Introduction

The Critical Zone (CZ) is the heterogeneous support at the Earth’s surface, in which occur complex interactions between rocks, soils, water, air, and living organisms. In the karst systems, the fractured nature of the carbonate rocks and the thin soil cover enhance the water–rock interaction and promote a rapid transfer of surface waters to the underground system (including the epikarst) [1,2]. Despite the uncertainty, the estimation of the average fluxes of carbonate weathering reaches 1.3 Gt C·year−1, while the associated CO2 consumption is above 0.1 Gt C·yr−1 at the global scale [3,4]. The water is a vector of information in the CZ [5] that allows not only the lithological origin to be elucidated [6], but also the response of the water chemistry face to hydrological changes. In temperate climates, two seasons are contrasted: the dry season mainly during the summer and the wet season with heavy rainfall especially in winter and spring. During the wet season, the forthwith variations due to storms modify the hydrological conditions, leading to dilution processes of major element concentrations [7]. The relationships between the discharge (Q) and the concentration of dissolved elements (C) can either indicate chemostatic or chemodynamic behaviors at the catchment scale [8]. During one entire storm, the plot of C-Q relationship allows the identification of loop trajectories, called hysteresis [9]. Depending on their shape and direction of rotation, hysteresis analysis provides information about the contributions of different sources/reservoirs (including each flow component of the runoff) to the fluxes of dissolved and particulate matter [10,11,12,13], or even the control of seasonal trends based on the environmental factors [14].
The Baget Catchment (BC) In the French Pyrenees Mountains has been monitored since before the 1970s, owning a complete high-resolution hydrogeochemical database [15] coupled with a high-frequency flood survey since 2019. Based on this database, the objectives of this paper are as follows: (i) to investigate the sensitivity (chemostatic or chemodynamic responses) of water chemistry to sudden hydrological variation, (ii) to quantify each flow component of the runoff under rainstorm conditions, (iii) to understand the hysteresis behaviors of chemical compounds and, (iv) to elucidate the dominant controls on changes in hydrochemistry during rainstorm events.

2. Materials and Methods
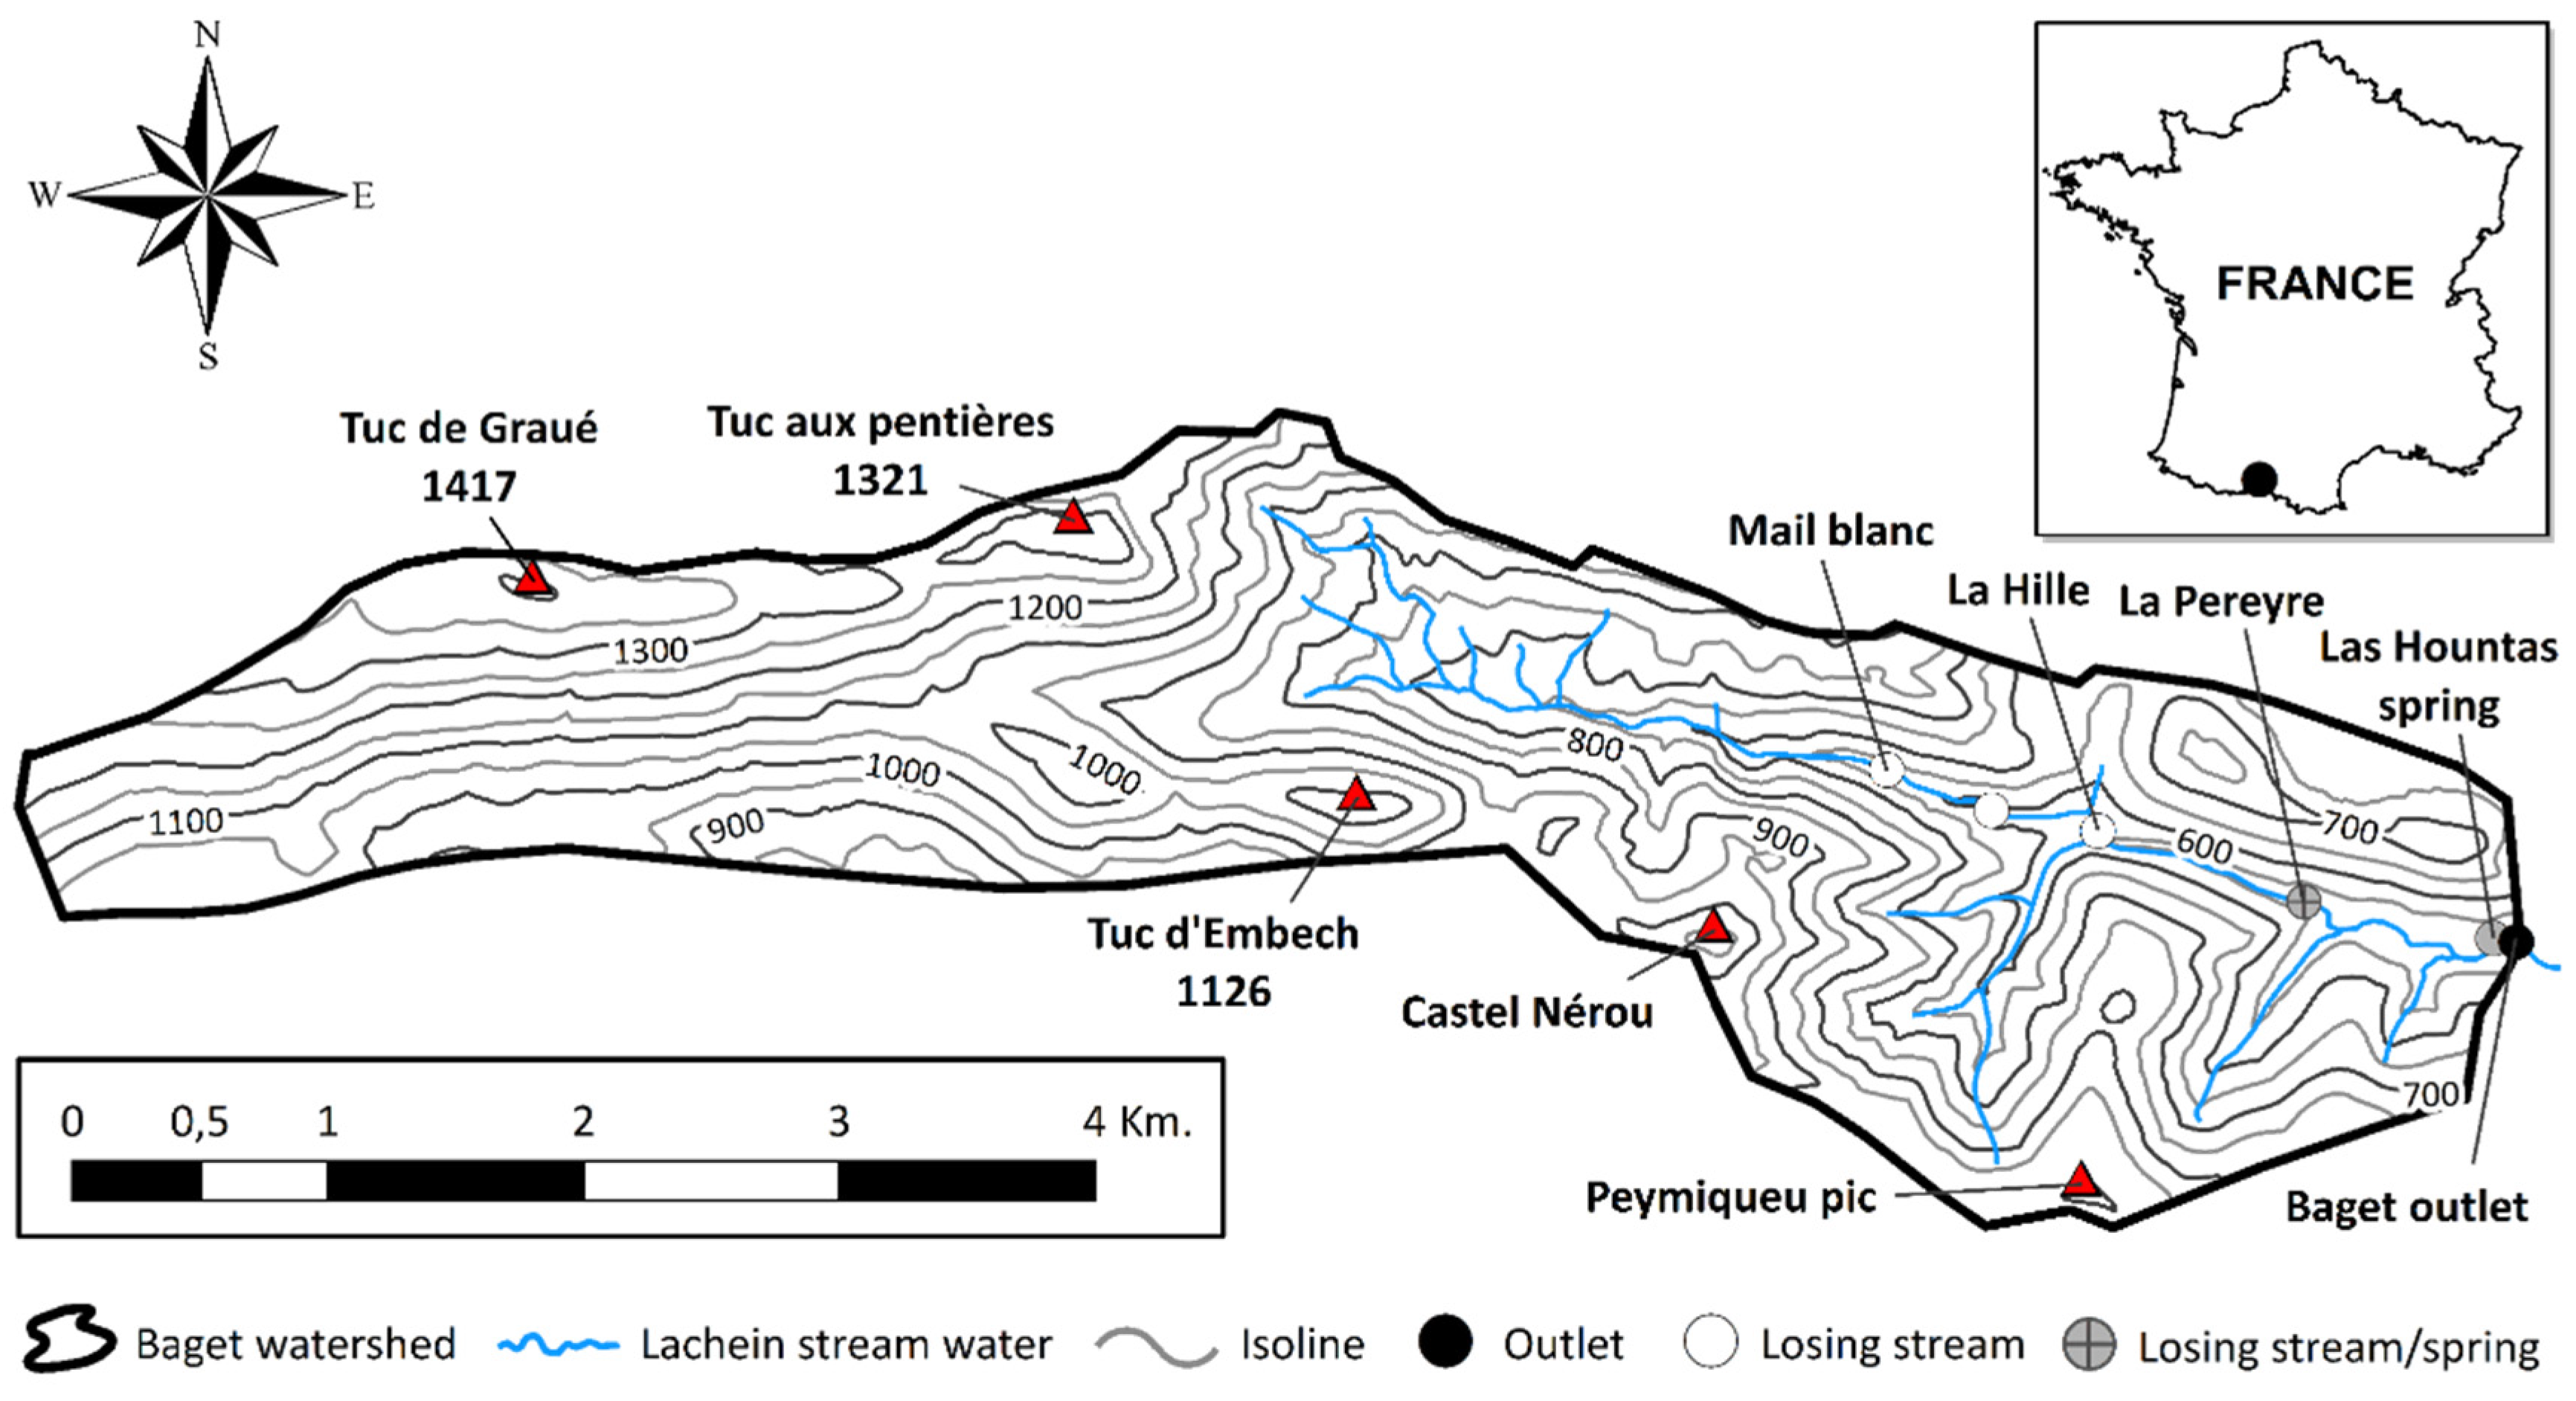
2.1. Study Area

The BC (42°57′42″ N, 0°58′30″ E) is a small (13.25 Km2) forested karstic catchment with an altitude range between 498 (at the outlet) and 1417 m.a.s.l. The BC is located in the lower part of the Pyrenees Mountains, in the Southwest of France (Figure 1). It is drained in its lower part by the Lachein stream.
The BC is influenced by an Atlantic oceanic climate coupled with a clear mountainous tendency, leading to a bimodal rainfall regime with runoff peaks of the Lachein stream water in early winter (around December) and late spring (around May) [15]. During the hydrological year 2019–2020 (from October 2019 to September 2020), the 60% of annual rainfall (1713 mm yr−1) occurred from November to December, and from March to May (wet season).
The BC landscape is forested with a predominant forest land cover (67% of the basin area in 2019), followed by grasslands located near to the outlet and some pastures in the upper part of BC. This catchment lays on calcareous formations of the Jurassic and Cretaceous periods, represented by a band of limestone bordered to the north and south by impermeable silicate rocks and by dolomitic outcrops in the northern upper section.

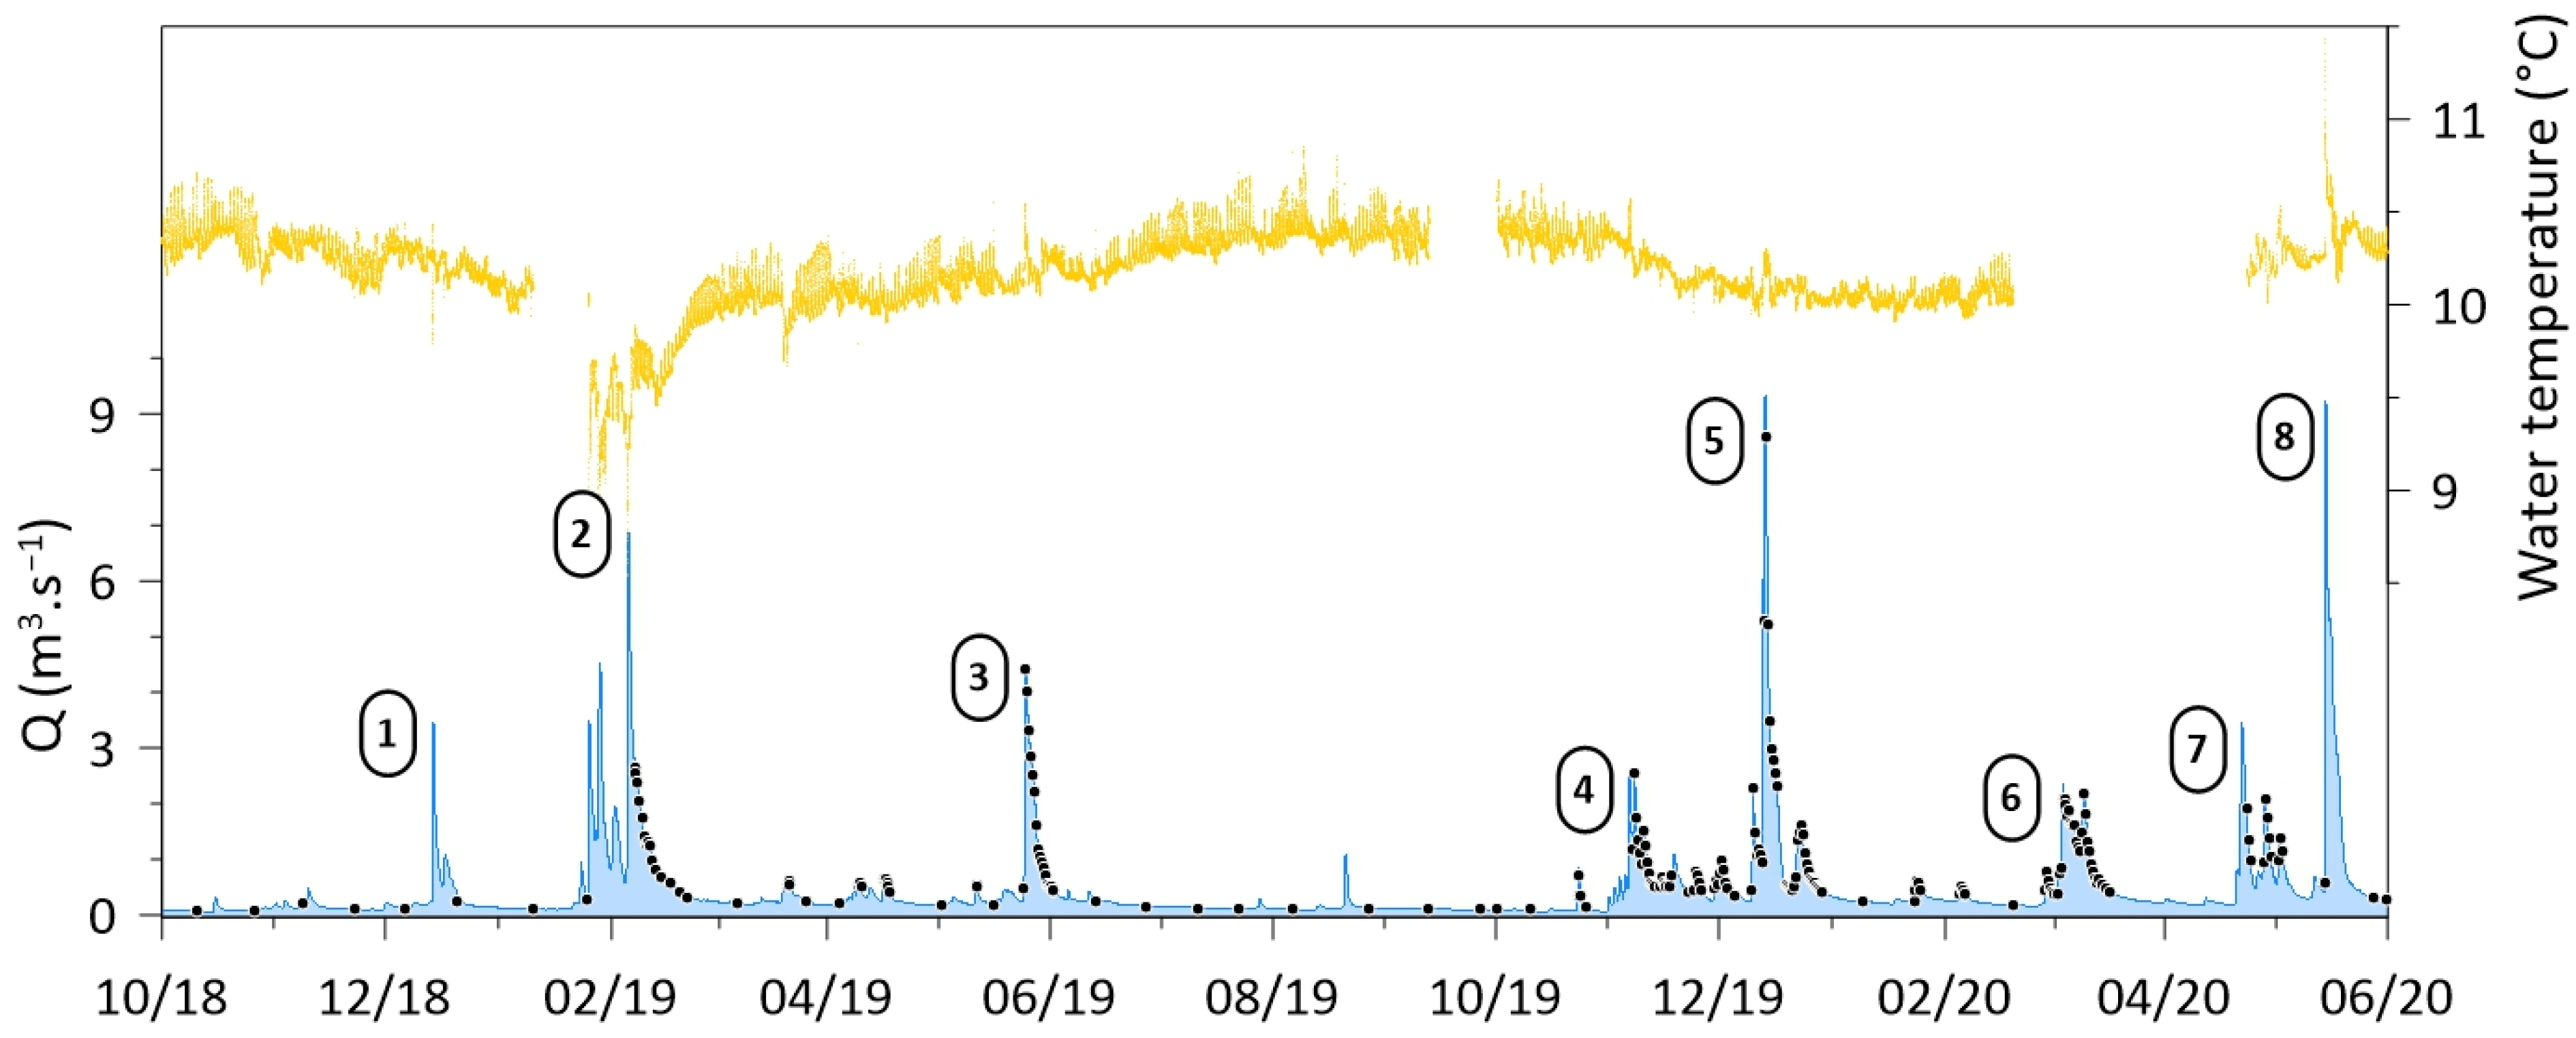
2.2. Sampling and Analysis

A biweekly sampling was carried out at the BC outlet from October 2018 to May 2020, as well as a high-frequency sampling between February 2019 and May 2020 during the flood events.
The physicochemical parameters such as water temperature (T), specific conductivity (SC), and pH were measured at the time of sampling using a portable multiparameter probe (WTW probe, Xylem Analytics Germany Sales GmbH & Co., Weilheim, Germany). In addition, since April 2014, pressure (water level) and different physicochemical parameters (T, SC, Turbidity, nitrate and chloride) were measured continuously at a high frequency (10-min interval) in the mid-depth of the water column (at the outlet) using a multiparameter probe (YSI 6920V2-01, YSI Incorporated, Yellow Springs, OH, USA) equipped with multiple sensors and an atmospheric pressure correction.
Water samples were collected in a clean and dry 1 L HDPE bottle, triple rinsed with stream water before sampling, and stored in darkness at 5 °C until analyses. All samples were filtered using Millipore 0.22 µm cellulose nitrate membranes. Alkalinity was determined using standard acid titration method with HCl 0.02N and a Metrohm titrant (716 DMS Titrino, Metrohm, Riverview, FL, USA). Major anion concentrations (SO42−, NO3 and Cl) were analyzed by ion chromatography (Dionex apparatus ICS 5000+, Thermo Fisher Scientific, Waltham, MA, USA). Major cation (Ca2+, Mg2+, Na+ and K+) and silica concentrations were measured using an acidified sample with 16N HNO3, later analyzed by an inductively coupled plasma optical emission spectrometer (ICP-OES; Iris Intrepid II XLD, Thermo Electron, Thermo Fisher Scientific, Waltham, MA, USA). Dissolved Organic Carbon (DOC) was measured on a Shimadzu TOC 5000 analyzer (Shimadzu Corporation, Kyoto, Japan), coupled to the CO2 detection by an infrared gas analyzer (NDIR).

3. Results and Discussion

3.1. Hydrochemical Characteristics

The water temperature and discharge (Figure 2) at the outlet exhibited a clear seasonality during the two hydrological years, but with a completely different Coefficient of Variation (CV = σ/ X ¯ ): the highest variation for the discharge (CV = 1.01) and the lowest variation for the water temperature (CV = 0.02). The study period is dry compared to the last 40 years [15]. All parameters reflected the hydrological variation.
The stream water in BC is mildly alkaline and showed low pH fluctuations (8.0 ± 0.2). The water temperature is highly stable (10.2 ± 0.2 °C) throughout the study period. Conductivity showed a slight relationship with total dissolved solids (R2 = 0.5), despite their different coefficients of variation (0.46 and 0.08, respectively).
The mean concentration during the study period exhibited the following pattern: for cations, calcium (Ca2+, 88.7% of total cationic concentration in µeq·L−1) >> magnesium (Mg2+, 9.8%) >> sodium (Na+, 1.1%) > potassium (K+, 0.4%) and for anions, bicarbonate (HCO3, 93.1% of total anionic concentration in µeq·L−1) >> sulphate (SO42−, 4.6%) > chloride (Cl, 1.4%) > nitrate (NO3, 0.8%). The predominance of Ca2+, Mg2+ and HCO3 is related to the carbonate lithology of BC [15]. The discharge-weighted mean concentration of sulphate has clearly decreased (0.15 µeq·L−1) during the study period compared to the period 1978–2018 (0.35 µeq·L−1) [15]. In addition, Ca2+ and HCO3 were the most stable ions, while SO42−, K+, NO3 and DOC exhibited high CV. The Net Inorganic Charge Balances (NICB = 2 × (TZ+ − TZ)/(TZ+ + TZ) × 100) between the sum of anions (TZ) and the sum of cations (TZ+) (both in meq·L−1) never exceeded ±10% for all the samples.
In this study, only the individual flood event No. 3 (Figure 2, the last flood of the hydrological year 2018–2019) was analyzed further as an example. This individual flood event is representative of BC regarding intensity/magnitude; besides it is not influenced by past and/or successive floods and the recession period is not disturbed.

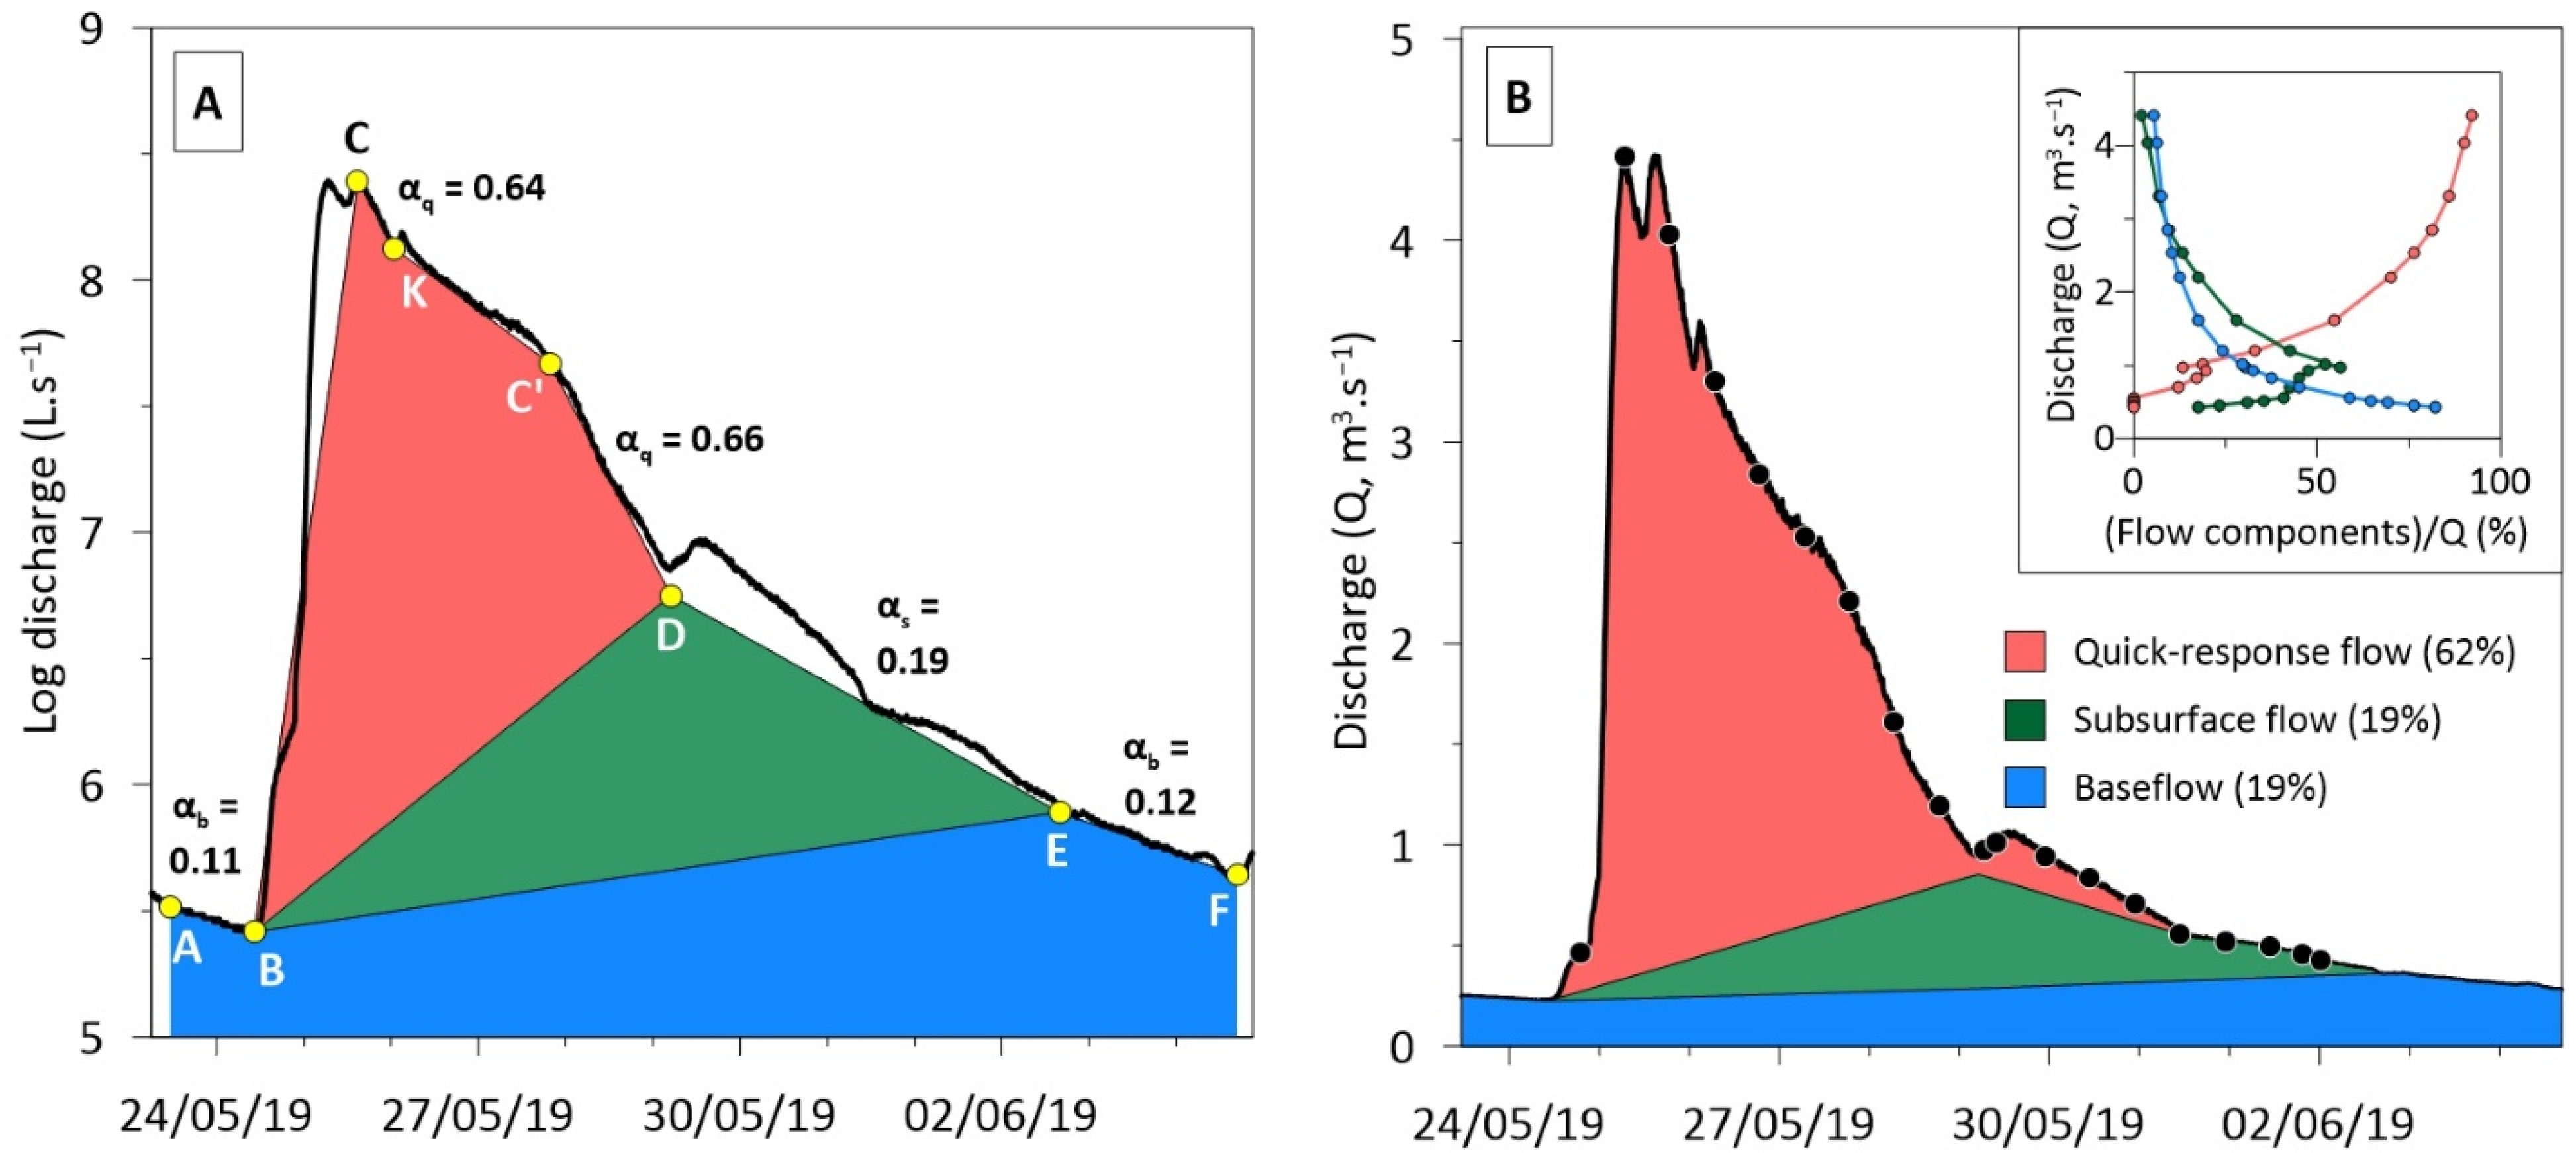
3.2. Separation of the Flood Flow Components

The onset of a storm period was established when the discharge increased suddenly exhibiting a marked inflection (Point B, Figure 3A). This sudden change was assessed when the discharge change rate (DCR, Equation (1)) was greater than 100%.
D C R = Q i + 1 Q i / Q i
where Qi and Qi+1 are the daily discharge at time-step i and i+1. The end of the storm period was determined when the DCR was greater than −20% and the base discharge was lower than 300 L·s−1 in BC (Point E, Figure 3A). Moreover, small floods leading to discharge variation only within ±1 m3·s−1 were not considered. As result, eight hydrological events were differenced according to this approach (Figure 2).
The flows were split according to the hydrograph separation method of Probst [16,17,18]. This method was adapted for karst systems, assuming that the quick-response flow (karst and surface runoff fraction), the subsurface flow (epikarst and infiltration fraction) and the baseflow (groundwater fraction) occur simultaneously. The quantitative analysis of these curves is derived from the research of Maillet [19] who indicated that the recession curve of the hydrograph during a storm period can be characterized by an exponential decrease in the discharge (Equation (2)), suggesting a linear relationship between piezometric head and flowrate [20].
Q t = Q 0 × e α t
where Qt is the instantaneous discharge at time-step t (in days in our study), Q0 is the initial discharge at time zero and α is the recession coefficient. This coefficient depends on the characteristics of each flow associated with the reservoir that drains, allowing to differentiate the different reservoirs on the basis of their α coefficient.
The hydrograph separation of the flood event No. 3 (Figure 3A) exhibited three distinct recession coefficients for: the quick-response flow (αq: 0.64–0.66), the subsurface flow (αs: 0.19) and the baseflow (αb: 0.11–0.12).The analysis of the other flood events in BC (Figure 2) showed that the different recession coefficients α (with t in days) range between 0.80 and 0.40 for αq, from 0.20 to 0.10 for αs and between 0.12 and 0.04 for αb.
The analysis of the flow distribution along the flood recession (Figure 3B) showed that the dominance of the quick-response flow decreases progressively, being the dominant streamflow component (>50% of total discharge) up to discharges higher than 1.5 m3·s−1, while the subsurface flow is the dominant flow for discharges close to 1 m3·s−1. Likewise, the baseflow corresponds to discharges lower than 0.65 m3·s−1.

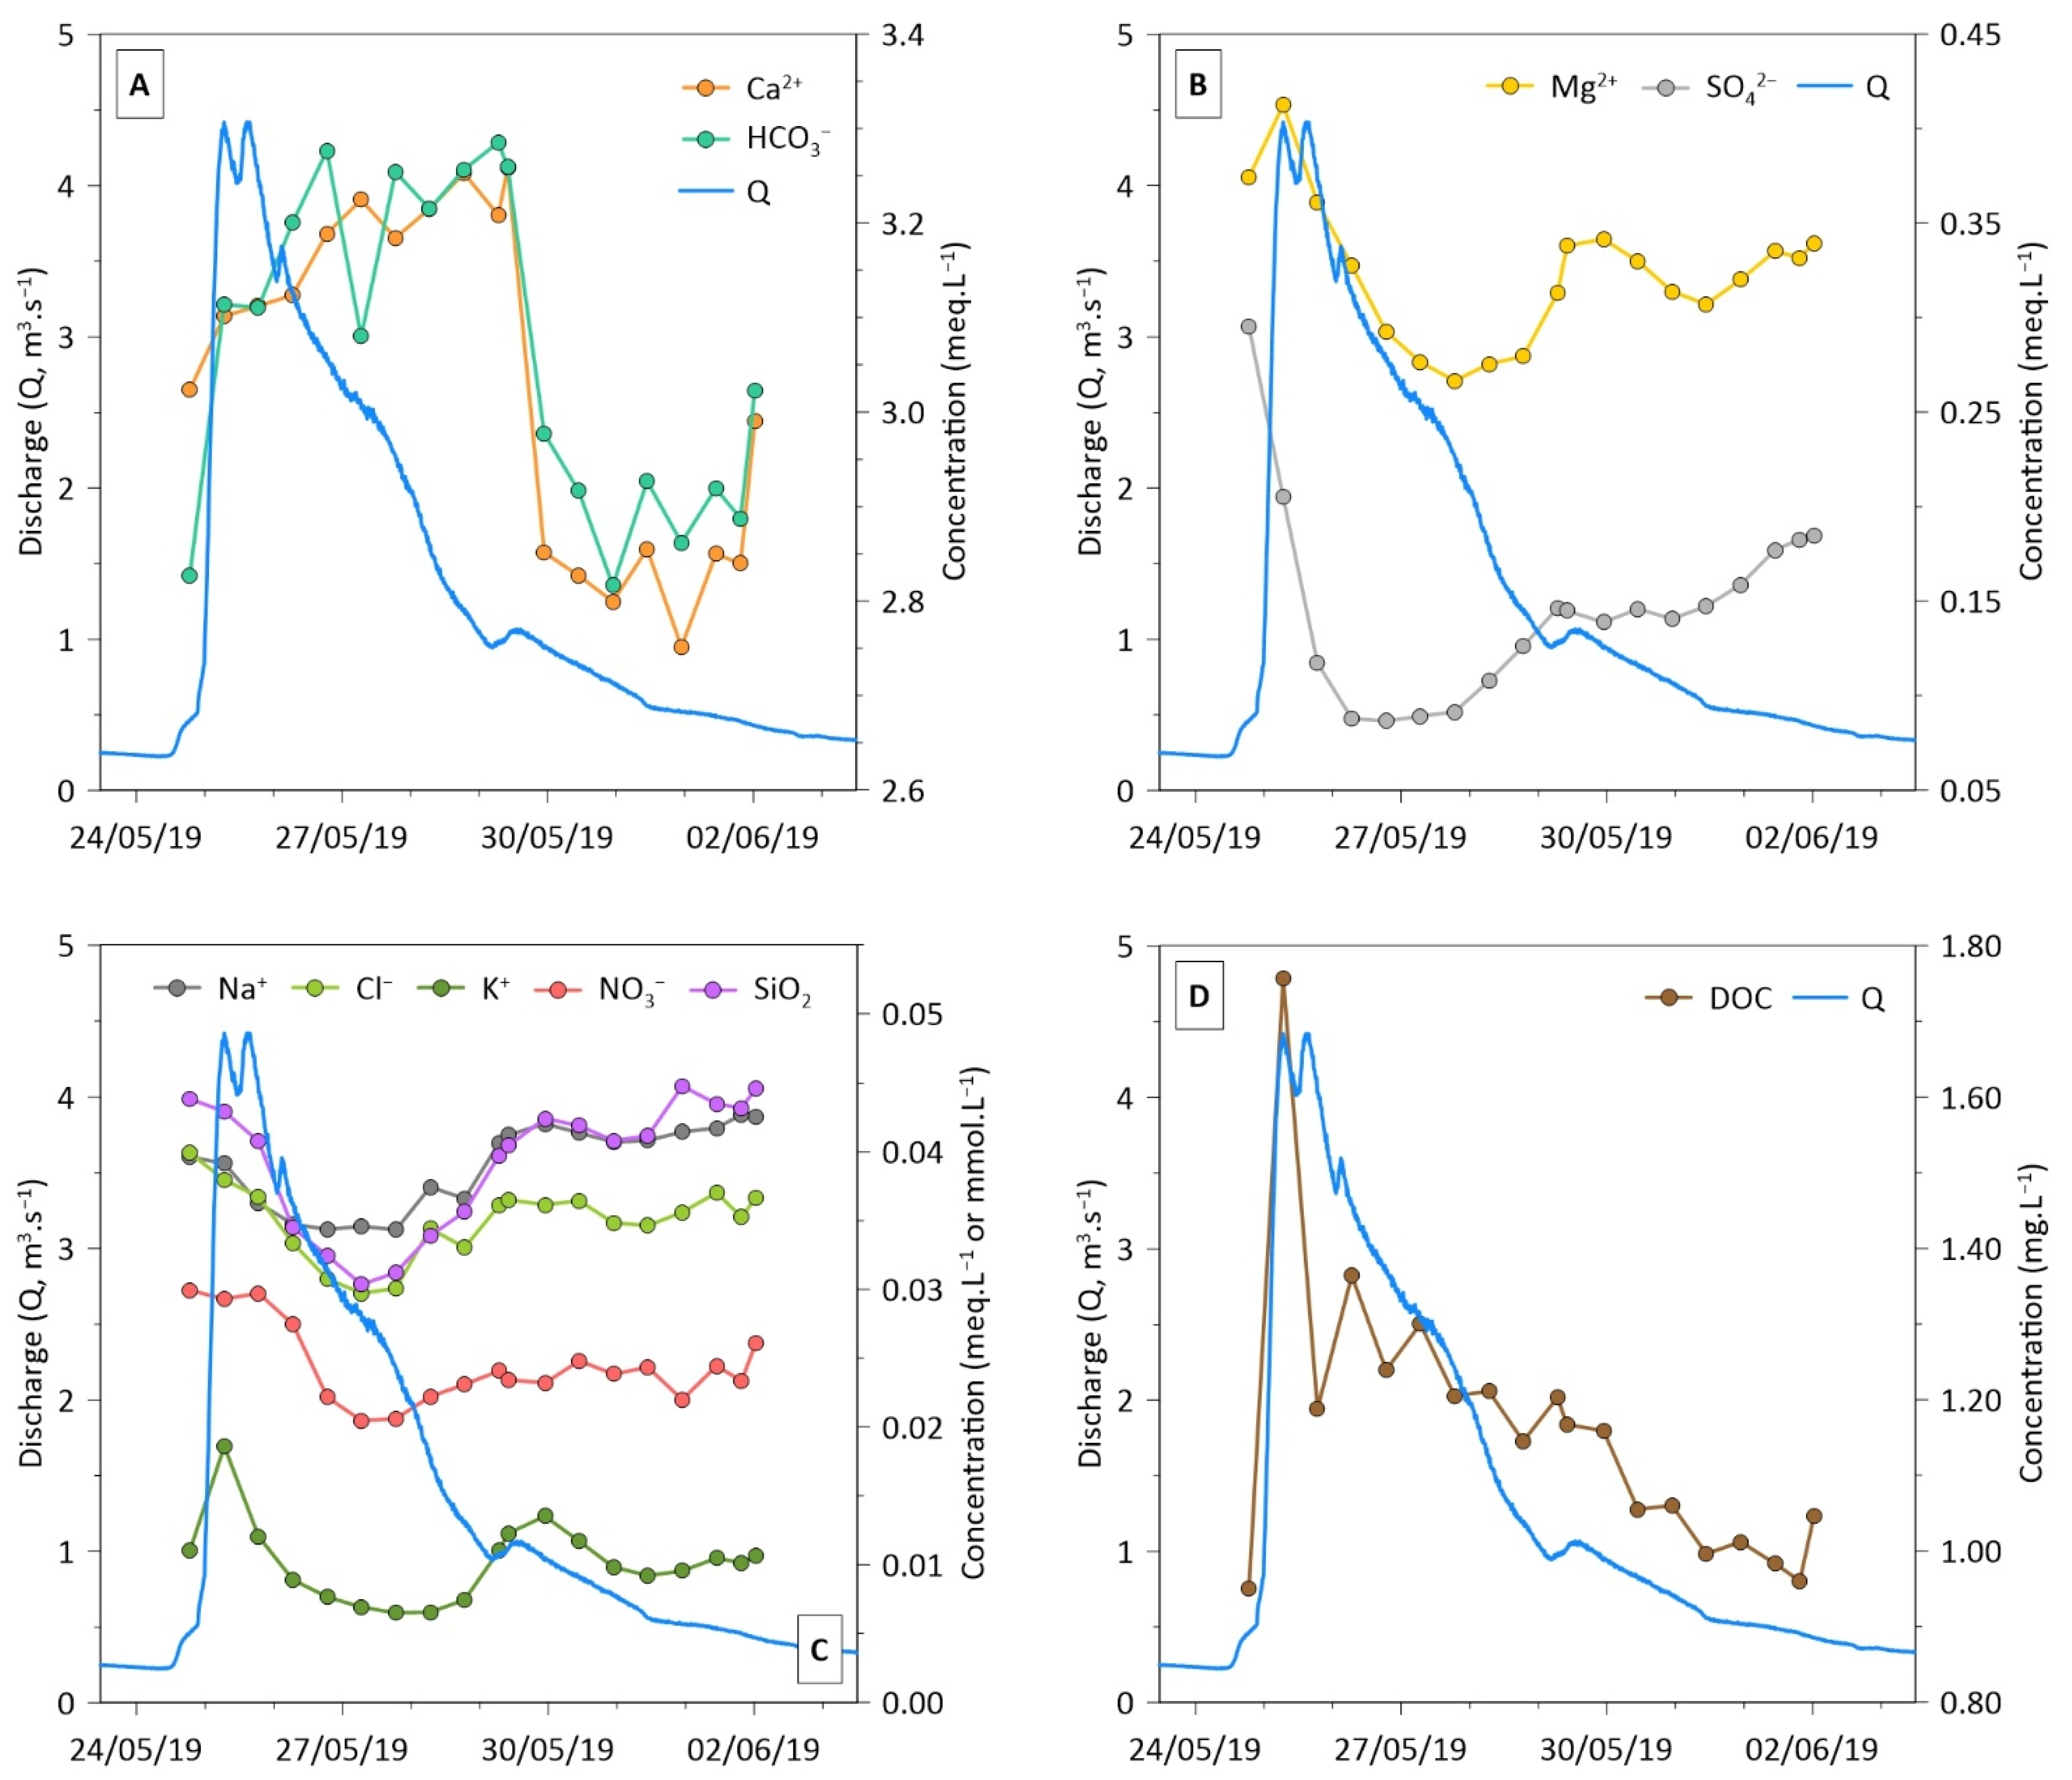
3.3. Temporal Variations and C-Q Relationships

The control of discharge over the dissolved elements can be represented by the comparison of temporal variations for discharges and solute element concentrations during the flood event (Figure 4). Unlike the other elements, Ca2+ and HCO3 are the only dissolved elements that increase during the quick-response flow of the falling limb (Figure 3B and Figure 4A). As a consequence of the change in flow component (subsurface flow), a clear decrease is observed for Ca2+ and HCO3, followed by a progressive increase in the concentrations with the dominance of the baseflow.
These temporal variations of both discharge and concentrations can be analyzed also using the relationships between concentrations and discharges which generally follow a power-law function (Equation (3); [21]):
C i = a   Q i b
where Qi and Ci are the instantaneous discharges and dissolved element concentrations respectively, at time-step i. The exponent b is a useful indicator of the chemodynamic features of dissolved element behavior. If b < 0, the dilution effect produced by Q is the only regulator on C; if b = 0, C exhibits a chemostatic behavior, without influence of Q variation; if b > 0, an enrichment takes place on the solutes when the discharge increases.
The normalized C-Q patterns (see above Section 3.4 and Figure 5), suggest that the dilution effect due to the increased discharge is affected by other processes supplying additional inflows of solute elements with the change in discharge [22]. SO42− (b = −0.26) exhibited the most negative b value, indicating a strong dilution effect on the concentration as the discharge increases in this forested karst system. In other types of karst systems, such as the Lavoir coastal karst spring, water chemistry and salinity are also diluted by freshwater (rain) that infiltrates into the karst [23]. These smaller b-values revealed slower outputs or reduced amounts of this anion in the BC, which potentially comes from the gypsum dissolution, and to a lesser extent from pyrite oxidation and atmospheric contribution [15]. DOC was the only parameter with a clear enrichment with the discharge increase (b = 0.16). Ca2+ (b = −0.05) and HCO3 (b = 0.05) displayed b values close to 0, reflecting an overall chemostatic behavior. Such strong chemostatic behavior could initially be based on a counterbalance between their low-concentration in rainwater input and the rapid kinetic of carbonate dissolution with biogenic soil CO2 [13], indicating a control by process-limited regime.

3.4. Hysteresis Analysis

The C-Q relationships are widely used to define the origin and transfer of elements [12,24,25]. During a flood, the C-Q relationship can take the shape of a straight line or a loop, called hysteresis [25]. This hysteresis reflect different concentration responses to the same discharge during the rising and falling limbs of the hydrograph.
The Hysteresis Index (HI) [26], based on normalized data, was used to compare the hysteresis behavior of each parameter within and between different flood events (Equations (4)–(6)).
Normalized   Q i = Q i Q m i n / Q m a x Q m i n
Normalized   C i = C i C m i n / C m a x C m i n
H I = C i - R L _ n o r m C i - F L _ n o r m
where Qi and Ci are the instantaneous discharge and dissolved element concentrations at time-step i, respectively. The Qmin, Qmax and Cmin, Cmax correspond to the minimum and maximum values of discharges and concentrations during a complete flood event, respectively. The Ci-RL_norm and Ci-FL_norm refer to the normalized concentrations on the rising limb (RL) and on the corresponding falling limb (FL) of the hydrograph respectively, for each 10% increase in discharge [26].
Loop trajectories of dissolved elements evidenced different hysteresis behaviors (Figure 5A–F).
Hysteresis loops of almost all dissolved elements exhibited clockwise trajectories, except for HCO3, Ca2+, whose trajectories were counterclockwise. The loops were relatively higher in magnitude (mean HI > 0.4), except for Ca2+ (Figure 5A) and DOC (Figure 5F), whose HI tended to zero. DOC also exhibited a form in eight increasing the HI at high discharge (the embedded figure in Figure 5F), suggesting a source of DOC mobilized during flood events and a regulation by a transport-limited regime. In addition, the DOC revealed a clear upward trend in the ascending limb, while Ca2+, HCO3, Mg2+ and K+ (Figure 5A,C) also showed an increasing trend but with a less-pronounced slope. The enrichment in K+ could be due to of cation exchange in soils and to its high availability within the biomass [27]. The quick transport of ions suggested a piston effect of more concentrated water, which is afterwards diluted as the discharge increases [28].
During the rising limb of the flood event, the NO3 exhibits a chemostatic behavior because the leaching of the fir and beech forest, a quick access source of NO3, would compensate the sudden increase in discharge [15]. Conversely, the rest of dissolved elements, mainly SO42−, displayed a downward trend in the ascending limb. Na+ exceeded Cl (Figure 4C), their small gap can be related to an additional source besides the atmosphere, such as the weathering of silicate rocks located at the lower southern section. It is reinforced by the similarity of the hysteresis pattern between SiO2 and Na+ (Figure 5D). Regarding the falling limb, Ca+ and HCO3 were the only ions with an upward trend until the end of the quick-response flow composed by the karst flow (Figure 3B and Figure 4A). The rapid mobilization of dissolved elements and the hydrological conditions (last flood of the hydrological year 2018–2019) deplete the reserves (such as the epikarst included in the subsurface flow) and hinder an immediate return to the initial conditions, in particular for source-limited elements such as SO42− (Figure 5B) [13,29].

4. Conclusions

This paper revealed chemodynamic and hysteresis behaviors of water chemistry in response to discharge variations in a karst forest catchment located in the French Pyrenees Mountains. Ca2+ and HCO3 exhibited an overall chemostatic behavior due to the rapid kinetic of carbonate dissolution with biogenic soil CO2, suggesting a control by process-limited regime. Additionally, Ca2+ and HCO3 are the only dissolved elements that increase during the quick-response flow mainly constituted by the karst flow contribution. The fast mobilization and the antecedent hydrological conditions deplete the epikarst (included in the subsurface flow) reserves of dissolved elements and delay a quick return to the initial conditions. The chemodynamic response of SO42− displayed a strong rainwater dilution as the discharge increases, linked to slower outputs and/or reduced amount sources. The hysteresis analysis revealed clockwise trajectories for most of the ions, except for HCO3 and Ca2+, suggesting an initial piston effect of more concentrated water in the basin, which is then diluted with the increase in discharge. Conversely, DOC exhibited a form in eight with a general increase with increasing discharge, suggesting (i) a source of DOC mobilized during flood events, most likely from the surface of soils (plant litter), and (ii) a regulation by a transport-limited regime. This research revealed the importance of the high resolution hydrochemical survey in the karst systems, whose biogeochemical dynamic plays a key role in the global carbon cycle in this karstic catchment. Further in-depth research will be necessary to understand the dynamics of the water–carbon mechanisms in the critical zone to develop robust predictive models.

Author Contributions

Conceptualization, F.U.-C., A.P. and J.-L.P.; methodology, F.U.-C., A.P. and J.-L.P.; validation, F.U.-C., A.P. and J.-L.P.; formal analysis, F.U.-C.; investigation, F.U.-C., A.P. and J.-L.P.; resources, F.U.-C. and V.D.-S.; data curation, F.U.-C.; writing—original draft preparation, F.U.-C.; writing—review and editing, A.P. and J.-L.P.; visualization, F.U.-C.; supervision, A.P. and J.-L.P.; project administration, A.P. and J.-L.P.; funding acquisition, A.P. and J.-L.P. All authors have read and agreed to the published version of the manuscript.

Funding

This research was funded by the CNRS INSU through the IR OZCAR and the SNO KARST and by the CNRS-INEE through an annual allocation and through the LTSER platform ZA PYGAR.

Institutional Review Board Statement

Not applicable.

Informed Consent Statement

Not applicable.

Data Availability Statement

The data presented in this study are available on request from the corresponding author.

Acknowledgments

The authors are particularly grateful for the support from SNO KARST, OZCAR, CNRS INEE, INSU and Zone Atelier Pyrénées-Garonne (LTSER ZA PYGAR). The data of this research were collected and partly monitored under the initiative of the French KARST Observatory Network SNO KARST (www.sokarst.org) (accessed on 8 March 2022) initiative of the INSU/CNRS, whose purpose is to reinforce the exchange of knowledge and encourage interdisciplinary research on karst systems. The SNO Karst is also a member of the French Research Infrastructure OZCAR, the French network of Critical Zone Observatories. The analytical platforms of the Laboratory of Functional Ecology and Environment, PAPC (F. Julien, D. Lambrigot, and W. Amblas) and the chemical laboratory department of the GET (C. Causserand and P. Besson) make a significant contribution to the analytical work. F. Ulloa-Cedamanos’s PhD was financed by a fellowship from the French Ministry of Higher Education, Research and Innovation. Our special thanks go to those who assisted in the fieldwork or in the analytical work during a given period.

Conflicts of Interest

The authors declare no conflict of interest.

Abbreviations

The following abbreviations are used in this manuscript:
CZCritical Zone
Q Discharge
BC Baget Catchment
T Water Temperature
SC Specific Conductivity
DOC Dissolved Organic Carbon
CV Coefficient of Variation
DCR Discharge Change Rate
HI Hysteresis Index
RL Rising Limb
FL Falling Limb

References

  1. Bakalowicz, M. Epikarst. In Encyclopedia of Caves, 2nd ed.; Academic Press: Cambridge, MA, USA, 2012; pp. 284–288. [Google Scholar]
  2. Beaulieu, E.; Goddéris, Y.; Donnadieu, Y.; Labat, D.; Roelandt, C. High sensitivity of the continental-weathering carbon dioxide sink to future climate change. Nat. Clim. Change 2012, 2, 346–349. [Google Scholar] [CrossRef]
  3. Gaillardet, J.; Dupre, B.; Louvat, P.; Allegre, C.J. Global silicate weathering and CO2 consumption rates deduced from the chemistry of large rivers. Chem. Geol. 1999, 159, 3–30. [Google Scholar] [CrossRef]
  4. Amiotte-Suchet, P.; Probst, J.-L.; Ludwig, W. Worldwide distribution of continental rock lithology: Implications for the atmospheric/soil CO2 uptake by continental weathering and alkalinity river transport to the oceans. Glob. Biogeochem. Cycles 2003, 17. [Google Scholar] [CrossRef]
  5. Zeng, S.; Liu, Z.; Goldscheider, N.; Frank, S.; Goeppert, N.; Kaufmann, G.; Zeng, C.; Zeng, Q.; Sun, H. Comparisons on the effects of temperature, runoff, and land-cover on carbonate weathering in different karst catchments: Insights into the future global carbon cycle. Hydrogeol. J. 2021, 29, 331–345. [Google Scholar] [CrossRef]
  6. Bakalowicz, M. Contribution de la Géochimie des Eaux a la Connaissance de L’aquifère Karstique et de la Karstification. Ph.D. Thesis, Université Pierre et Marie Curie, Paris, France, 1979. [Google Scholar]
  7. Huang, X.; Fang, N.F.; Zhu, T.X.; Wang, L.; Shi, Z.H.; Hua, L. Hydrological response of a large-scale mountainous watershed to rainstorm spatial patterns and reforestation in subtropical China. Sci. Total Environ. 2018, 645, 1083–1093. [Google Scholar] [CrossRef]
  8. Musolff, A.; Schmidt, C.; Selle, B.; Fleckenstein, J.H. Catchment controls on solute export. Adv. Water Resour. 2015, 86, 133–146. [Google Scholar] [CrossRef]
  9. Williams, G.P. Sediment concentration versus water discharge during single hydro- logic events in rivers. J. Hydrol. 1989, 111, 89–106. [Google Scholar] [CrossRef]
  10. Evans, C.; Davies, T.D. Causes of concentration/discharge hysteresis and its potential as a tool for analysis of episode hydrochemistry. Water Resour. Res. 1998, 34, 129–137. [Google Scholar] [CrossRef]
  11. Darwiche-Criado, N.; Comín, F.A.; Sorando, R.; Sánchez-Pérez, J.M. Seasonal variability of NO3 mobilization during flood events in a Mediterranean catchment: The influence of intensive agricultural irrigation. Agric. Ecosyst. Environ. 2015, 200, 208–218. [Google Scholar] [CrossRef]
  12. Baker, E.B.; Showers, W.J. Hysteresis analysis of nitrate dynamics in the Neuse River, NC. Sci. Total Environ. 2019, 652, 889–899. [Google Scholar] [CrossRef]
  13. Qin, C.; Li, S.-L.; Waldron, S.; Yue, F.-J.; Wang, Z.-J.; Zhong, J.; Ding, H.; Liu, C.-Q. High-frequency monitoring reveals how hydrochemistry and dissolved carbon respond to rainstorms at a karstic critical zone, Southwestern China. Sci. Total Environ. 2020, 714, 136833. [Google Scholar] [CrossRef] [PubMed]
  14. Johnson, F.A.; East, J.W. Cyclical relationships between river discharge and chemical concentrations during flood events. J. Hydrol. 1982, 57, 93–106. [Google Scholar] [CrossRef]
  15. Ulloa-Cedamanos, F.; Probst, J.-L.; Binet, S.; Camboulive, T.; Payre-Suc, V.; Pautot, C.; Bakalowicz, M.; Beranger, S.; Probst, A. A Forty-Year Karstic Critical Zone Survey (Baget Catchment, Pyrenees-France): Lithologic and Hydroclimatic Controls on Seasonal and Inter-Annual Variations of Stream Water Chemical Composition, pCO2, and Carbonate Equilibrium. Water 2020, 12, 1227. [Google Scholar] [CrossRef]
  16. Probst, J.-L. Hydrologie du Bassin de la Garonne. Modèle de Mélanges. Bilan de L’érosion. Exportation des Phosphates et des Nitrates. Ph.D. Thesis, Toulouse III, Toulouse, France, 1983. [Google Scholar]
  17. Probst, J.-L. Nitrogen and phosphorous exportation in the Garonne basin (France). Hydrology 1985, 76, 281–305. [Google Scholar] [CrossRef]
  18. Probst, J.-L. Dissolved and suspended matter transported by the Girou River (France): Mechanical and chemical erosion rates in a calcareous molasse basin. Hydrol. Sci. J. 1986, 31, 61–79. [Google Scholar]
  19. Maillet, E. Essai D’hydraulique Souterraine et Fluviale; Libraire Sci. A. Herman: Paris, France, 1905. [Google Scholar]
  20. Dewandel, B.; Lachassagne, P.; Bakalowicz, M.; Weng, P.; Al-Malki, A. Evaluation of aquifer thickness by analysing recession hydrographs. Application to the Oman ophiolite hard-rock aquifer. J. Hydrol. 2003, 274, 248–269. [Google Scholar] [CrossRef]
  21. Godesy, S.E.; Kirchner, J.W.; Clow, D.W. Concentration–discharge relationships reflect chemostatic characteristics of US catchments. Hydrol. Process. 2009, 23, 1844–1864. [Google Scholar] [CrossRef]
  22. Clow, D.W.; Mast, M.A. Mechanisms for chemostatic behavior in catchments: Implications for CO2 consumption by mineral weathering. Chem. Geol. 2010, 269, 40–51. [Google Scholar] [CrossRef]
  23. Monnin, C.; Tamborski, J.; Bejannin, S.; Souhaut, M.; Rogues, M.; Olivier, P.; van Beek, P. Freshening of a Coastal Karst Aquifer Revealed by the Temporal Changes in a Spring Water Composition (La Palme, Southern France). Hydrology 2019, 6, 17. [Google Scholar] [CrossRef]
  24. El Azzi, D.; Probst, J.L.; Teisserenc, R.; Merlina, G.; Baque, D.; Julien, F.; Guiresse, M. Trace element and pesticide dynamics during a flood event in the save agriculture watershed: Soil-river transfer pathways and controlling factors. Water Air Soil Pollut. 2016, 227, 227–442. [Google Scholar] [CrossRef]
  25. Lloyd, C.E.; Freer, J.E.; Johnes, P.J.; Collins, A.L. Using hysteresis analysis of high- resolution water quality monitoring data, including uncertainty, to infer controls on nutrient and sediment transfer in catchments. Sci. Total Environ. 2016, 543, 388–404. [Google Scholar] [CrossRef] [PubMed]
  26. Lloyd, C.E.M.; Freer, J.E.; Johnes, P.J.; Collins, A.L. Technical note: Testing an improved index for analysing storm discharge-concentration hysteresis. Hydrol. Earth Syst. Sci. 2016, 20, 625–632. [Google Scholar] [CrossRef]
  27. Boy, J.; Valarezo, C.; Wilcke, W. Water flow paths in soil control element exports in an Andean tropical montane forest. Eur. J. Soil Sci. 2008, 59, 1209–1227. [Google Scholar] [CrossRef]
  28. Ulloa-Cedamanos, F.; Probst, A.; Dos-Santos, V.; Camboulive, T.; Granouillac, F.; Probst, J.-L. Stream Hydrochemical Response to Flood Events in a Multi-Lithological Karstic Catchment from the Pyrenees Mountains (SW France). Water 2021, 13, 1818. [Google Scholar] [CrossRef]
  29. Ulloa-Cedamanos, F.; Probst, A.; Moussa, I.; Probst, J.-L. Chemical weathering and CO2 consumption in a multi-lithological karstic critical zone: Long term hydrochemical trends and isotopic survey. Chem. Geol. 2021, 585, 120567. [Google Scholar] [CrossRef]
Figure 1. Location and relief of the Baget catchment with contour lines (modified from Ulloa-Cedamanos et al. [15]).
Environsciproc 07 00009 g001
Figure 2. Temporal series of stream discharge (blue line), temperature (yellow line) and sampling periods (black points) for physicochemical analyses over 2 hydrological years, from October 2018 to May 2020. The numbers circled refer to the different major floods during the study period.
Environsciproc 07 00009 g002
Figure 3. Hydrograph separation ((A) in logarithmic scale and (B) in normal scale) of flood event No. 3 with the respective recession coefficients (αq, αs, αb, corresponding to t in days, see Equation (2)) for the respective flow components. The embedded small graph exhibits the relationship between the discharge of each flow component and the total discharge during the falling limb. The black points on the hydrograph (B) correspond to water sampling.
Environsciproc 07 00009 g003
Figure 4. Temporal series of discharge (Q, m3·s−1) and major element concentrations (A) Ca2+ and HCO3 in meq·L−1, (B) Mg2+ and SO42− in meq·L−1, (C) Na+, K+, NO3 and Cl in meq·L−1 and SiO2 in mmol·L−1) as well as for dissolved organic carbon ((D) DOC in mg·L−1) during the flood event No. 3.
Environsciproc 07 00009 g004
Figure 5. Normalized hysteresis loops for major elements: (A) for Ca2+ and HCO3, (B) SO42−, (C) Mg2+ and K+, (D) Si and Na+, (E) Cl and NO3 and, (F) DOC, during the flood event No. 3. Small plots show the hysteresis index (HI) vs. the normalized discharge for each element during the flood episode.
Environsciproc 07 00009 g005
Publisher’s Note: MDPI stays neutral with regard to jurisdictional claims in published maps and institutional affiliations.

